Intracellular complexities of acquiring a new enzymatic function revealed by mass-randomisation of active-site residues
- School of Biological Sciences, Victoria University of Wellington, Wellington, New Zealand
- Centre for Biodiscovery, Victoria University of Wellington, New Zealand
- Ferrier Institute, Victoria University of Wellington, New Zealand
Figures
Figure 1 with 1 supplement
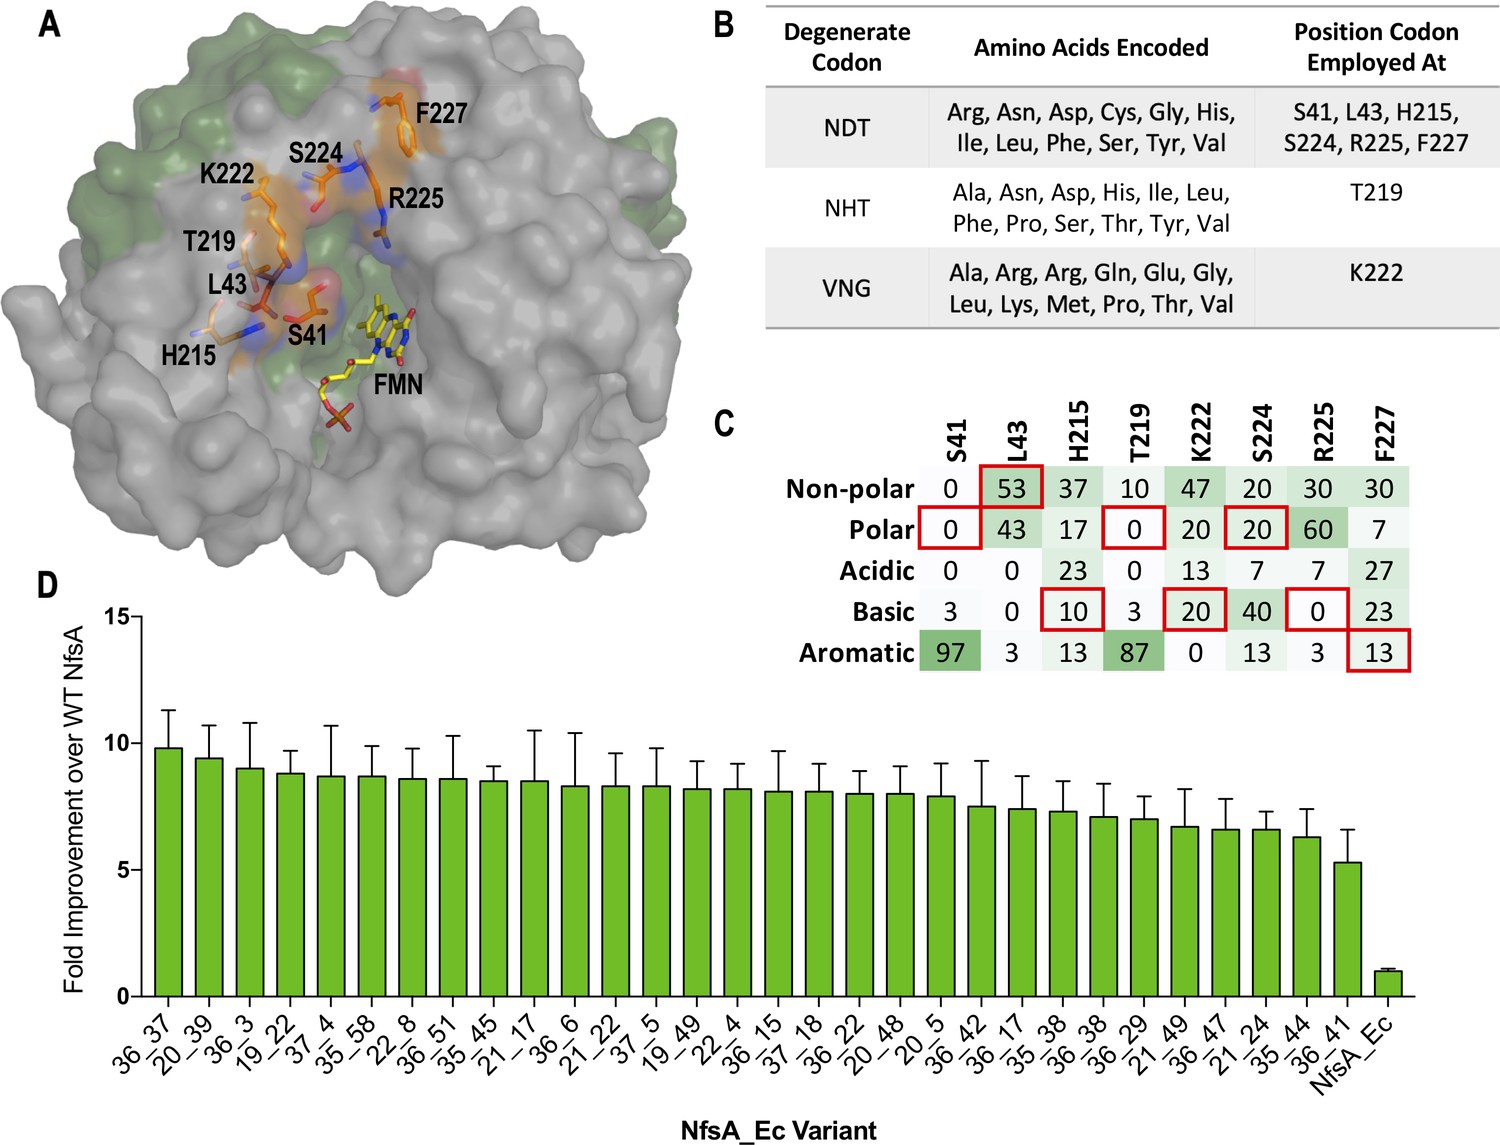
Creation, selection, and characterisation of 30 top chloramphenicol-detoxifying NfsA variants.
(A) Structure of NfsA, based on PDB 1f5v. One monomer is shown in grey and one monomer in green. The eight residues simultaneously targeted in NfsA (carbons highlighted in orange) and the FMN cofactor (carbons highlighted in yellow) are shown in stick form. For clarity, only one of the two FMN-binding active sites in the enzyme homodimer is portrayed. (B) Summary of the amino acid repertoire encoded by each degenerate codon. (C) Percentage of the five amino acid side-chain categories at each of the eight targeted positions for the top 30 chloramphenicol reducing variants (a complete summary of all residue substitutions is provided in Supplementary file 1a). The property of the native amino acid at each position is boxed in red. (D) Fold improvement in chloramphenicol EC50 values for E. coli 7NT strains expressing the top 30 chloramphenicol-detoxifying nfsA variants over the native nfsA control (far right). Data presented in D represents the average of at least four biological repeats ± 1 S.D.
-
Figure 1—source data 1
Source data for Figure 1.
- https://cdn.elifesciences.org/articles/59081/elife-59081-fig1-data1-v2.xlsx
Figure 1—figure supplement 1
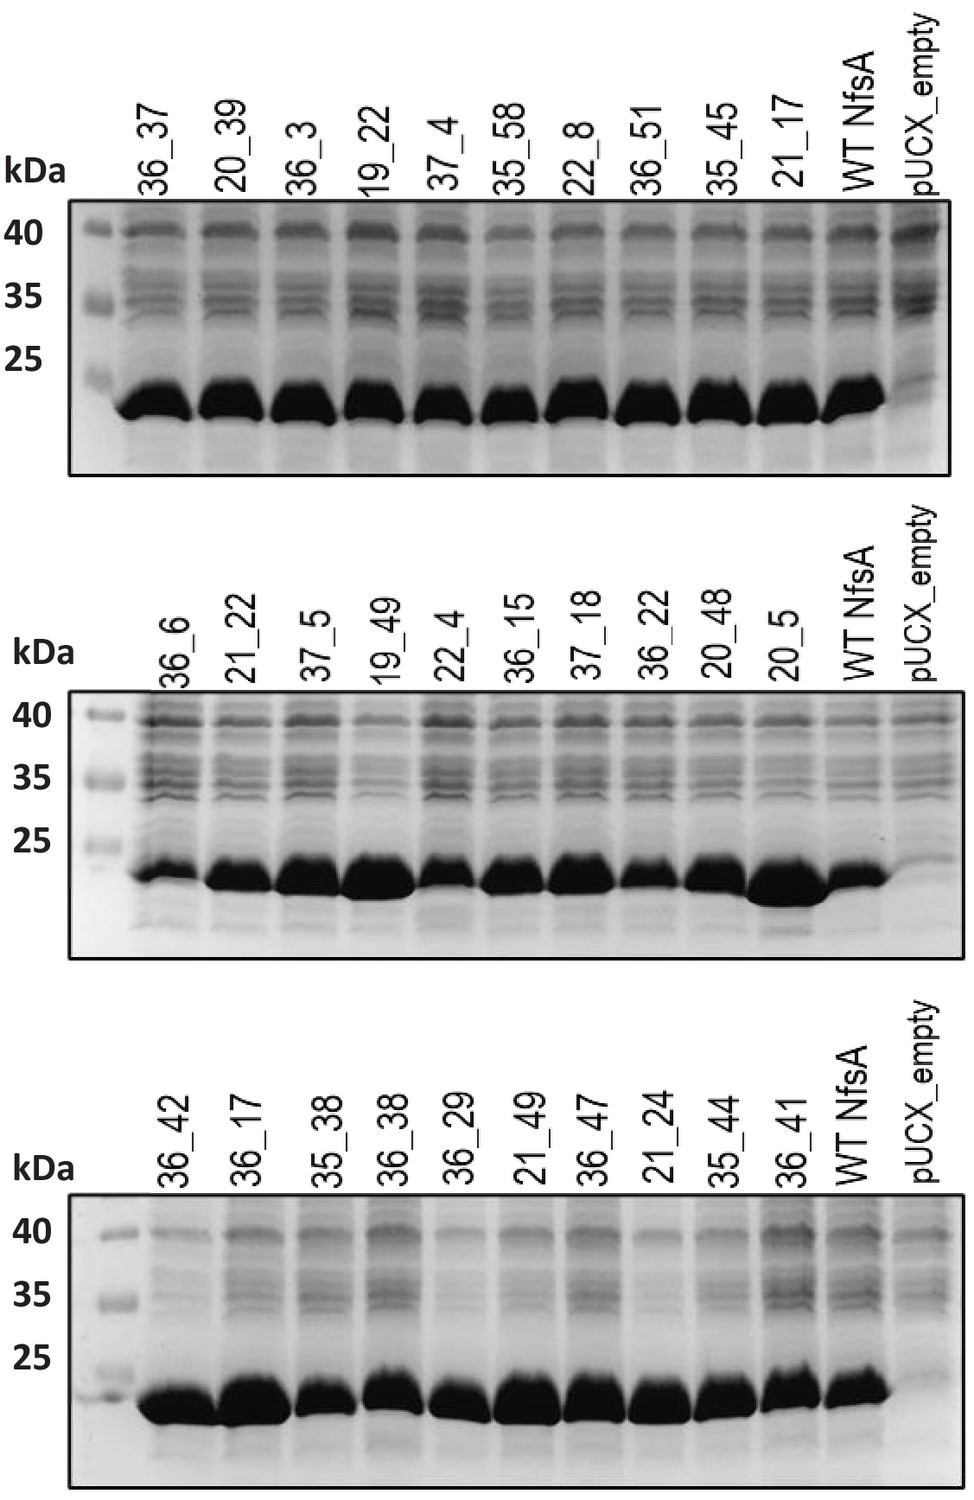
Relative enzyme expression levels for the top 30 chloramphenicol-detoxifying NfsA variants generated by multi-site saturation mutagenesis.
Overnight cultures of E. coli 7NT expressing pUCX::nfsA constructs were used to inoculate LB medium amended with 50 µM IPTG and incubated for 6.5 hr at 30°C. Samples were normalised based on cell density (OD600). Samples from E. coli strains expressing wild-type NfsA (WT NfsA) or bearing empty pUCX were included in the two right-most lanes of each gel as controls. The predicted molecular mass of WT NfsA is 26.8 kDa.
Figure 2 with 2 supplements

Recreating the hypothetical evolutionary trajectories of NfsA variants 36_37 and 20_39.
(A–C) Residues in the active site of 36_37 (A, blue), 20_39 (B, green) and wild-type NfsA (C, orange); based on PDB 1f5v (Kobori et al., 2001). In each panel, one NfsA monomer is shaded grey and the other is tan. The orientation of the mutated residues in 36_37 and 20_39 was predicted using the mutagenesis wizard on PyMOL, which selected the most likely rotamer conformation based on the frequencies of occurrence in proteins while avoiding clashes with other residues. (D–E) All 5040 hypothetical evolutionary trajectories of 36_37 (D) or 20_39 (E). Black lines represent primary paths in which each step resulted in a > 16% increase in chloramphenicol detoxification. Thick black lines represent the most probable stepwise evolutionary trajectory as explained in Figure F. The colour and diameter of nodes corresponds to the fold improvement in chloramphenicol detoxification over wild-type NfsA (blue/smaller = less active, red/larger = more active). A larger version of each image is provided in Figure 2—figure supplement 1 and Figure 2—figure supplement 2. (F) The most plausible stepwise evolutionary trajectory for each of variant 36_37 (blue) and variant 20_39 (green). To establish these, the substitution which resulted in the greatest improvement in chloramphenicol detoxification over wild-type NfsA (WT NfsA) was selected at each point in the hypothetical evolutionary progression. If no substitutions improved chloramphenicol detoxification, then the substitution was selected which resulted in the smallest decrease in activity (shown as a dotted black line in D-E). Data presented in (D-F) represent the average of at least four biological repeats ± 1 S.D.
-
Figure 2—source data 1
Source data for Figure 2.
- https://cdn.elifesciences.org/articles/59081/elife-59081-fig2-data1-v2.xlsx
Figure 2—figure supplement 1
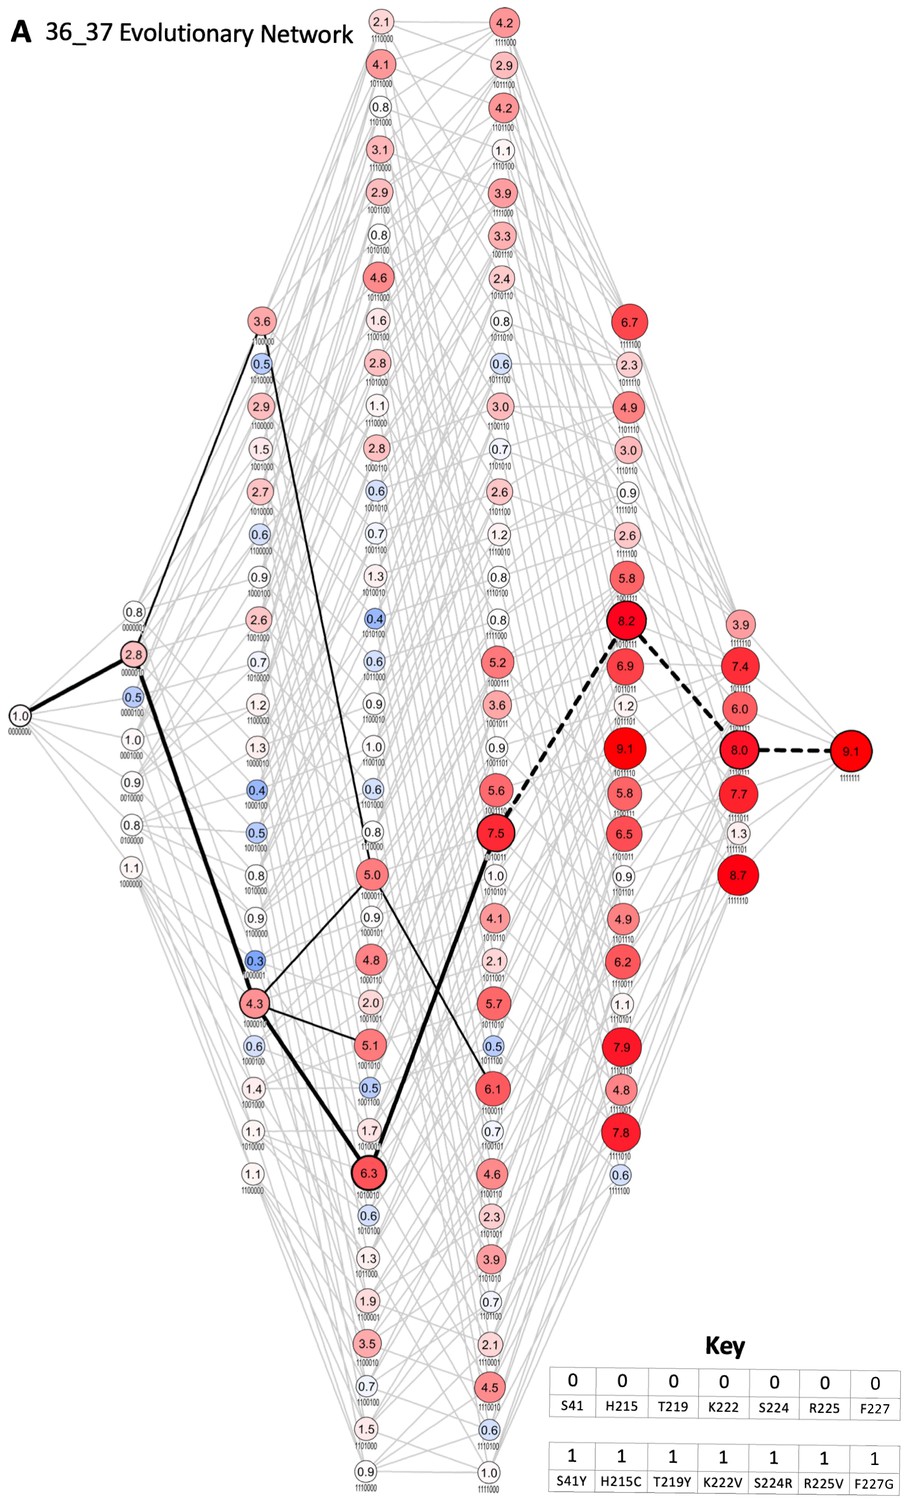
Evolutionary network of 36_37.
Each node represents an enzyme intermediate, with the substitutions present in the intermediate indicated by the presence (1) or absence (0) of the substitutions S41Y, H215C, T219Y, K222V, S224R, R225V, and F227G, respectively. The numbers within each node represent the fold activity relative to wild-type NfsA measured in E. coli EC50 assays; to facilitate rapid evaluation, the fold-activity for each node is also represented by the area of the circle, and by a colour-code (progressively less activity than wild-type NfsA in brighter shades of blue, and progressively more activity than wild-type NfsA in brighter shades of red). All 5040 possible evolutionary trajectories are marked by grey connecting lines. If a substitution resulted in a ≥ 16% increase in activity, the edge connecting the two nodes is shown in black (16% being greater than the average error for each set of 128 intermediates). The most probable stepwise mutagenesis pathway (shown in Figure 2F) is shown as thick black lines. A dotted line indicates that a substitution did not result in a ≥ 16% increase in activity, but formed part of the most probable stepwise mutagenesis evolutionary trajectory.
Figure 2—figure supplement 2

Evolutionary network of 20_39.
Each node represents an enzyme intermediate, with the substitutions present in the intermediate indicated by the presence (1) or absence (0) of the substitutions S41Y, H215N, T219Y, K222R, S224Y, R225D, and F227H, respectively. The numbers within each node represent the fold activity relative to wild-type NfsA measured in E. coli EC50 assays; to facilitate rapid evaluation, the fold-activity for each node is also represented by the area of the circle, and by a colour-code (progressively less activity than wild-type NfsA in brighter shades of blue, and progressively more activity than wild-type NfsA in brighter shades of red). All 5040 possible evolutionary trajectories are marked by grey connecting lines. If a substitution resulted in a ≥ 16% increase in activity, the edge connecting the two nodes is shown in black (16% being greater than the average error for each set of 128 intermediates). The most probable stepwise mutagenesis pathway (shown in Figure 2F) is shown as thick black lines. A dotted line indicates that a substitution did not result in a ≥ 16% increase in activity, but formed part of the most probable stepwise mutagenesis evolutionary trajectory.
Figure 3
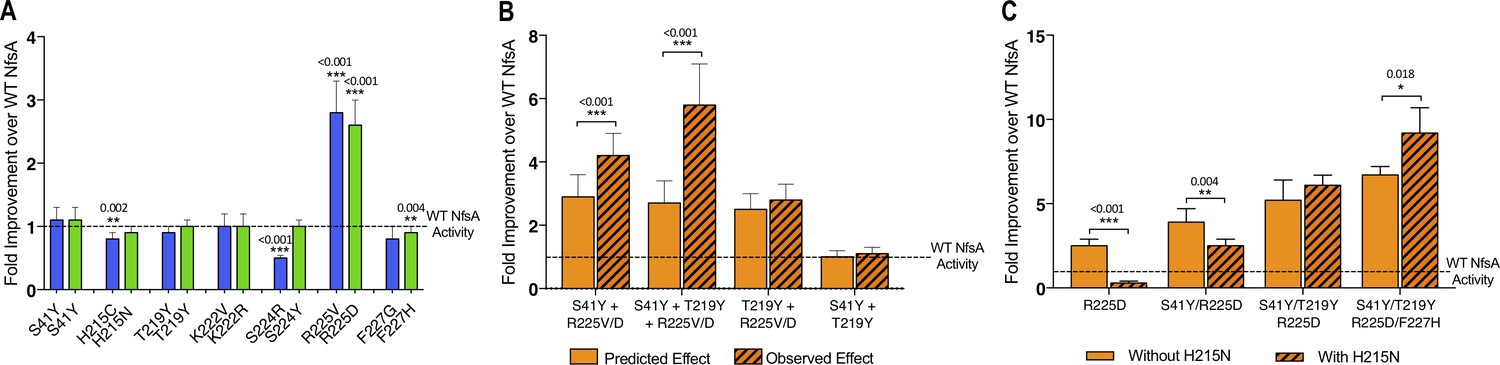
Complex epistatic interactions exist in 36-37 and 20_39.
(A) The effect on chloramphenicol detoxification of introducing individual substitutions present in 36_37 (blue) and 20_39 (green) into wild-type (WT) NfsA. (B) Observation of epistatic interactions between S41Y, T219Y and R225V/D. The predicted multiplicative effects (solid bars) were calculated by multiplying the fold-increase conferred by individual amino acid substitutions. The error of the predicted effects was derived using an error propagation equation (δR = R × where δX, δY, δZ is the error of EC50 values X, Y and Z and δR is the calculated error of the predicted effect (R)). Hashed bars reflect the experimentally measured effect of each combination of mutations tested. (C) The effect of recreating the most plausible evolutionary trajectory for 20_39 with (solid bars) or without (hashed bars) the addition of H215N. In all figures an unpaired t-test was used to determine whether there was a significant difference in chloramphenicol detoxification activity between two groups. (***, p ≤ 0.001; **, p ≤ 0.01; *, p ≤ 0.05). Data presented in all figures represent the average of at least four biological repeats ± 1 S.D.
-
Figure 3—source data 1
Source data for Figure 3.
- https://cdn.elifesciences.org/articles/59081/elife-59081-fig3-data1-v2.xlsx
Figure 4 with 2 supplements
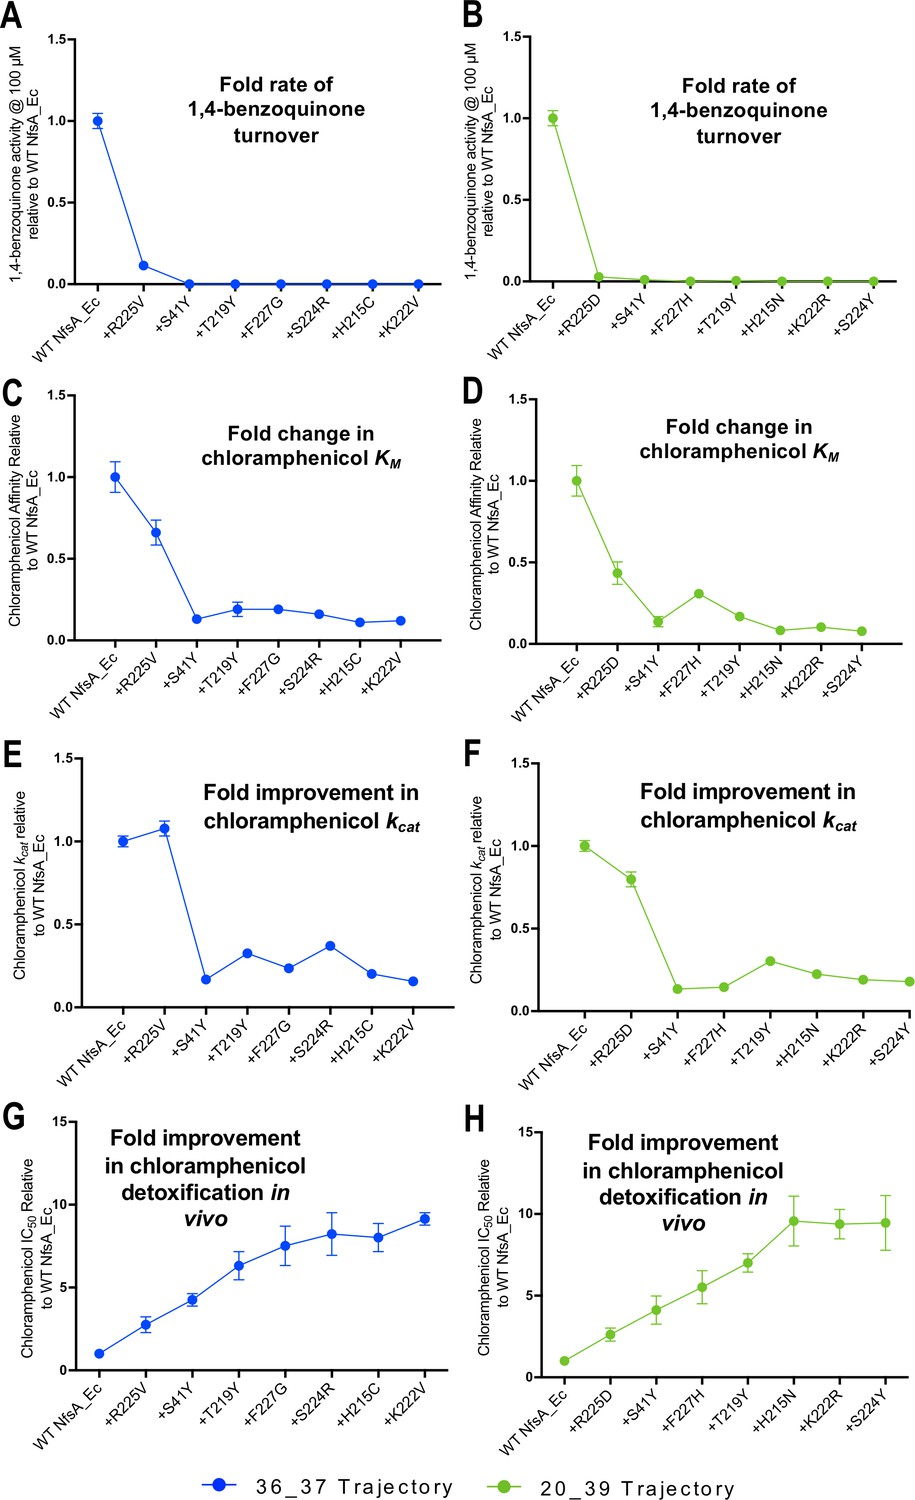
Activity analysis with 1,4-benzoquinone (A, B) and chloramphenicol (C–H) during the hypothetical evolutionary progression of 36_37 (left, blue) and 20_39 (right, green).
(A, B) Fold rate of turnover of 1,4-benzoquinone (starting concentration 100 µM, with 250 µM NADPH co-substrate) relative to wild-type NfsA for each intermediate variant of 36_37 (A) and 20_39 (B). (C, D) Fold change in chloramphenicol KM relative to wild-type NfsA for each intermediate of 36_37 (C) and 20_39 (D). (E, F) Fold increase in chloramphenicol kcat relative to wild-type NfsA for each intermediate of 36_37 (E) and 20_39 (F). (G, H) Fold improvement in chloramphenicol detoxification (EC50) conferred to E. coli 7NT host cells by each variant relative to wild-type NfsA, reproduced for convenience from Figure 2F. Full Michaelis-Menten kinetic parameters are shown in Supplementary file 1b, and the raw Michaelis-Menten curves are presented in Figure 4—figure supplement 1. All in vitro data presented is the average of three technical repeats ± 1 S.D. and all in vivo data presented in the average of at least four biological repeats ± 1 S.D.
-
Figure 4—source data 1
Source data for Figure 4.
- https://cdn.elifesciences.org/articles/59081/elife-59081-fig4-data1-v2.xlsx
Figure 4—figure supplement 1
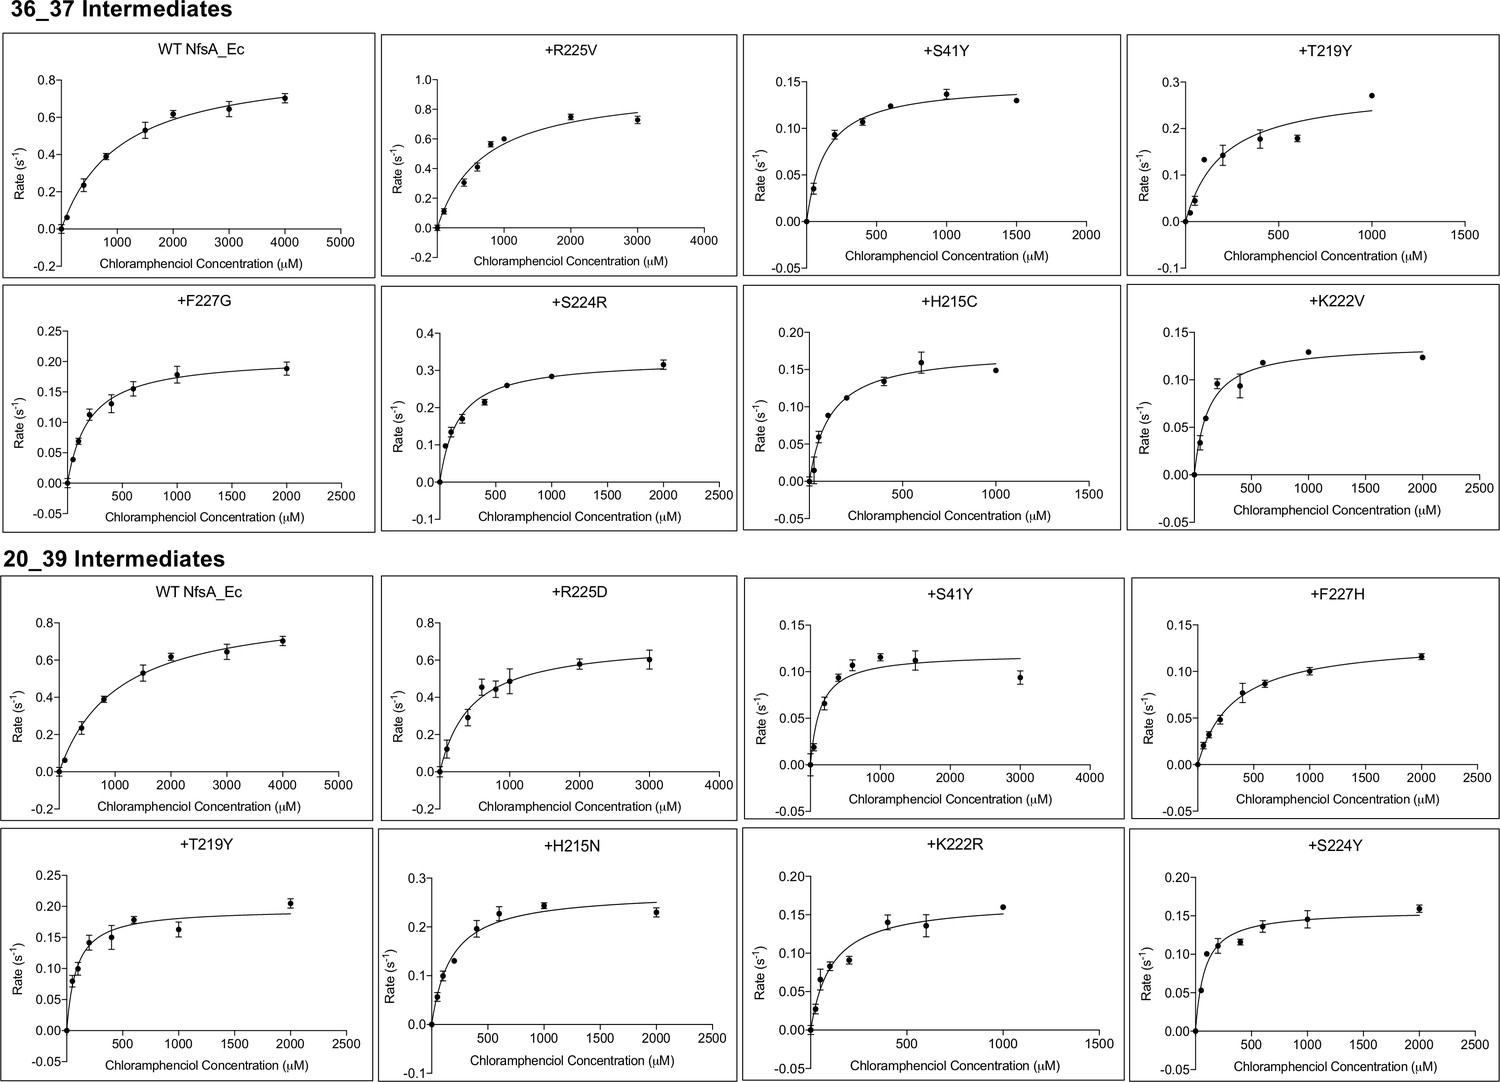
Michaelis-Menten plots of chloramphenicol reduction by NfsA enzyme intermediates derived from the most plausible hypothetical evolutionary trajectories for variants 36_37 and 20_39.
Variant nomenclature is as per Figure 2F, such that each variant is described in terms of the additional substitutions that it bears relative to the one previous, as read left-to-right, row-by-row (e.g. 20_39 variant +H215N represents wild-type NfsA bearing the additional substitutions R225D, S41Y, F227H, T219Y, H215N). Reduction rates at varying chloramphenicol concentrations were measured at a fixed concentration of NADPH (250 µM). Chloramphenicol reduction was indirectly measured by monitoring the depletion of NADPH at 340 nm. Rates were calculated based on an extinction coefficient of 12,400 M- 1cm−1, reflecting the requirement for consumption of two molecules of NADPH per chloramphenicol reduced to the hydroxylamine form. Data presented is the average of three technical replicates ±1 S.D. Michaelis-Menten plots were generated using Graphpad 8.0.
Figure 4—figure supplement 2
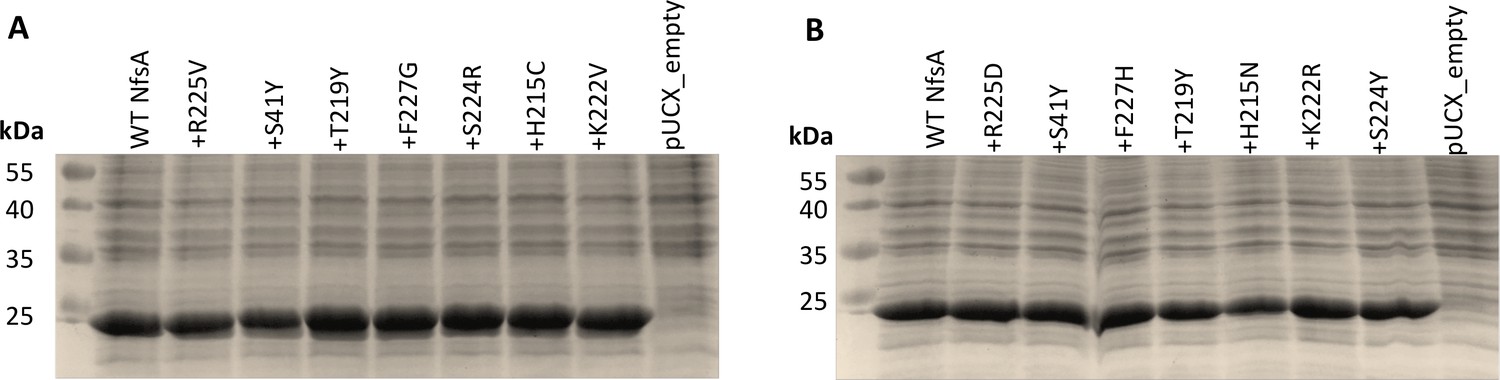
Relative enzyme expression levels for key intermediates from the most plausible hypothetical evolutionary trajectories for (A) 36_37 and (B) 20_39.
Overnight E. coli 7NT cultures expressing pUCX::nfsA constructs were used to inoculate LB medium amended with 50 µM IPTG and incubated for 6.5 hr at 30°C. Samples were normalised based on cell density (OD600). On each gel, lysate from the cells expressing wild-type nfsA was loaded in the left-most lane relative to the markers, then the strain expressing the R225V/D mutant, then the S41Y R225V/D double mutant, and so on, as indicated by the labels denoting each successive substitution. An E. coli strain bearing empty pUCX was included in the right-most lane of each gel as a negative control. The predicted molecular mass of NfsA is 26.8 kDa.
Figure 5 with 1 supplement
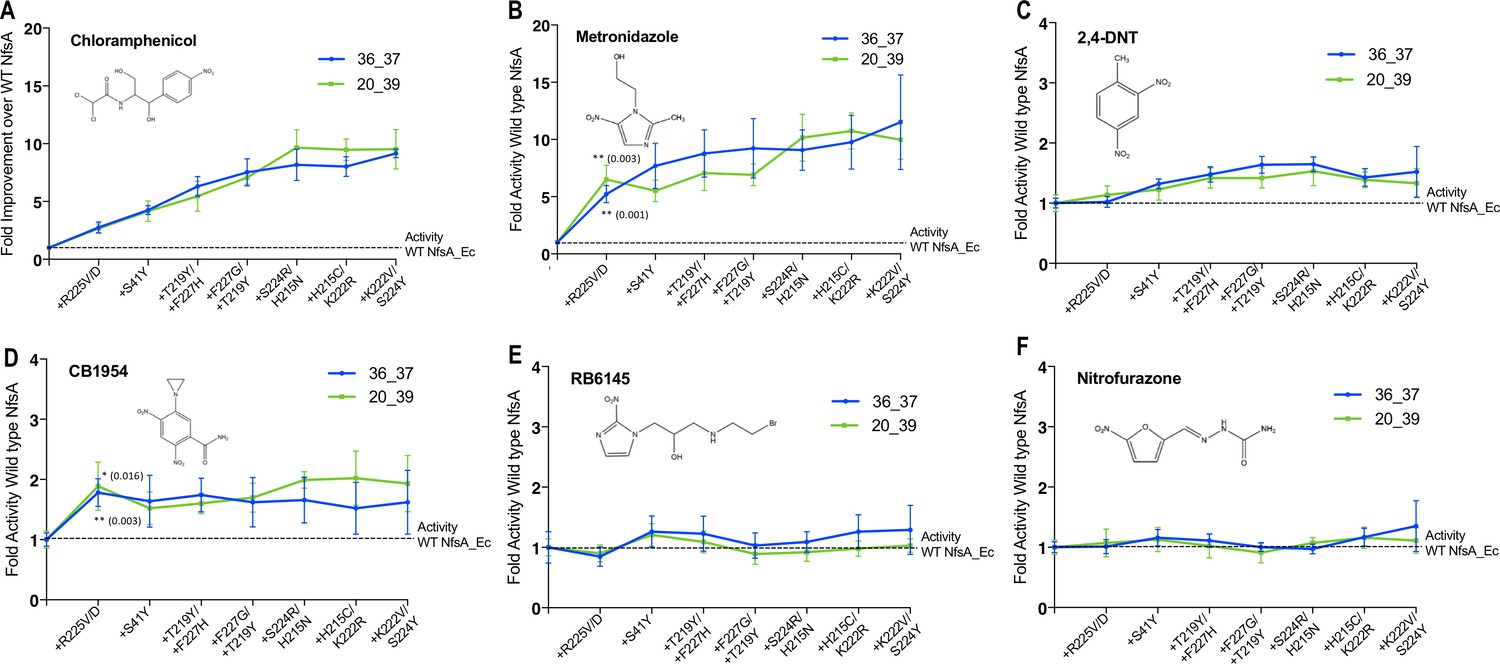
Activity analysis with nitroaromatic prodrugs during the hypothetical evolutionary progression of 36_37 (blue) and 20_39 (green).
E. coli 7NT cells expressing each of the hypothetical intermediate variants of 36_37 and 20_39 were tested in EC50 growth assays for (A) resistance to chloramphenicol; and (B–F) sensitivity to metronidazole, 2,4-DNT, CB1954, RB6145 and nitrofurazone, respectively. Data is presented as the fold improvement relative to wild-type NfsA, from the average of four biological repeats ± 1 S.D. Chloramphenicol (A) and metronidazole (B) data are plotted on a different scale due to the large fold improvements in activity. Where substitution of R225 caused a significant improvement in prodrug activation (Student’s t-test), the p-value is noted in the figure panel (above the trendline for variant 20_39, and below for variant 36_37).
-
Figure 5—source data 1
Source data for Figure 5.
- https://cdn.elifesciences.org/articles/59081/elife-59081-fig5-data1-v2.xlsx
Figure 5—figure supplement 1

Growth of 36_37 and 20_39 on selective or counter-selective media.
An overnight culture of E. coli 7NT cells expressing 36_37 or 20_39 was added at a 1 in 100 dilution to a flask containing unamended LB. The culture was grown at 37°C 200 rpm for 1 hr and then an appropriate dilution was plated over LB agar plates amended with 10 µM metronidazole (MTZ) or 5 µM chloramphenicol (CM). The MTZ plate was incubated at 37°C for 16 hr, while the CM plate was incubated for 40 hr. Forty-seven colonies apiece from the MTZ and CM-containing plates, alongside a negative control (a colony of 7NT cells containing empty pUCX plasmid) were PCR screened with nfsA_Ec specific primers to diagnose presence or absence of the nfsA gene, and also streaked on LB agar media containing ampicillin (Amp) to provide a secondary indication of whether the plasmid bearing the nitroreductase gene was present.
Tables
Table 1
Kinetic parameters of chloramphenicol reduction and turnover rate of 1,4-benzoquinone for purified NfsA variants (the top five by in vivo EC50 ranking).
Apparent KM and kcat at 250 µM NADPH were calculated using Graphpad 8.0. Kinetic parameters could not be accurately determined for 1,4-benzoquinone for any of the selected variants; in an attempt to detect trace activities, the catalytic rate of 1,4-benzoquinone reduction was measured at a single high concentration of 1,4-benzoquinone (100 µM), with reactions initiated by addition of 250 µM NADPH. All reactions were measured in triplicate and errors are ±1 S.D. *Apparent kcat and KM as determined at 250 µM NADPH. **Measured rates following addition of 250 µM NADPH. ***N.D.=not detectable (<0.1 s−1).
| Variant | kcat (s−1)* | KM (µM)* | kcat/KM (M−1. s−1) | Fold Improvement over NfsA | Turnover rate of 100 1,4-benzoquinone (s−1)** |
|---|---|---|---|---|---|
| NfsA | 0.89 ± 0.03 | 1000 ± 100 | 860 ± 90 | 1.0 | 9.0 ± 0.5 |
| 36_37 | 0.14 ± 0.004 | 130 ± 20 | 1100 ± 200 | 1.3 | N.D.*** |
| 20_39 | 0.16 ± 0.004 | 80 ± 10 | 1900 ± 200 | 2.2 | N.D.*** |
| 36_3 | 0.11 ± 0.003 | 130 ± 10 | 850 ± 90 | 1.0 | N.D.*** |
| 37_4 | 0.09 ± 0.004 | 80 ± 20 | 1000 ± 200 | 1.2 | N.D.*** |
| 19_22 | 0.13 ± 0.003 | 90 ± 10 | 1500 ± 200 | 1.7 | N.D.*** |
-
Table 1—source data 1
Source data for Table 1.
- https://cdn.elifesciences.org/articles/59081/elife-59081-table1-data1-v2.xlsx
Additional files
-
Source data 1
Supplementary CAM growth inhibi.
- https://cdn.elifesciences.org/articles/59081/elife-59081-data1-v2.xlsx
-
Supplementary file 1
Supplementary files 1a-1f.
(a) Summary of substitutions present in the top 30 chloramphenicol-detoxifying variants generated by multi-site saturation mutagenesis. (b) Kinetic parameters of chloramphenicol reduction and turnover rate of 1,4-benzoquinone for intermediates from the most plausible hypothetical evolutionary trajectories for (A) 36_37 and (B) 20_39. Apparent KM and kcat were calculated using Graphpad 8.0. Kinetic parameters could not be accurately determined for 1,4-benzoquinone, therefore the catalytic rate of 1,4-benzoquinone reduction was measured at a single high concentration of 1,4-benzoquinone (100 µM) with reactions initiated by addition of 250 µM NADPH. All reactions were measured in triplicate and errors are ±1 S.D. In the left-most column, the terminology ‘+’ refers to an enzyme variant that has the same amino acid sequence as the variant in the row above, plus the one additional substitution indicated. For example, ‘+R225V’ describes a variant sharing an identical primary sequence to NfsA, with the additional substitution R225V. *Apparent kcat and KM as determined at 250 µM NADPH. **Measured rates following addition of 250 µM NADPH. ***N.D.=not detectable (change in OD340 <0.1 s−1). (c) Average fold improvement for all NfsA_Ec variants that either retained R225 or contained a R225V/D substitution. To calculate the average fold improvement of variants retaining R225, the fold improvement relative to wild-type NfsA_Ec of all 64 variants retaining R225 was averaged. To calculate the average fold improvement of variants with the R225V or R225D substitutions, the fold improvement relative to wild-type NfsA_Ec of all 64 variants containing either R225V (in 36_37 intermediates) or R225D (in 20_39 intermediates) was averaged. (d) Relative levels of chloramphenicol growth inhibition experienced by E. coli 7NT strains expressing the 50 unique nfsA variants generated by epPCR. Following transformation of E. coli 7NT cells with the epPCR library, plating on LB amended with 10 µM chloramphenicol, and random selection of 60 colonies, 50 unique variants (numbered from ep_1 to ep_50; ep for ‘error-prone PCR’) were identified by Sanger sequencing of the pUCX inserts. Fresh day cultures of each unique strain were incubated at 30°C, 200 rpm for 4 hr post-challenge with either a low (7.5 µM), medium (15 µM) or high (30 µM) concentration of chloramphenicol, and percentage growth inhibition was determined by calculating the relative increase in OD600 for challenged cultures relative to unchallenged replicates. (e) Summary of all encoded amino acid and nucleotide substitutions identified in the 50 unique nfsA variants obtained from the epPCR library following chloramphenicol selection. (f) Summary of all encoded amino acid and nucleotide substitutions identified in 20 randomly-chosen nfsA variants obtained from the epPCR library in the absence of chloramphenicol selection.
- https://cdn.elifesciences.org/articles/59081/elife-59081-supp1-v2.docx
-
Transparent reporting form
- https://cdn.elifesciences.org/articles/59081/elife-59081-transrepform-v2.docx
Download links
A two-part list of links to download the article, or parts of the article, in various formats.
Downloads (link to download the article as PDF)
Open citations (links to open the citations from this article in various online reference manager services)
Cite this article (links to download the citations from this article in formats compatible with various reference manager tools)
Intracellular complexities of acquiring a new enzymatic function revealed by mass-randomisation of active-site residues
eLife 9:e59081.
https://doi.org/10.7554/eLife.59081


