Metabolic but not transcriptional regulation by PKM2 is important for natural killer cell responses
- School of Biochemistry and Immunology, Trinity Biomedical Sciences Institute, Trinity College Dublin, Ireland
- Laboratory of Cancer Immunometabolism, National Cancer Institute, United States
- School of Pharmacy and Pharmaceutical Sciences, Trinity Biomedical Sciences Institute, Trinity College Dublin, Ireland
Figures
Figure 1 with 1 supplement
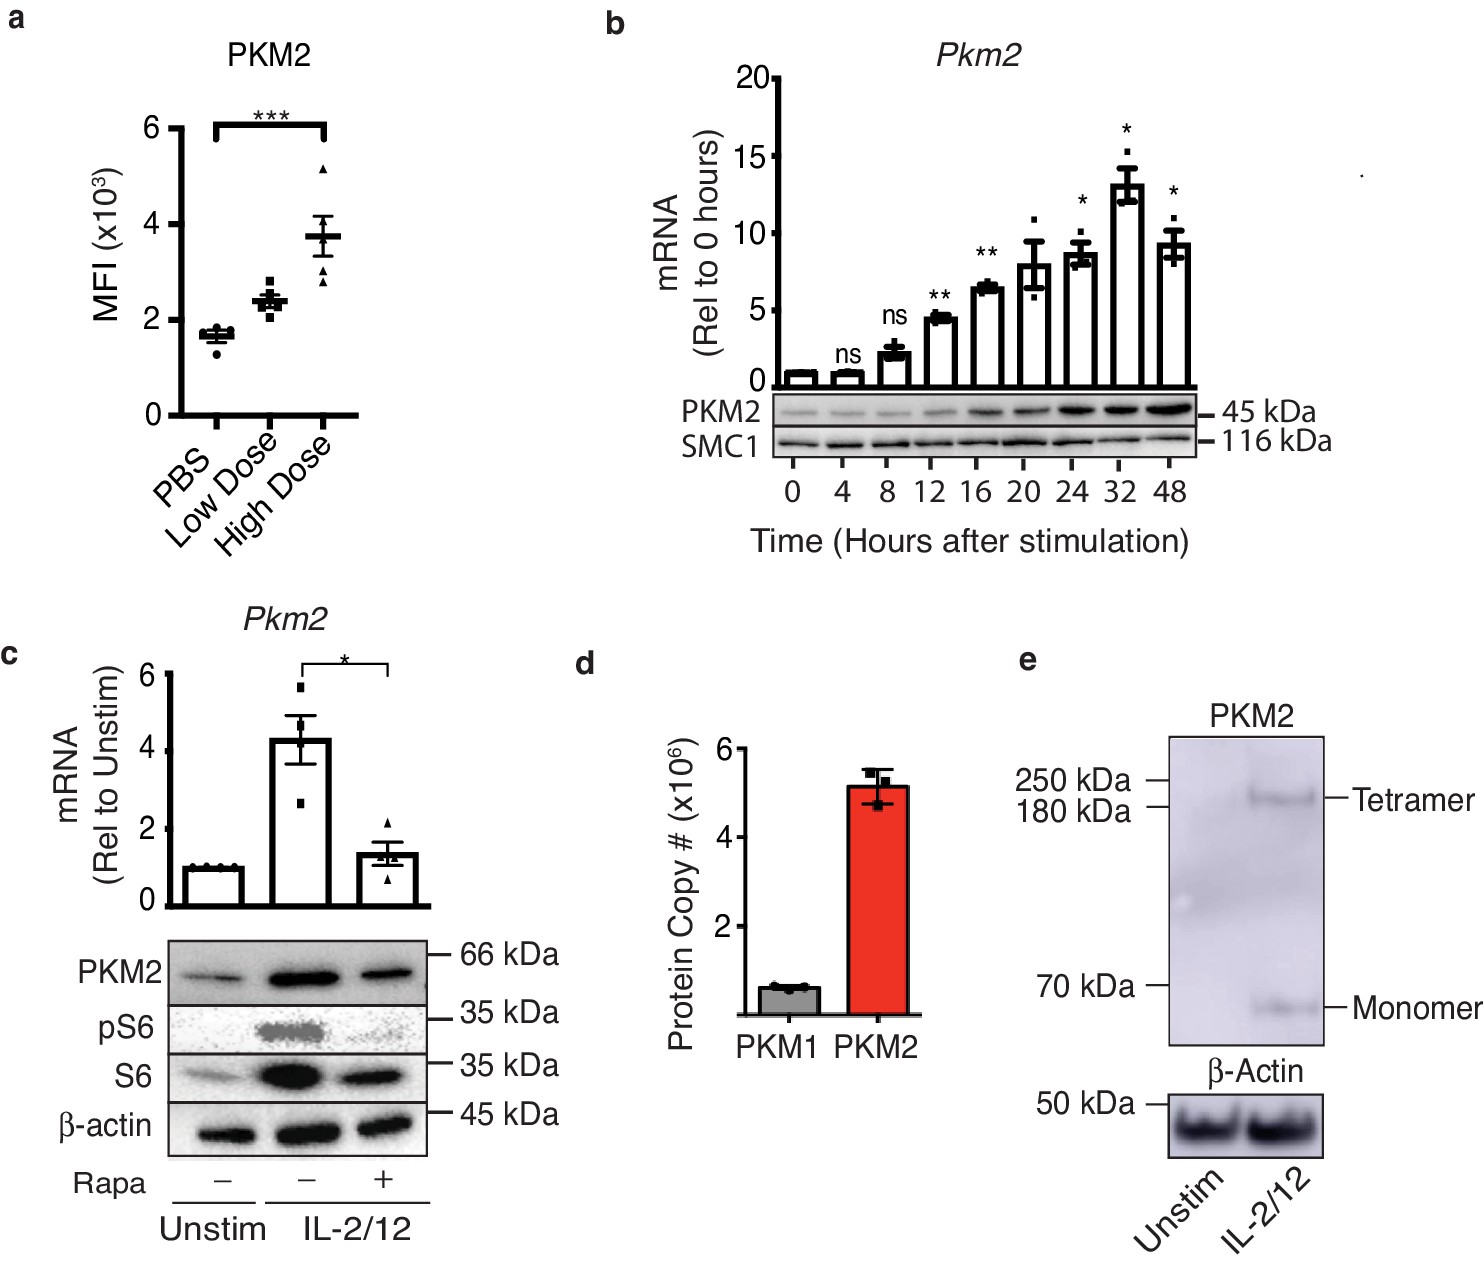
PKM2 is expressed and is the predominant PKM isoform in activated murine NK cells.
(a) Wildtype C57Bl/6 mice were injected with saline (100 μL), low-dose poly(I:C) (100 μg/100 μL) or high-dose poly(I:C) (200 μg/100 μL) I. P. Spleens were harvested 24 hr post-injection and PKM2 expression was analysed by intracellular flow cytometry in NK1.1+ NKp46+ cells (b) NK cell cultures were activated with IL-2/12 for 48 hr and cells were lysed for protein and mRNA. Samples were analysed by immunoblot for PKM2 and SMC1 protein expression. mRNA samples were subjected to qPCR analysis and Pkm2 expression over time was determined relative to time zero. Data was normalised to housekeeping gene Rplp0. (c) Cultured NK cells were stimulated for 18 hr in IL-2/12 +/- rapamycin. After 18 hr cells were harvested for protein and mRNA. Samples were analysed by immunoblot for PKM2, β-Actin, total S6 and pS6. mRNA samples were subjected to qPCR analysis for Pkm2 expression. Data was normalised to housekeeping gene Rplp0. (d) Levels of individual peptides for PKM1 and PKM2 were compared using quantitative proteomics. a Data are mean +/- S.E.M for 4–5 mice per group in two individual experiments. (b–e) Data were analysed using one-way ANOVA with Tukey post-test and are pooled or representative of three individual experiments. *p>0.05, **p>0.01, ***p>0.001.
Figure 1—figure supplement 1
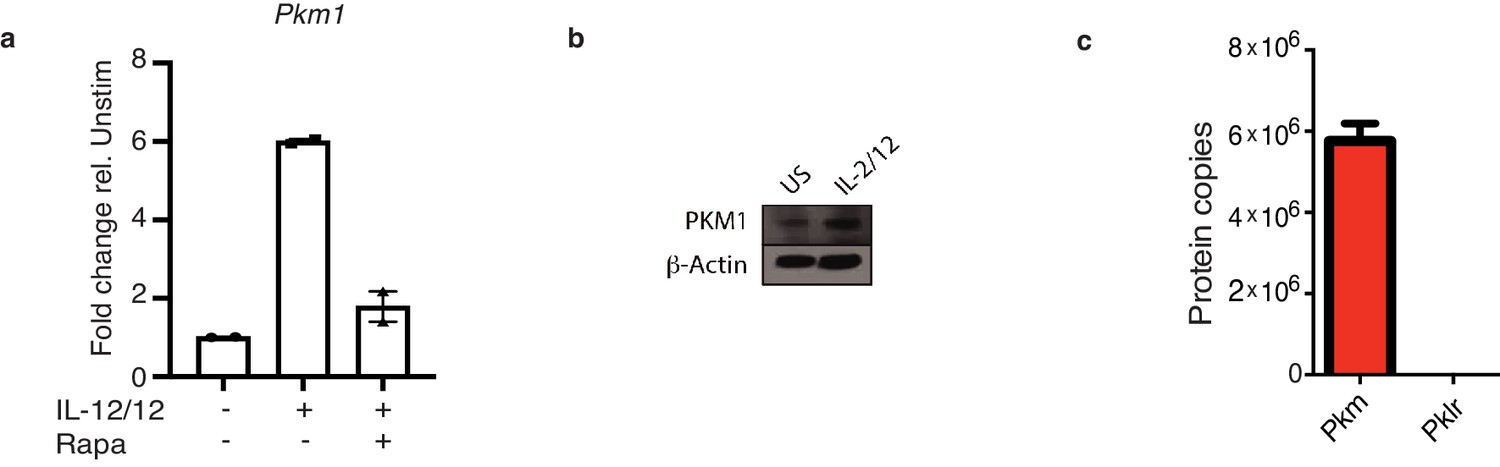
PKM1 expression is increased with IL-2/12 stimulation.
(a) Cultured NK cells were stimulated for 18 hr in IL-2/12 +/- rapamycin. After 18 hours cells were harvested for mRNA. mRNA samples were subjected to qPCR analysis for Pkm1 expression. Data was normalised to housekeeping gene Rplp0. (b) Cultured NK cells were stimulated for 18 hr in IL-2/12 or left unstimulated. After 18 hr cells were harvested for protein. Samples were analysed by immunoblot for PKM1 and β-Actin. (c) Levels of peptides for PKM and PKLR were compared using quantitative proteomics. a Data are mean +/- S.E.M and are pooled data from two experiments (b) western blot is representative of two individual experiments.
Figure 2

PKM2 is not required for IL-2/12 induced NK cell effector function in vitro.
(a) NK cells were sorted by flow cytometry (NK1.1+NKp46+CD3-CD49b+) from wildtype C57Bl/6, Pkm2fl/fl or Ncr1CrePkm2fl/fl mice. Cells were lysed and DNA was purified. DNA was subject to PCR amplification for the Pkm2 gene and products were electrophoresed on a 1.8% agarose gel and imaged. (b) Splenic Pkm2NK-WT and PKM2NK-KO NK cells were analysed by flow cytometry for the expression of CD11b and CD27. (c) Pkm2NK-WT and Pkm2NK-KO cells were isolated and counted and analysed by flow cytometry for frequency of NK1.1+NKp46+CD3- cells. (d) Splenic Pkm2NK-WT and Pkm2NK-WT cells were expanded for 6 days in IL-15 (15 ng/mL). Data displayed show total splenocyte numbers before expansion (pre) and pure NK cell numbers after magnetic purification (pure). (e–h) Pkm2WT and Pkm2KO NK cells were stimulated for 18 hr in IL-2/12 or left unstimulated. NK1.1+NKp46+CD3- cells were analysed for granzyme B (e–f) or IFNγ expression (g–h). (i–j) Pkm2NK-WT and Pkm2NK-KO cells were stimulated for 18 hr in IL-2/12 or left unstimulated and media supernatants were collected. Supernatants were then analysed for by cytometric bead array analysis for (i) IFNγ, IL-10, TNF, (j) MIP1α, MIP1β. (b–j) data are mean +/- S.E.M for n = 4–8 mice per group. (c) Data was analysed using a Students t test. (b, d-i) Data were analysed by two-way ANOVA with multiple comparisons. *p>0.05, **p>0.01, ***p>0.001.
Figure 3
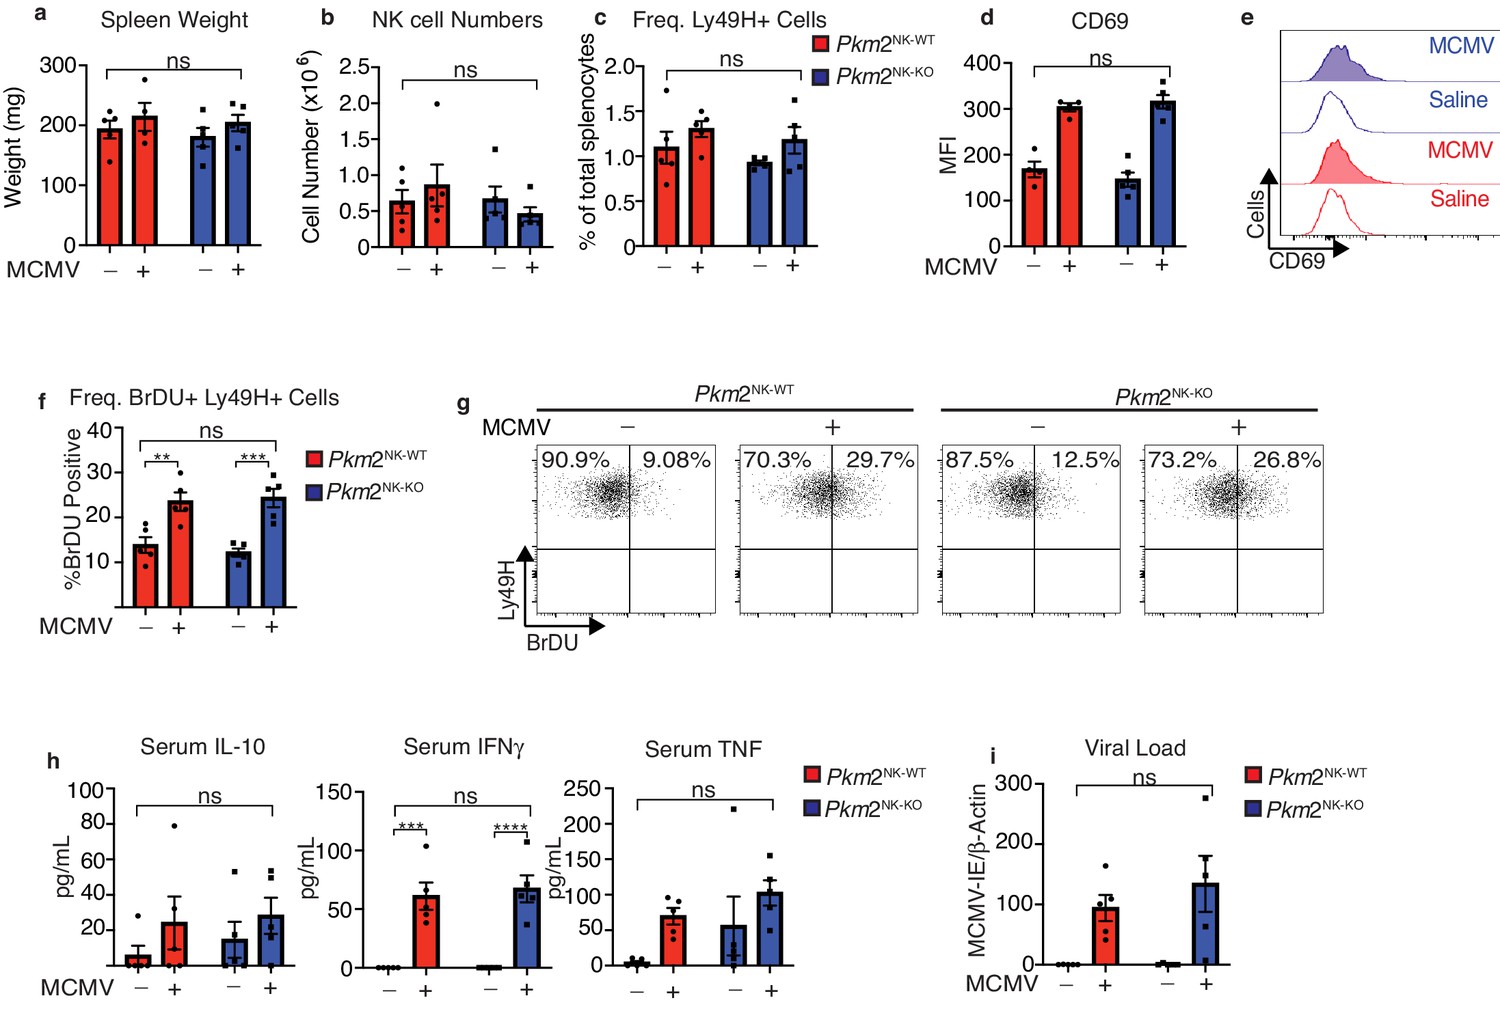
PKM2 is not required for early NK cell responses to MCMV.
Pkm2NK-WT and Pkm2NK-KO mice were infected with 1 × 10⁵ PFU of MCMV or injected with saline for 4 days. (a) Spleens were harvested from Pkm2NK-WT and Pkm2NK-KO mice 4 days post MCMV infection and weighed. (b) Spleens were harvested 4 days post-MCMV infection from Pkm2NK-WT and Pkm2NK-KO mice and NK cells were identified as being NK1.1+NKp46+CD3- by flow cytometry. (c) Ly49H-positive cells were assessed by flow cytometry and expressed as a percentage of total splenocytes (d-e) Splenic NK cells from Pkm2NK-WT and Pkm2NK-KO mice were identified post MCMV infection and assessed for CD69 expression by flow cytometry (f) Ly49H+ cells from MCMV infected Pkm2NK-WT and Pkm2NK-KO mice were assessed for BrDU incorporation 4 days post infection (g) Representative dot plot of BrDU incorporation into Ly49H+ cells 4 days post-MCMV infection. (h) Blood was drawn from Pkm2NK-WT and Pkm2NK-KO by cardiac puncture 4 days post-MCMV infection and serum was isolated. Serum was then analysed for levels of cytokines by cytometric bead array for IL-10, TNF and IFNγ. (i) Splenic viral load was measured using qPCR for MCMV-IE and DNA was normalised to β-Actin. n = 4–5 mice per group and are representative of two independent experiments. Data were analysed by two-way ANOVA with multiple comparisons. ns – not significant *p>0.05, **p>0.01, ***p>0.001.
Figure 4
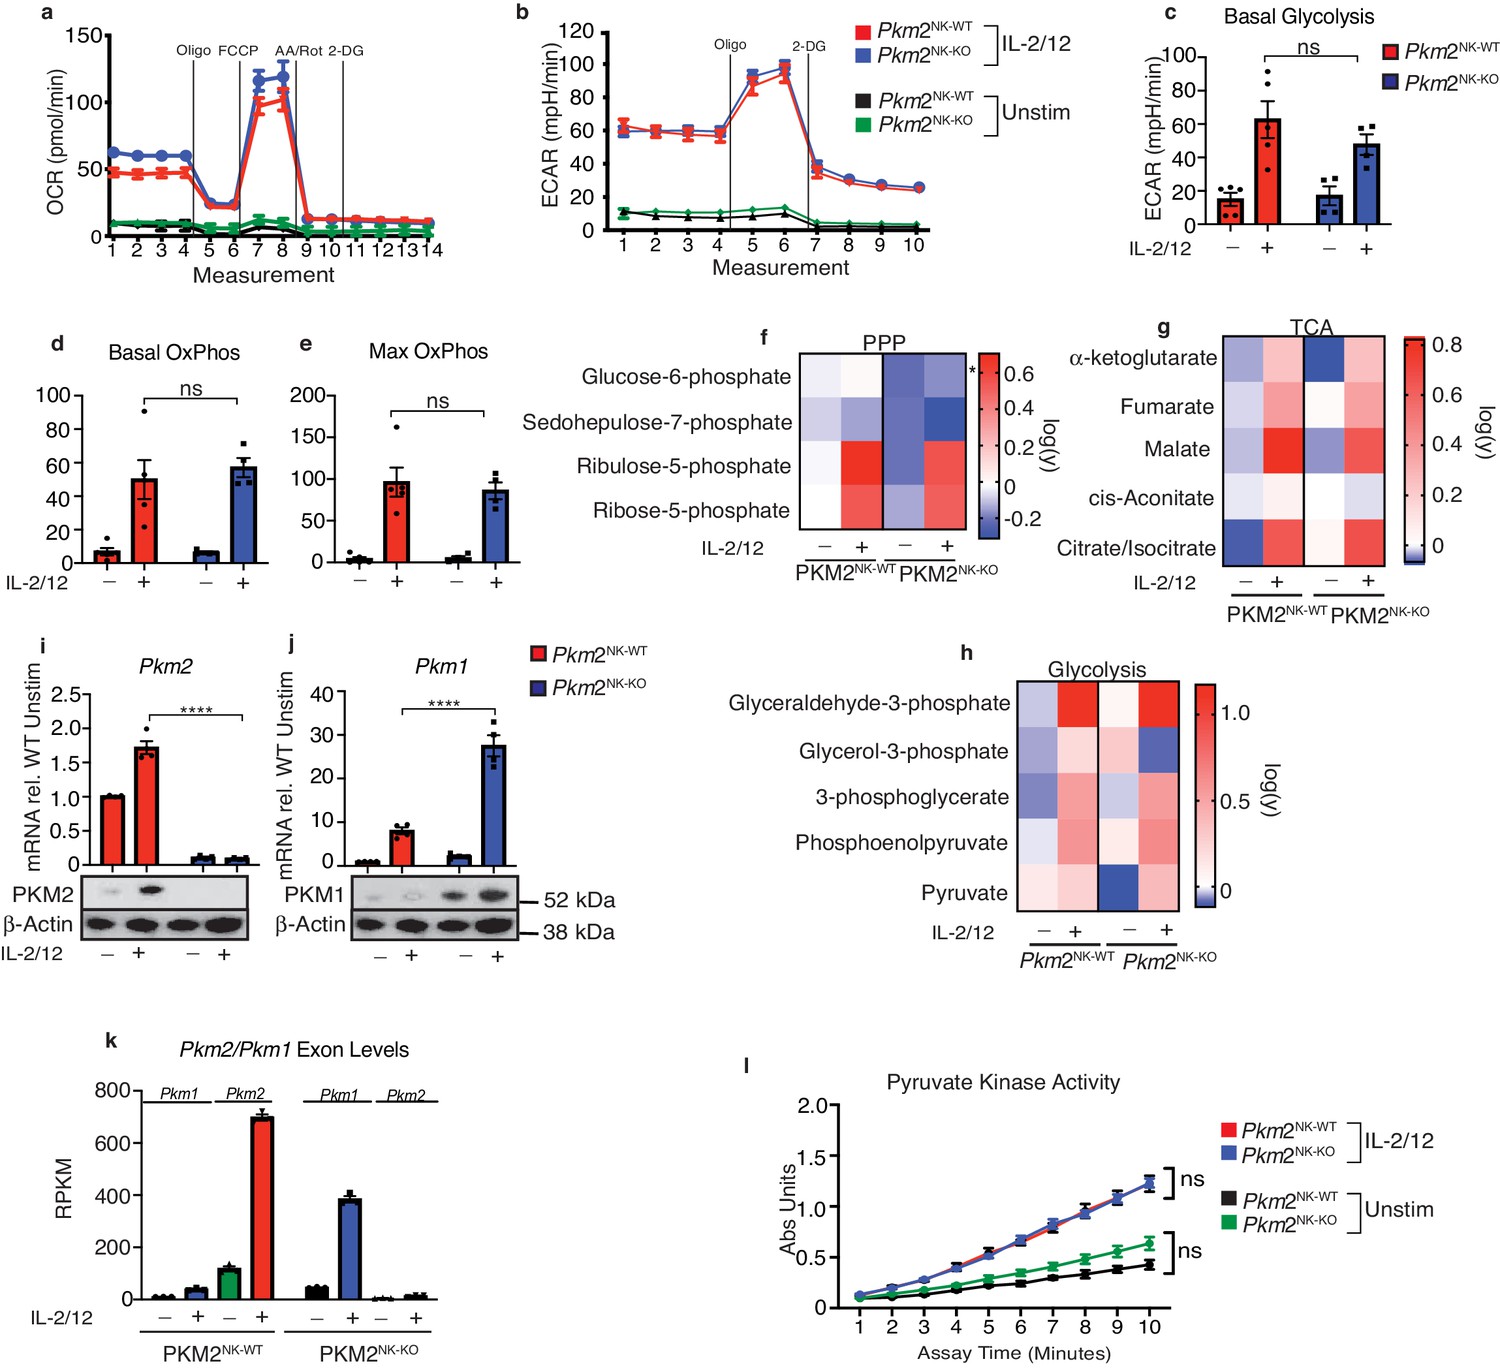
Transcriptional regulation of PKM1 can metabolically compensate for loss of PKM2.
(a) Pkm2NK-WT and Pkm2NK-KO splenocytes were cultured for 6 days in low-dose IL-15 and NK cells were magnetically purified. NK cells were then stimulated for 18 hr in IL-2/12 or left unstimulated. (a–e) Stimulated or unstimulated Pkm2NK-WT and Pkm2NK-KO cells were analysed by seahorse for glycolysis and oxphos (a) Pkm2NK-WT and Pkm2NK-KO cells were stimulated with (IL-2/12) or left unstimulated (low-dose IL-15) and oxygen consumption was measured over time. Data is representative OCR trace. (b) Bar graph of pooled data for basal rates of OxPhos. (c) Bar graph of maximum rates of OxPhos in Pkm2NK-WT and Pkm2NK-KO treated with IL-2/12 or left unstimulated (d) Pkm2NK-WT and Pkm2NK-KO cells were stimulated with (IL-2/12) or left unstimulated (low-dose IL-15) and extracellular acidification was measured over time. Data is representative ECAR trace. (f–h) Pkm2NK-WT and Pkm2NK-KO cells were stimulated with (IL-2/12) or left unstimulated (low-dose IL-15) and cells were analysed for relative metabolite abundance using LC-MS metabolomics. Peak areas were normalised to the average of Pkm2NK-WT unstimulated samples and then log(y) transformed using Graphpad Prism. (f) Data displayed are metabolites of the pentose phosphate pathway determined using LC-MS metabolomics. (g) Data displayed are a heat map for relative abundance of tricarboxylic cycle metabolites determined using LC-MS metabolomics. (h) Data displayed are a heat map for relative abundance of glycolytic metabolites determined using LC-MS metabolomics. (i) Pkm2NK-WT and Pkm2NK-KO cells were stimulated with (IL-2/12) or left unstimulated (low-dose IL-15) and cells were analysed by immunoblot or qPCR for the expression of PKM1 or PKM2. The same western blot was stripped and re-probed for PKM2 and the same loading control β-actin is pictured for both. qPCR data was normalised using the ΔΔCt method and HPRT housekeeping gene was used. (k) RNA sequencing for the quantity of transcripts encoding Pkm1 and Pkm2. (m) Pkm2NK-WT and Pkm2NK-KO cells were stimulated with (IL-2/12) or left unstimulated (low-dose IL-15) and cells were lysed and assessed using an absorbance based assay for total pyruvate kinase activity. n = 3–5 mice per group. Data are mean +/- S.E.M and were analysed by (a–h) two-way ANOVA with multiple comparisons or (i–j) one-way ANOVA with Tukey post-test. ns – not significant *p>0.05, **p>0.01, ***p>0.001.
Figure 5
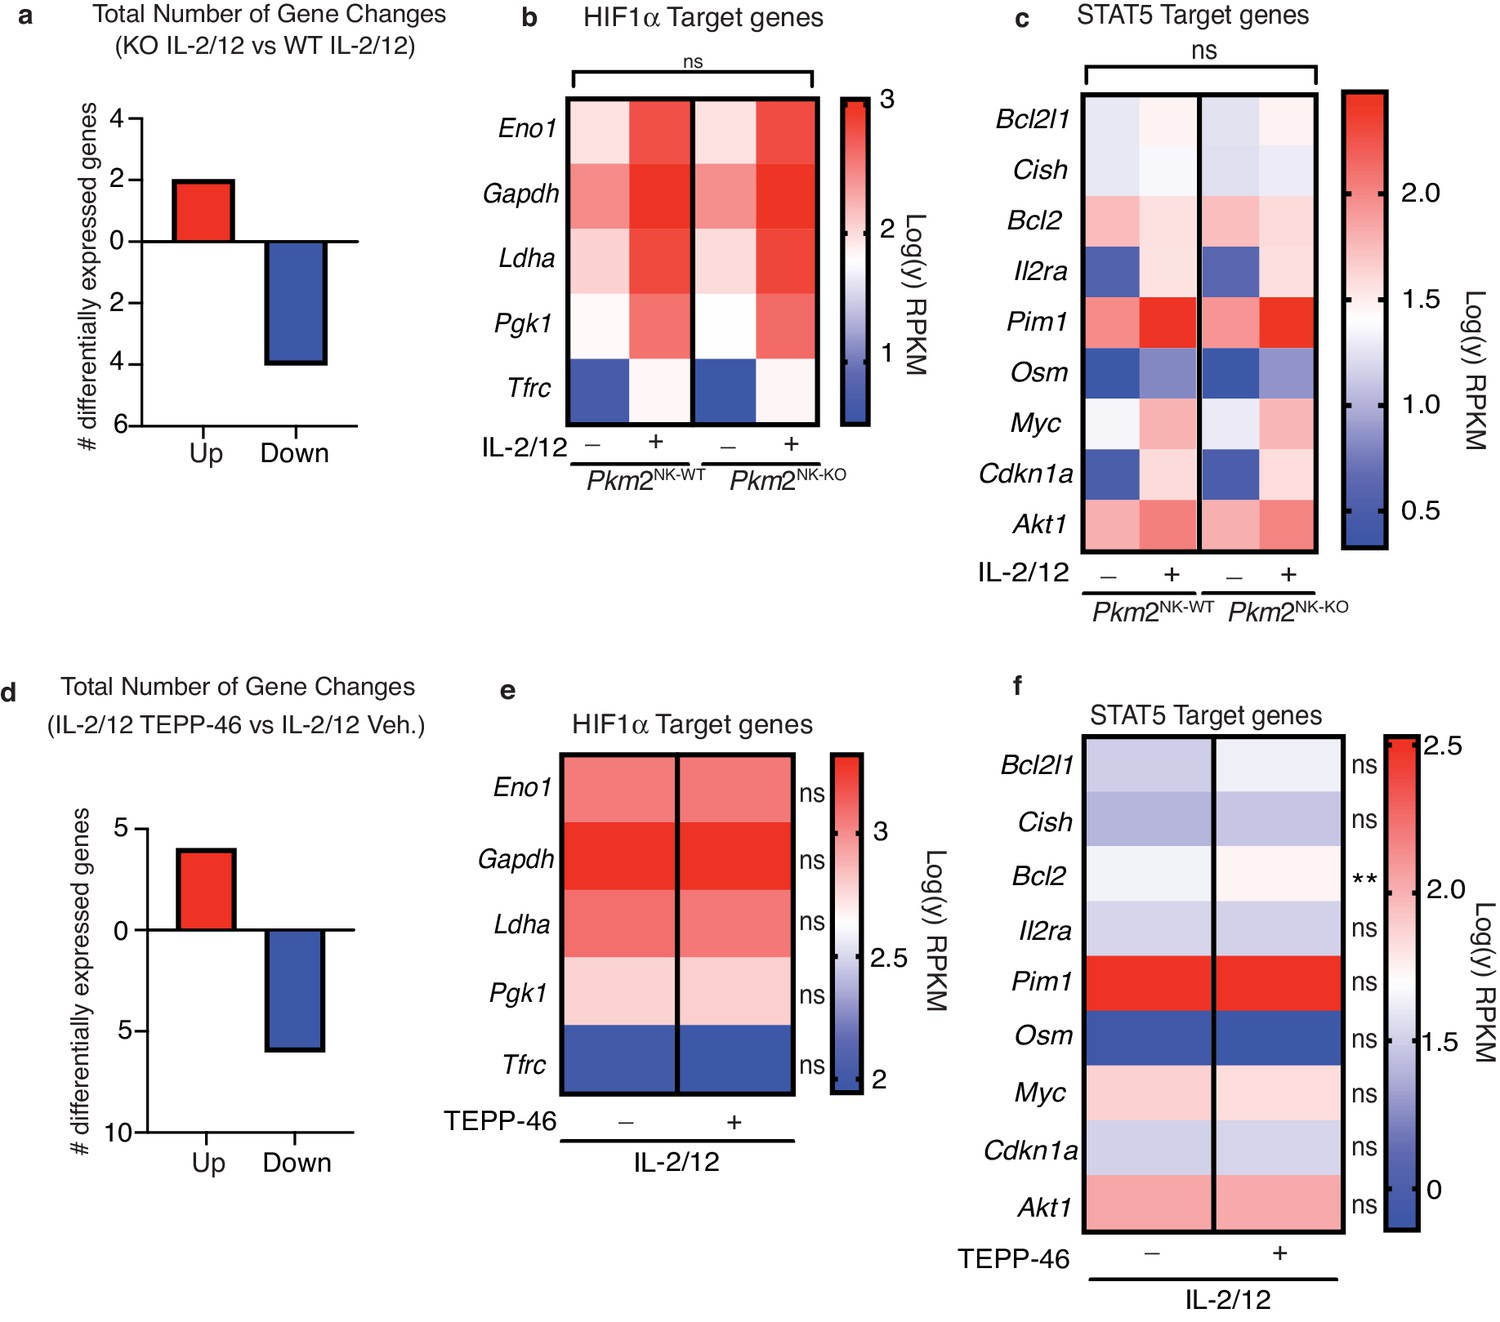
PKM2 is not required for transcription of HIF1α and STAT5α target genes in NK cells.
(a–c) Pkm2NK-WT and Pkm2NK-KO cultured and purified cells were stimulated with (IL-2/12) or left unstimulated (low-dose IL-15) for 18 hr. HiSeq RNA sequencing was then performed. (a) Differential gene expression analysis was carried out to assess total gene changes between IL-2/12 stimulated Pkm2NK-WT and Pkm2NK-KO cells. Total gene changes were assessed at a fold change cut-off of 2 and a p value of 0.05 with an FDR of 0.05. (c) Expression levels of key HIF1α target genes were assessed and compared between Pkm2NK-WT and Pkm2NK-KO cells (c) Expression levels of key STAT5 target genes were assessed and compared between Pkm2NK-WT and Pkm2NK-KO cells. (d-f) Cultured wildtype NK cells were stimulated with IL-2/12 +/- TEPP-46/vehicle for 18 hr. HiSeq RNA sequencing was then performed. (d) Differential gene expression analysis was carried out to assess total gene changes between IL-2/12 TEPP-46 (50 μM) and IL-2/12 Vehicle (0.1% v/v DMSO). Total gene changes were assessed at a fold change cut-off of 2 and a p value of 0.05 with FDR 0.05. (e) Expression levels of key HIF1α target genes were assessed and compared between IL-2/12 TEPP-46 (50 μM) and IL-2/12 Vehicle (0.1% v/v DMSO) treated cells. (f) Expression levels of key STAT5 target genes were assessed and compared between IL-2/12 TEPP-46 (50 μM) and IL-2/12 Vehicle (0.1% v/v DMSO) treated cells. Data are from n = 3 biological replicates per group and are displayed as mean values. (b–c) RPKM values were normalised to the average of PKM2NK-WT unstimulated. Fold change values were then log transformed and displayed in heat maps. (e–f) RPKM values were normalised to the mean of both groups combined and then converted to fold change from the mean. Data were then log transformed and displayed as heat maps. n = 3 mice per group. Data are mean and were analysed by (a–c) two-way ANOVA with multiple comparisons or (d-f) one-way ANOVA with Tukey post-test. ns – not significant *p>0.05.
Figure 6 with 1 supplement
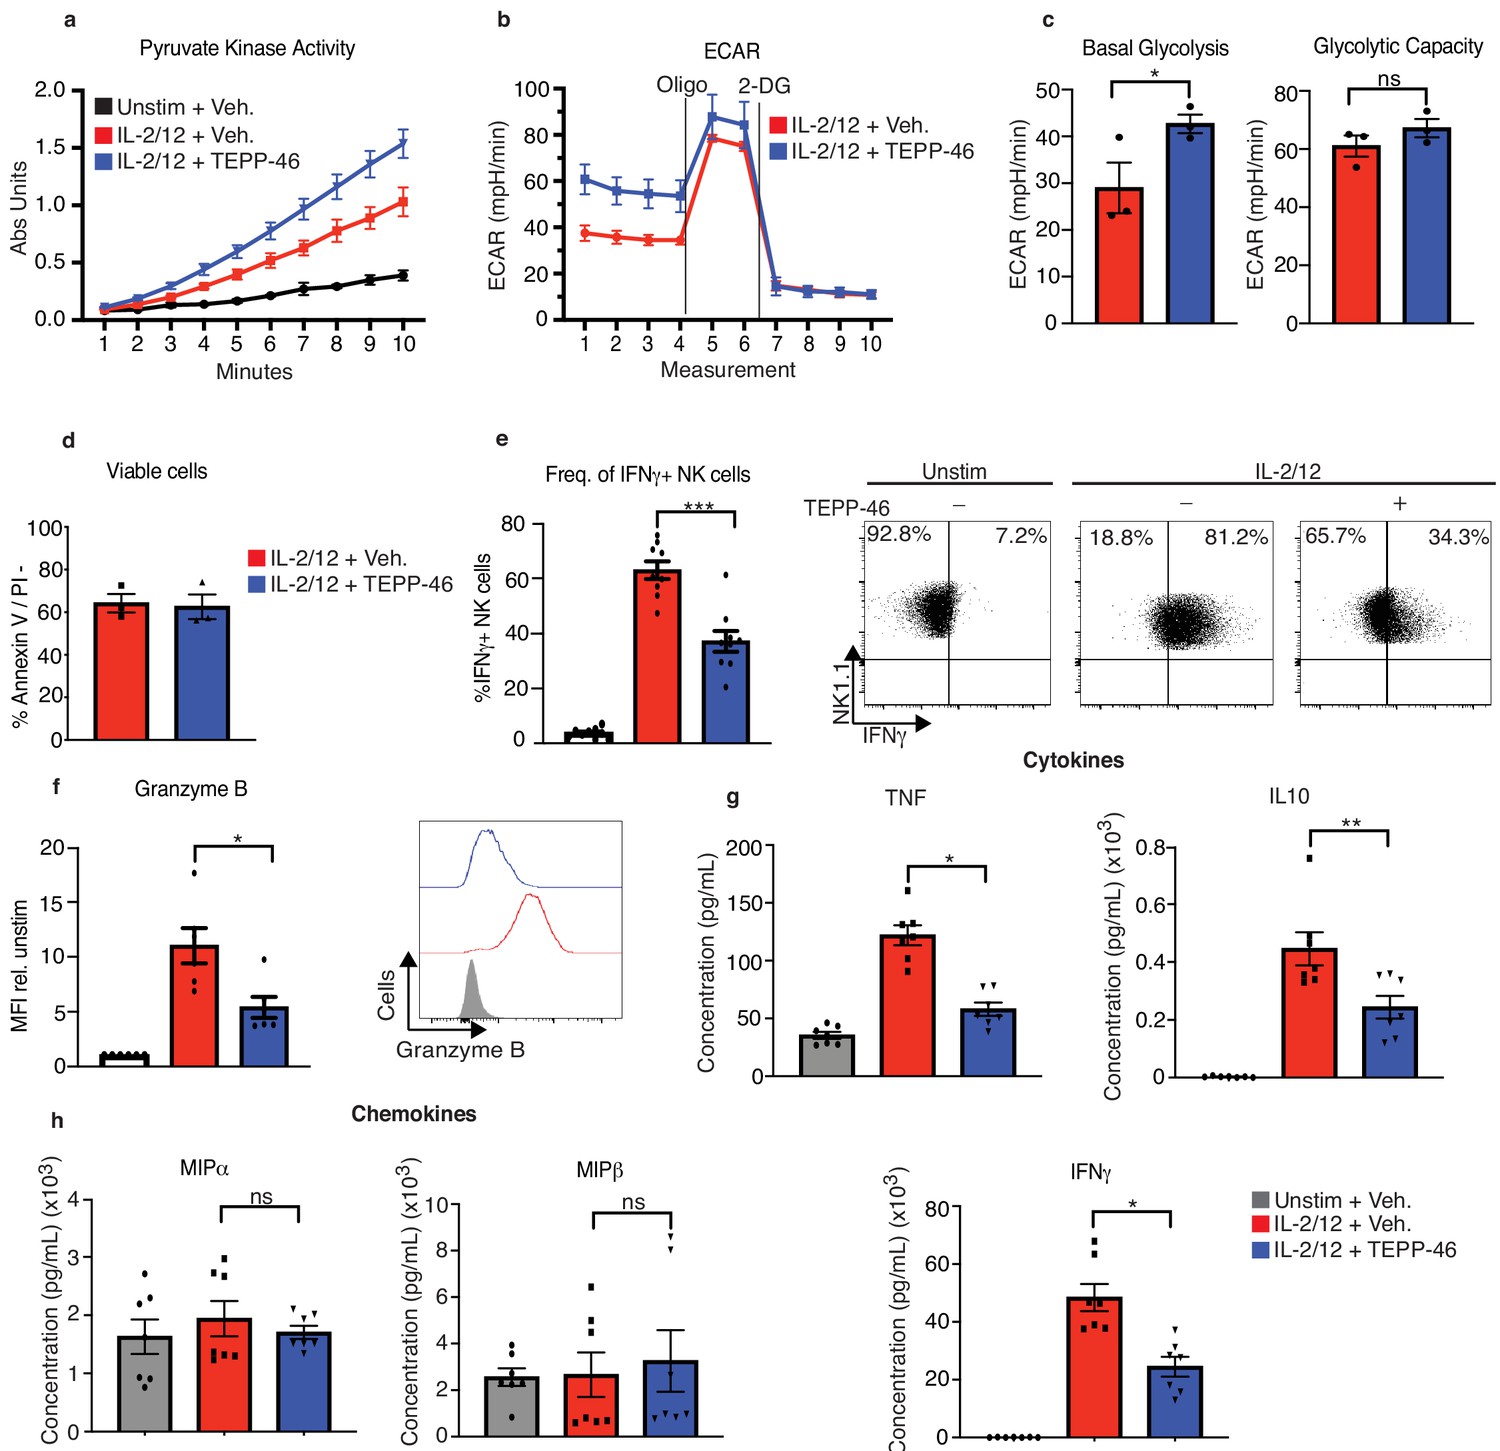
TEPP-46 activation of PKM2 is inhibitory to NK cell proinflammatory cytokine production.
(a) Wildtype cultured NK cells were stimulated for 17 hr in IL-2/12 or left unstimulated. NK cells were then treated with TEPP-46 for 1 hr, lysed and a pyruvate kinase activity assay was carried out. (b) Wildtype cultured NK cells were stimulated for 17 hr in IL-2/12 or left unstimulated. NK cells were then treated with TEPP-46 for 1 hr and glycolysis was assessed by Seahorse extracellular flux analysis. (c) Pooled data for basal glycolysis and glycolytic capacity as measured by seahorse extracellular flux analysis. (d) Cultured NK cells were stimulated with IL-2/12 for 18 hr +/- TEPP-46 (50 μM) and analysed by flow cytometry for Annexin V staining and PI incorporation. (e) Cultured NK cells were stimulated with IL-2/12 for 18 hr +/- TEPP-46 (50 μM) or left unstimulated and analysed by flow cytometry for frequency of IFNγ expression. (f) Cultured NK cells were stimulated with IL-2/12 for 18 hr +/- TEPP-46 (50 μM) or left unstimulated and analysed by flow cytometry for granzyme B expression. (g) Cultured NK cells were stimulated with IL-2/12 for 18 hr +/- TEPP-46 (50 μM) or left unstimulated. Supernatants were harvested and analysed for levels of proinflammatory cytokines (TNF, IFNγ, IL-10) by flow cytometric bead array. (h) Cultured NK cells were stimulated with IL-2/12 for 18 hr +/- TEPP-46 (50 μM) or left unstimulated. Supernatants were harvested and analysed for levels of chemokines (MIP1α and MIP1β) by flow cytometric bead array. (a–d) data are representative of three independent experiments. (e) Data are pooled data of 9 experiments. (f) Data are pooled data of six experiments. (g–h) Data are pooled data of seven individual experiments. Data are mean +/- S.E.M and were analysed by (a–c) two-way ANOVA with multiple comparisons or (d-f) one-way ANOVA with Tukey post-test. ns – not significant *p>0.05, **p>0.01, ***p>0.001.
Figure 6—figure supplement 1
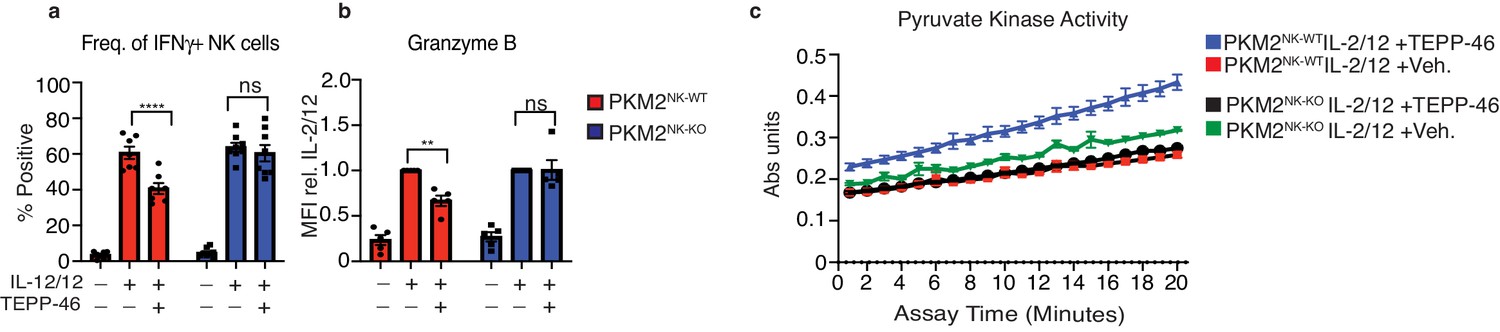
TEPP-46 does not affect IFNγ or granzyme B production in Pkm2NK-KO cells.
Pkm2NK-WT and Pkm2NK-KO cultured and purified cells were stimulated with (IL-2/12) or left unstimulated (low-dose IL-15) for 18 hr. IL-2/12 stimulated cells were treated with TEPP-46 (50 μM) or vehicle (0.1% v/v DMSO). Cells were then analysed by flow cytometry for the expression of IFNγ and granzyme b. (c) Pkm2NK-WT and Pkm2NK-KO cells were stimulated with (IL-2/12) +/- TEPP-46 (50 μM) for 18 hr. Cells were lysed and assessed using an absorbance assay for total pyruvate kinase activity. (a–b) Data are mean +/- S.E.M of 4–7 experiments. (c) Data displayed are pooled data of two biological replicates and are representative of two individual experiments (total n = 4). Data were analysed using two-way ANOVA with Tukey post test. ****p>0.0001, **p>0.01, ns- not significant.
Figure 7 with 1 supplement
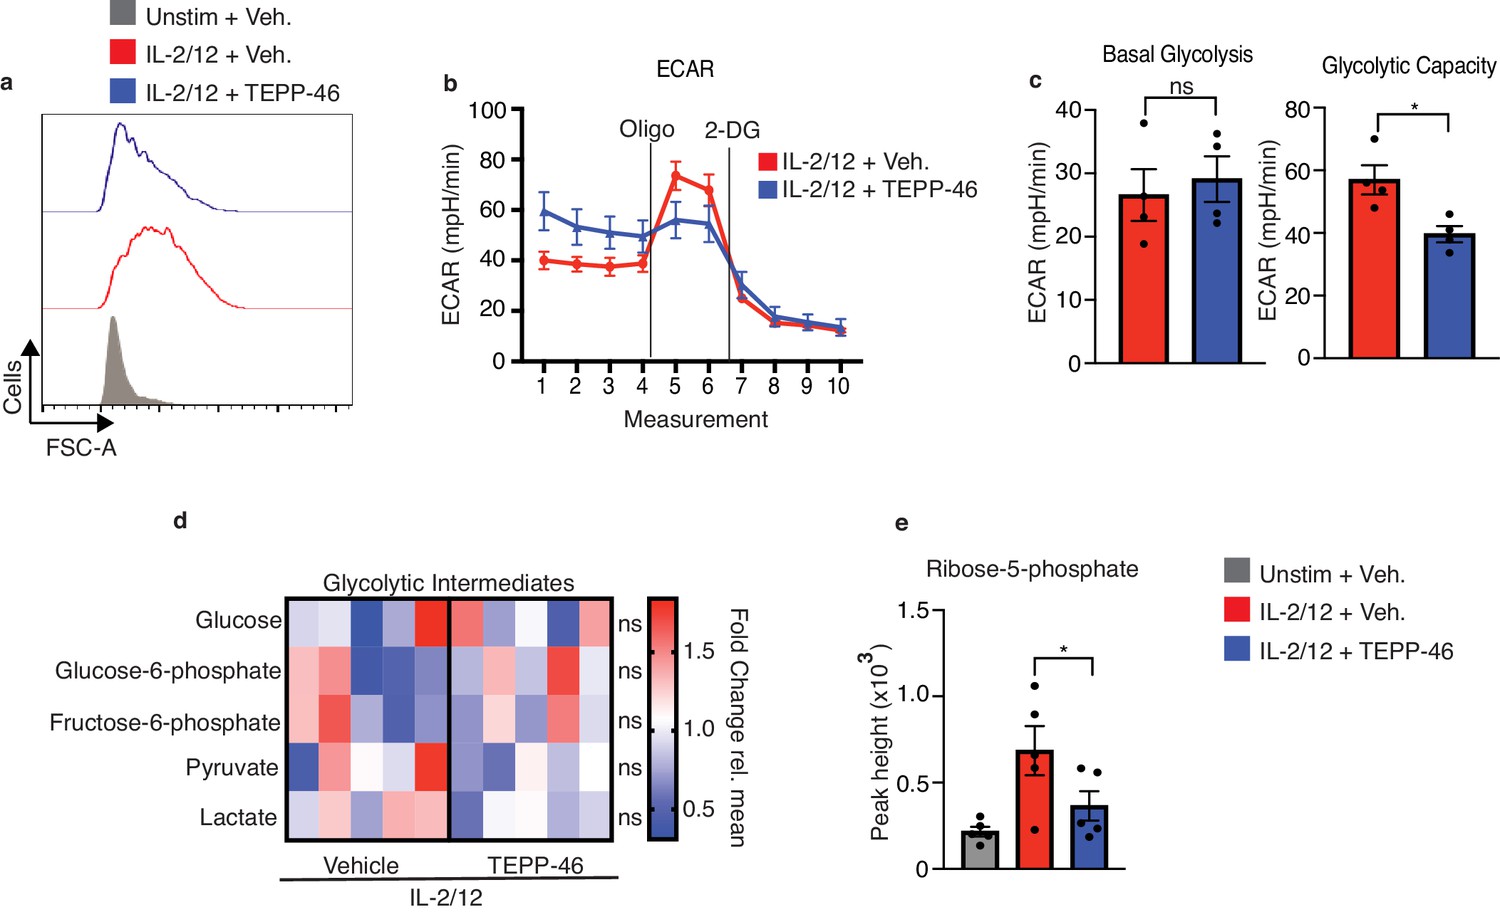
PKM2 activation inhibits normal cell growth and pentose phosphate pathway fuelling.
(a) Cultured NK cells were stimulated with IL-2/12 for 18 hr +/- TEPP-46 (50 μM) or left unstimulated. NK cells were analysed by flow cytometry and forward scatter (FSC-A) was assessed (b–c) Cultured NK cells were stimulated with IL-2/12 for 18 hr +/- TEPP-46 (50 μM) and analysed for glycolysis by Seahorse extracellular flux analysis (b) representative seahorse trace for IL-2/12 stimulated NK cells +/- TEPP-46 (18 hr) (c) IL-2/12 stimulated NKs treated +/- TEPP-46 (18 hr) were analysed by Seahorse extracellular flux analysis and data were compiled for glycolytic capacity and pooled basal glycolysis. (d) Cultured NK cells were stimulated with IL-2/12 for 18 hr +/- TEPP-46 (50 μM) and analysed by metabolomics for glycolytic metabolites using GC-MS metabolomics. Data were normalised to the mean of each metabolite peak height across both groups and displayed as fold change relative to the mean. (e) Metabolomics analysis for the metabolite ribose-5-phosphate displayed as peak height. Data are pooled or representative of between three and five individual experiments. Data were analysed by a Students t test (b) or by one-way ANOVA with Tukey post-test (e) Data are representative of mean +\- S.E.M. ns – not significant *p>0.05, **p>0.01, ***p>0.001.
Figure 7—figure supplement 1
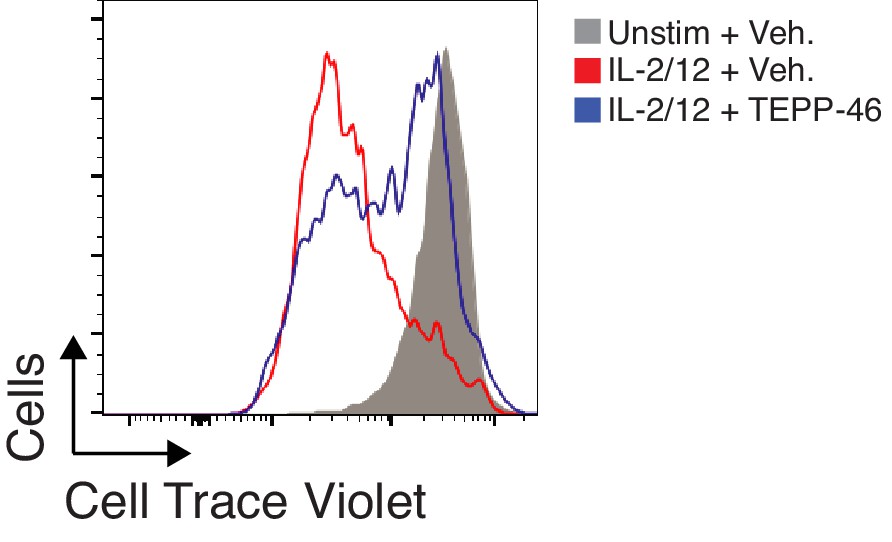
TEPP-46 treatment prevents normal cytokine-induced NK cell proliferation.
Splenocytes were cultured for 3 days in IL-15 (15 ng/mL). Cells were then labelled using cell trace violet (CTV) and stimulated using IL-2/12 or left unstimulated. 24 hr later an aliquot of IL-2/12 stimulated NK cells was treated with TEPP-46. Cells were then analysed for CTV dilution 3 days post initial labelling. Data are representative of two individual experiments.
Figure 8

PKM2 activation inhibits normal NK cell oxidative metabolism fuelling.
(a) Cultured NK cells were stimulated with IL-2/12 for 18 hr +/- TEPP-46 (50 μM) or left unstimulated (low-dose IL-15) and stained for ROS using the flow cytometric probe DCFDA. NK cells were gated (NK1.1+NKp46+CD3-) and MFI for DCFDA was analysed and displayed as both a representative histogram and pooled data from seven individual experiments. (b) Cultured NK cells were stimulated with IL-2/12 for 18 hr +/- DHEA (75 μM) or vehicle and stained for ROS using the flow cytometric probe DCFDA. NK cells were gated (NK1.1+NKp46+CD3-) and MFI for DCFDA was analysed and displayed as both a representative histogram and pooled data from five individual experiments. (c) Cultured NK cells were stimulated with IL-2/12 for 18 hr +/- TEPP-46 (50 μM) or left unstimulated (low-dose IL-15). Cells were lysed and assessed for NADPH levels using a luminescent NADPH assay with 0.15 × 10⁶ cells with three technical replicates per assay. Data are pooled data of three independent experiments. (d) Cultured wild-type NK cells were stimulated with IL-2/12 +/- TEPP-46/vehicle (0.1% DMSO) for 18 hr. HiSeq RNA sequencing was then performed. Expression levels for the genes Mt1 and Mt2 are displayed as RPKM (Reads Per Kilobase of transcript, per Million mapped reads) and are pooled data from three individual experiments. (e) Cultured NK cells were stimulated with IL-2/12 for 18 hr +/- TEPP-46 (50 μM) or vehicle and using the flow cytometric probe Mitotracker red. NK cells were gated (NK1.1+NKp46+CD3-) and MFI for mitotracker was analysed and displayed as both a representative histogram and relative pooled data from six individual experiments. (f–h) Cultured NK cells were stimulated with IL-2/12 for 18 hr +/- TEPP-46 (50 μM) and analysed for oxygen consumption by Seahorse extracellular flux analysis (f) representative seahorse trace for IL-2/12 stimulated NK cells +/- TEPP-46 (18 hr). (g–h) IL-2/12 stimulated NKs treated +/- TEPP-46 (18 hr) were analysed by Seahorse extracellular flux analysis and data were compiled for basal OCR and maximum respiratory capacity. (i) Cultured NK cells were stimulated with IL-2/12 for 18 hr +/- TEPP-46 (50 μM) and analysed by metabolomics for tricarboxylic acid/citrate-malate shuttle metabolites using GC-MS metabolomics. Data were normalised to the mean of each metabolite peak height across both groups and displayed as fold change relative to the mean. (j) Metabolomics analysis for the metabolite glutamine and glutamate displayed as peak height. One outlier was omitted from glutamine using a Grubbs test (α = 0.05). (k) Cultured NK cells were left unstimulated or activated with IL-2/12 +/- TEPP-46 (25 or 50 μM) for 18 hr were lysed for protein. Samples were analysed by immunoblot for cMyc and β-Actin protein expression. Data are pooled or representative of between three and five experiments. Data are representative of mean +\- S.E.M. (a,c) Data were analysed by one-way ANOVA with Tukey post-test. (b,d–e,g–j) Data were analysed using students t test ns – not significant *p>0.05, **p>0.01, ***p>0.001.
Figure 9

Antioxidant treatment can protect against TEPP-46 induced ROS.
(a) Cultured NK cells were stimulated with IL-2/12 for 18 hr +/- TEPP-46 (50 μM) in the presence or absence of MitoQ (50 nM) or left unstimulated (low-dose IL-15). Cells were then lysed and analysed by immunoblot for cMyc and β-Actin expression. (b) Cultured NK cells were stimulated with IL-2/12 for 18 hr +/- TEPP-46 (50 μM) and NAC (7.5 mM) or vehicle and stained for ROS using the flow cytometric probe DCFDA. NK cells were gated (NK1.1+NKp46+CD3-) and relative MFI for DCFDA was analysed and displayed pooled data from five individual experiments. (c–e) Cultured NK cells were stimulated with IL-2/12 for 18 hr +/- TEPP-46 (50 μM) and NAC (7.5 mM) or vehicle. Supernatants were harvested and analysed for levels of cytokines (TNF, IFNγ) by flow cytometric bead array. (a) Representative western blot of three individual experiments (b–e) Data are mean +/- S.E.M and are representative of three to five individual experiments. Data was analysed using one way ANOVA with multiple comparisons. **p>0.01, ns – non significant.
Additional files
-
Supplementary file 1
Pkm2NK-WT and Pkm2NK-KO cultured and purified cells were stimulated with (IL-2/12) or left unstimulated (low-dose IL-15) for 18 hr.
HiSeq RNA sequencing was then performed. Differential gene expression analysis was carried out using Partek to assess total gene changes between IL-2/12 stimulated Pkm2NK-WT and Pkm2NK-KO cells. Total gene changes were assessed at a fold change cut-off of 1.5 and a p value of 0.05 with an FDR of 0.05.
- https://cdn.elifesciences.org/articles/59166/elife-59166-supp1-v2.xls
-
Supplementary file 2
Cultured wildtype NK cells were stimulated with IL-2/12 +/- TEPP-46/vehicle for 18 hr.
HiSeq RNA sequencing was then performed. Differential gene expression analysis was carried out using Partek to assess total gene changes between IL-2/12 TEPP-46 (50 μM) and IL-2/12 Vehicle (0.1% v/v DMSO). Total gene changes were assessed at a fold change cut-off of 1.5 and a p value of 0.05 with FDR 0.05.
- https://cdn.elifesciences.org/articles/59166/elife-59166-supp2-v2.xlsx
-
Transparent reporting form
- https://cdn.elifesciences.org/articles/59166/elife-59166-transrepform-v2.docx
Download links
A two-part list of links to download the article, or parts of the article, in various formats.
Downloads (link to download the article as PDF)
Open citations (links to open the citations from this article in various online reference manager services)
Cite this article (links to download the citations from this article in formats compatible with various reference manager tools)
Metabolic but not transcriptional regulation by PKM2 is important for natural killer cell responses
eLife 9:e59166.
https://doi.org/10.7554/eLife.59166


