Poultry farmer response to disease outbreaks in smallholder farming systems in southern Vietnam
- Center for Infectious Diseases Dynamics, The Pennsylvania State University, United States
- UMR ASTRE, CIRAD, INRAE, Université de Montpellier, France
- Wellcome Trust Major Overseas Programme, Oxford University Clinical Research Unit, Viet Nam
- Ca Mau sub-Department of Livestock Production and Animal Health, Viet Nam
- École Normale Supérieure, CNRS UMR 8197, France
- Centre for Tropical Medicine and Global Health, Nuffield Department of Medicine, University of Oxford, United Kingdom
Figures
Figure 1
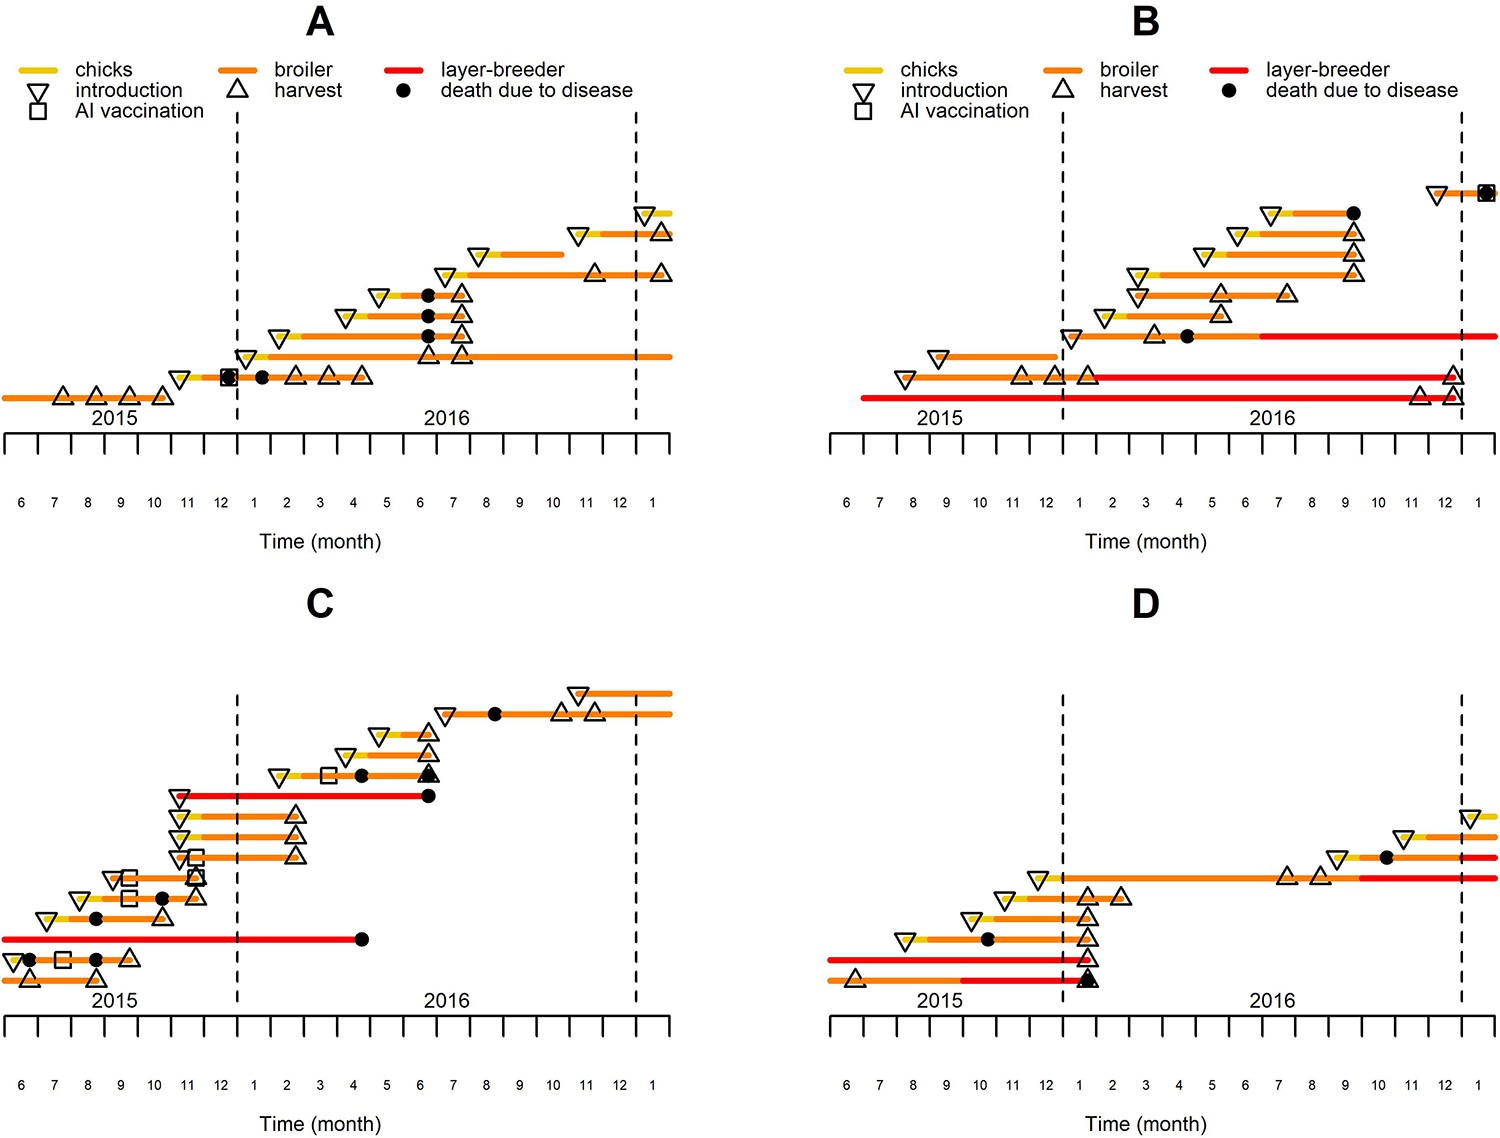
History of chicken flocks present in four of the observed farms over the study period.
Each colored line represents the period over which a single chicken flock was present on the farm, with the color code indicating the production type, which may vary during the course of the flock production period. The major events affecting the flocks are located with specific symbols on the corresponding lines and months.
Figure 2 with 1 supplement
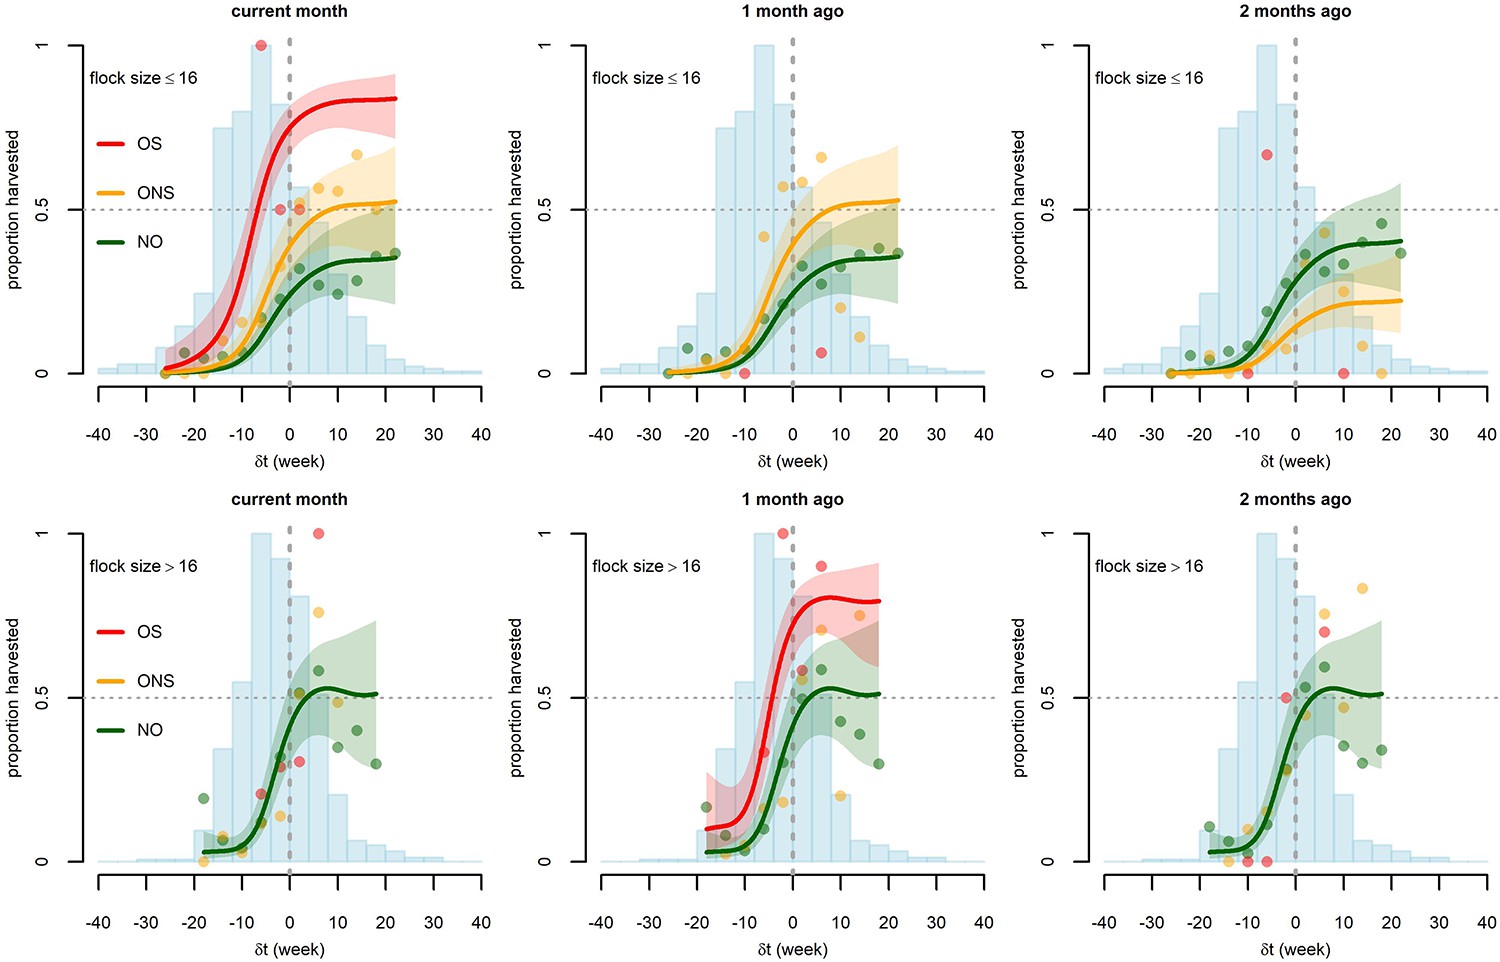
Graphical representation of the relationship between the difference δt (current flock age - flock age at maturity) and the proportion of broiler flocks harvested in the absence (NO, green) or presence of outbreaks with disease-induced mortality, either with sudden deaths (OS, red) or with no sudden deaths (ONS, orange).
Three different outbreak timings are considered: same month (left), one month prior (middle), and two months prior (right). Two different classes of flock size are considered: small,<17 chickens (top) and large,≥17 chickens (bottom). Points are the observed proportions (estimated from at least two flock-months) and lines are the predictions of the fitted Harvest model, along with 90% confidence bands. Model predictions with outbreaks are only displayed when fitted outbreak effects have some statistical significance (p<0.10) (see Table 2). Blue histograms correspond to the number of observed flock-months in the different classes of δt (scaled to their maximum, 139 in the top graphs and 157 in the bottom graphs).
Figure 2—figure supplement 1
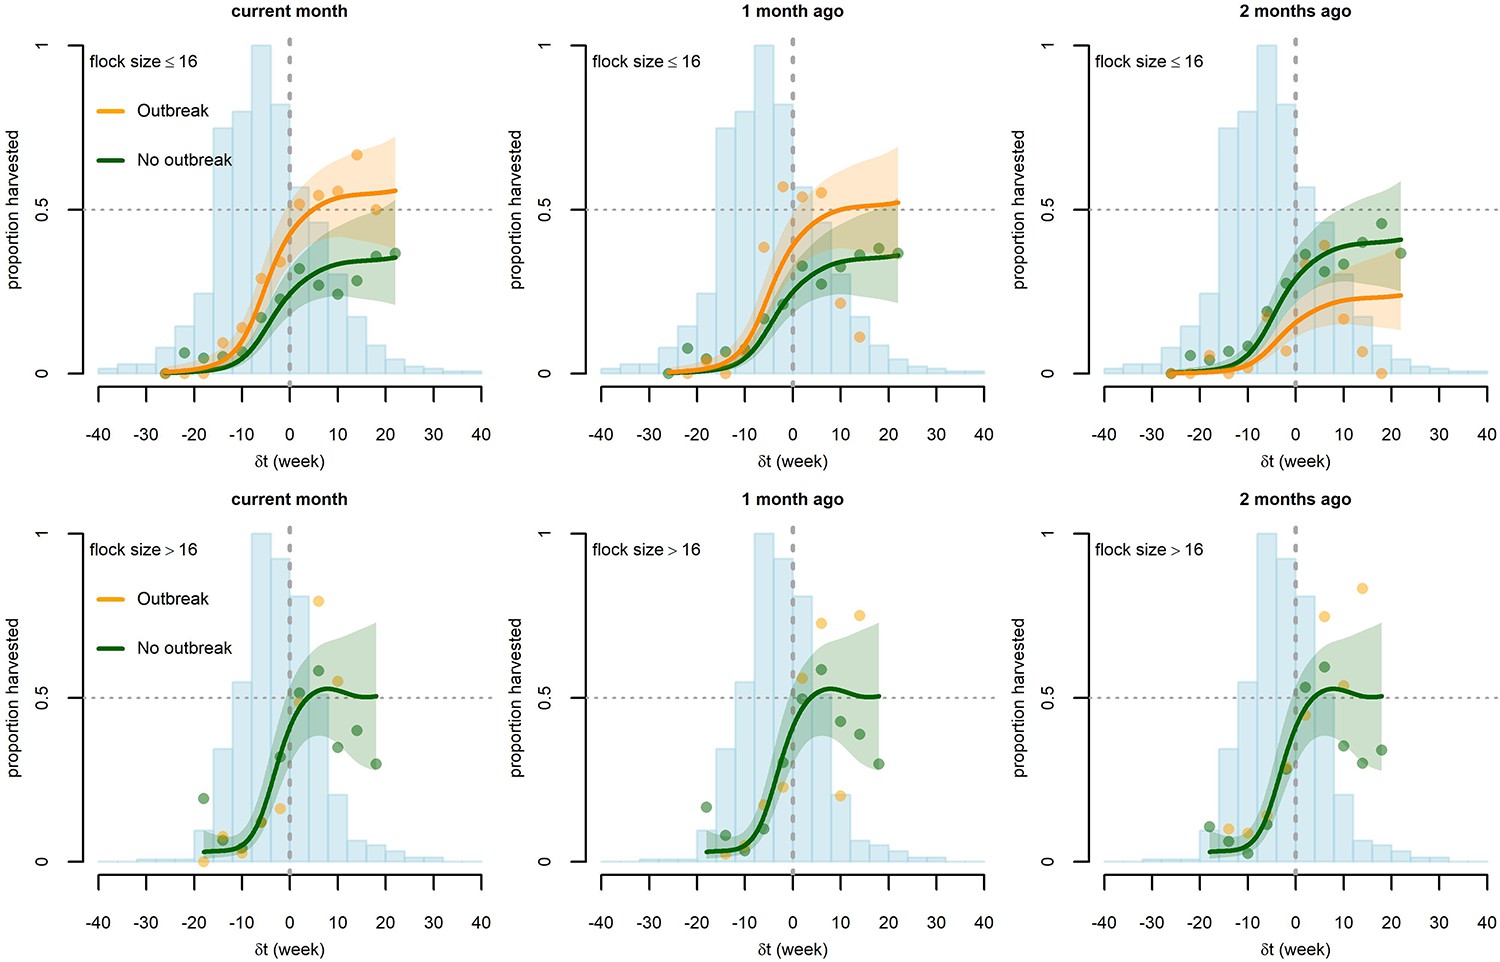
Graphical representation of the relationship between the difference δt (current flock age - flock age at maturity) and the proportion of broiler flocks harvested in the absence (green color - NO) or presence of outbreaks with disease-induced mortality (dark orange color).
Three different outbreak timings are considered: same month (left), one month prior (middle), and two months prior (right). Two different classes of flock size are considered: small (top) and large (bottom). Points are the observed proportions (estimated from at least two flock-months) and lines are the predictions of the fitted Harvest model, along with 90% confidence bands. Model predictions with outbreaks are only displayed when fitted outbreak effects have some statistical significance (p<0.10) (see Supplementary file 2). Blue histograms correspond to the number of observed flock-months in the different classes of δt (scaled to their maximum, 139 in the top graphs and 157 in the bottom graphs).
Figure 3
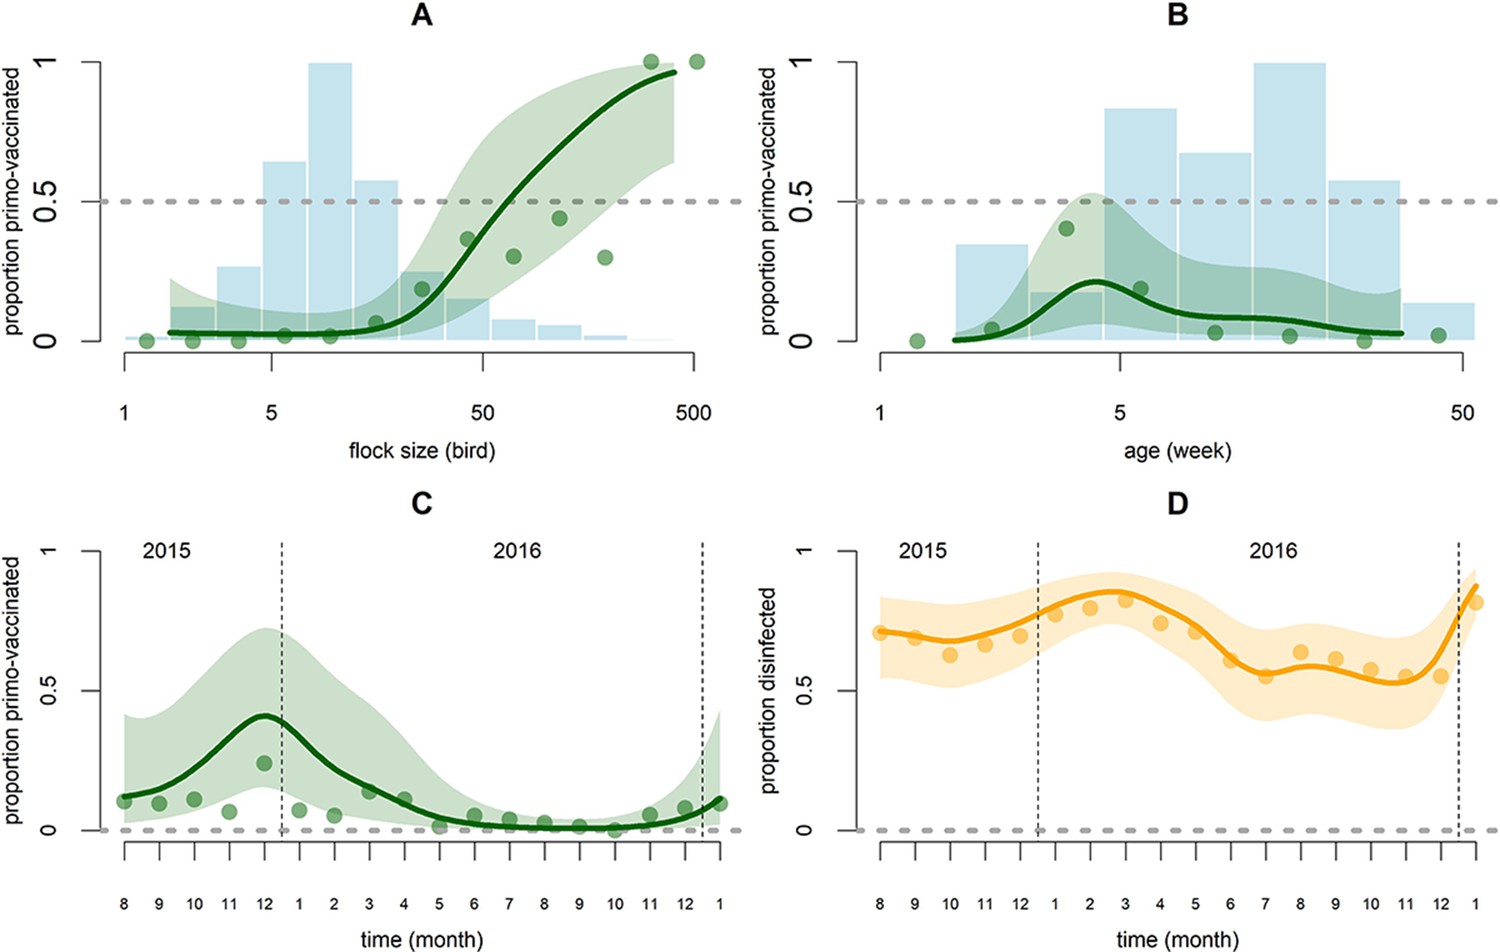
Graphical representation of predictions of the AI vaccination and disinfection models as functions of covariates whose effect is modeled with thin plate smooth splines.
For the AI vaccination model (green) these covariates are flock size (n) (A), age (t) (B) and calendar time (T) (C). For the disinfection model (orange), the covariate is calendar time (T) (D). Points are the observed proportions and lines are the predictions along with the 90% confidence band. In graphs C and D the proportions are displayed on the logit scale. Blue histograms correspond to the number of observed flock-months in the different classes of log (n) (A) and t (B) (scaled to their maximum, 402 in A and 345 in B).
Tables
Table 1
Summary statistics of variables.
| Continuous variable | Min | 1st quartile | Median | 3rd quartile | Max |
|---|---|---|---|---|---|
| Broiler chicken flocks (n = 391) | |||||
| Number of flocks of broiler chickens per farm | 2 | 22 | 36 | 44 | 75 |
| Number of observation months per broiler flock | 1 | 3 | 4 | 5 | 12 |
| Broiler chicken flock-months (n = 1656) | |||||
| Flock size (n) (number of birds) | 2 | 10 | 16 | 35 | 580 |
| Anticipated age at maturity (t*) (weeks) | 9.5 | 13.1 | 17.4 | 19.6 | 43.6 |
| Age at the time of observation (t) (weeks) | 1.6 | 6.3 | 12.3 | 19 | 53.6 |
| Difference t- t* (δt) (week) | −37.2 | −11.1 | −5.2 | 1 | 36.1 |
| Calendar time (T) | 3 | 7 | 11 | 16 | 20 |
| Proportion harvested (%) | 0 | 0 | 0 | 33.3 | 100 |
| Number of chicken flocks introduced in the same month onto the same farm | 0 | 0 | 0 | 1 | 4 |
| Number of chicken flocks introduced in the month prior onto the same farm | 0 | 0 | 0 | 1 | 2 |
| Number of broiler chickens present on the same farm in other flocks (bird) | 0 | 10 | 25 | 61 | 900 |
| Number of broiler ducks present on the same farm (bird) | 0 | 0 | 0 | 25 | 3630 |
| Number of broiler Muscovy ducks present on the same farm (bird) | 0 | 0 | 0 | 6 | 80 |
| Number of layer chickens present on the same farm (bird) | 0 | 2 | 6 | 13 | 350 |
| Number of layer ducks present on the same farm (bird) | 0 | 0 | 0 | 0 | 11 |
| Number of layer Muscovy ducks present on the same farm (bird) | 0 | 0 | 0 | 2 | 30 |
| Farm-months (n = 876) | |||||
| Number of broiler chickens (bird) | 0 | 8 | 28 | 64 | 912 |
| Number of broiler ducks (bird) | 0 | 0 | 4 | 31 | 3630 |
| Number of broiler Muscovy ducks (bird) | 0 | 0 | 0 | 6 | 80 |
| Number of layer chickens farm (bird) | 0 | 0 | 4 | 10 | 358 |
| Number of layer ducks (bird) | 0 | 0 | 0 | 0 | 500 |
| Number of layer Muscovy ducks (bird) | 0 | 0 | 0 | 2 | 30 |
| Proportion flocks farmed with disinfection (%) | 0 | 0 | 100 | 100 | 100 |
| Qualitative variable | Proportion of observations | ||||
| Broiler chicken flock-months (n = 1656) | |||||
| Occurrence of outbreak with no sudden death in chickens on the same farm in the current month | 18.8% | ||||
| Occurrence of outbreak with sudden death in chickens on the same farm in the current month | 1.6% | ||||
| Occurrence of outbreak in other species on the same farm in the current month | 7.2% | ||||
| Confinement indoors or in enclosure | 32.8% | ||||
| Previously vaccinated for AI | 20.2% | ||||
| Previously vaccinated for Newcastle Disease | 7.1% | ||||
| Farm-months (n = 876) | |||||
| Occurrence of outbreak in any species | 23.4% | ||||
Table 2
Fitted parameters of the broiler chicken flock harvest and AI vaccination and farm disinfection models.
| Model | Variable | Odds-ratio (with 95% CI) | p-value | ||
|---|---|---|---|---|---|
| Harvest | Flock size ≤ 16 chickens | ONS chickens* | Same month | 2.06 (1.23; 3.45) | <10-2 |
| −1 month | 2.06 (1.17; 3.62) | 0.02 | |||
| −2 months | 0.41 (0.19; 0.92) | 0.03 | |||
| OS chickens** | Same month | 9.34 (2.13; 40.94) | <10-2 | ||
| −1 month | 0.18 (0.01; 4.95) | 0.32 | |||
| −2 months | 0.88 (0.15; 5.04) | 0.89 | |||
| Number of broiler chickens in the farm (square root) | 1.05 (1; 1.11) | 0.06 | |||
| combined effect of the difference between current age and age at maturity () and the age at maturity () (spline transformation) | Figure 2 | <10-3 | |||
| Flock size > 16 chickens | OS chickens** | Same month | 1.02 (0.23; 4.46) | 0.98 | |
| −1 month | 3.89 (0.82; 18.46) | 0.09 | |||
| −2 months | 3.1 (0.51; 18.77) | 0.22 | |||
| Number of broiler chickens in the farm (square root) | 1.05 (1; 1.11) | 0.05 | |||
| combined effect of the difference between current age and age at maturity () and the age at maturity () (spline transformation) | Figure 2 | <10-3 | |||
| AI vaccination | Outbreak chickens | Same month | 0.75 (0.29–1.92) | 0.55 | |
| −1 month | 0.78 (0.29–2.11) | 0.63 | |||
| −2 months | 0.27 (0.08–0.89) | 0.04 | |||
| Outbreak others | Same month | 4.62 (1.08–19.72) | 0.04 | ||
| −1 month | 0.51 (0.09–2.89) | 0.45 | |||
| −2 months | 0.42 (0.06–2.91) | 0.39 | |||
| Number of broiler chickens in the farm (square root) | 0.92 (0.82–1.03) | 0.2 | |||
| Number of broiler Muscovy ducks in the farm (square root) | 0.74 (0.57–0.96) | 0.03 | |||
| Number of layer ducks in the farm (square root) | 2.95 (1.15–7.57) | 0.03 | |||
| Number of layer Muscovy ducks in the farm (square root) | 1.9 (1.07–3.36) | 0.03 | |||
| Confinement | 24.6 (6.32–95.6) | <10-3 | |||
| Proportion harvested | 0.01 (0–0.37) | 0.02 | |||
| Spline transform of the logarithm of the flock size () | Figure 3A | <10-3 | |||
| Spline transform of the logarithm of the flock age () | Figure 3B | <10-3 | |||
| Spline transform of the calendar time () | Figure 3C | <10-3 | |||
| Disinfection | Number of broiler Muscovy ducks in the farm (square root) | 1.07 (1.01–1.13) | 0.02 | ||
| Number of layer ducks in the farm (square root) | 1.25 (1.02–1.53) | 0.04 | |||
| Number of layer chickens in the farm (square root) | 1.3 (1.12–1.51) | <10-3 | |||
| Spline transform of the calendar time () | Figure 3D | <10-3 | |||
-
* ONS: Outbreak with no sudden deaths.
** OS: Outbreak with sudden deaths.
Table 3
The destination of harvested broiler chicken flocks with or without occurrence of outbreaks of disease-induced mortality in chickens of the same farm in the same month or one month prior (%).
| Destination | No outbreak | Outbreak with no sudden death (ONS) | Outbreak with sudden death (OS) |
|---|---|---|---|
| Sale to traders | 28% | 45% | 45% |
| Sale at market | 5% | 16% | 0% |
| Sale to other farmers | 2% | 3% | 0% |
| Sale unspecified | 12% | 4% | 11% |
| Slaughter at home | 36% | 20% | 11% |
| Gift | 5% | 8% | 11% |
| Feed farmed pythons | 5% | 1% | 22% |
| Other | 7% | 3% | 0% |
Additional files
-
Supplementary file 1
Fitted parameters of the original broiler chicken harvest model.
- https://cdn.elifesciences.org/articles/59212/elife-59212-supp1-v2.docx
-
Supplementary file 2
Fitted parameters of the broiler chicken harvest model with aggregated effects of outbreaks with and without sudden deaths.
- https://cdn.elifesciences.org/articles/59212/elife-59212-supp2-v2.docx
-
Transparent reporting form
- https://cdn.elifesciences.org/articles/59212/elife-59212-transrepform-v2.pdf
Download links
A two-part list of links to download the article, or parts of the article, in various formats.
Downloads (link to download the article as PDF)
Open citations (links to open the citations from this article in various online reference manager services)
Cite this article (links to download the citations from this article in formats compatible with various reference manager tools)
Poultry farmer response to disease outbreaks in smallholder farming systems in southern Vietnam
eLife 9:e59212.
https://doi.org/10.7554/eLife.59212


