Ebola and Marburg virus matrix layers are locally ordered assemblies of VP40 dimers
- Structural and Computational Biology Unit, European Molecular Biology Laboratory, Germany
- Department of Molecular Structural Biology, Max Planck Institute of Biochemistry, Germany
- Center for Infectious Disease and Vaccine Research, La Jolla Institute for Immunology, United States
- Institut für Virologie, Philipps-Universität Marburg, Hans-Meerwein-Straße, Germany
- The Scripps Research Institute, United States
- Structural Studies Division, MRC Laboratory of Molecular Biology, United Kingdom
Figures
Figure 1 with 4 supplements

Subtomogram averages of the eVP40 matrix layer in VLPs.
(A) The structure of the matrix layer in Ebola VP40, VP40-GP, and NP-VP24-VP35-VP40 VLPs. For these rows, the left column shows a portion of the subtomogram average from within the VLP; overlaid are the approximate unit-cell dimensions of the 2D lattice. eVP40 dimers are fitted as rigid bodies in the central column (PDB: 4ldb). The right column shows a cross-sectional view parallel to a VP40 linear chain. (B) A detailed view of the inter-dimeric CTD-CTD interface in Ebola NP-VP24-VP35-VP40 matrix, with hydrophobic residues at the inter-dimer interface shown in white; this interface is present in all three VLPs. (C) Electrostatic maps of the eVP40 dimer, with the hydrophobic patch forming the inter-dimer interface marked by an arrowhead.
Figure 1—figure supplement 1
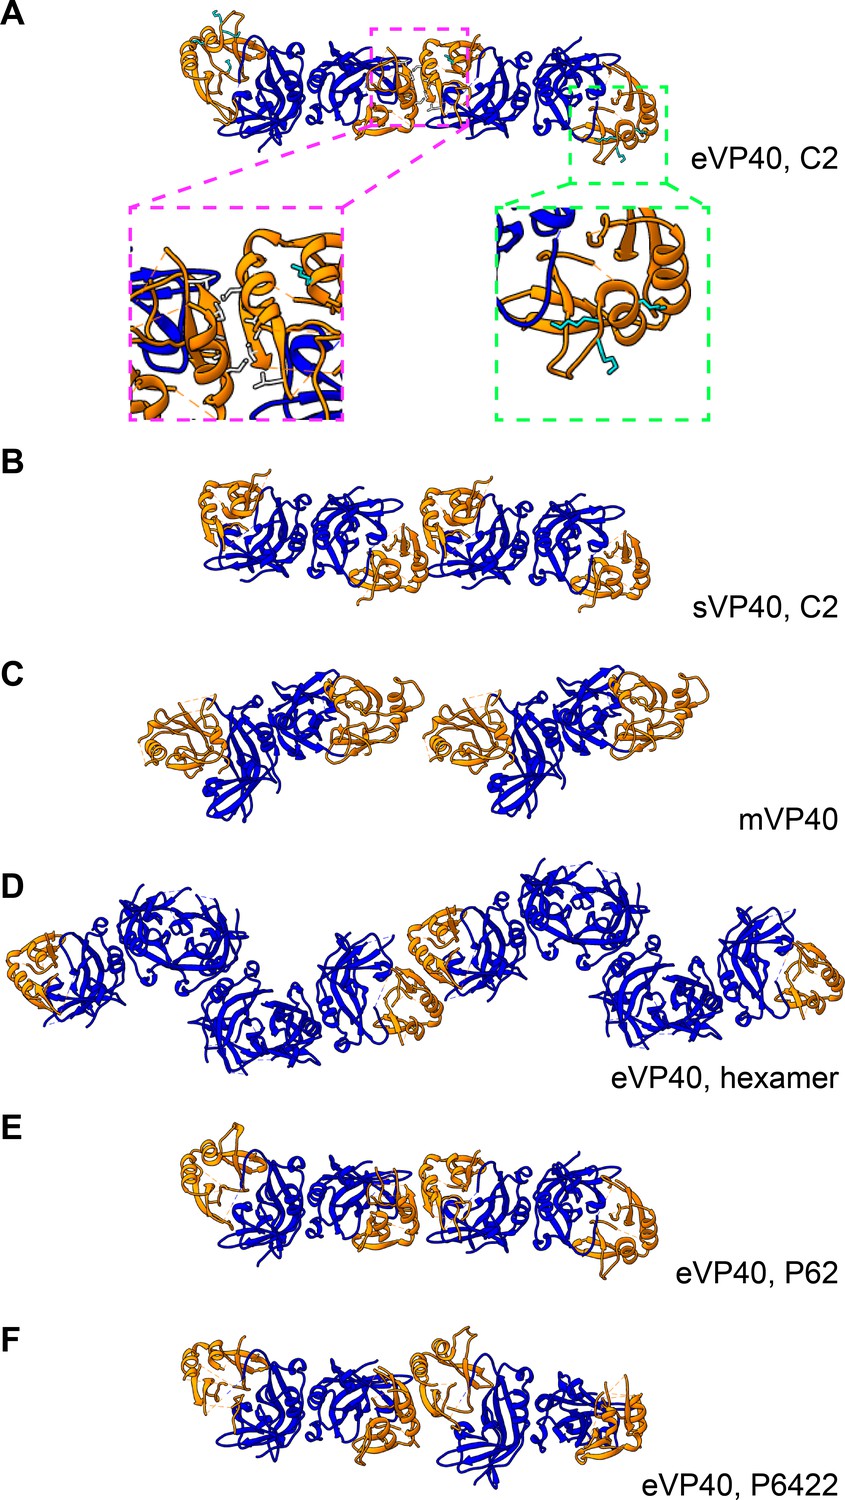
Comparison of eVP40 assembly models.
Crystal structures of VP40 assembled by CTD-to-CTD interactions of VP40 dimers. NTDs are colored in blue, while CTDs are in orange. (A) eVP40, C2, with insets showing the residues of the hydrophobic CTD-CTD interface (magenta) and the CTD basic patch (green). (B) sVP40, C2; (C) mVP40; (D) eVP40 linear hexamer, (E) eVP40, P62, (F) eVP40, P6422. Views are from outside the membrane surface.
Figure 1—figure supplement 2
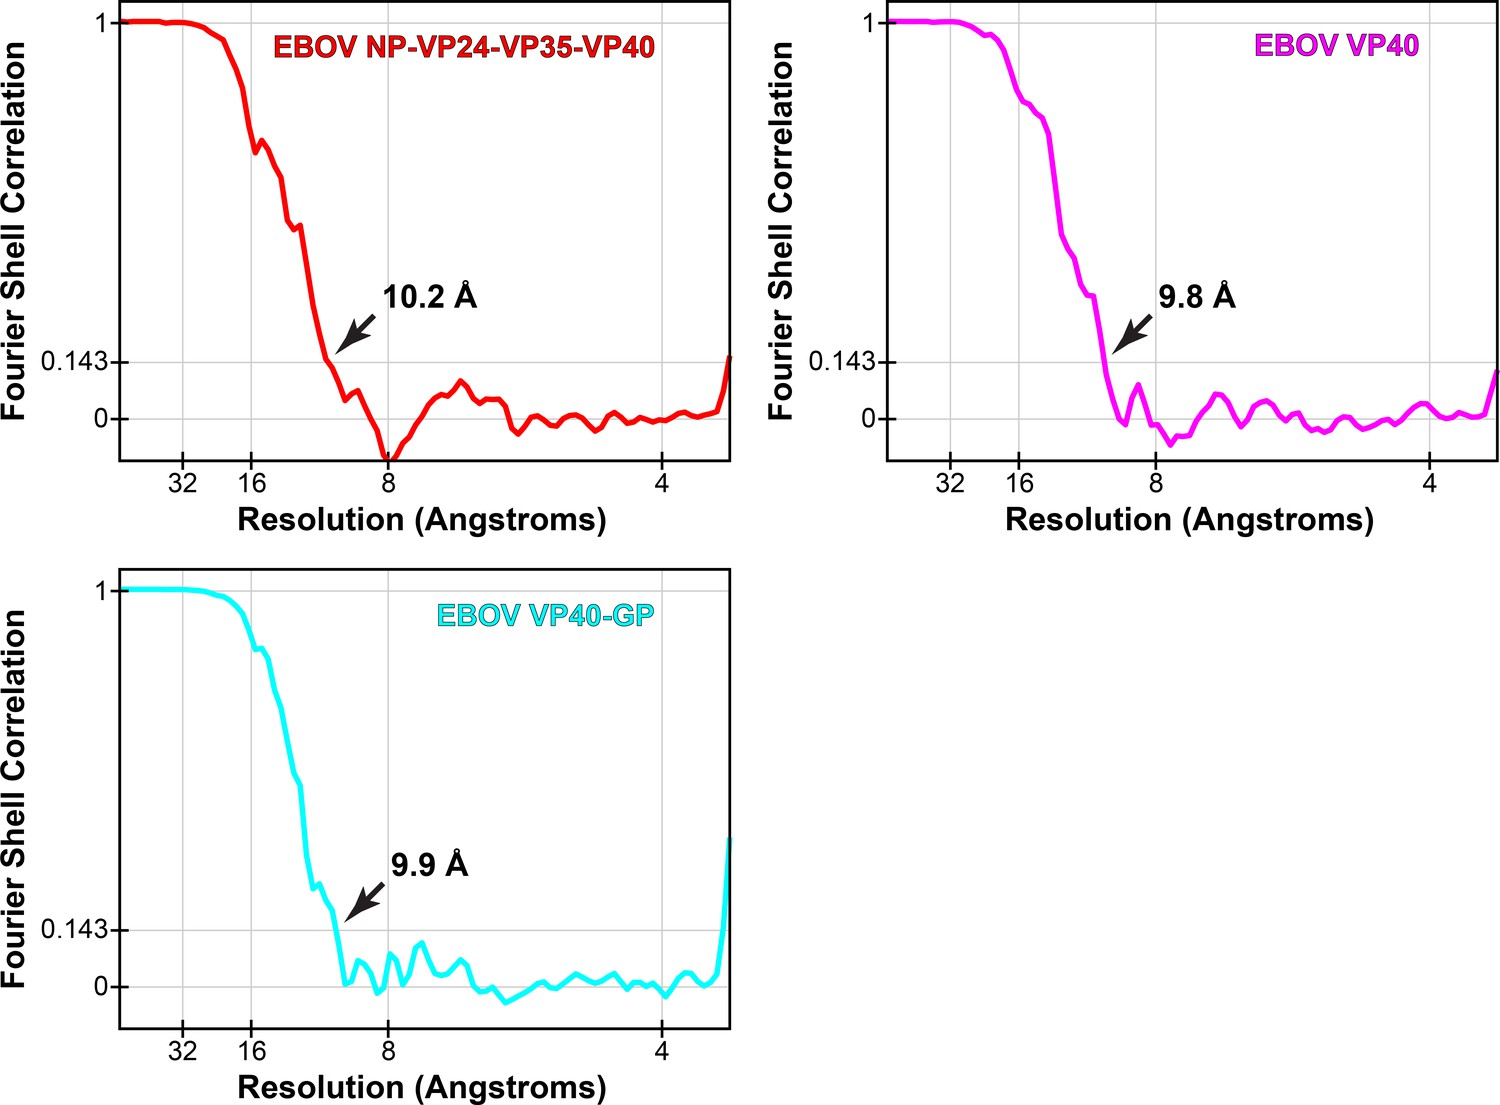
Fourier shell correlations of eVP40 subtomogram averages.
Arrows indicate resolution at FSC = 0.143.
Figure 1—figure supplement 3

Comparison of crystal packings observed in eVP40 structures.
(A) Zaire eVP40 (4ldb Bornholdt et al., 2013) crystallographic dimer. This dimer is then shown overlaid with: (B) Sudan eVP40 (3ctq Bornholdt et al., 2013), (C) Zaire eVP40 (1es6 Dessen et al., 2000), (D) Sudan eVP40 (4ld8 Bornholdt et al., 2013), (E) Zaire eVP40 P62 unit cell (this study), (F) Zaire eVP40 P6422 unit cell, (this study) (G) Zaire eVP40 linear hexamer (4ldd Bornholdt et al., 2013), (H) a superposition of all six structures.
Figure 1—figure supplement 4
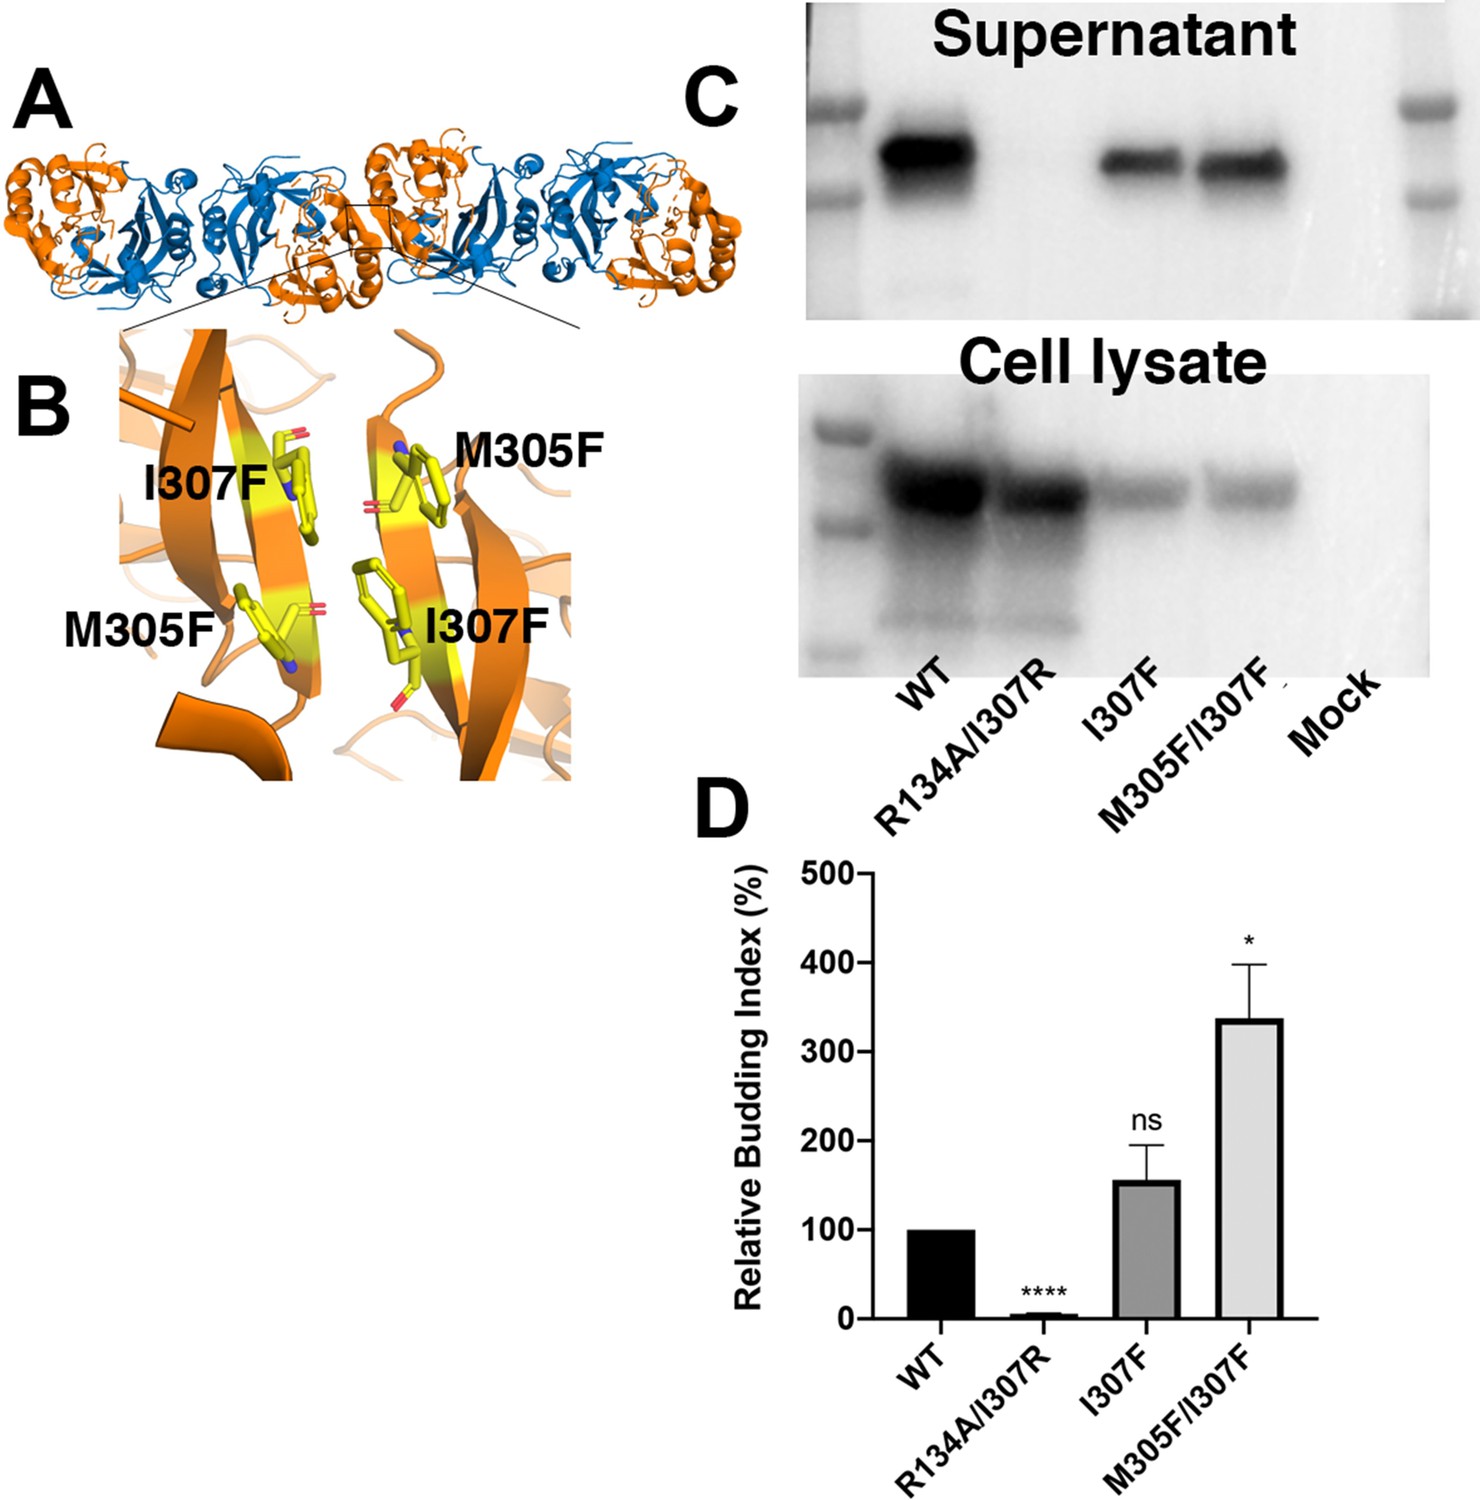
Characterization of mutations that stabilize the CTD-CTD interface.
(A) Structure of side-by-side VP40 dimers. NTDs are colored blue and CTDs are colored orange. (B) Zoomed in view of the CTD-CTD interface. Modeling suggests that introduction of phenylalanine at positions 305 and 307 might stabilize the CTD-CTD interface. (C) Expression level of wild-type, R134A/I307R, I307F, and I307F/M305F VP40. R134A/I307R has been previously described to abolish VP40 dimerization and VLP release (Bornholdt et al., 2013). (D) Relative budding index of VLPs into the supernatant (ratio of supernatant to cell-lysate VP40, normalized to the WT values) from WT and mutant VP40. Three independent replicates. Values represent mean +/- SEM ns=P 0.05, *p≤0.05, ****p≤0.0001 by student’s t test. The M305F/I307F mutation, predicted to stabilize the CTD-CTD interface, shows enhanced budding compared to WT VP40.
Figure 2 with 2 supplements
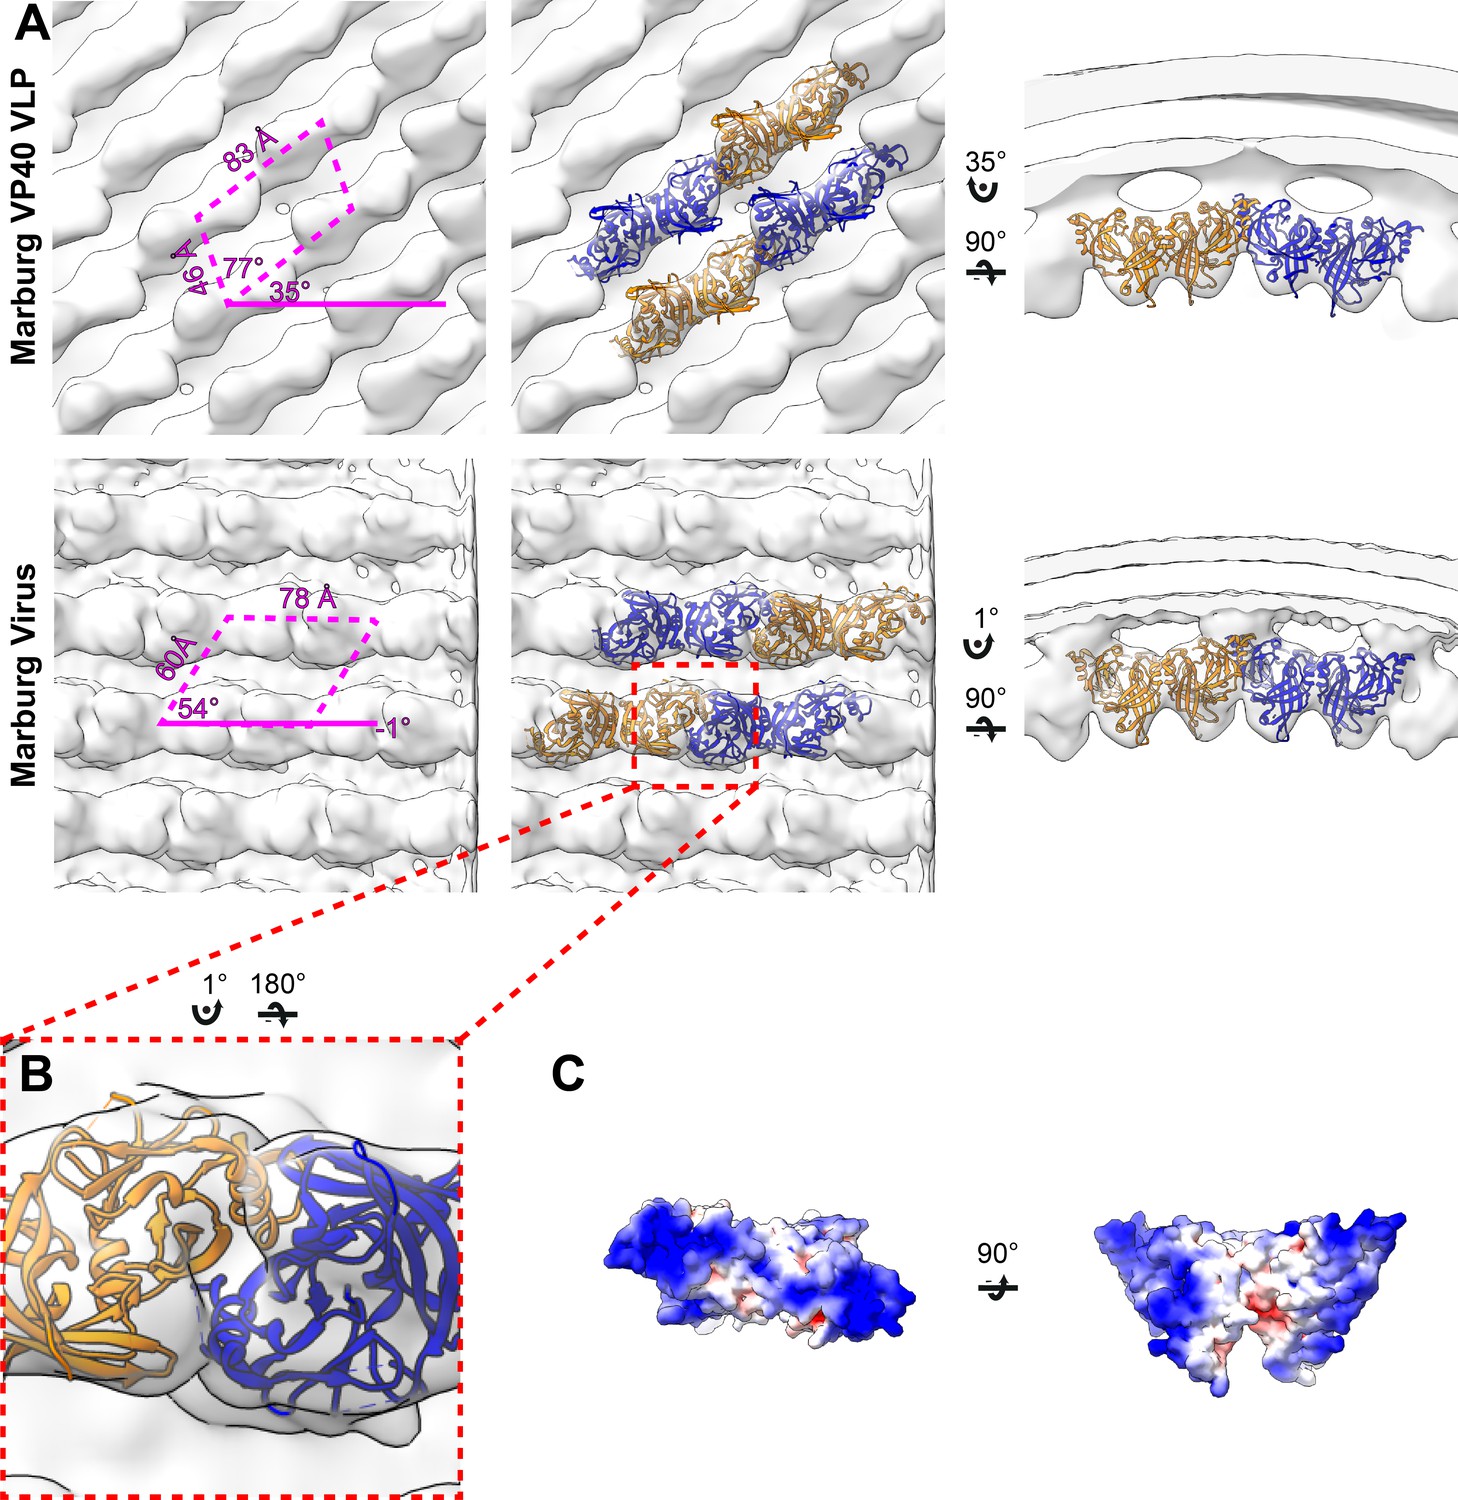
Subtomogram averages of the mVP40 matrix layer in VLPs and virions.
(A) Top row shows the structure of the matrix layer in Marburg VP40 VLPs and bottom row shows Marburg virus. Left column shows a portion of the subtomogram average from within the filaments; overlaid are the approximate unit-cell dimensions of the 2D lattice. Center column shows the same view, but rigid-body fitted mVP40 dimers (PDB: 5b0v). Right column shows the same rigid-body fitting as in the center column, but as a cross-sectional view parallel to a VP40 linear chain. (B) A detailed view of the inter-dimeric CTD-CTD interface. (C) Electrostatic maps of mVP40 dimer.
Figure 2—figure supplement 1
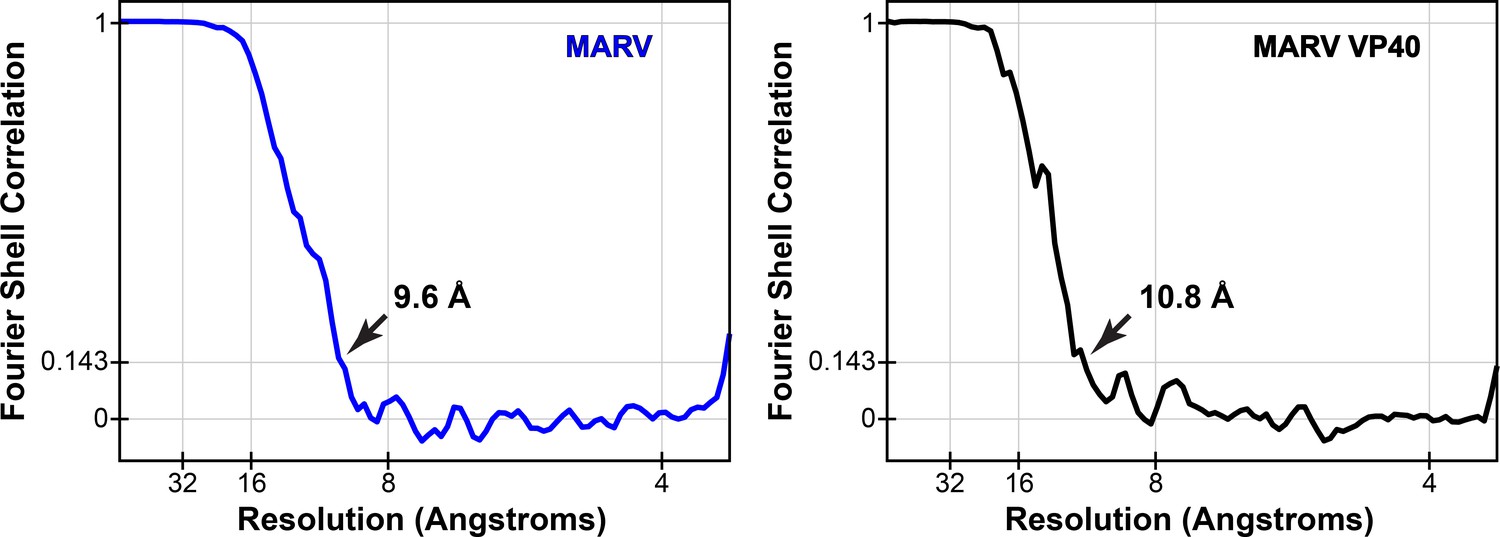
Fourier shell correlations of mVP40 subtomogram averages.
Arrows indicate resolution at FSC = 0.143.
Figure 2—figure supplement 2

Rigid body fitting of crystal structures into mVP40 matrix layers.
(A and B) are densities from Marburg virus while (C and D) are densities from mVP40 VLPs. mVP40 crystal structures (PDB: 5b0v) are in blue and orange while eVP40 structures (PDB: 4ldb) are in cyan and yellow. For Marburg virus, both structures fit without clashing, while in Marburg VP40 VLPs only the eVP40 structures fit, suggesting a conformational change between the mVP40 crystal structure and the VLP.
Figure 3 with 1 supplement

Tomographic slices and lattice maps of matrix layers.
(A) Tomographic slice of the matrix layer protein density directly under the membrane bilayer; VP40 chains are seen as dark lines of density. (B) Central slice through each filament with lattice maps overlaid. VP40 dimers are visualized as rectangles, which connect into linear chains along the short sides. Colors are scaled from green to red, which denote high and low correlation scores, respectively. Low correlation scores are generally associated with regions where the local lattice is broken, thus correlating poorly with the strong lattice in the subtomogram average. Representative well-ordered regions are boxed in magenta, while representative poorly ordered regions are boxed in blue. Both are shown in detail in C.
Figure 3—figure supplement 1
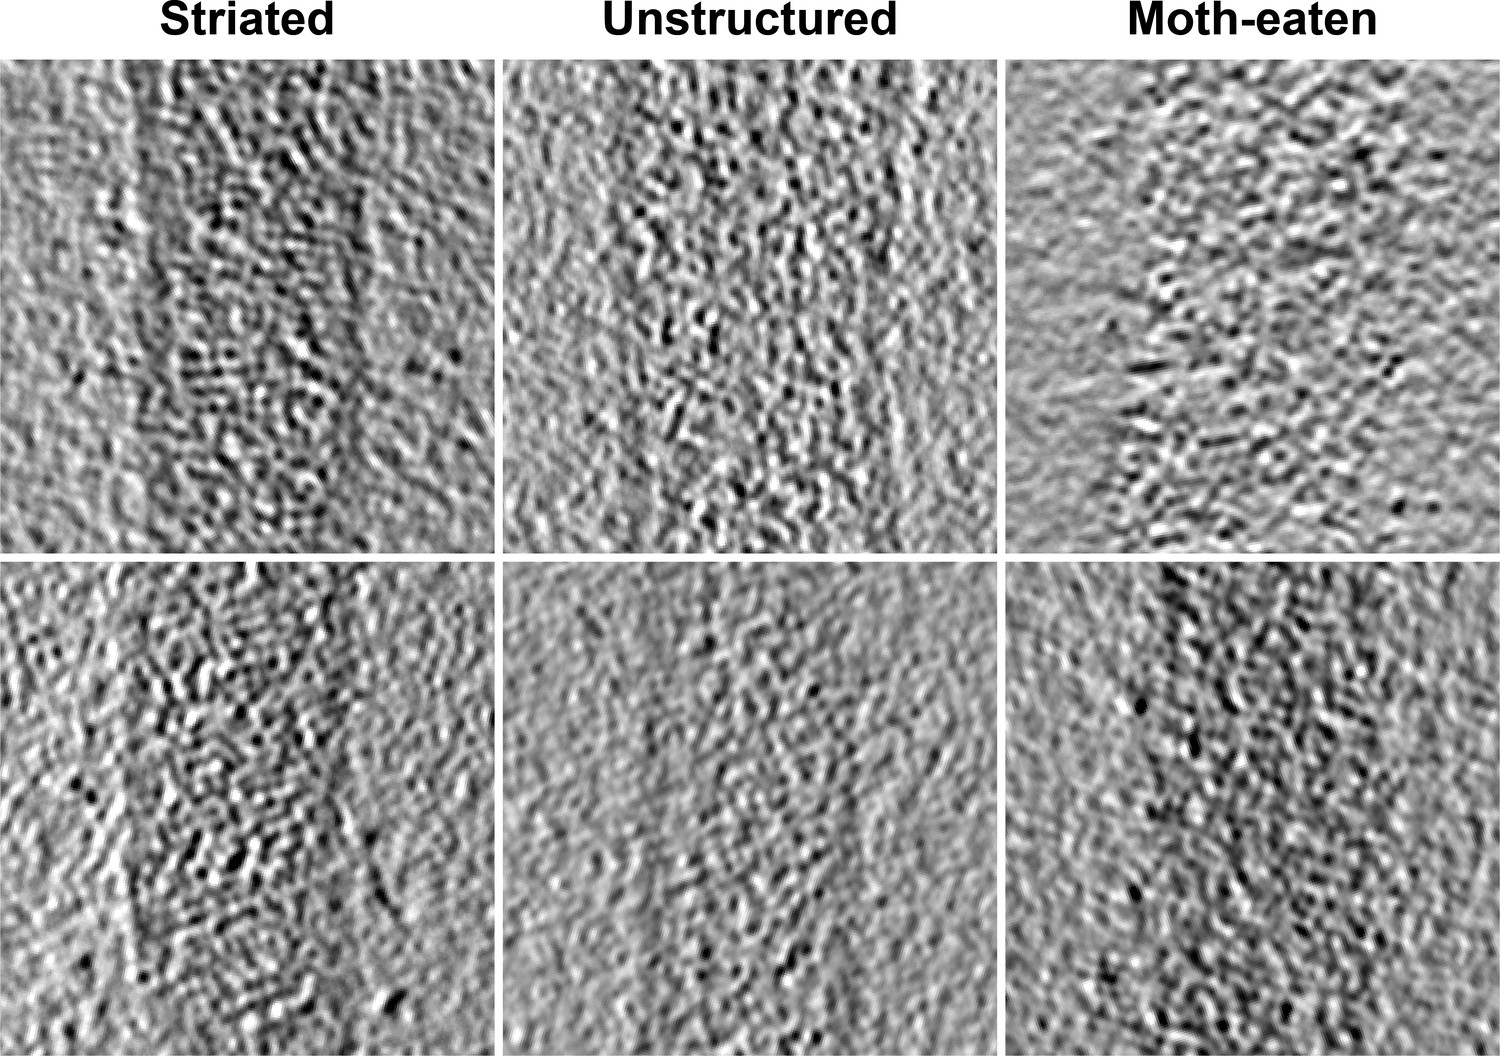
Tomographic slices of Ebola virus matrix layers.
Left column shows regions that show ordered VP40 striations, center column shows virions with intact membranes but unstructured matrix layer, and right column shows matrix layer of moth-eaten membranes.
Figure 4
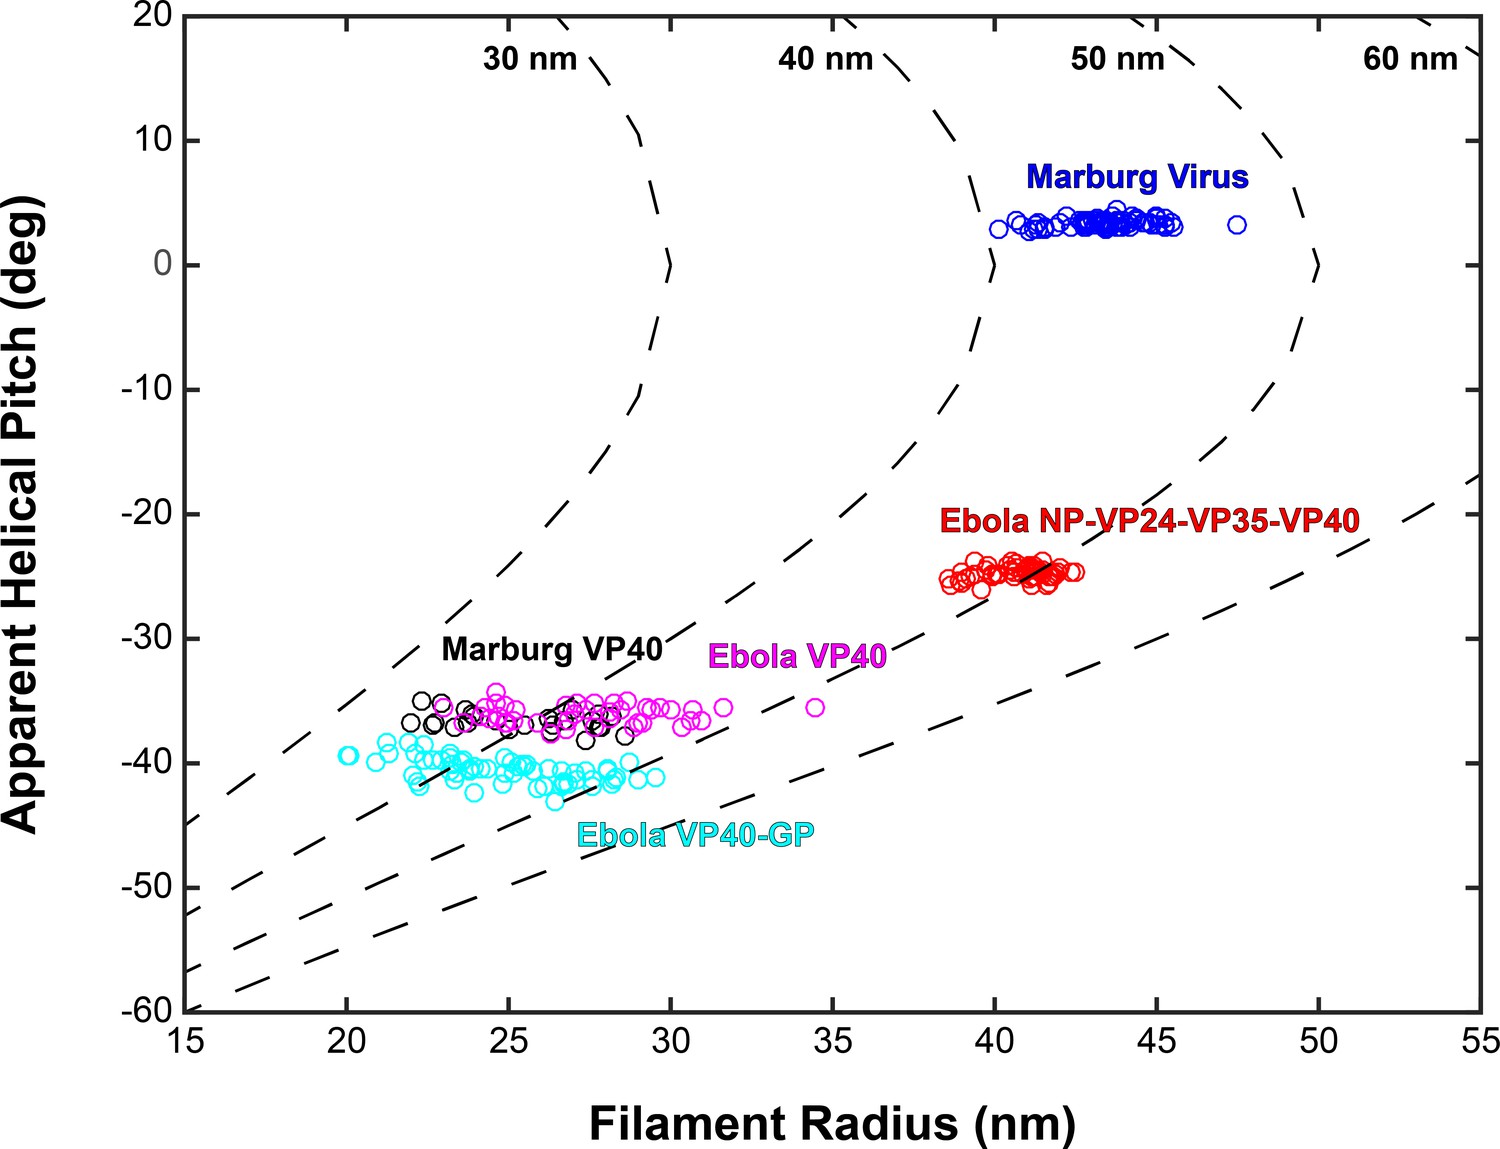
Plots of filament radii with respect to apparent helical pitch of linear VP40 chains.
Scatter points represent measurements for individual filaments. Dotted lines represent expected helical pitch for given radius, assuming a constant radius of curvature. The radii of curvature plotted from left to right are 30, 40, 50, and 60 nm.
Figure 5 with 1 supplement
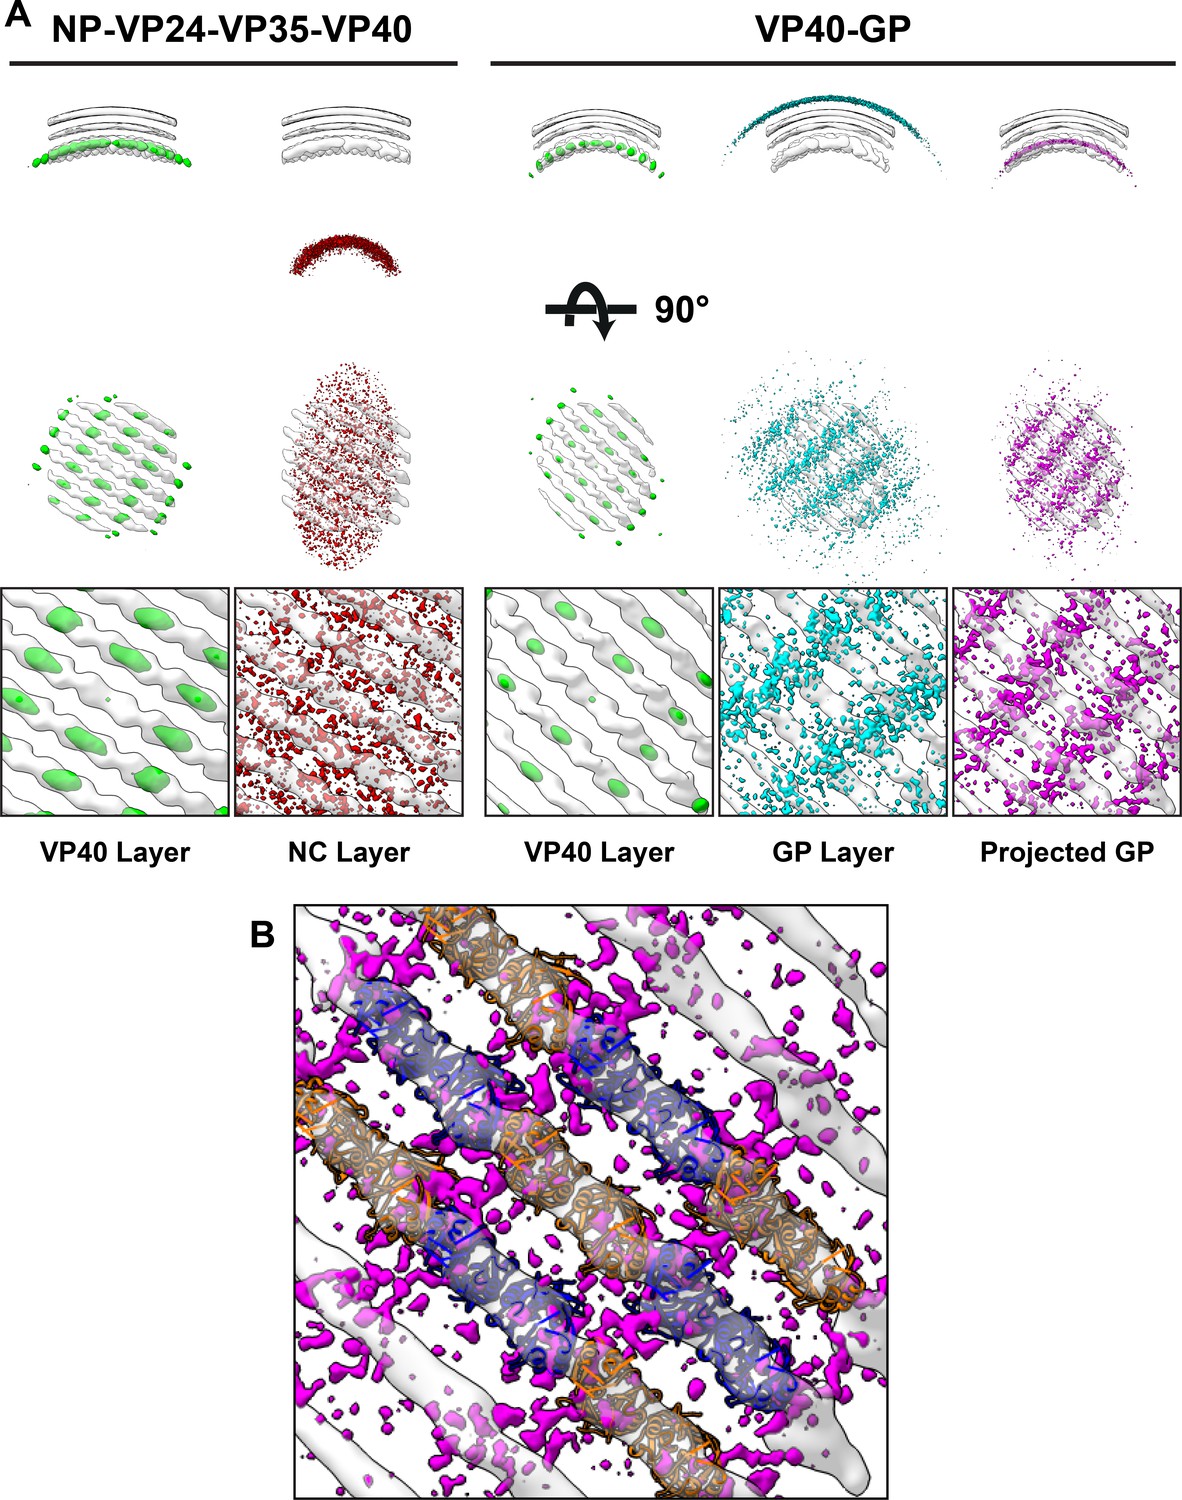
Neighbor density maps of Ebola VLPs.
(A) First two columns are from NP-VP24-VP35-VP40 VLPs while last three columns are from VP40-GP VLPs, respective subtomogram averaging structures are shown as transparent densities. Each neighbor density map is shown as a colored isosurface indicating the preferred location of the named protein relative to the VP40 positions. Top row shows cross-sectional views through the filaments, center row shows view from outside the filaments, and bottom row shows detailed views from center row. In center and bottom rows, membrane is removed from subtomogram averages for easier viewing. The projected GP layer contains the same data as the GP layer, but projected on to the VP40 radius along the direction of the GP stalks. (B) A zoomed-in view of the low projected GP panel, showing the preferred positions of GP relative to a model of the VP40 layer.
Figure 5—figure supplement 1

Structure of Ebola GP from eVP40-GP VLPs.
(A) Top and (B) side view of Ebola GP subtomogram average. (C) FSC plot of Ebola GP subtomogram average; arrow indicates resolution at FSC = 0.143. Deposited as emd-11665.
Figure 6
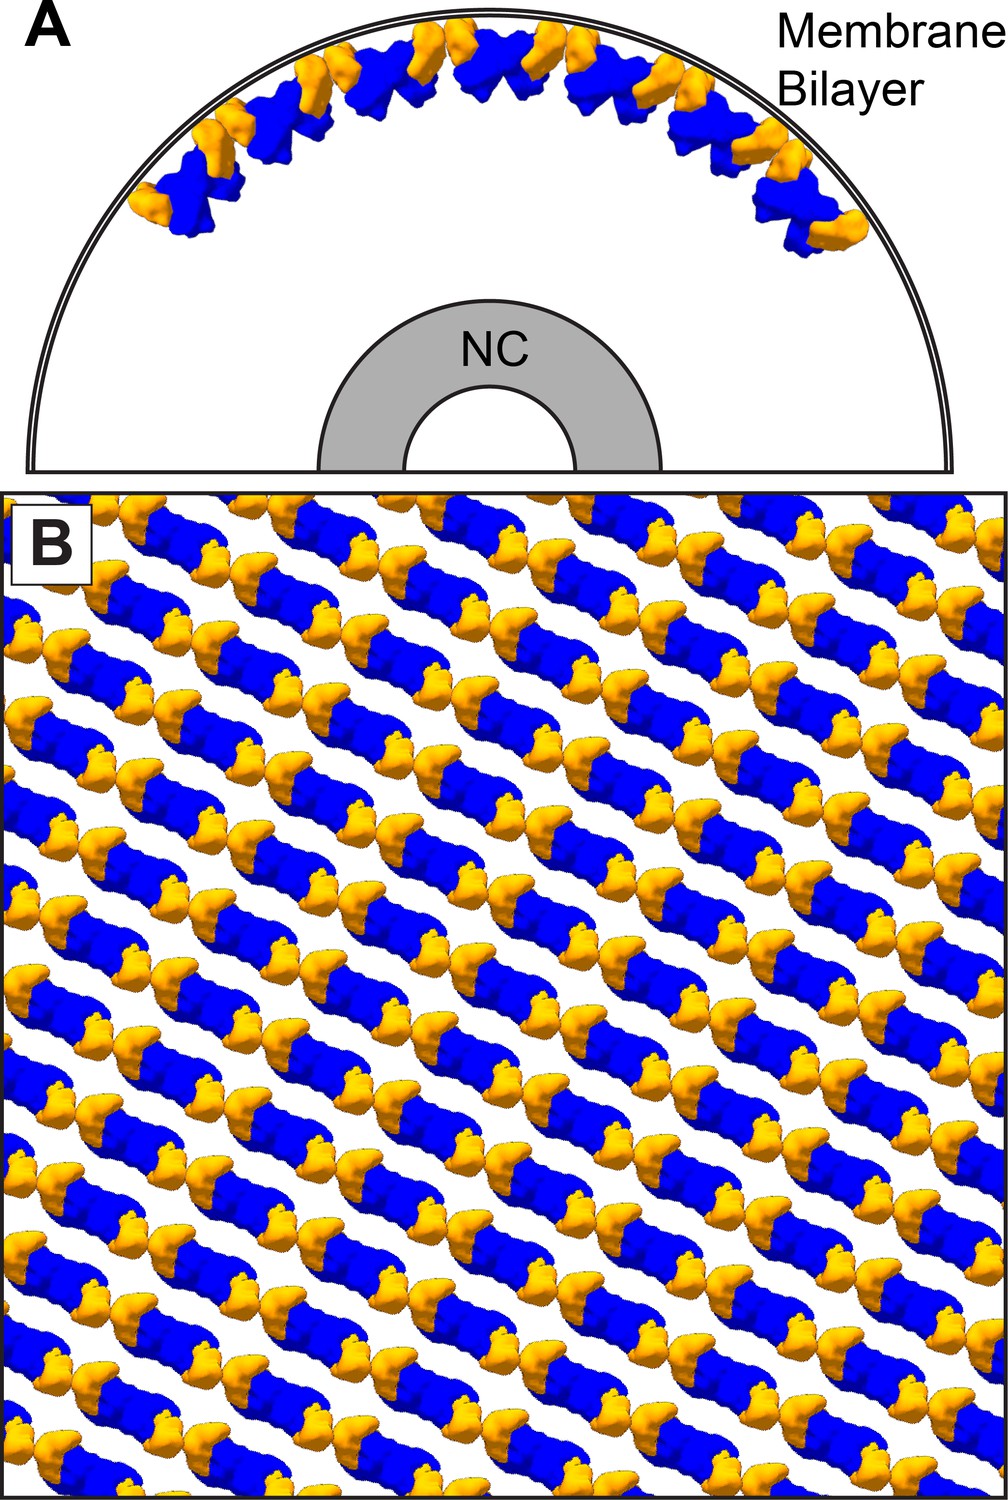
The dimer-chain matrix model.
VP40 NTDs are shown in blue and CTDs are shown in orange. Our dimer-chain model, where VP40 dimers form linear chains directly below the membrane surface and an unknown non-VP40 component tethers the NC to the matrix layer. (A) Shows a cross-section view, while (B) Shows a surface view directly below the membrane surface.
Tables
Table 1
Crystallographic data collection and refinement statistics.
| eVP40 P62 (7JZJ) | eVP40 P6422 (7JZT) | |
|---|---|---|
| Data collection | ||
| Space group | P62 | P6422 |
| Unit cell dimensions | ||
| a, b, c (Å) | 159.94, 159.94, 89.75 | 105.28, 105.28, 463.74 |
| α, β, γ (°) | 90, 90, 120 | 90, 90, 120 |
| Wavelength (Å) | 0.9795 | 0.9793 |
| Resolution range (Å)* | 79.97–2.46 (2.59–2.46) | 19.87–4.78 (4.86–4.78) |
| Observations* | 350132 (55437) | 95505 (4826) |
| Unique reflections* | 44360 (6904) | 12595 (607) |
| Completeness (%)* | 93.1 (99.8) | 99.5 (100) |
| Redundancy* | 7.9 (8.0) | 12.1 (13) |
| CC1/2* | 0.999 (0.443) | 0.99 (0.60) |
| I/σI* | 15.3 (0.90) | 7.5 (0.3) |
| Rmerge* | 0.092 (3.204) | 0.211 (8.301) |
| Rpim* | 0.052 (1.795) | 0.081 (3.187) |
| Anisotropy correction | ||
| Anisotropic resolution (Å) | 5.54 (0.89 a* - 0.45 b*) | |
| (direction) | 5.54 b* | |
| 3.60 c* | ||
| Resolution after correction* | 19.88–3.77 (4.30–3.77) | |
| No. of unique reflections* (ellipsoidal) | 6953 (376) | |
| I/σI (ellipsoidal)* | 12.3 (1.8) | |
| Completeness (ellipsoidal) (%)* | 90.8 (64.3) | |
| Refinement | ||
| No. of atoms | 7452 | 6795 |
| Rcryst/Rfree (%) | 24.7/25.5 | 31.5/34.5 |
| Ramachadran plot | ||
| Outliers (%) | 0.00 | 0.23 |
| Allowed (%) | 1.15 | 4.74 |
| Favored (%) | 98.85 | 95.03 |
| RMSD from ideal geometry | ||
| Bond length (Å) | 0.013 | 0.005 |
| Bond angles (°) | 1.96 | 1.05 |
| Clashscore | 1.52 | 8.99 |
| Average B factor | 89.32 | 185.96 |
| Refinement program | Phenix | Phenix |
-
*Numbers in parentheses correspond to the outer resolution shell.
Table 2
Unit cell and filament dimensions matrix layers.
| Specimen | Radius (nm) | a (Å) | b (Å) | θ (°) | α (°) |
|---|---|---|---|---|---|
| Ebola VP40 VLPs | 28 ± 6 (n = 42) | 82 | 47 | 80 | 35 |
| Ebola VP40-GP VLPs | 25 ± 3 (n = 60) | 80 | 48 | 81 | 42 |
| Ebola NP-VP24-VP35-VP40 VLPs | 41 ± 2 (n = 54) | 81 | 50 | 84 | 29 |
| Marburg Virus | 43 ± 2 (n = 75) | 78 | 60 | 54 | -1 |
| Marburg VP40 VLPs | 25 ± 2 (n = 25) | 83 | 46 | 77 | 35 |
Key resources table
| Reagent type (species) or resource | Designation | Source or reference | Identifiers | Additional information |
|---|---|---|---|---|
| Strain, strain background (Escherichia coli) | BL21(DE3) | Novagen Rosetta 2 (DE3) Merck (Darmstadt, Germany) | Competent cells | |
| Cell line (Homo-sapiens) | HEK-293T | American Type Culture Collection | VLP production | |
| Cell line (Homo-sapiens) | Huh7 | Japanese Collection of Research Bioresources | Marburg virus production | |
| Recombinant DNA reagent | pCAGGS-ZEBOV-NP (plasmid) | Hoenen et al., 2006 | ||
| Recombinant DNA reagent | pCAGGS-ZEBOV-VP24 (plasmid) | Hoenen et al., 2006 | ||
| Recombinant DNA reagent | pCAGGS-ZEBOV-VP35 (plasmid) | Hoenen et al., 2006 | ||
| Recombinant DNA reagent | pCAGGS-ZEBOV-VP40 (plasmid) | Hoenen et al., 2006 | ||
| Recombinant DNA reagent | pCAGGS-ZEBOV-GP (plasmid) | Hoenen et al., 2006 | ||
| Recombinant DNA reagent | pCAGGS-MARV-VP40 (plasmid) | Wenigenrath et al., 2010 | ||
| Recombinant DNA reagent | pTriex5-Strep-zVP40-WT | Bornholdt et al., 2013 | ||
| Recombinant DNA reagent | pTriex5-Strep-zVP40-R134A/I307R | Bornholdt et al., 2013 | ||
| Recombinant DNA reagent | pTriex5-Strep-zVP40-I307F | this manuscript | Plasmid construction is described in materials and methods | |
| Recombinant DNA reagent | pTriex5-Strep-zVP40-M305F/I307F | this manuscript | Plasmid construction is described in materials and methods | |
| Recombinant DNA reagent | pET46+zVP40-d43 | Bornholdt et al., 2013 | ||
| Virus | Marburg Virus | |||
| Software, algorithm | autoPROC | Vonrhein et al., 2018 | ||
| Software, algorithm | PHENIX | Adams et al., 2010 | ||
| Software, algorithm | COOT | Emsley et al., 2010 | ||
| Software, algorithm | SerialEM | Mastronarde, 2005 | ||
| Software, algorithm | MotionCorr | Li et al., 2013 | ||
| Software, algorithm | CTFFIND4 | Rohou and Grigorieff, 2015 | ||
| Software, algorithm | ctfphaseflip | Xiong et al., 2009 | ||
| Software, algorithm | IMOD | Kremer et al., 1996 | ||
| Software, algorithm | Amira | Thermo Fisher Scientific | ||
| Software, algorithm | EM-toolbox | Pruggnaller et al., 2008 | ||
| Software, algorithm | TOM-toolbox | Nickell et al., 2005 | ||
| Software, algorithm | AV3 | Förster et al., 2005 | ||
| Software, algorithm | dynamo | Castaño-Díez et al., 2012 | ||
| Software, algorithm | UCSF Chimera | Pettersen et al., 2004 |
Table 3
Data collection and image processing table.
| EBOV NP-VP24-VP35-VP40 (EMD-11660) | EBOV VP40 (EMD −11661) | EBOV VP40-GP (EMD −11662) | MARV (EMD −11663) | MARV VP40 (EMD −11664) | |
|---|---|---|---|---|---|
| Magnification | 81,000x | 81,000x | 81,000x | 81,000x | 81,000x |
| Voltage (kV) | 300 | 300 | 300 | 300 | 300 |
| Electron exposure (e-/ Å2) | ~100 | ~100 | ~100 | ~80 | ~100 |
| Defocus range (μm) | −2.0 to −4.5 | −2.0 to −4.5 | −2.0 to −4.5 | −2.0 to −4.5 | −2.0 to −4.5 |
| Detector | Gatan Quantum K2 | Gatan Quantum K2 | Gatan Quantum K2 | Gatan Quantum K2 | Gatan Quantum K2 |
| Energy filter | Yes | Yes | Yes | Yes | Yes |
| Slit width (eV) | 20 | 20 | 20 | 20 | 20 |
| Tilt Range (min/max, step) | −60°/60°, 3° | −60°/60°, 3° | −60°/60°, 3° | −60°/60°, 3° | −60°/60°, 3° |
| Pixel Size (Å) | 1.78 | 1.78 | 1.78 | 1.78 | 1.78 |
| Tomograms (used/acquired) | 52/64 | 39/42 | 55/73 | 76/82 | 34/35 |
| Filaments | 54 | 43 | 65 | 93 | 34 |
| Symmetry | C2 | C2 | C2 | C2 | C2 |
| Final subtomograms (no.) | 59580 | 20352 | 106793 | 75212 | 42938 |
| Map resolutions (FSC = 0.143) | 10.2 Å | 9.8 Å | 9.9 Å | 9.6 Å | 10.8 Å |
Additional files
Download links
A two-part list of links to download the article, or parts of the article, in various formats.
Downloads (link to download the article as PDF)
Open citations (links to open the citations from this article in various online reference manager services)
Cite this article (links to download the citations from this article in formats compatible with various reference manager tools)
Ebola and Marburg virus matrix layers are locally ordered assemblies of VP40 dimers
eLife 9:e59225.
https://doi.org/10.7554/eLife.59225


