Learning speed and detection sensitivity controlled by distinct cortico-fugal neurons in visual cortex
- Center for Neural Circuits and Behavior, Neurobiology Section and Department of Neuroscience, University of California, San Diego, United States
- Department of Physiology, University of California, San Francisco, United States
- Howard Hughes Medical Institute, University of California, San Francisco, United States
Figures
Figure 1 with 6 supplements
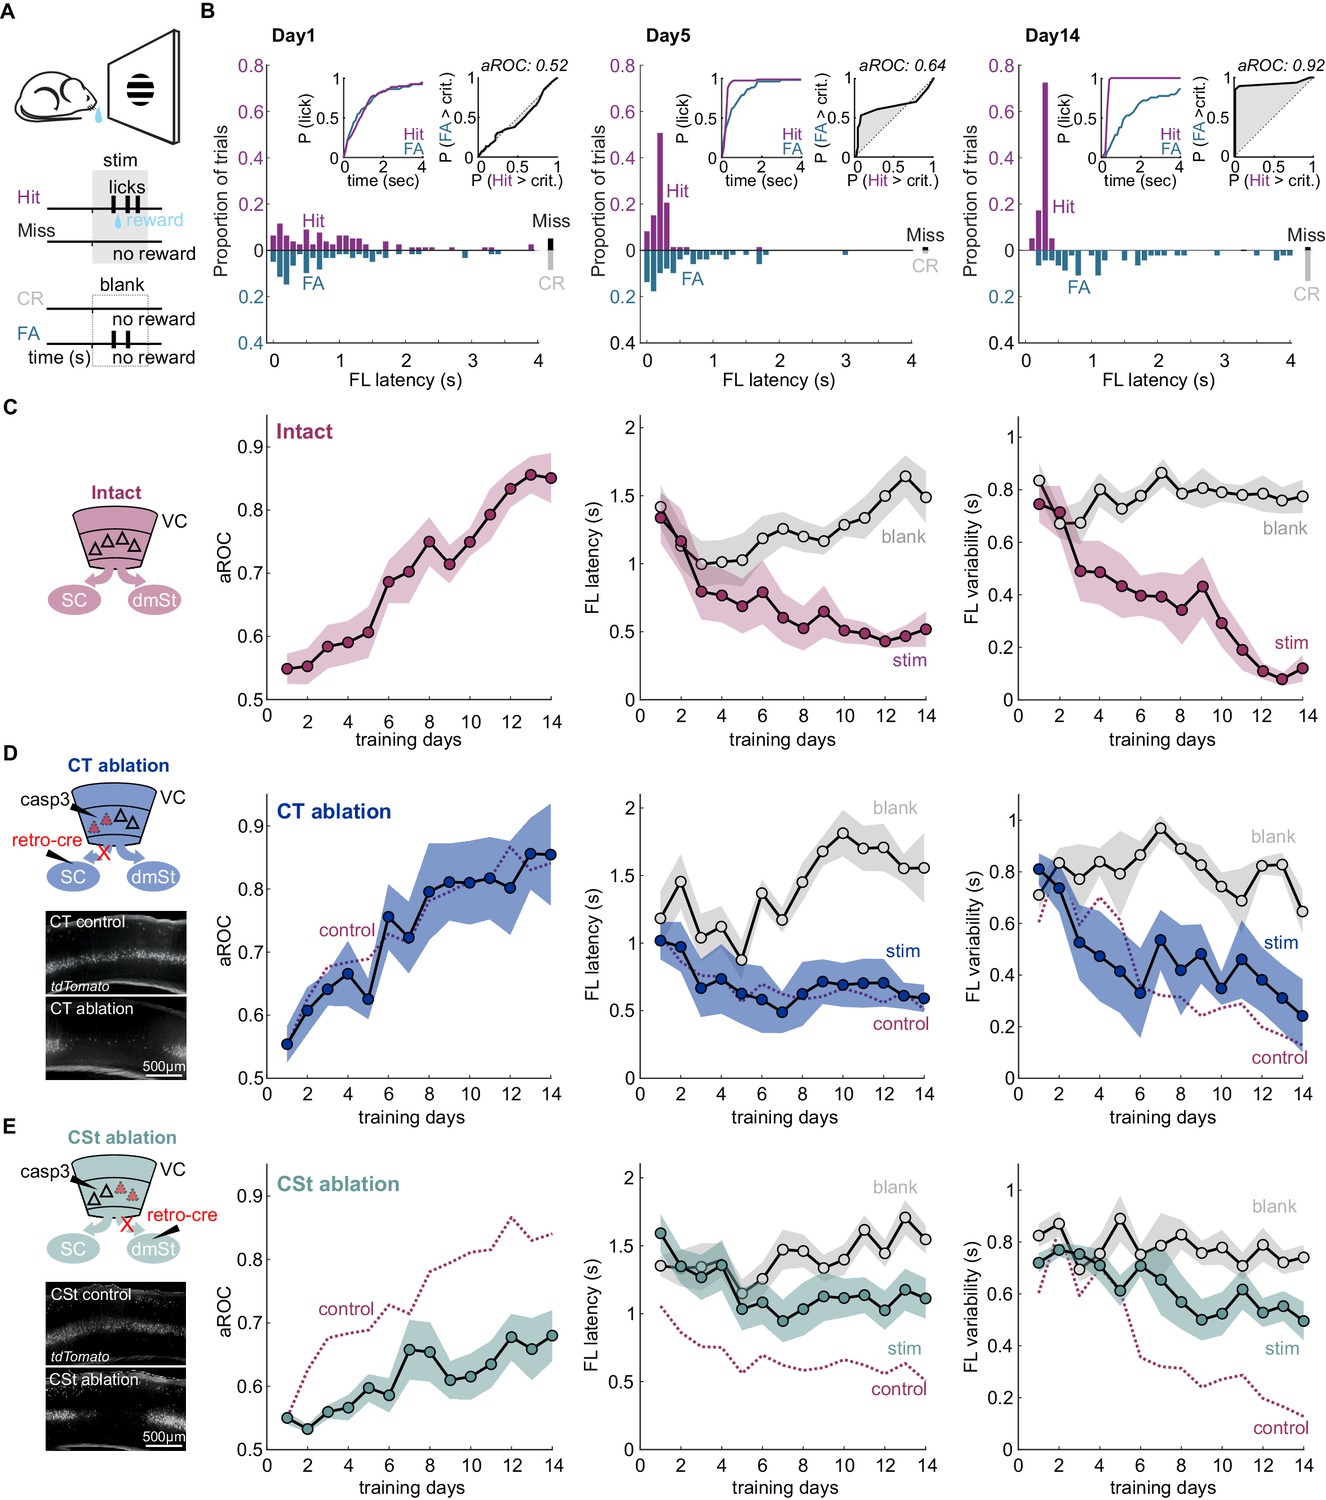
Ablation of cortico-striatal neurons impairs learning of a simple visual detection task.
(A) Schematic of behavioral setup: mice have to lick in response to a visual stimulus to obtain reward (Hit) and omit licking on blank trials (Correct Rejection: CR). False Alarms (FA) and misses (Miss) are not punished. (B) Data from example mouse on days 1, 5, and 14 of training. First lick (FL) latency in response to stimulus (Hit) and a corresponding blank period (FA) during the 4 s response period. The proportion of misses (Miss) and CRs is shown on the right of each plot. Inset: Left: Cumulative probability of licking for stimulus trials (Hit) and corresponding blank periods (FA). Right: Area under the Receiver Operating Characteristic Curve (aROC) for first lick latency distributions on stimulus trials (Hit) and during corresponding blank periods (FA) relative to criterion (crit.). Note that by day 5 the distribution of FL latencies on stimulus trials (Hit) is already shifted toward shorter intervals as compared to that on blank trials (FA) indicating faster stimulus-guided responses on Hit trials., The probability of a FA increases gradually as time elapses. (C) Left: schematic of visual cortex (VC) with two intact cortico-fugal pathways to the superior colliculus (SC) and dorsomedial striatum (dmSt). Right: Population average learning curves over 14 days of training (N = 8 mice). aROC (left), FL latency for stimulus and blank trials (middle), FL variability for stimulus and blank trials (right; see Materials and methods). Data plotted as mean ± SEM. (D) Left: Schematic of viral approach to ablate cortico-tectal (CT) neurons. Experiments were performed in Ai14 animals to conditionally express td-Tomato in neurons infected with retroAAV-Cre (retro-cre). Red triangles with dashed borders are retrogradely transfected neurons conditionally expressing td-Tomato and Caspase 3. Below: Fluorescence microscopy image of a control animal (not injected with AAV-Casp3 in VC; top) and of an animal injected with AAV Casp3 in VC (bottom). Note the strong reduction in fluorescence in layer five at the injection site. Right: Population average learning curves as in (C) but for mice in which the CT pathway was ablated before training onset (N = 5 mice). The dotted line is data from control mice receiving an injection of retroAAV-Cre but not AAV-Casp3 (N = 7; Figure 1—figure supplement 6). (E) As in (D) but for mice with ablation of cortico-striatal (CSt) neurons (N = 5 mice). The dotted line is data from control mice, as in (D). Data plotted as mean ± SEM. Note the learning impairment in CSt-ablated animals.
-
Figure 1—source data 1
Behavioral performance measurements as a function of training days for intact animals, CT-ablated, and CSt-ablated animals.
- https://cdn.elifesciences.org/articles/59247/elife-59247-fig1-data1-v2.xlsx
Figure 1—figure supplement 1
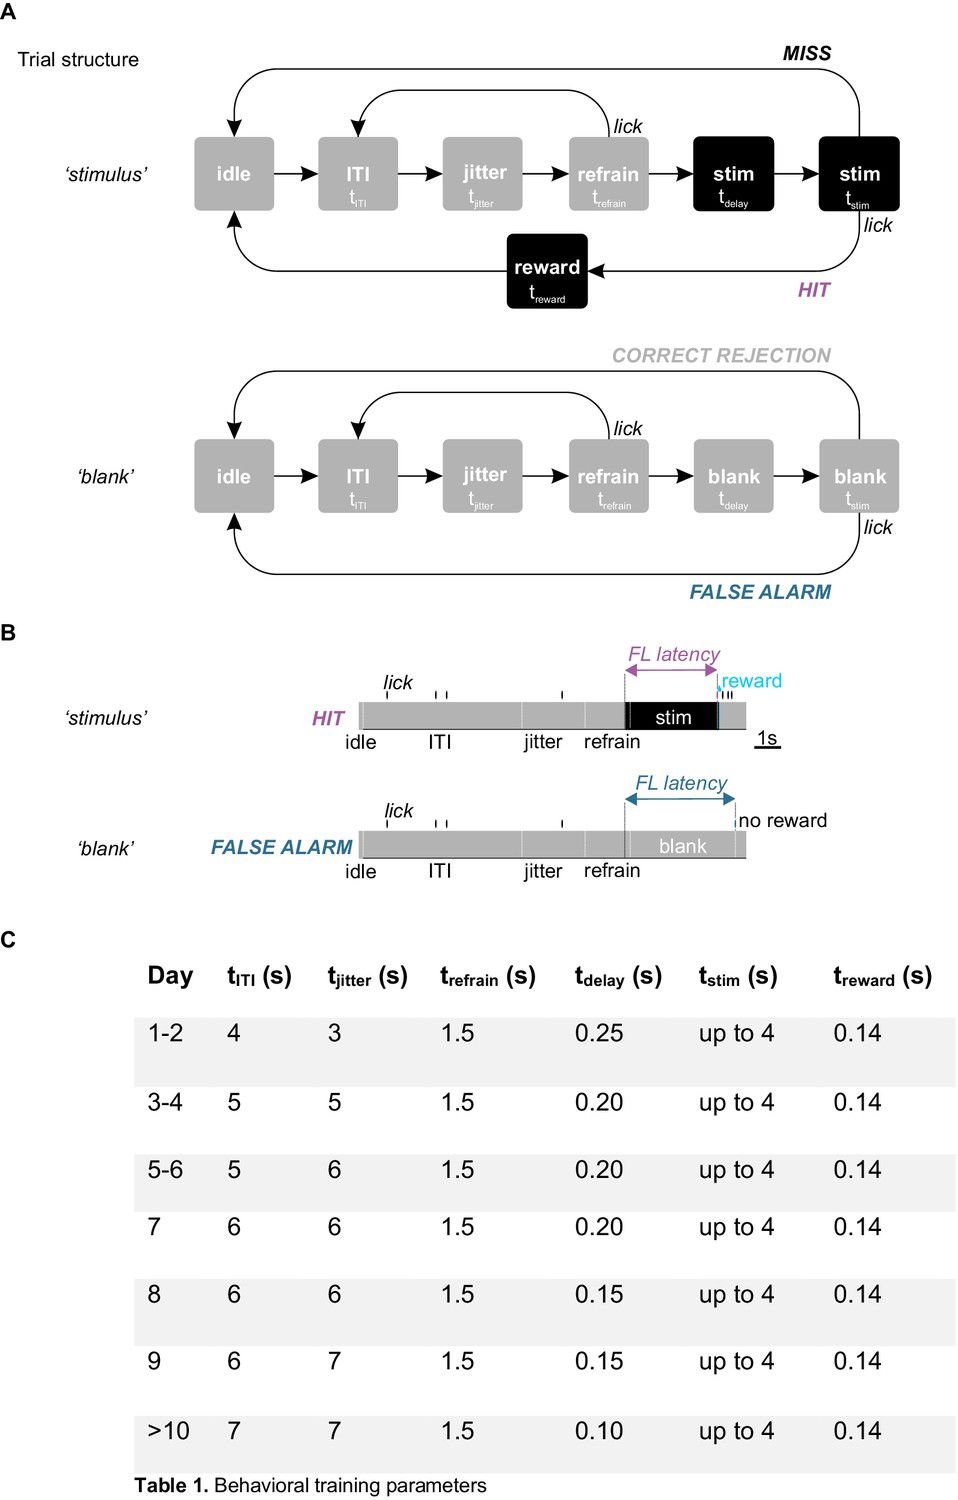
Trial structure of the detection task.
(A) Schematic of trial structure. Gray and black squares indicate periods during which the monitor is gray or during which a stimulus is presented, respectively. The duration of each period is indicated in (C). For some of the periods, the duration varied as training progressed. During stimulus trials (top), the stimulus is continuously presented throughout two concatenated periods, ‘tdelay’ followed by ‘tstim’. tdelay marks the onset of stimulus presentation and lasts for a brief period of time (100–250 ms, see table in (C)) during which a lick is not considered a response. tstim, is the response period and lasts until the first lick (i.e. the monitor turns gray 140 ms after the first lick) but not longer than 4 s. Blank trials (bottom) had the same temporal structure as stimulus trials but the monitor remained gray throughout. Hits or False Alarms were licks occurring during tstim in the presence of a stimulus or of a blank, respectively. False Alarms were not subjected to any punishment. Only licks during the refrain period (trefrain) caused the reset of the trial. The period between trial as was defined by sum of a fixed inter trial interval (tITI) and a variable period (tjitter) that was randomly drawn from a uniform distribution for each trial (see Materials and methods). (B) Definition of first lick latency. On stimulus trials the first lick latency is the time from stimulus onset (i.e. onset of tdelay) to first lick (top; the first lick has to occur within the 4 s response window). On blank trials (bottom), the first lick latency is determined in the same manner, yet the stimulus is omitted, that is the monitor remains gray throughout the trial. (C) Timing. The duration of the above-described periods varied as a function of training. The specific times used on a given training day are indicated in Table 1.
Figure 1—figure supplement 2
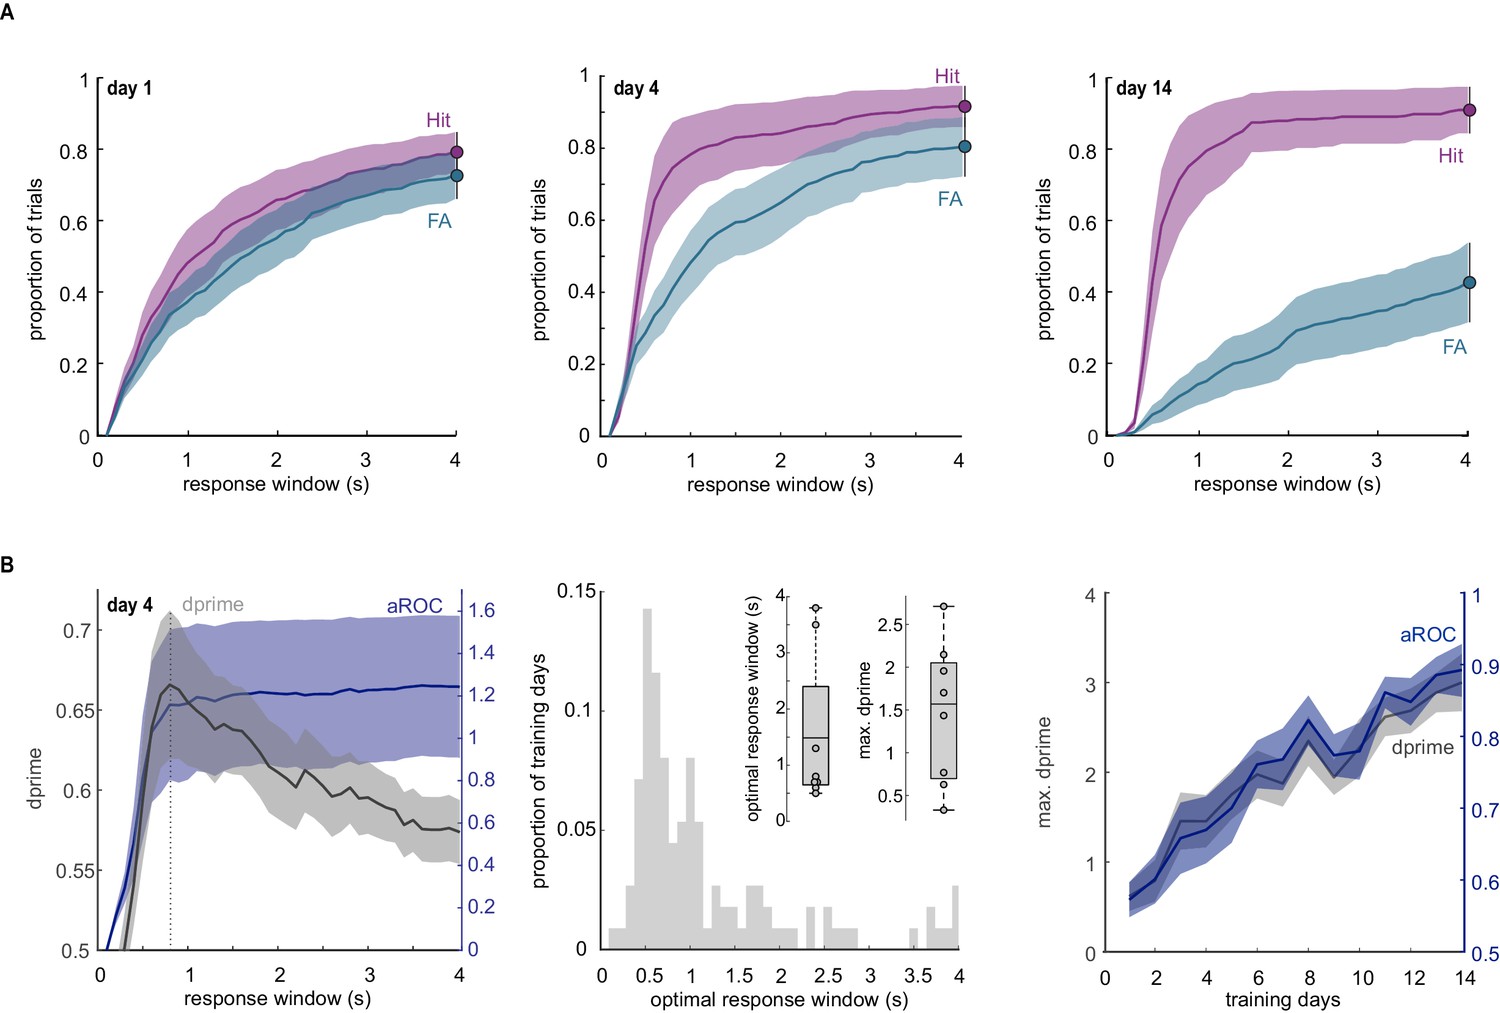
Comparison of aROC analysis with probability of licking and d-prime.
(A) Fractions of Hits (purple) and False Alarms (FA; blue) as a function of elapsed time from the onset of the response window for training days 1, 4, and 14. Left: On the first day of training, the probability of a lick is similar on stimulus and blank trials throughout the response window. Middle: On day 4, the probability of Hits is higher than that of FAs early in the response window, yet they eventually become similar toward the end of the response window indicating a lack of inhibitory control of licking at this early stage of training. Right: By day 14, mice exhibit increased levels of inhibitory control throughout the response window while maintaining a rapid first licks on stimulus trials. Data plotted as mean ± SEM; N = 8 mice. (B) Comparison of aROC with d-prime. Left: Population average of aROC (purple) and d-prime (gray) as a function of the time elapsed from the onset of the response window for training day 4. Note that d-prime progressively increases to reach a maximal value (max. d-prime) at a specific time point from the onset of the response window (the optimal response window; dashed line) and then decreases again. In contrast, aROC plateaus after reaching its maximal value. Data plotted as mean ± SEM; N = 8 mice. Middle: Distribution of optimal response windows on each training day across 14 days of training and eight mice. Note the broad distribution of the optimal response window across training days and mice. Inset: boxplot of the mean optimal response window and maximal d-prime on day 4 of training (n = 8 mice). The box plot illustrates mean, first, and third quartiles. Right: Population average of aROC for the full response periods of 4 s (blue) versus the population average of d-prime based on the optimal response window (max. d-prime). Data plotted as mean ± SEM. Note that, over the first two weeks of training, the learning curve based on aROC across the full response window overlaps with that of maximal d-prime. After 2 weeks of training, a d-prime averaging more than 3, indicates that, also based on this metric, the animals are proficient at the task.
-
Figure 1—figure supplement 2—source data 1
Comparison of performance metrics including aROC, probability of licking and d-prime.
- https://cdn.elifesciences.org/articles/59247/elife-59247-fig1-figsupp2-data1-v2.xlsx
Figure 1—figure supplement 3

CT and CSt pathways originate from two separate neuronal populations.
(A) Left: Schematic illustration of the injections of the retrograde tracer CTB Alexa 488 in SC (to label the CT projection neurons) and of CTB Alexa 643 in dmSt (to label the CSt projection neurons). Right: Maximum intensity projection of the confocal stack of a coronal section through primary visual cortex. The coronal section was counterstained for the neuronal marker NeuN (Alexa 594). (B) Left: Depth distribution of CT (pink) and CSt-projection (green) neurons in an example animal. Right: Population average histogram of depth distributions of CT and CSt projection neurons (CSt: 662 cells, CT: 875 cells N = 3 mice). Inset: fraction of single- and double-labeled neurons.
-
Figure 1—figure supplement 3—source data 1
Histological measurements.
Depth distribution of CT and CSt neurons in VC and overlap of the two-cell populations.
- https://cdn.elifesciences.org/articles/59247/elife-59247-fig1-figsupp3-data1-v2.xlsx
Figure 1—figure supplement 4

Comparing CTB with retroAAV for retrograde labeling.
(A) Schematic illustration of viral efficiency test. Co-injection of CTB Alexa 488 and retroAAV-Cre in R26 LSL H2B mCherry mice. Uptake of retroAAV-Cre leads to the expression of mCherry in the nucleus. (B) Left: Maximum intensity projection of the confocal stack of a coronal section through layer 5 of primary visual cortex. Right: Proportion of CTB-labeled cells in L5 that co-express nuclear mCherry. Note that the majority of CTB-labeled cells is also expressing nuclear mCherry. The majority of CTB-labeled cells co-expressed nuclear mCherry, indicating that the viral approach was highly efficient in retrogradely labeling cortico-fugal neurons.
Figure 1—figure supplement 5
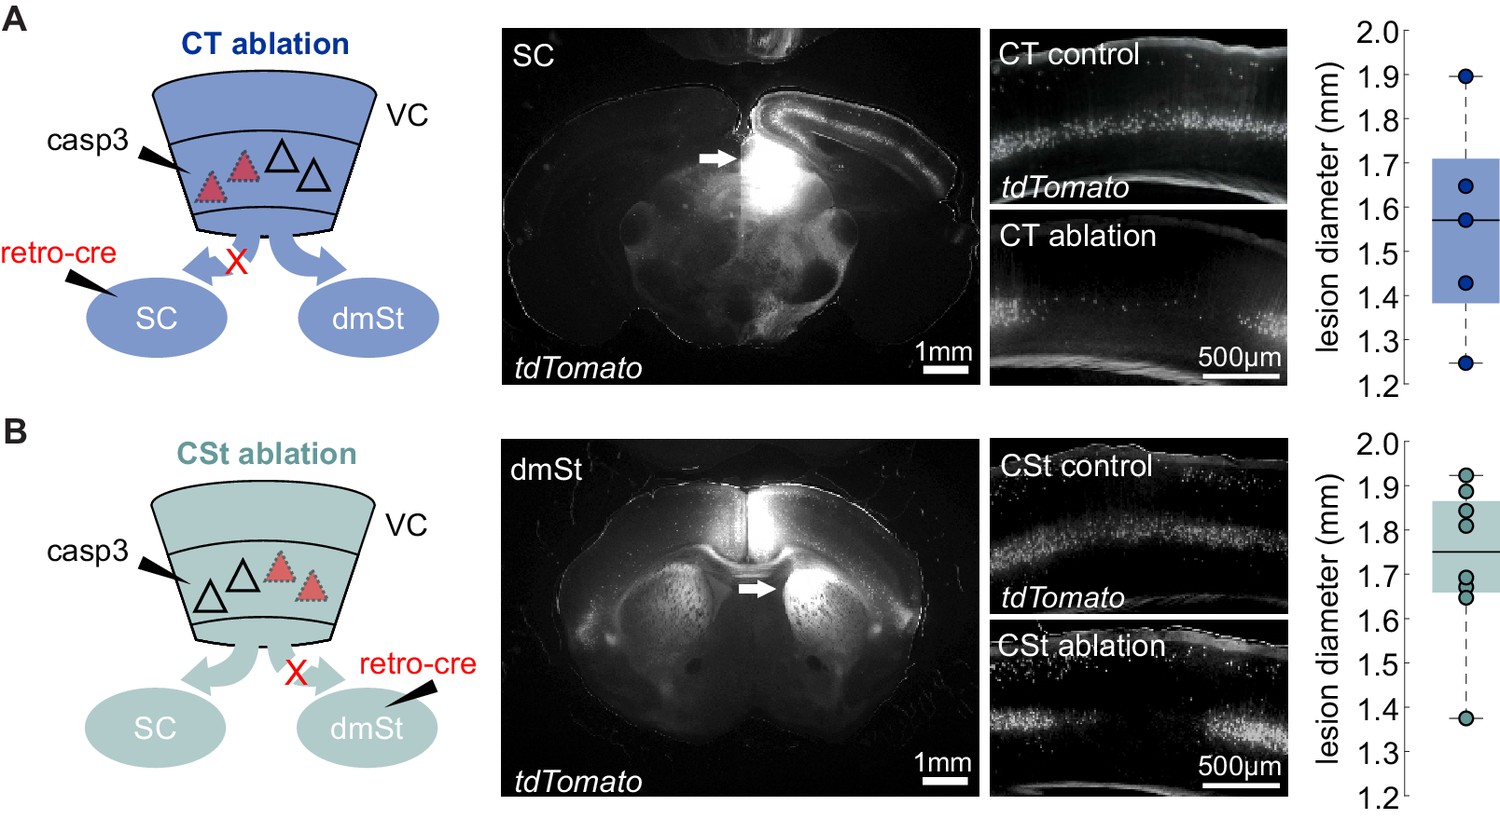
Histology of cortico-fugal pathway ablations.
(A) Left: Schematic illustration of CT Lesion as in Figure 1D. Middle: Example injection targeting of retroAAV-Cre in the right SC and the corresponding labeling of CT neurons in VC in under control conditions (CT control) vs. upon ablation of CT neurons (CT-ablation). Right: Lesion size reported as mean feret diameter. Each data point is the average medio-lateral extent of the cortical lesion of one animal. The box plot illustrates median, first, and third quartiles. (B) as in (A) but for the CSt pathway.
-
Figure 1—figure supplement 5—source data 1
Histological data for CSt ablation and CT ablation.
- https://cdn.elifesciences.org/articles/59247/elife-59247-fig1-figsupp5-data1-v2.xlsx
Figure 1—figure supplement 6
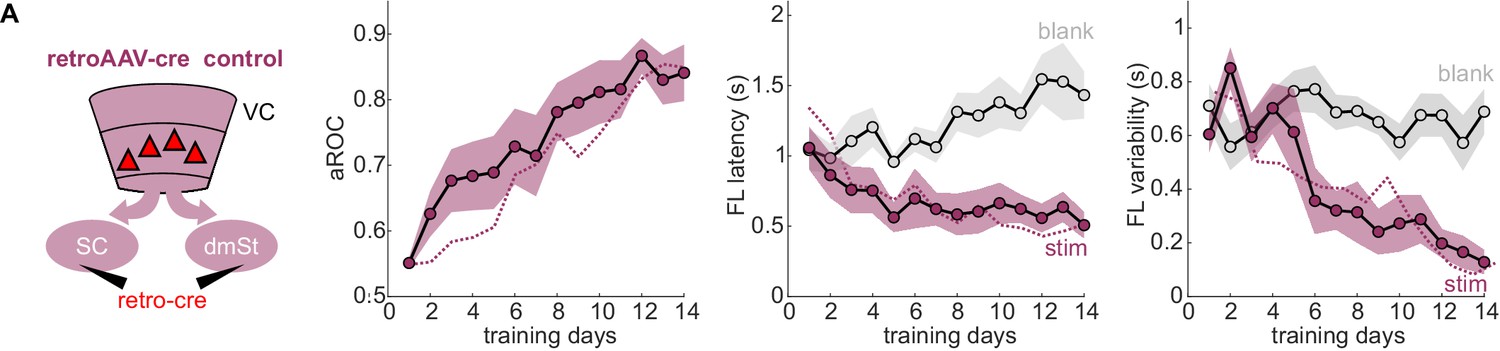
RetroAAV-Cre does not impair learning.
Left: Schematic illustration of viral control experiment: retroAAV-Cre virus was either injected in the SC or dmSt (N = 7 [4 SC injected mice and 3 dmSt injected mice]). Right: Population average learning curves of retroAAV-Cre control mice over 14 days of training. aROC (left), first lick (FL) latency for stimulus and blank trials (middle), FL variability for stimulus and blank trials (right; see Materials and methods). Data plotted as mean ± SEM. The purple dotted line is data from intact animals (from Figure 1C) for comparison.
-
Figure 1—figure supplement 6—source data 1
Behavioral performance measurements for animals injected with retroAAV-Cre only.
- https://cdn.elifesciences.org/articles/59247/elife-59247-fig1-figsupp6-data1-v2.xlsx
Figure 2 with 1 supplement
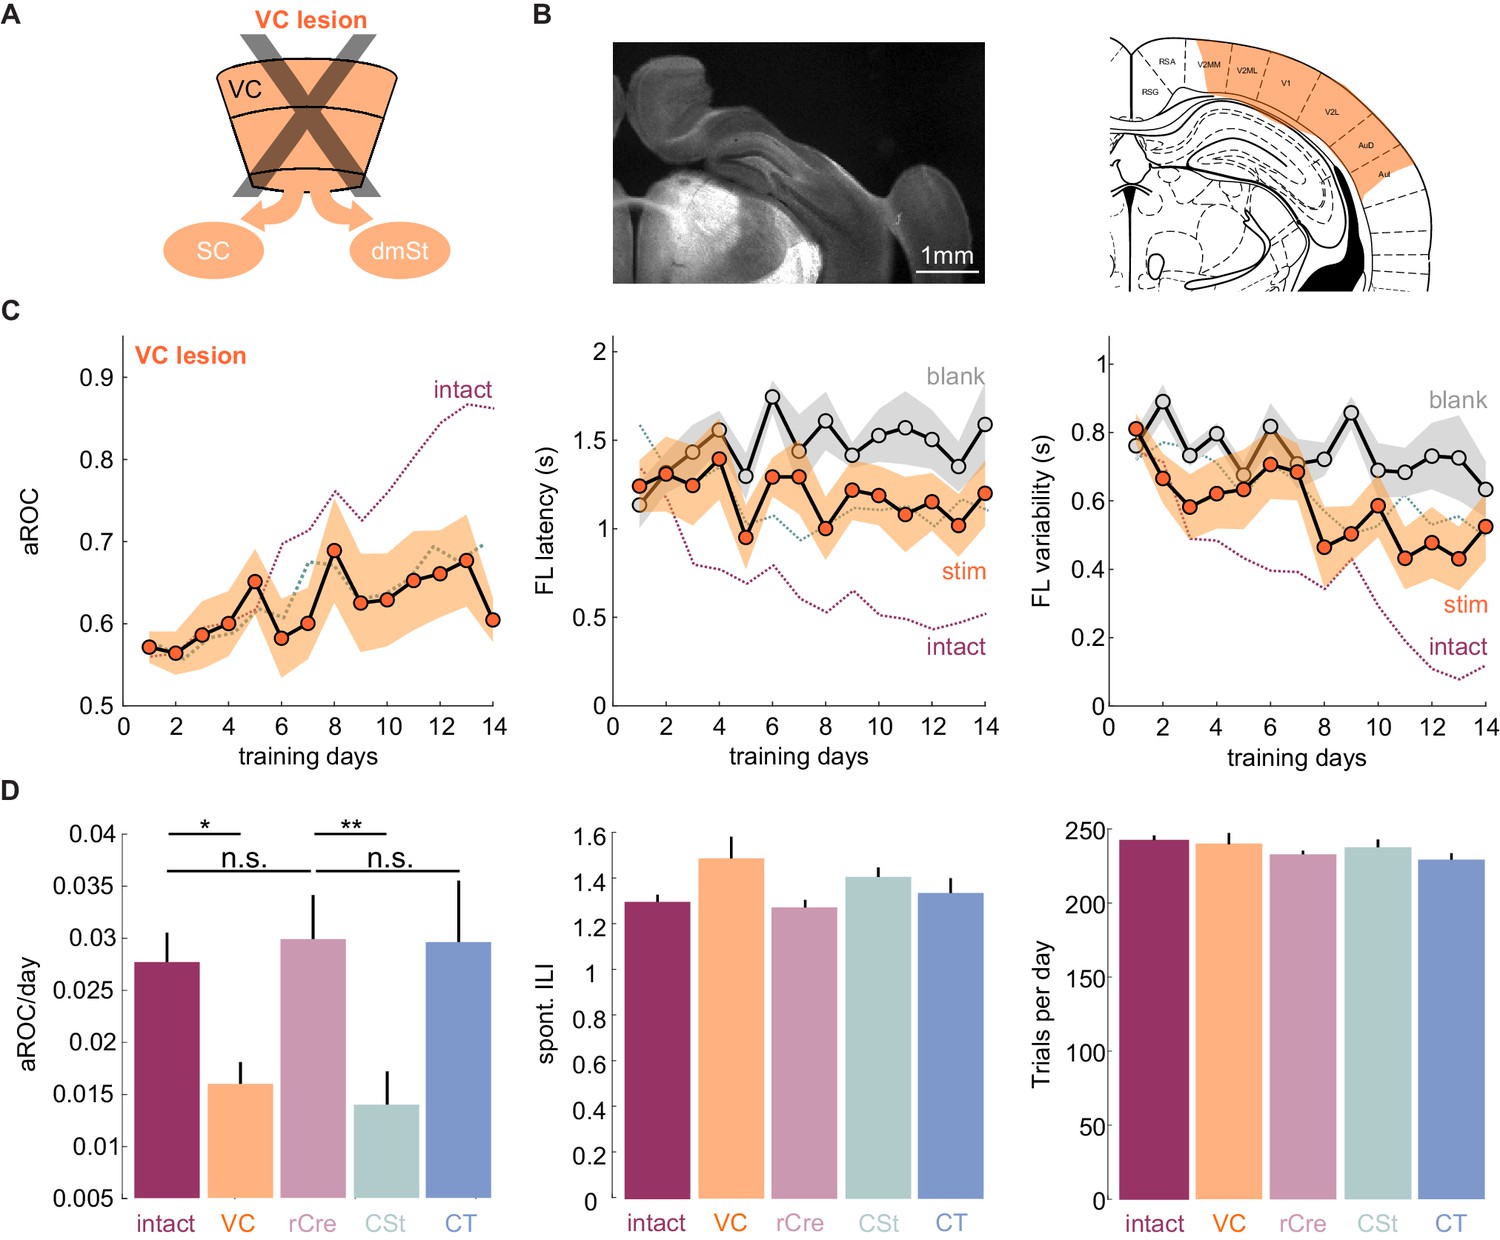
VC lesions recapitulate learning impairment induced by the ablation of cortico-striatal neurons.
(A) Schematic of surgical ablation of visual cortex (VC). (B) Left: Coronal sections from an example mouse illustrating the surgical ablation of the right VC. Right: Corresponding coronal plane from the Paxinos mouse brain atlas with the spread of the lesion in orange shading. (C) Population average learning curves over 14 days of training for mice in which VC was surgically ablated before the onset of training (N = 8 mice). The purple dotted line is data from intact animals (from Figure 1C) for comparison. Green dotted line is data from CSt-ablated animals (from Figure 1E) for comparison. Data plotted as mean ± SEM. Note that the VC lesion recapitulates the learning impairment of CSt-ablated mice. (D) Left: Population average slope aROC/day across experimental groups. Intact (gray), VC lesion (VC: orange), retroAAV-Cre only (rCre: purple), CSt-lesion (CSt:aqua), CT-lesion (CT: blue). Middle: Population average of spontaneous licking (ILI: inter lick time interval) behavior during the gray screen period of the inter trial interval (ITI). Right: Population average number of trials per training session. Data plotted as mean ± SEM.
-
Figure 2—source data 1
Behavioral performance measurements as a function of training days during task acquisition for VC-lesioned animals and comparison of behavioral metrics across experimental groups.
- https://cdn.elifesciences.org/articles/59247/elife-59247-fig2-data1-v2.xlsx
Figure 2—figure supplement 1

Histology of cortical lesions.
Left: Schematic of cortical ablation by surgical of VC. Middle: Three coronal sections from an example mouse illustrating the surgical ablation of the right VC. The lesioned area (orange shaded area) is overlaid with outlines of the corresponding coronal plane from the Paxinos mouse brain atlas (same mouse as shown in Figure 2B). Right: Lesion size reported as mean feret diameter. Each data point is the average medio-lateral extent of the cortical lesion of one animal. The box plot illustrates median, first, and third quartiles.
-
Figure 2—figure supplement 1—source data 1
Histological data to characterize the VC lesion.
- https://cdn.elifesciences.org/articles/59247/elife-59247-fig2-figsupp1-data1-v2.xlsx
Figure 3
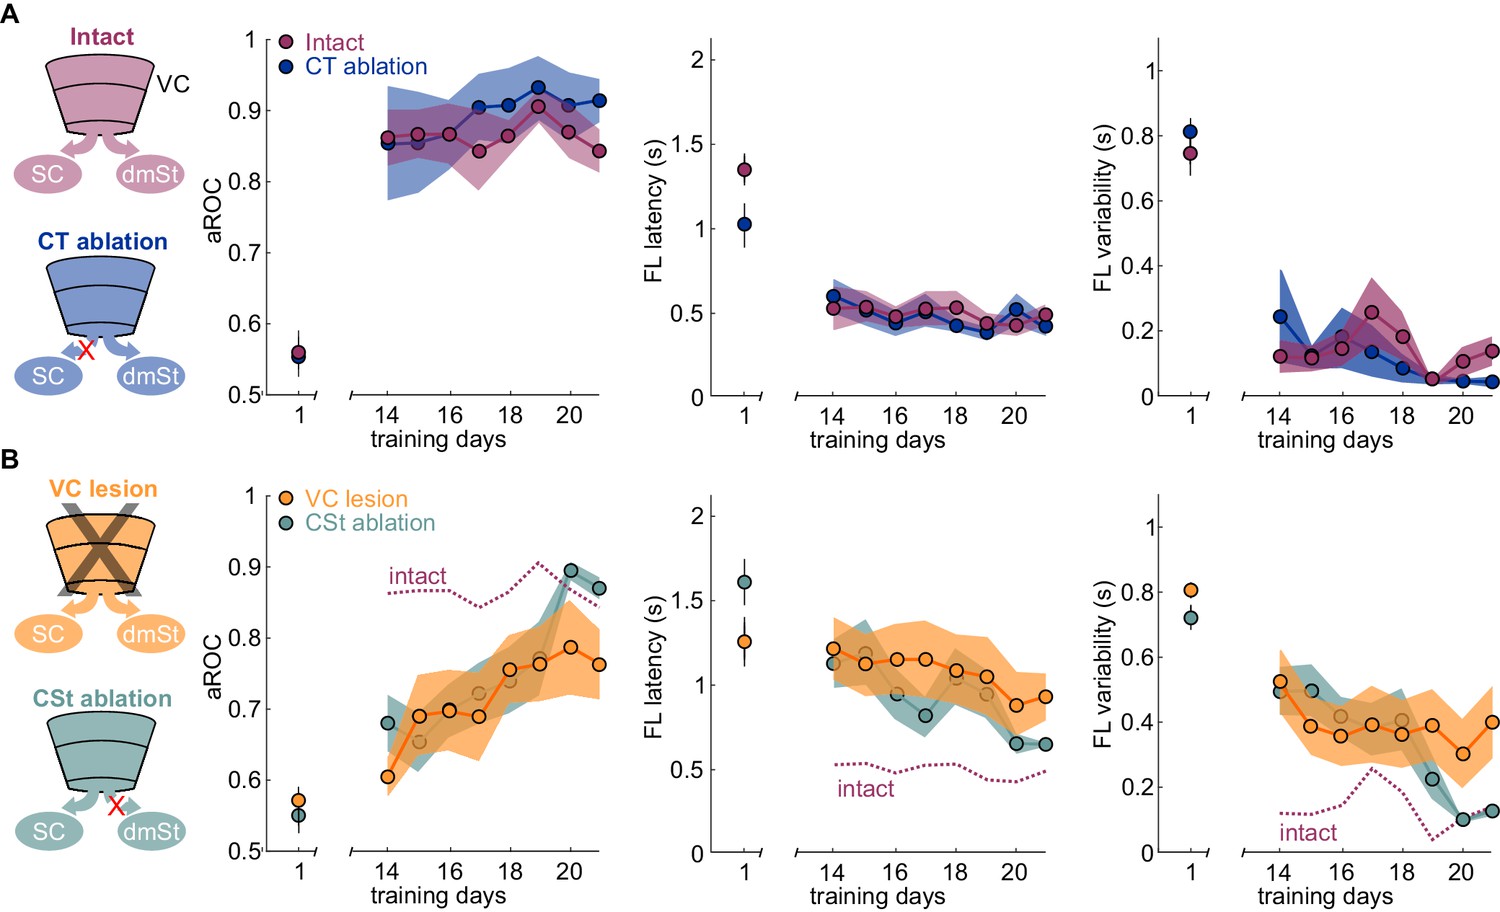
Ablation of cortico-striatal neurons reduces learning speed.
(A) Left: Schematic of experimental groups. Right: Population average learning curves during the third week of training for intact (N = 8 mice) and CT-ablated mice (N = 5 mice). The first data point on the left of each graph is the value on the first day of training. aROC (left), FL latency for stimulus trials (middle) and FL variability for stimulus trials (right). Data plotted as mean ± SEM (N = 8 mice). Note that aROC, FL latency and variability have plateaued around day 14. (B) As above but for VC (N = 8 mice) and CSt-ablated (N = 8 mice) mice. The purple dotted line is data from intact animals (from A) for comparison. Note that over the third week of training, the aROC for both VC and CSt-ablated animals progressively approaches the performance levels of intact animals. By day 21, the aROC values are no longer significantly different across groups. The First lick latency and first lick variability also tend to decrease over the same period.
-
Figure 3—source data 1
Behavioral performance measurements throughout the third week training across experimental groups.
- https://cdn.elifesciences.org/articles/59247/elife-59247-fig3-data1-v2.xlsx
Figure 4 with 1 supplement
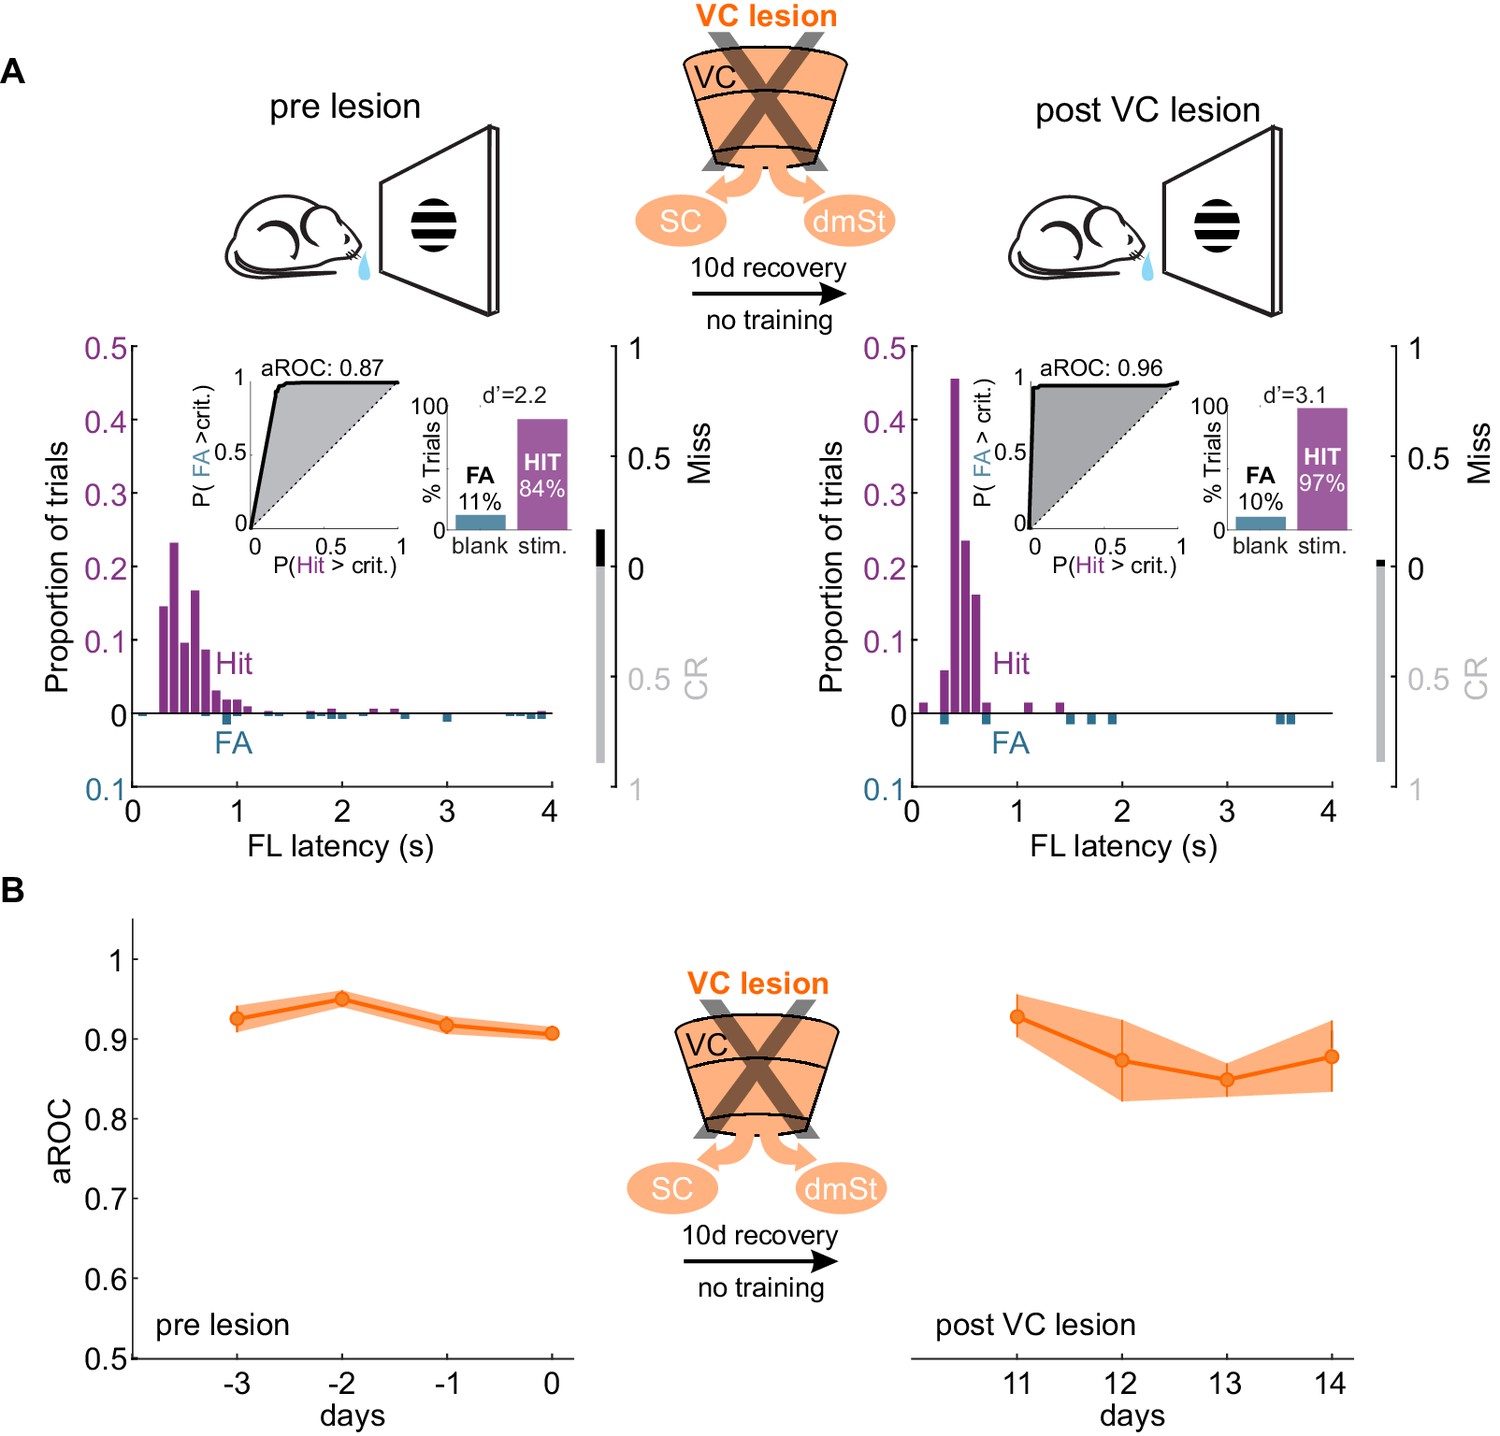
VC lesion after task acquisition does not impair task execution.
(A) Top: Schematic of experimental design. After assessing the visual specificity of proficient mice, VC was removed surgically and their performance reassessed ten days later with no training in between. Bottom: Data from example mouse (illustrated as in Figure 1B) following completion of training (left) and 10 days after VC lesion (right). Inset: aROC curve for Hit versus FA trials and probability of Hits and FA and d-prime for the maximal response window. (B) Population average aROC for four consecutive sessions before (left) and 10 days after VC lesion (N = 4 mice). Data plotted as mean ± SEM. Note that the performance of trained animals following VC lesion is similar to that before lesion.
-
Figure 4—source data 1
Behavioral performance measurements as a function of VC lesion.
- https://cdn.elifesciences.org/articles/59247/elife-59247-fig4-data1-v2.xlsx
Figure 4—figure supplement 1
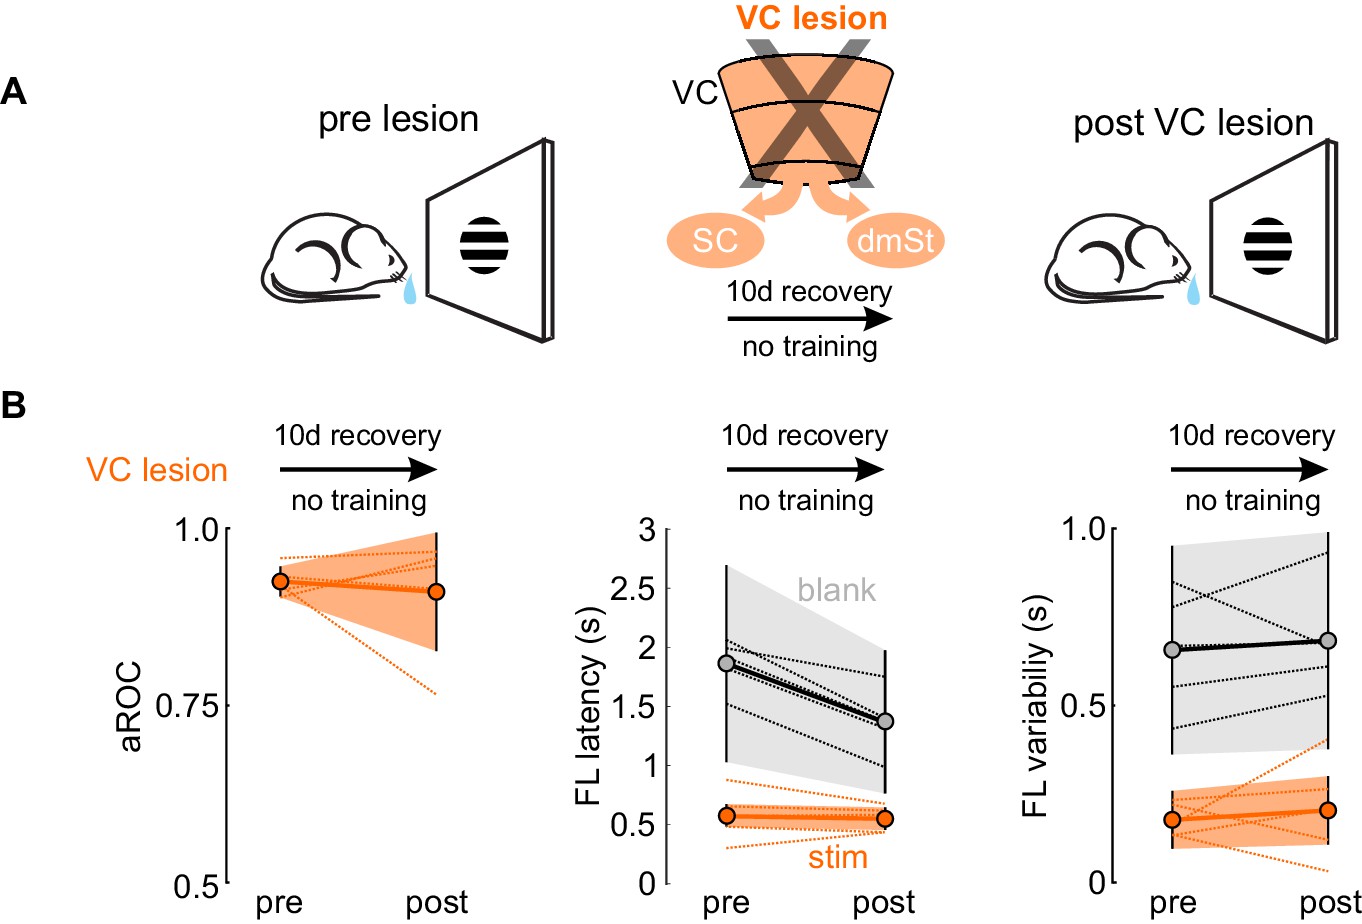
VC lesion after task acquisition does not impair task execution assessed as visual specificity, first lick latency and variability of first lick latency.
(A) Schematic of experimental design. The assessment of visual specificity in proficient mice (pre lesion) was assessed before the surgical removal of VC and reassessed after a 10 days recovery period (post VC lesion). Mice were not trained during the 10 days recovery period. (B) Population average of aROC (left), FL latency to stimulus trials (middle), FL variability to stimulus trials (right) before and after VC lesion (N = 4 mice). Data plotted as mean ± SEM. Dotted lines indicate the performance of individual mice before and after VC lesion. For FL latency (middle) and FL variability (right), orange and gray data are stimulus and blank trials, respectively.
-
Figure 4—figure supplement 1—source data 1
Behavioral performance measurements as a function of VC lesion.
- https://cdn.elifesciences.org/articles/59247/elife-59247-fig4-figsupp1-data1-v2.xlsx
Figure 5
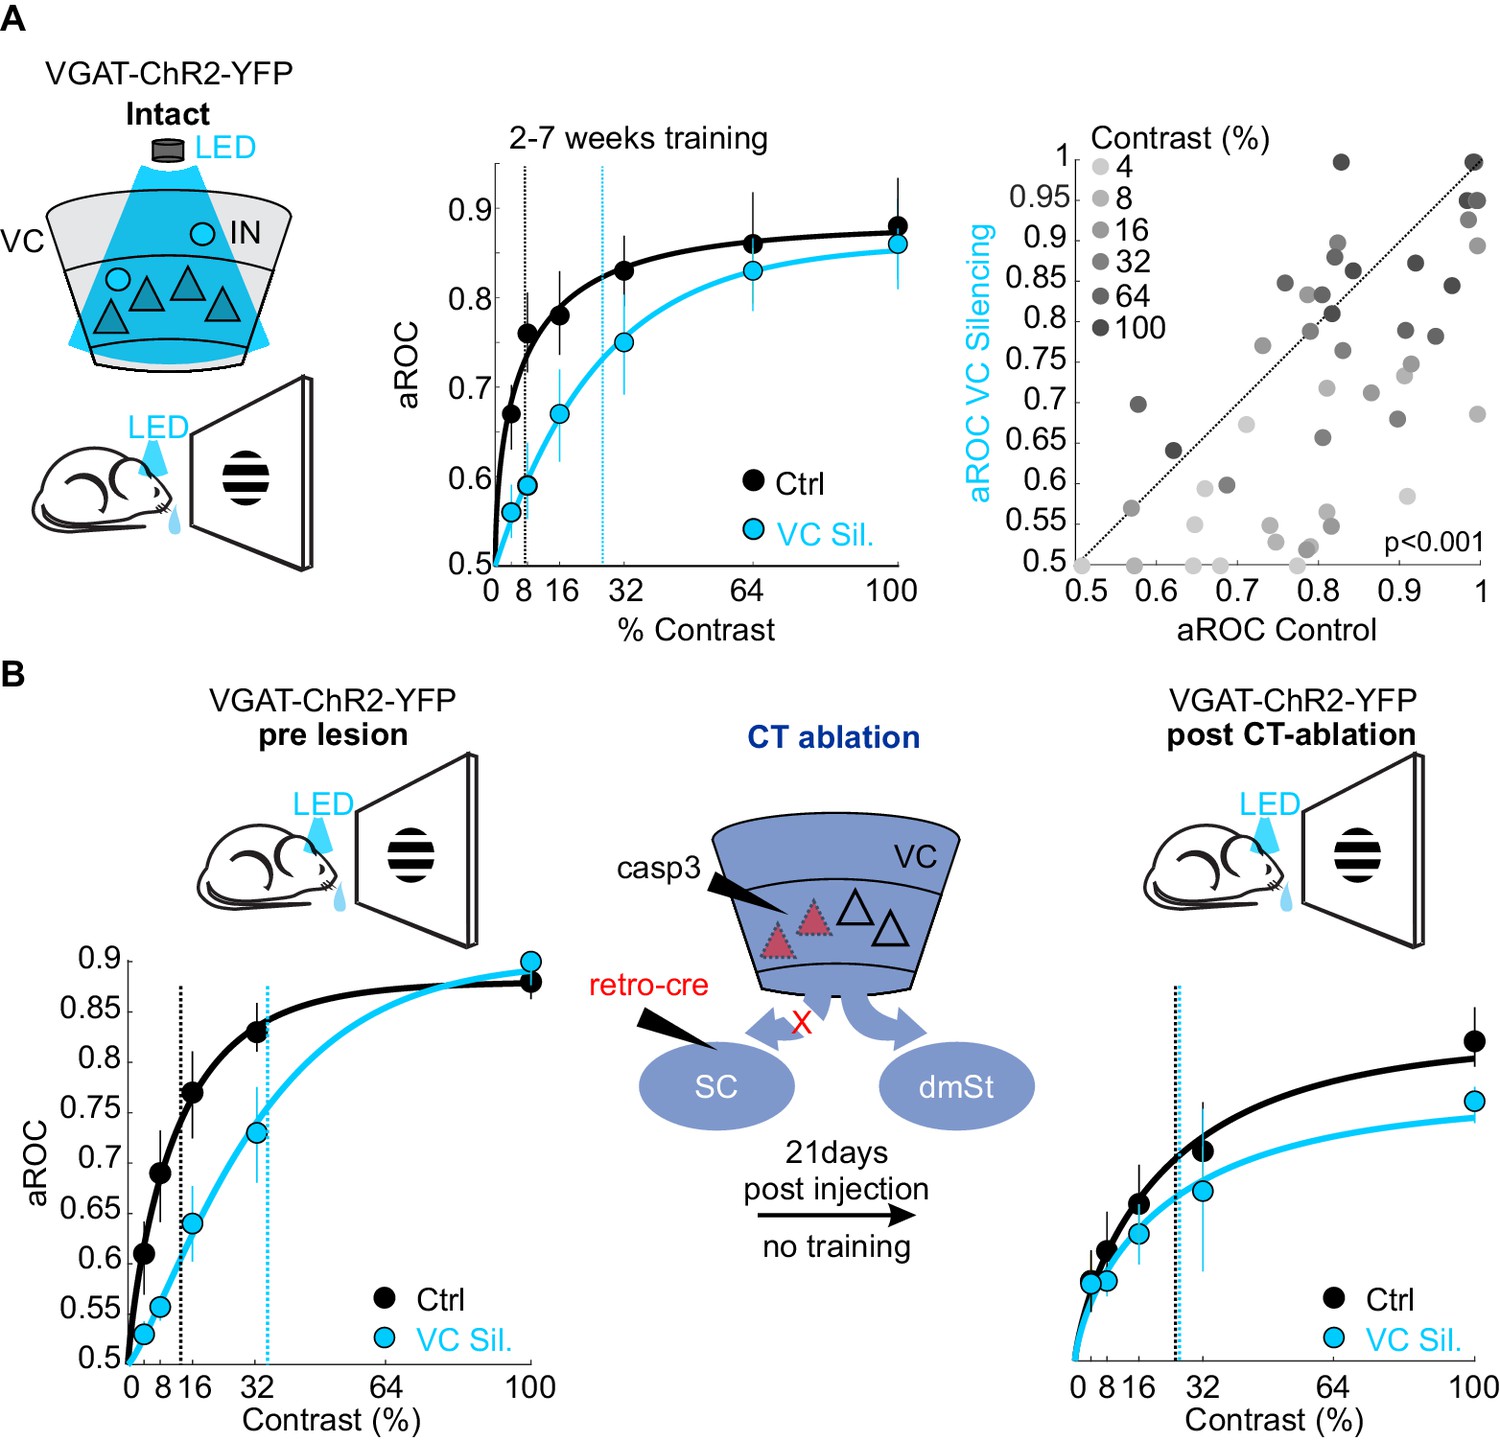
Ablation of cortico-tectal neurons increases the detection threshold.
(A) Left: Schematic illustration of optogenetic silencing of VC by photo-activating inhibitory neurons (IN) in a behaving VGAT-ChR2-YFP animal. Middle: Psychometric function of aROC against stimulus contrast (0%, 4%, 8%, 16%, 32%, 64%, 100%) under control conditions (black) or during VC silencing (light blue; N = 6 mice, p<0.001 for contrast 4–32%, Mann-Whitney U test). Data plotted as mean ± SEM. Psychometric curve fits based on Weibull function. Dashed lines: contrast detection threshold. Note rightward shift of detection threshold upon VC silencing. Right: Scatter plot of aROC in control conditions versus VC silencing. Each dot represents aROC at a specific contrast within a behavioral test session (p<0.001 Wilcoxon signed-rank test; contrasts color coded from light gray to dark gray (4% to 100%, six contrasts), N = 6 mice). Note the stronger impact of VC silencing on aROC for lower contrast stimuli. (B) Left: Top schematic illustration of acute optogenetic silencing of VC in a mouse before CT ablation. Bottom: Psychometric function of aROC against stimulus contrast of trained mice under control conditions (black) or during VC silencing (light blue) before CT ablation (data plotted mean ± SEM; N = 3 mice; p<0.01 Wilcoxon signed-rank test). Middle: Schematic illustration of CT ablation. Right: Psychometric function of the same animals shown on the left 3 weeks after CT lesion without training in between. Dashed lines indicate the contrast detection threshold. Note that, in CT-ablated mice, VC silencing leads to almost no rightward shift of the contrast threshold.
-
Figure 5—source data 1
Behavioral performance measurements as a function of optogenetic silencing of VC and CT ablation.
- https://cdn.elifesciences.org/articles/59247/elife-59247-fig5-data1-v2.xlsx
Figure 6
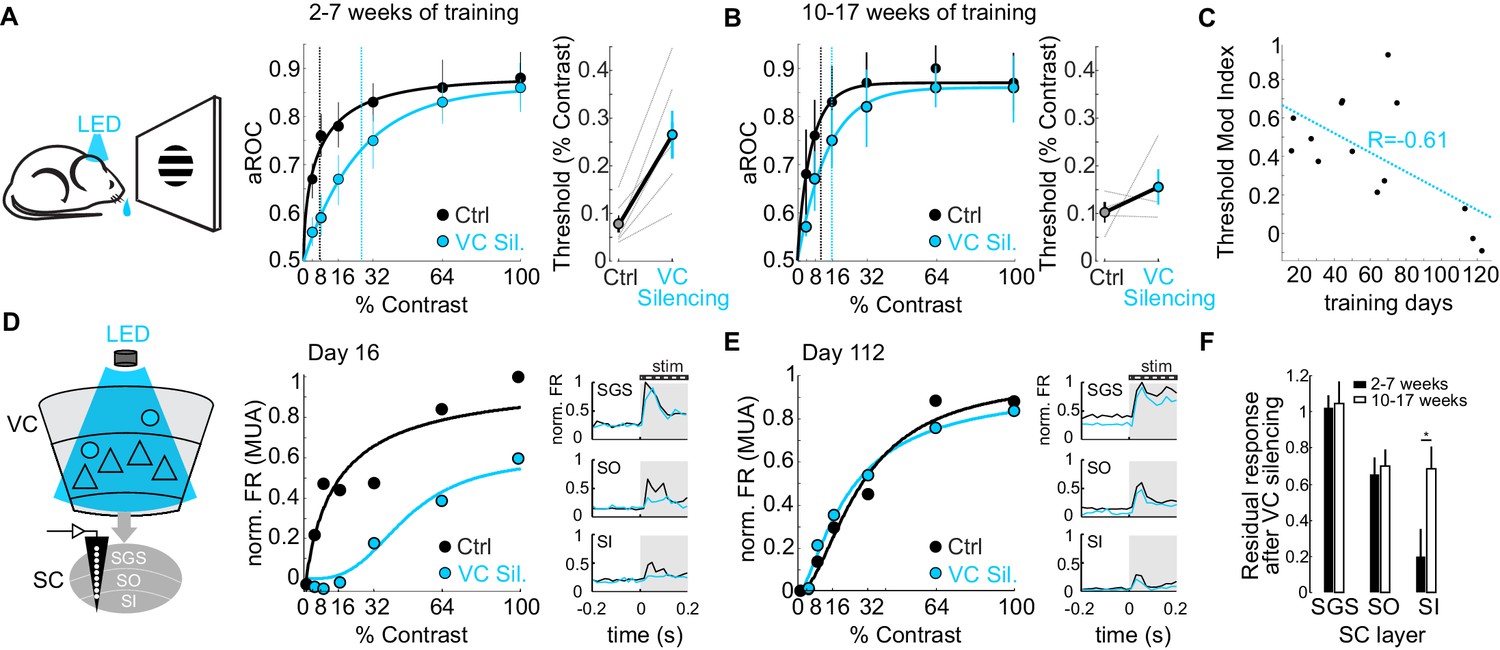
The impact of the cortico-tectal neurons diminishes with training.
(A) Left: Schematic illustration of acute optogenetic silencing of VC in a behaving animal. Middle: Psychometric function of aROC against stimulus contrast of mice trained between 16 and 45 days under control conditions (black) and VC silencing (light blue; N = 6 mice). Data plotted as mean ± SEM. Dashed lines indicate the contrast detection threshold based on the Weibull function fit. Right: Contrast detection threshold of individual mice under control and during VC silencing (data plotted as mean ± SEM, N = 6 mice). (B) Left: As in A but for a separate group of mice trained between 70 and 131 days. Data plotted as mean ± SEM. Right: Contrast detection threshold of individual mice under control and during VC silencing (data plotted as mean ± SEM, N = 4 mice). Note that in these animals, VC silencing leads to a smaller rightward shift of the contrast detection threshold as compared to the animals with less training shown in (A). (C) Change in detection threshold upon VC silencing (reported as modulation index; see Materials and methods) plotted against training days. Each dot represents an individual animal. Dotted line: linear fit. Note inverse correlation between change in detection threshold and training days. (D) Left: Schematic illustration of extracellular recording in SC during behavior upon silencing of VC (stratum griseum superficiale (SGS); stratum opticum (SO); stratum griseum intermediale (SI)). Middle: Example mouse after 16 days of training. Contrast response function of multi-unit activity (MUA) in visual layers of SC under control conditions (black) and during VC silencing (light blue) during the performance of the detection task. Right: Peristimulus time histogram (PSTH) of MUA across depth in SC under control conditions (black) and during VC silencing (light blue; top: SGS; middle: SO; bottom: SO-SI). The shaded area is the period of stimulus presentation. Note the stronger effect of VC silencing on SI activity as compared to SGS. (E) As in (D) but for an example mouse after 112 days of training. (F) Population average of normalized evoked activity as a function of depth in SC. Black: early group (2–7 weeks of training), White: late group (10–17 weeks of training). Data plotted as mean ± SEM (early: N = 6 mice, late: N = 4 mice; p<0.05 Wilcoxon signed-rank test). Note that with prolonged training the impact of VC silencing on SI activity is strongly reduced.
-
Figure 6—source data 1
Measurements of the cortical impact on psychometric data as a function of prolonged training and on neuronal activity in the Superior Colliculus.
- https://cdn.elifesciences.org/articles/59247/elife-59247-fig6-data1-v2.xlsx
Tables
Key resources table
| Reagent type (species) or resource | Designation | Source or reference | Identifiers | Additional information |
|---|---|---|---|---|
| Genetic reagent (Mus musculus) | VGat-ChR2-EYFP | Jackson Labs PMID:21985008 | RRID:MGI:4950481 | Dr. Guoping Feng (Massachusetts Institute of Technology) |
| Genetic reagent (M. musculus) | Ai14 | Jackson Labs PMID:20023653 | MGI:J:155793 | Dr. Hongkui Zeng (Allen Institute for Brain Science) |
| Genetic reagent (M. musculus) | Rosa26-LSL H2B-mCherry | Jackson Labs PMID:25913859 | MGI:J:221246 | Dr. Karel Svoboda (Janelia Farm Research Campus) |
| Antibody | Anti-NeuN (Rabbit polyclonal) | Abcam | Ab104225 RRID:AB_10711153 | IHC 1:1000 |
| Antibody | Alexa Fluor 594 (Goat Anti Rabbit IgG) | Thermo Fisher | A-11012 RRID:AB_2534079 | IHC 1:1000 |
| Peptide, recombinant protein | Cholera Toxin B (Alexa Fluor 488) | Thermo Fisher | C34775 | 1.0 mg/mL |
| Peptide, recombinant protein | Cholera Toxin B (Alexa Fluor 647) | Thermo Fisher | C34778 | 1.0 mg/mL |
| Recombinant DNA reagent | retroAAV-Cre; pmSyn1-EBFP-Cre | Addgene | RRID:Addgene_51507 | Dr. Hongkui Zeng (Allen Institute for Brain Science) |
| Sequence-based reagent | AAV2retro | Addgene | RRID:Addgene_81070 | Dr. Alla Karpova (Janelia Farm Research Campus) |
| Peptide, recombinant protein | taCasp3; Casp3 | Addgene | 45580 | Dr. Nirao Shah (University of California San Francisco) |
Additional files
Download links
A two-part list of links to download the article, or parts of the article, in various formats.
Downloads (link to download the article as PDF)
Open citations (links to open the citations from this article in various online reference manager services)
Cite this article (links to download the citations from this article in formats compatible with various reference manager tools)
Learning speed and detection sensitivity controlled by distinct cortico-fugal neurons in visual cortex
eLife 9:e59247.
https://doi.org/10.7554/eLife.59247


