Neutrophil infiltration regulates clock-gene expression to organize daily hepatic metabolism
- Centro Nacional de Investigaciones Cardiovasculares Carlos (CNIC), Spain
- CIBER Fisiopatología de la Obesidad y Nutrición (CIBERobn), Spain
- CIMUS, University of Santiago de Compostela-Instituto de Investigación Sanitaria, Spain
- Department of General Surgery, University Hospital of Salamanca-IBSAL, Department of Surgery, University of Salamanca, Spain
- Department of Internal Medicine, University Hospital of Salamanca-IBSAL, Department of Medicine, University of Salamanca, Spain
- Howard Hughes Medical Institute and Program in Molecular Medicine, University of Massachusetts Medical School, United States
Figures
Figure 1 with 2 supplements
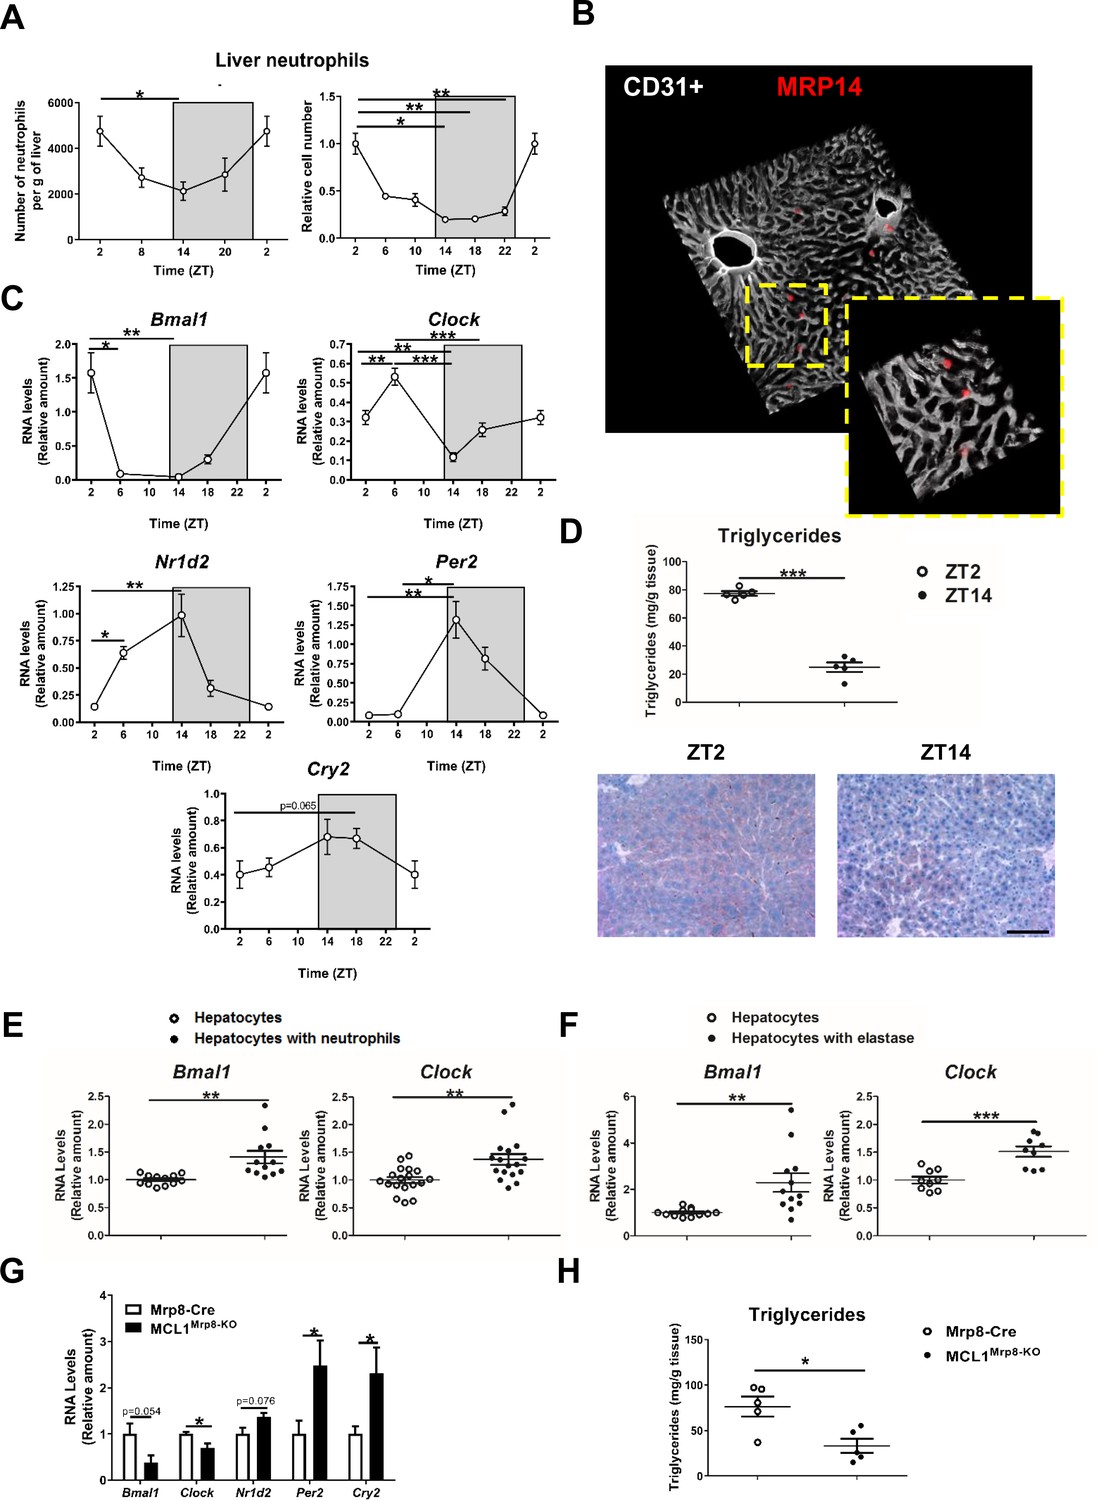
Neutrophil infiltration into the liver controls hepatic clock-gene expression.
(A) Flow cytometry analysis of the CD11b+Ly6G+ liver myeloid subset, isolated from C57BL6J mice at the indicated ZTs. Left, CD11b+Ly6G+ liver myeloid subset analyzed at 6 hr intervals and normalized by the tissue weight. Right, percentage of CD11b+Ly6G+ population analyzed at 4 hr intervals and normalized to ZT2 (n = 5). (B) Representative 3-D image of liver section showing the distribution on infiltrated neutrophils. Livers were stained with anti-S100A9 (Mrp14) (red) and vessels were stained with anti-CD31 and anti-endomucin (grey). Sizes of the liver sections are 510 x 510 x 28 µm and 160 x 160 x 28 µm, respectively. (C) qRT-PCR analysis of circadian clock-gene and nuclear-receptor mRNA expression in livers from C57BL6J mice at the indicated ZTs (n = 5). (D) Liver triglycerides and oil-red-stained liver sections prepared from C57BL6J mice at ZT2 and ZT14. Scale bar, 50 μm (n = 5). (E) qRT-PCR analysis of clock-gene mRNA in hepatocyte cultures exposed to freshly isolated FMLP-activated neutrophils (n = 4-6 wells of 3 independent experiments). (F) qRT-PCR analysis of clock-gene mRNA in hepatocyte cultures treated with 5 nM elastase (n = 3-4 wells of 3 independent experiments). (G) qRT-PCR analysis of clock-gene and nuclear-receptor mRNA expression in livers from control mice (Mrp8-Cre) and neutropenic mice (MCL1Mrp8-KO) sacrificed at ZT2 (n = 5). (H) Hepatic triglycerides detected in livers from control mice (Mrp8-Cre) and neutropenic mice (MCL1Mrp8-KO) at ZT2 (n = 5). Data are means ± SEM from at least 2 independent experiments. *p<0.05; **p<0.01; ***p<0.005 (A, left panel) One-way ANOVA with Tukey’s post hoc test. (A, right panel) Kruskal-Wallis test with Dunn’s post hoc test. (C) One-way ANOVA with Tukey’s post hoc test or Kruskal-Wallis test with Dunn’s post hoc test. (D to H) t-test or Welch’s test. ZT2 point is double plotted to facilitate viewing.
-
Figure 1—source data 1
Raw data and statistical test.
- https://cdn.elifesciences.org/articles/59258/elife-59258-fig1-data1-v1.xlsx
Figure 1—figure supplement 1
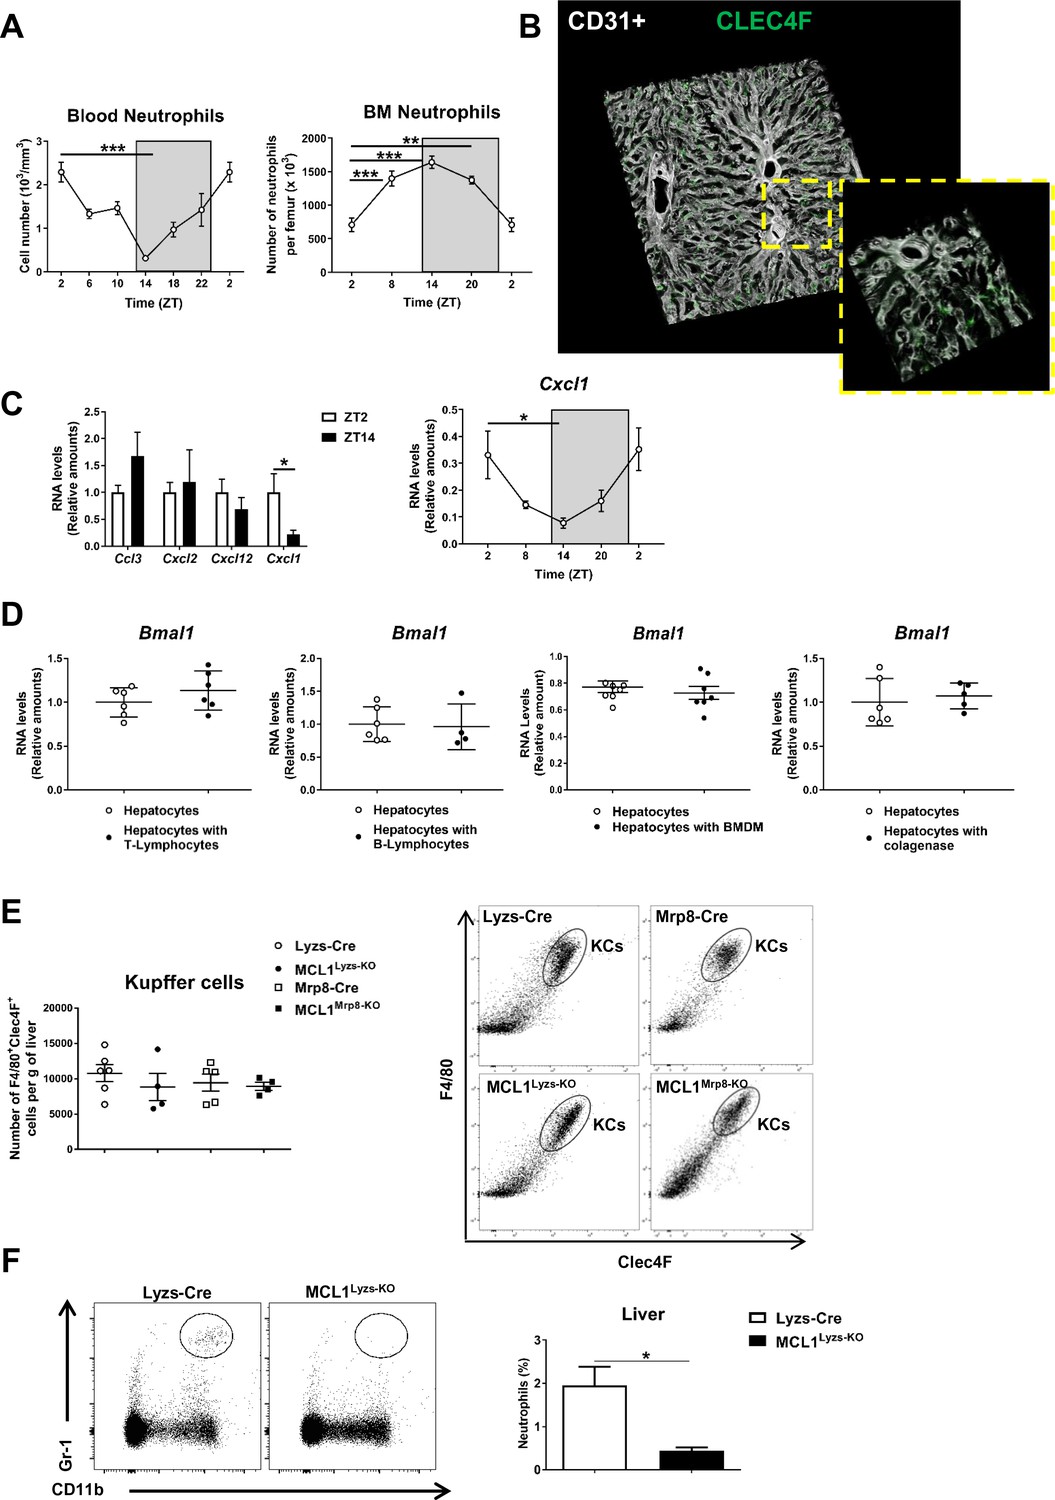
Neutrophils follow a circadian rhythm.
(A) Left, circulating neutrophils quantified at 4 hr intervals in whole blood of C57BL6J mice. Right, flow cytometry analysis at 6 hr intervals of the CD11b+Ly6G+ myeloid subset in bone marrow from C57BL6J mice. ZT2 point is double plotted to facilitate viewing (n = 5). (B) Representative 3-D image of liver section showing the distribution of Kupffer cells. Livers were stained with anti-Clec4F (green) and vessels were stained with anti-CD31 and anti-endomucin (grey). Sizes of the liver sections are 510 x 510 x 28 µm and 160 x 160 x 28 µm, respectively (n = 5-7). (C) qRT-PCR of Ccl3, Cxcl2, Cxcl12 and Cxcl1 chemokines mRNA expression at ZT2 and ZT14 and qRT-PCR of Cxcl1 mRNA expression at 6 hr intervals in livers from C57BL6J mice (n = 5). (D) qRT-PCR of Bmal1 mRNA expression in hepatocyte cultures exposed to freshly isolated T-lymphocytes, B-lymphocytes or bone-marrow derived macrophages (BMDM) and 1 µM FMLP; Bmal1 mRNA expression in hepatocyte cultures treated with 0.5 mg/mL collagenase (n = 3 wells of 2 to 3 independent experiments) (E) Left, flow cytometry analysis of number of liver Kupffer cells (KCs) in control Lyzs-Cre and MCL1Lyzs-KO mice and in Mrp8-Cre and MCL1Mrp8-KO mice normalized by tissue weight. Right, representative dot plots showing F4/80+Clec4F+ population gated on total intrahepatic CD45+CD11b+ leukocyte population (n = 4-6). (F) Flow cytometry analysis of the CD11b+ Gr-1high liver myeloid subset isolated from control (Lyzs-Cre) and neutropenic (MCL1Lyzs-KO) mice. The bar chart shows the CD11b+ Gr-1high population as a percentage of the total intrahepatic CD11b+ leukocyte population (n = 7-10). Data are means ± SEM. *p<0.05; **p<0.01; ***p<0.005 (A, left) Kruskal-Wallis with Dunn’s post-hoc test. (A, right) One-way ANOVA with Tukey’s pots hoc test. (C, left) t-test. (C, right) Kruskal-Wallis with Dunn’s post-hoc test. (D) t-test. (E) One-way ANOVA with Tukey’s pots-hoc test. (F) t-test.
-
Figure 1—figure supplement 1—source data 1
Raw data and statistical test.
- https://cdn.elifesciences.org/articles/59258/elife-59258-fig1-figsupp1-data1-v1.xlsx
Figure 1—figure supplement 2

Neutrophil deficiency alters clock-gene expression.
(A) Representative dot plots showing the decrease in the CD11b+ Gr-1high population in blood, bone marrow, and spleen from neutropenic mice (MCL1Lyzs-KO) compared with control mice (Lyzs-Cre). Bar charts show the CD11b+ Gr-1high population as a percentage of the total CD11b+ leukocyte population. (B) Blood levels of monocytes and neutrophils in control and neutropenic mice. (C) Myeloid cell populations in bone marrow and liver determined by flow cytometry and representative dot plots (CD11b+ Gr-1neg as macrophages, CD11b+ Gr-1int as monocytes and CD11b+ Gr-1high as neutrophils). (D) qRT-PCR of clock genes in the livers from control (Lyzs-Cre) and neutropenic (MCL1Lyzs-KO) mice. ZT2 point is double plotted to facilitate viewing (n = 5-7). (E) Left, flow cytometry analysis of the CD11b+ Ly6G+ lung myeloid subset of control (Lyzs-Cre) and neutropenic (MCL1Lyzs-KO) mice at the indicated ZTs (n = 4). Right, qRT-PCR analysis of Bmal1 in lungs of control (Lyzs-Cre) and neutropenic (MCL1Lyzs-KO) mice at the indicated ZTs (n = 4-6). Data are means ± SEM. *p<0.05; **p< 0.01; ***p<0.005. All tests are t-test or Welch’s test.
-
Figure 1—figure supplement 2—source data 1
Raw data and statistical test.
- https://cdn.elifesciences.org/articles/59258/elife-59258-fig1-figsupp2-data1-v1.xlsx
Figure 2 with 2 supplements

Increased hepatic neutrophil infiltration alters clock-genes expression and augments triglyceride content in the liver.
(A–D) Control (Lyzs-Cre) (A–B) and control and neutropenic (MCL1Lyzs-KO) mice (C–D) were housed for 3 weeks with a normal 12 hr: 12 hr light/dark cycle (Normal Cycle) or with the dark period extended by 12 hr every 5 days (JetLag). Samples were obtained at the indicated ZTs. (A) Left, flow cytometry analysis of the CD11b+Ly6G+ liver myeloid subset. Data represents the percentage CD11b+Ly6G+ normalized to Normal Cycle ZT2. Right, circulating neutrophils in whole blood. (n = 5-8). (B) Liver triglycerides and representative oil-red-stained liver sections at ZT14. Scale bar, 50 μm (n = 9-10). (C) Hepatic triglyceride content analyzed at 6 hr intervals, and representative oil-red-stained liver sections at ZT14. Scale bar, 50 μm (n = 4-6). (D) qRT-PCR analysis of Bmal1 mRNA in livers. (n = 5-8). (E) Flow cytometry analysis of the CD11b+Ly6G+ liver myeloid subset isolated at 6 hr intervals from C57BL6J mice fed a ND, a HFD (8 weeks) or a MCD (3 weeks). The chart shows the CD11b+Ly6G+ population as a percentage of the total intrahepatic CD11b+ leukocyte population normalized to ND group at ZT2 (n = 5 to 10). (F–I) Control mice (Lyzs-Cre) and neutropenic mice (MCL1Lyzs-KO) or p38γ/δLyzs-KO were fed a ND or the MCD diet for 3 weeks and sacrificed at ZT2. (F) Representative images of the infiltration of neutrophils in the liver stained with anti-Mrp14 (blue) and anti-NE (red); nuclei with Sytox Green. Scale bar, 50 μm (Top) and 25 μm (Bottom). (G) qRT-PCR analysis of clock-gene expression in livers (n = 6). (H) Liver triglycerides and representative oil-red-stained liver sections. Scale bar, 50 μm (n = 7-6). (I) qRT-PCR analysis of clock genes in livers at ZT2 (n = 9-17). Data are means ± SEM from at least two independent experiments. *p<0.05; **p<0.01; ***p<0.005 (A to D) t-test or Welch’s test. (E) Two-way ANOVA with Fisher’s post hoc test; p<0.05 ND vs HFD; p<0.0001 ND vs MCD. *p<0.05; ***p<0.005 (G to I) t-test or Welch’s test. ZT2 point is double plotted to facilitate viewing.
-
Figure 2—source data 1
Raw data and statistical test.
- https://cdn.elifesciences.org/articles/59258/elife-59258-fig2-data1-v1.xlsx
Figure 2—figure supplement 1
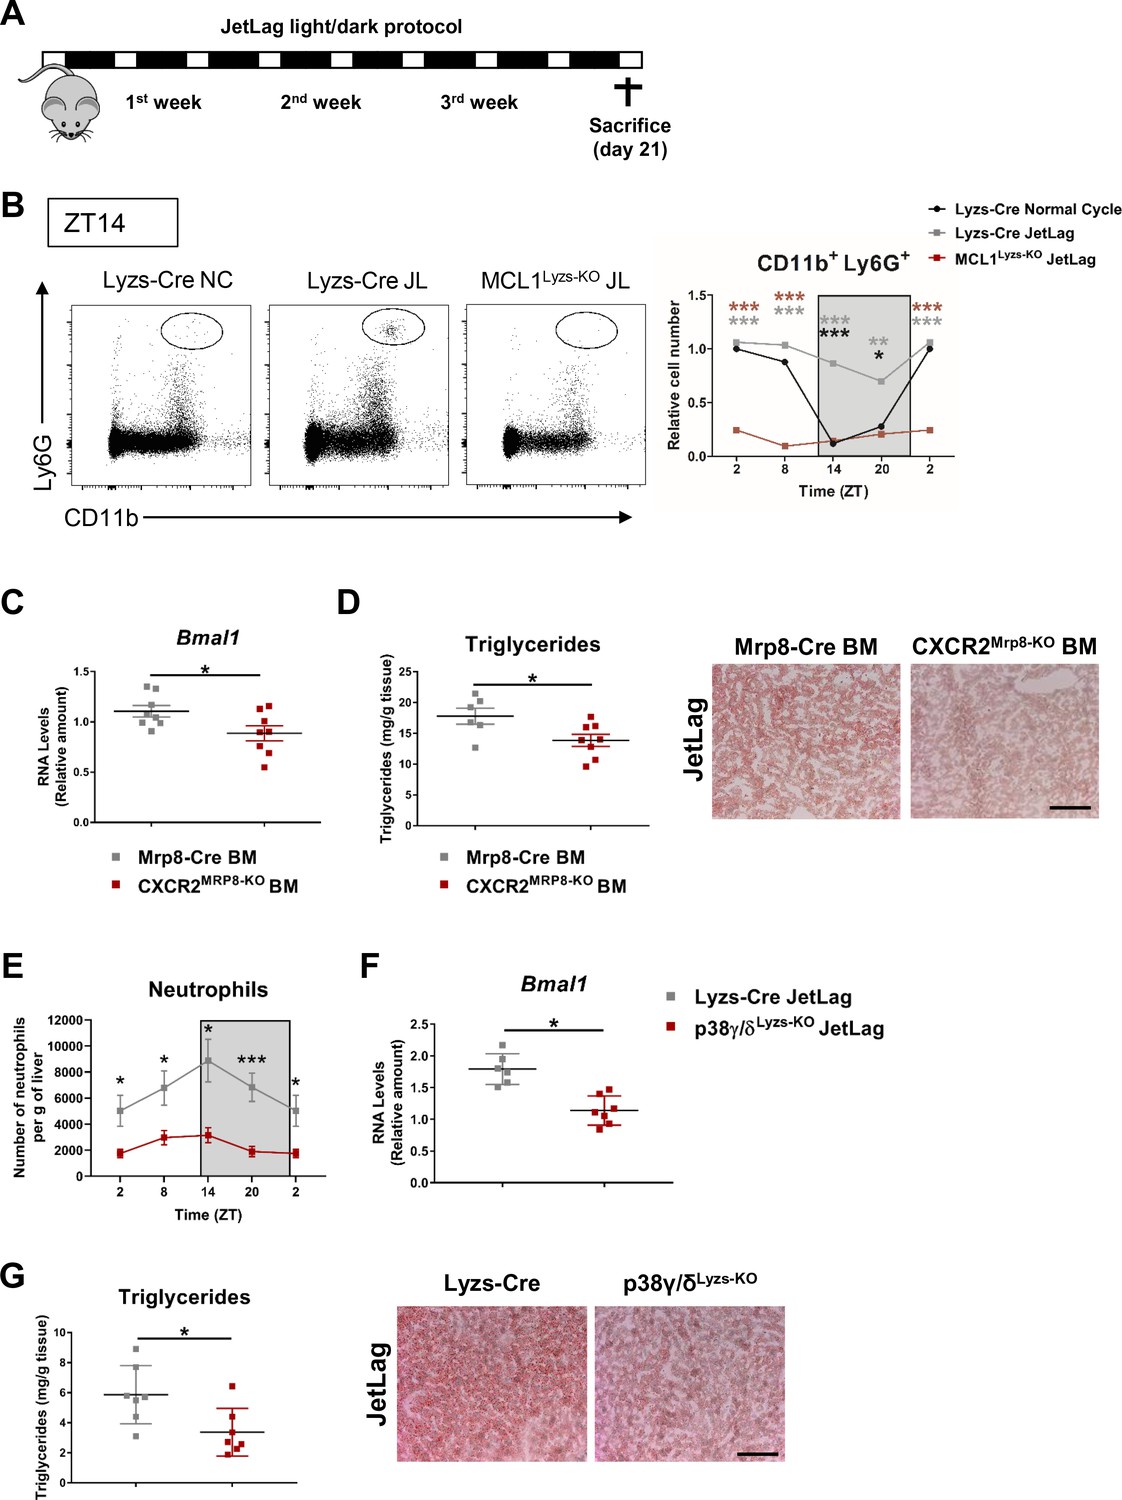
Defective neutrophil migration to the liver alters hepatic clock- gene expression and triglyceride content.
(A) Schematic representation of JetLag protocol with stepwise increases in the dark period of 12 h12h every 5 days (B) Flow cytometry analysis of the CD11b+Ly6G+ liver myeloid subset isolated from control (Lyzs-Cre) and neutropenic (MCL1Lyzs-KO) mice housed for 3 weeks under a 12 hr:12 hr light/dark cycle (Normal Cycle) or Jetlag. The bar chart shows the percentage of CD11b+Ly6G+ total intrahepatic CD11b+ leukocyte population analyzed at 6-h intervals and normalized to Normal Cycle ZT2 (n = 5-7). Dot plots show CD11b+ Ly6G+ population at ZT14. (C–D) After bone -marrow (BM) reconstitution of irradiated WT mice using Mrp8-Cre (Mrp8-Cre BM) or CXCR2Mrp8-KO (CXCR2Mrp8-KO) mice as BM donors, mice were housed for 3 weeks under JetLag (n = 6-8) (C) qRT-PCR analysis of Bmal1 mRNA in livers at ZT14. (D) Hepatic triglyceride content and representative oil-red-stained liver sections at ZT14. Scale bar, 50 µm. (E–G) Control (Lyzs-Cre) and p38γ/δLyzs-KO mice were housed for 3 weeks under JetLag (n = 6-7) (E) Flow cytometry analysis of the CD11b+ Ly6G+ liver myeloid subset analyzed at 6 hr intervals and normalized by the tissue weight. (F) qRT-PCR analysis of Bmal1 mRNA in livers at ZT14. (G) Hepatic triglyceride content and representative oil-red-stained liver sections at ZT14. Scale bar, 50 µm. Data are means ± SEM. *p<0.05; **p< 0.01; ***p<0.005 All tests are t-test or Welch’s test. ZT2 point is double plotted to facilitate viewing.
-
Figure 2—figure supplement 1—source data 1
Raw data and statistical test.
- https://cdn.elifesciences.org/articles/59258/elife-59258-fig2-figsupp1-data1-v1.xlsx
Figure 2—figure supplement 2
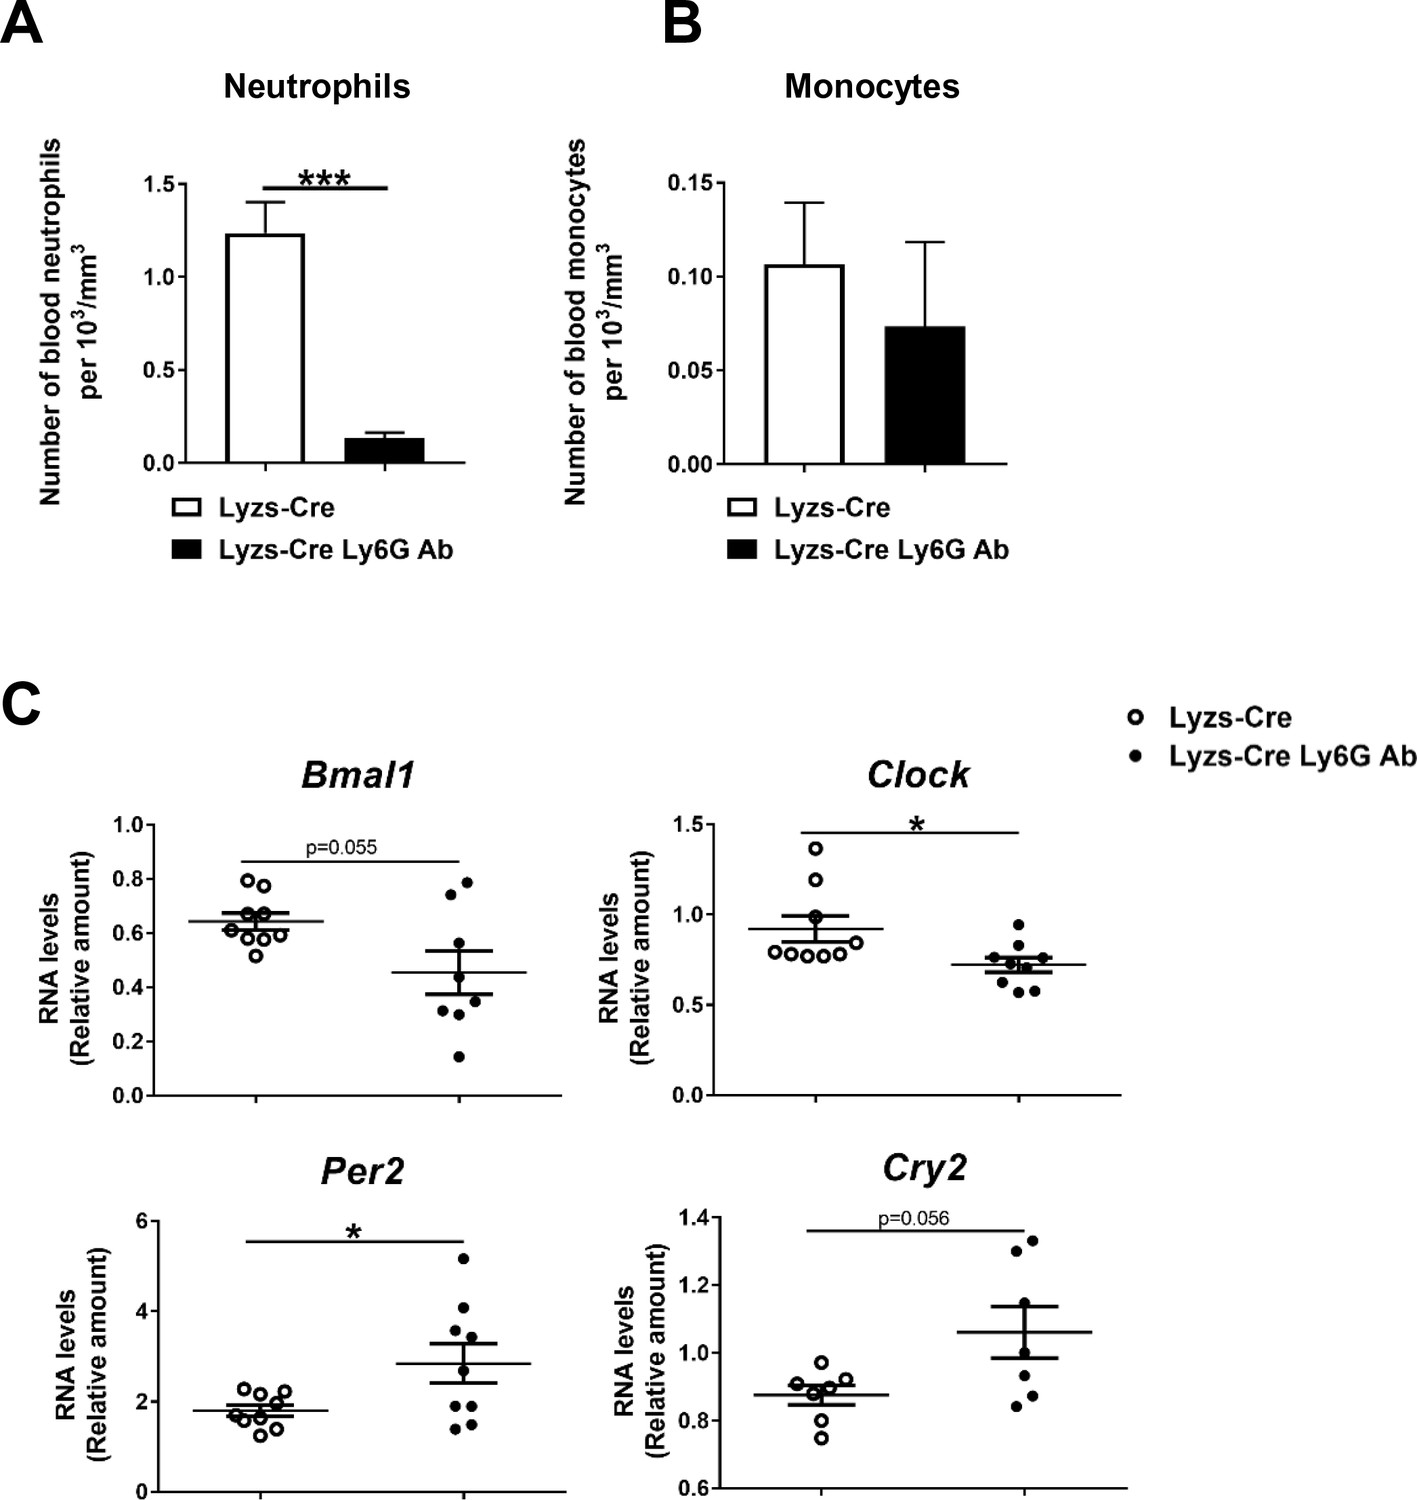
Neutrophil depletion alters hepatic clock-gene expression.
(A-C) Osmotic minipumps containing saline or Ly6G antibody were implanted subcutaneously in Lyzs-Cre mice. These animals were fed with a MCD diet for 3 weeks and sacrificed at ZT2. (A-B) Blood levels of neutrophils and monocytes in Lyzs-Cre after 3 weeks of MCD diet treated or not with Ly6G antibody. (C) qRT-PCR of clock genes in the liver (n = 7-9). Data are means ± SEM. *p<0.05; ***p<0.005. All tests are t-test or Welch’s test.
-
Figure 2—figure supplement 2—source data 1
Raw data and statistical test.
- https://cdn.elifesciences.org/articles/59258/elife-59258-fig2-figsupp2-data1-v1.xlsx
-
Figure 2—figure supplement 2—source data 2
Raw data and statistical test.
- https://cdn.elifesciences.org/articles/59258/elife-59258-fig2-figsupp2-data2-v1.xlsx
Figure 3 with 1 supplement
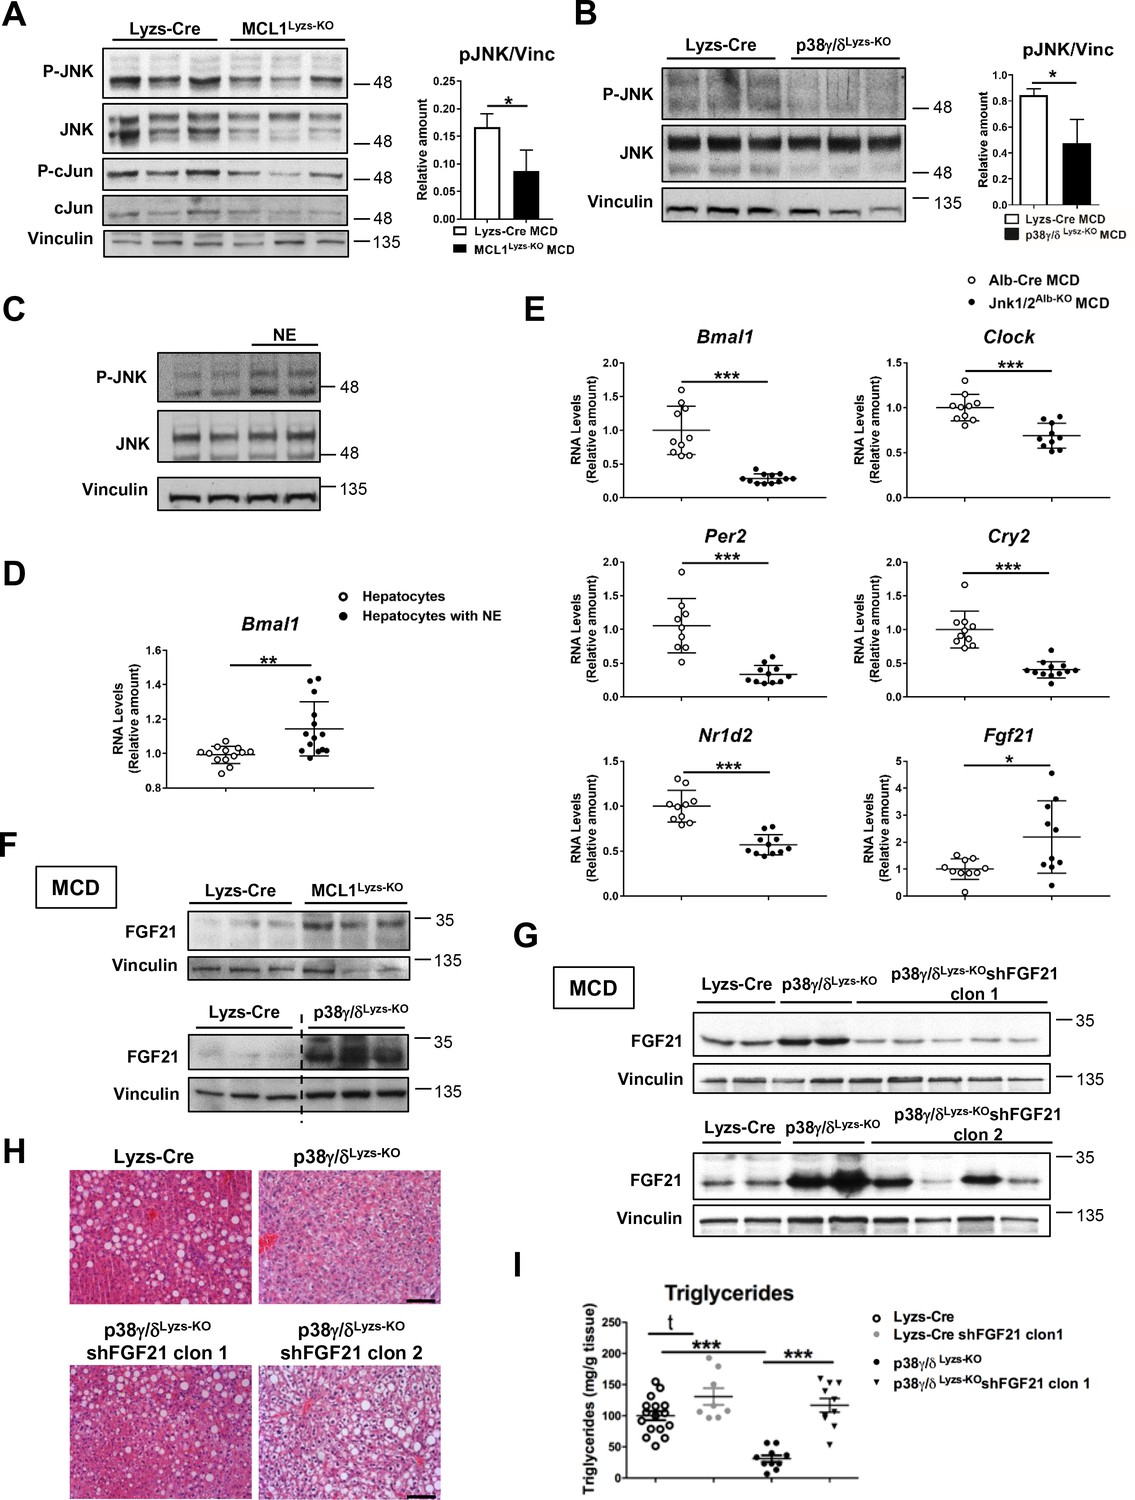
Diurnal regulation of liver metabolism involves neutrophil-mediated regulation of JNK and the hepatokine FGF21.
Immunoblot analysis of JNK content and activation at ZT2 in liver extracts prepared from control (Lyzs-Cre) and neutropenic (MCL1Lyzs-KO) mice fed a MCD diet for 3 weeks (A) or Lyzs-Cre and p38γ/δLyzs-KO mice after 3 weeks of MCD diet (B). Immunoblot analysis of JNK content and activation (C) and Bmal1 RNA expression (D) in hepatocyte cultures exposed to NE for 2 hr (n = 14 wells of 3 independent experiments). Immunoblot quantification is shown in Figure 3—figure supplement 1D (E) qRT-PCR analysis of clock genes and Fgf21 in livers from Alb-Cre, and JNK1/2Alb-KO mice after 3 weeks of MCD diet at ZT2 (n = 9-12). (F) Immunoblot analysis of FGF21 content in liver extracts prepared from control (Lyzs-Cre) and neutropenic (MCL1Lyzs-KO) mice, or from Lyzs-Cre, and p38γ/δLyzs-KO mice after 3 weeks of MCD diet sacrificed at ZT2. Immunoblot quantification is shown in Figure 3—figure supplement 1I,J. (G–I) Lyzs-Cre and p38γ/δLyzs-KO mice were injected with 2 shRNA independent clones targeting FGF21. Seven days after infection, mice were placed on the MCD diet and sacrificed after 3 weeks at ZT2. (G) Immunoblot analysis of FGF21 content in liver extracts prepared from Lyzs-Cre, p38γ/δLyzs-KO, and p38γ/δLyzs-KO mice infected with FGF21 shRNA. Immunoblot quantification is shown in Figure 3—figure supplement 1K. (H) Representative H&E-stained liver sections. Scale bar, 50 μm. (I) Hepatic triglyceride content at the end of the treatment period (n = 8-10). Data are means ± SEM from at least 2 independent experiments. *p<0.05; **p<0.01; ***p<0.005 (A, B, D and E) t-test or Welch’s test. (I) One-way ANOVA with Bonferroni post hoc test or t-test.
-
Figure 3—source data 1
Raw data and statistical test.
- https://cdn.elifesciences.org/articles/59258/elife-59258-fig3-data1-v1.xlsx
Figure 3—figure supplement 1
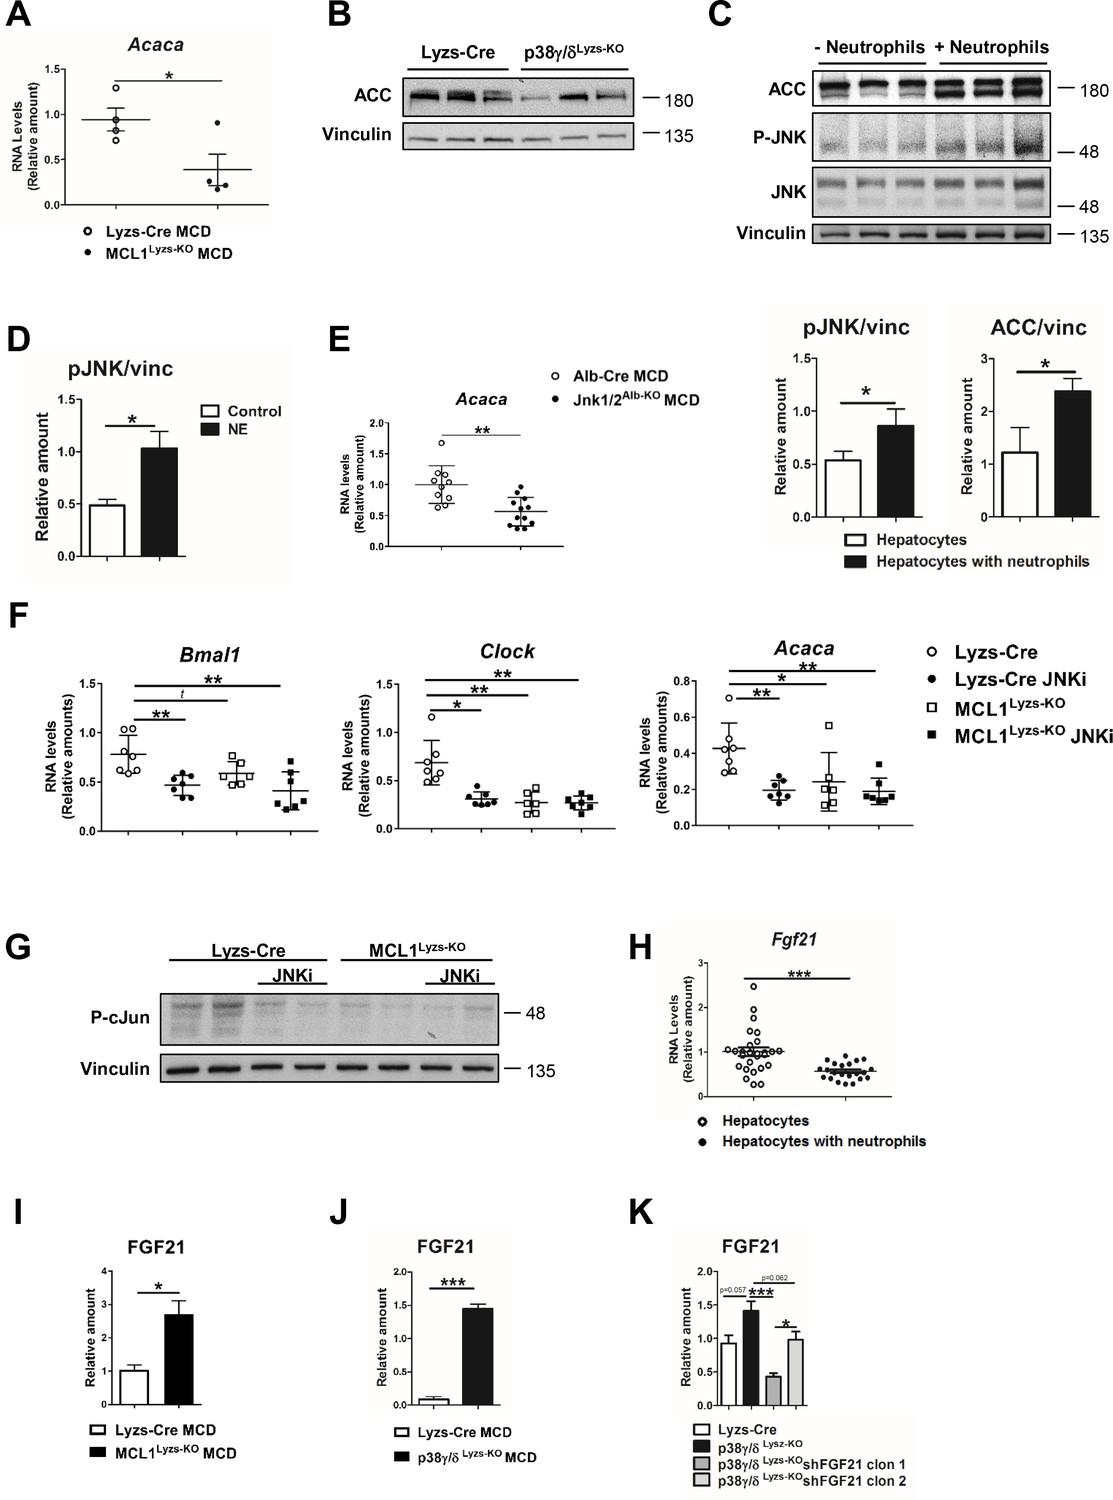
Neutrophils regulate hepatic metabolism and clock genes through JNK and FGF21.
(A) qRT-PCR analysis of the metabolic gene Acaca in livers of control (Lyzs-Cre) and neutropenic (MCL1Lyzs-KO) mice fed the MCD diet for 3 weeks (n = 4). (B) Immunoblot analysis of ACC content in livers from Lyzs-Cre and p38γ/δLyzs-KO mice at the end of the MCD diet. (C) Immunoblot analysis of ACC content and JNK content and activation in extracts prepared from hepatocyte cultures exposed to freshly isolated FMLP-activated for 1 h. Quantification is shown in the bottom panels. (D) Immunoblot analysis quantification of JNK content and activation in hepatocyte cultures treated with neutrophil elastase (NE) for 2 h. (E) qRT-PCR analysis of the metabolic gene Acaca mRNA expression from livers of Alb-Cre and JNK1/2Alb-KO mice fed a MCD for 3 weeks (n = 10-12). (F) qRT-PCR analysis of the clock genes Bmal1 and Clock and the metabolic gene Acaca mRNA expression from livers of control and neutropenic mice treated with the JNK inhibitor SP600125. Mice were sacrificed at ZT2 (n = 6-7). (G) Immunoblot of c-Jun activation at ZT2 in livers from control and neutropenic mice treated with the JNK inhibitor SP600125. (H) qRT-PCR analysis of Fgf21 mRNA expression in hepatocyte cultures exposed to freshly isolated FMLP-activated neutrophils 1 hr (n = 4 to 6 wells of 3 independent experiments). (I-K) Quantification of the immunoblot analysis of FGF21 content in extracts prepared from livers of control (Lyzs-Cre) and neutropenic (MCL1Lyzs-KO) mice fed the MCD diet for 3 weeks (I), Lyzs-Cre, and p38γ/δLyzs-KO mice fed the MCD diet for 3 weeks (JC), and Lyzs-Cre and p38γ/δLyzs-KO mice injected with 2 shRNA independent clones targeting FGF21 and fed the MCD diet for 3 weeks (K) (n = 3). Data are means ± SEM. *p< 0.05; **p< 0.01; ***p<0.005 (A–E) t-test. (F) One-way ANOVA with Tukey’s post hoc test, Kruskal-Wallis with Dunn’s post hoc test or t-test. (H to J) t-test or Welch’s test. (K) One-way ANOVA with Bonferroni post hoc test or t-test.
-
Figure 3—figure supplement 1—source data 1
Raw data and statistical test.
- https://cdn.elifesciences.org/articles/59258/elife-59258-fig3-figsupp1-data1-v1.xlsx
Figure 4 with 1 supplement
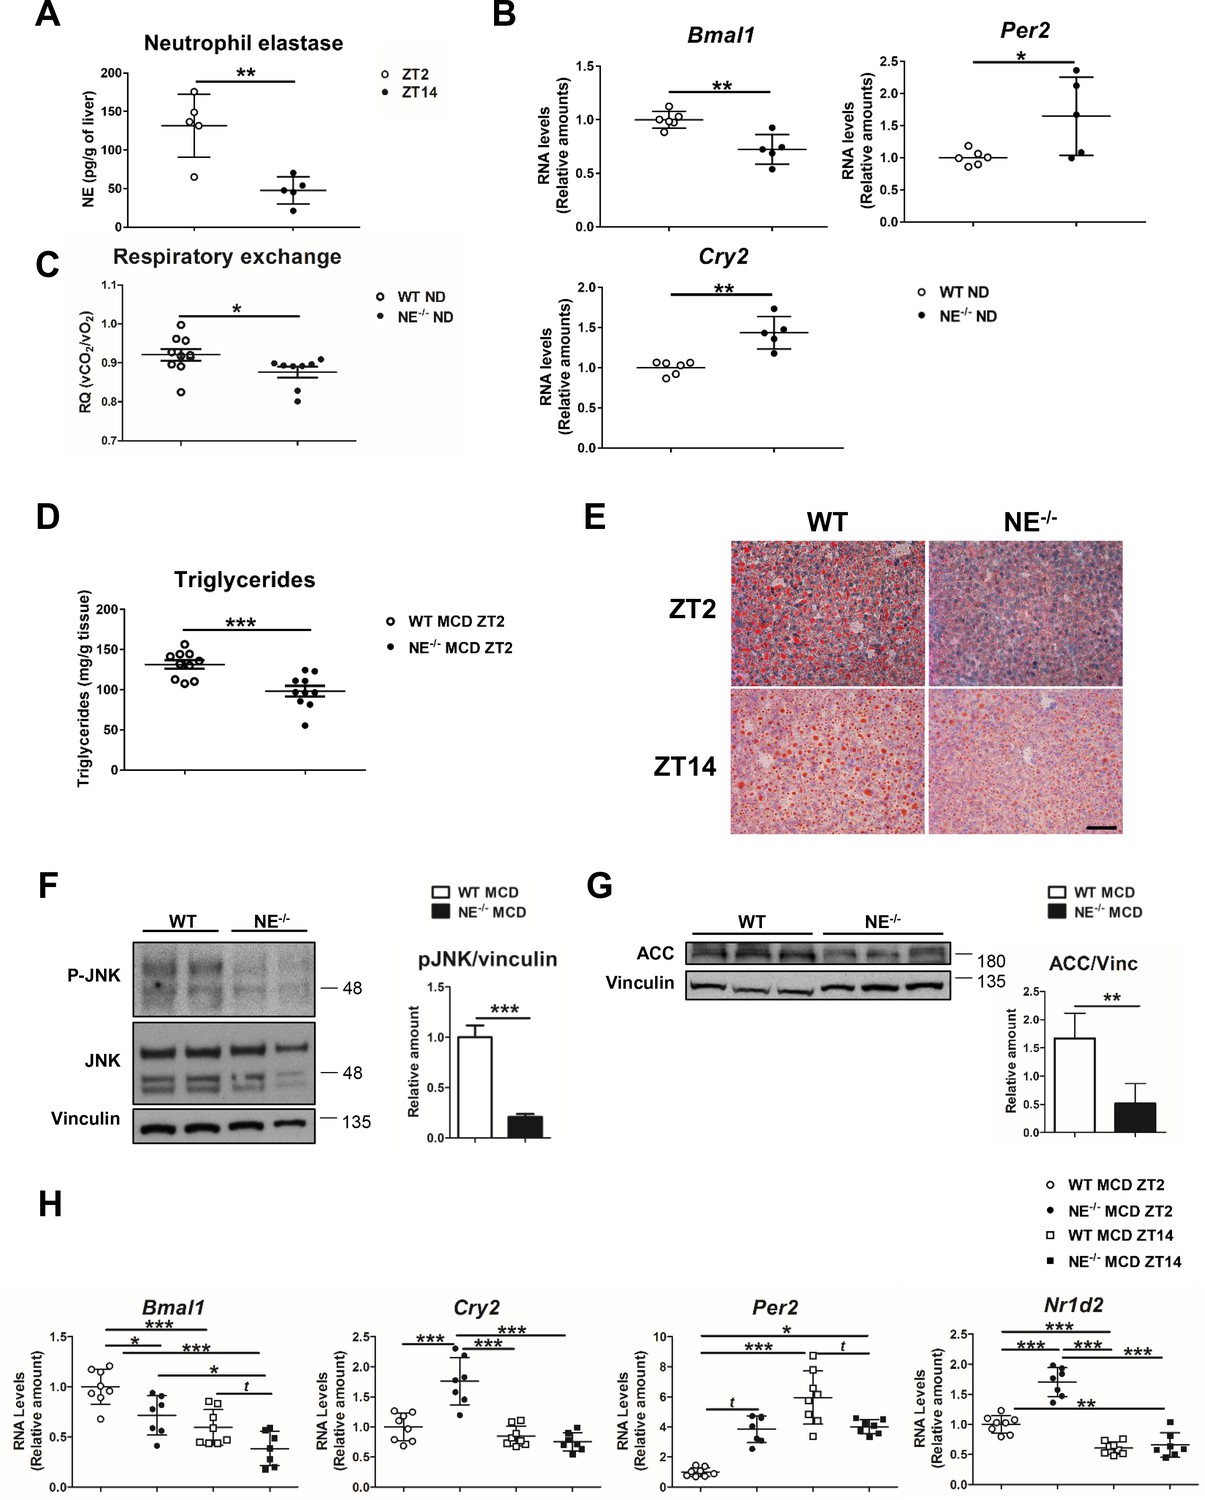
Elastase controls liver clock-gene expression modulating JNK activation.
(A) Extracellular NE levels in livers from WT mice at ZT2 and ZT14. (B) qRT-PCR analysis of clock-genes and nuclear-receptor mRNA expression in livers from WT and NE KO mice (NE-/-) at ZT2 (n = 5–6). (C) Respiratory exchange ratio of WT and NE-/- mice fed with ND. Results are from the lights-on period (n = 9). (D–H) WT and NE-/- mice were fed a MCD diet for 3 weeks and sacrificed at the indicated time. (D) Liver triglycerides at the end of the diet period. (E) Representative oil-red-stained liver sections. Scale bar, 50 μm (n = 10). (F) Immunoblot analysis and quantifications of JNK content and activation in liver extracts prepared from WT and NE-/-. (G) Immunoblot analysis and quantification of ACC content in liver extracts from WT and NE-/- mice. (H) qRT-PCR analysis of clock-genes and nuclear-receptor mRNA expression in livers from WT and NE-/- mice at ZT2 and ZT14 (n = 7–8). Data are means ± SEM from at least two independent experiments. *p<0.05; **p<0.01; ***p<0.005 (A to G) t-test or Welch’s test. (H) One-way ANOVA with to Tukey’s post hoc test, t-test or Welch’s test.
-
Figure 4—source data 1
Raw data and statistical test.
- https://cdn.elifesciences.org/articles/59258/elife-59258-fig4-data1-v1.xlsx
Figure 4—figure supplement 1
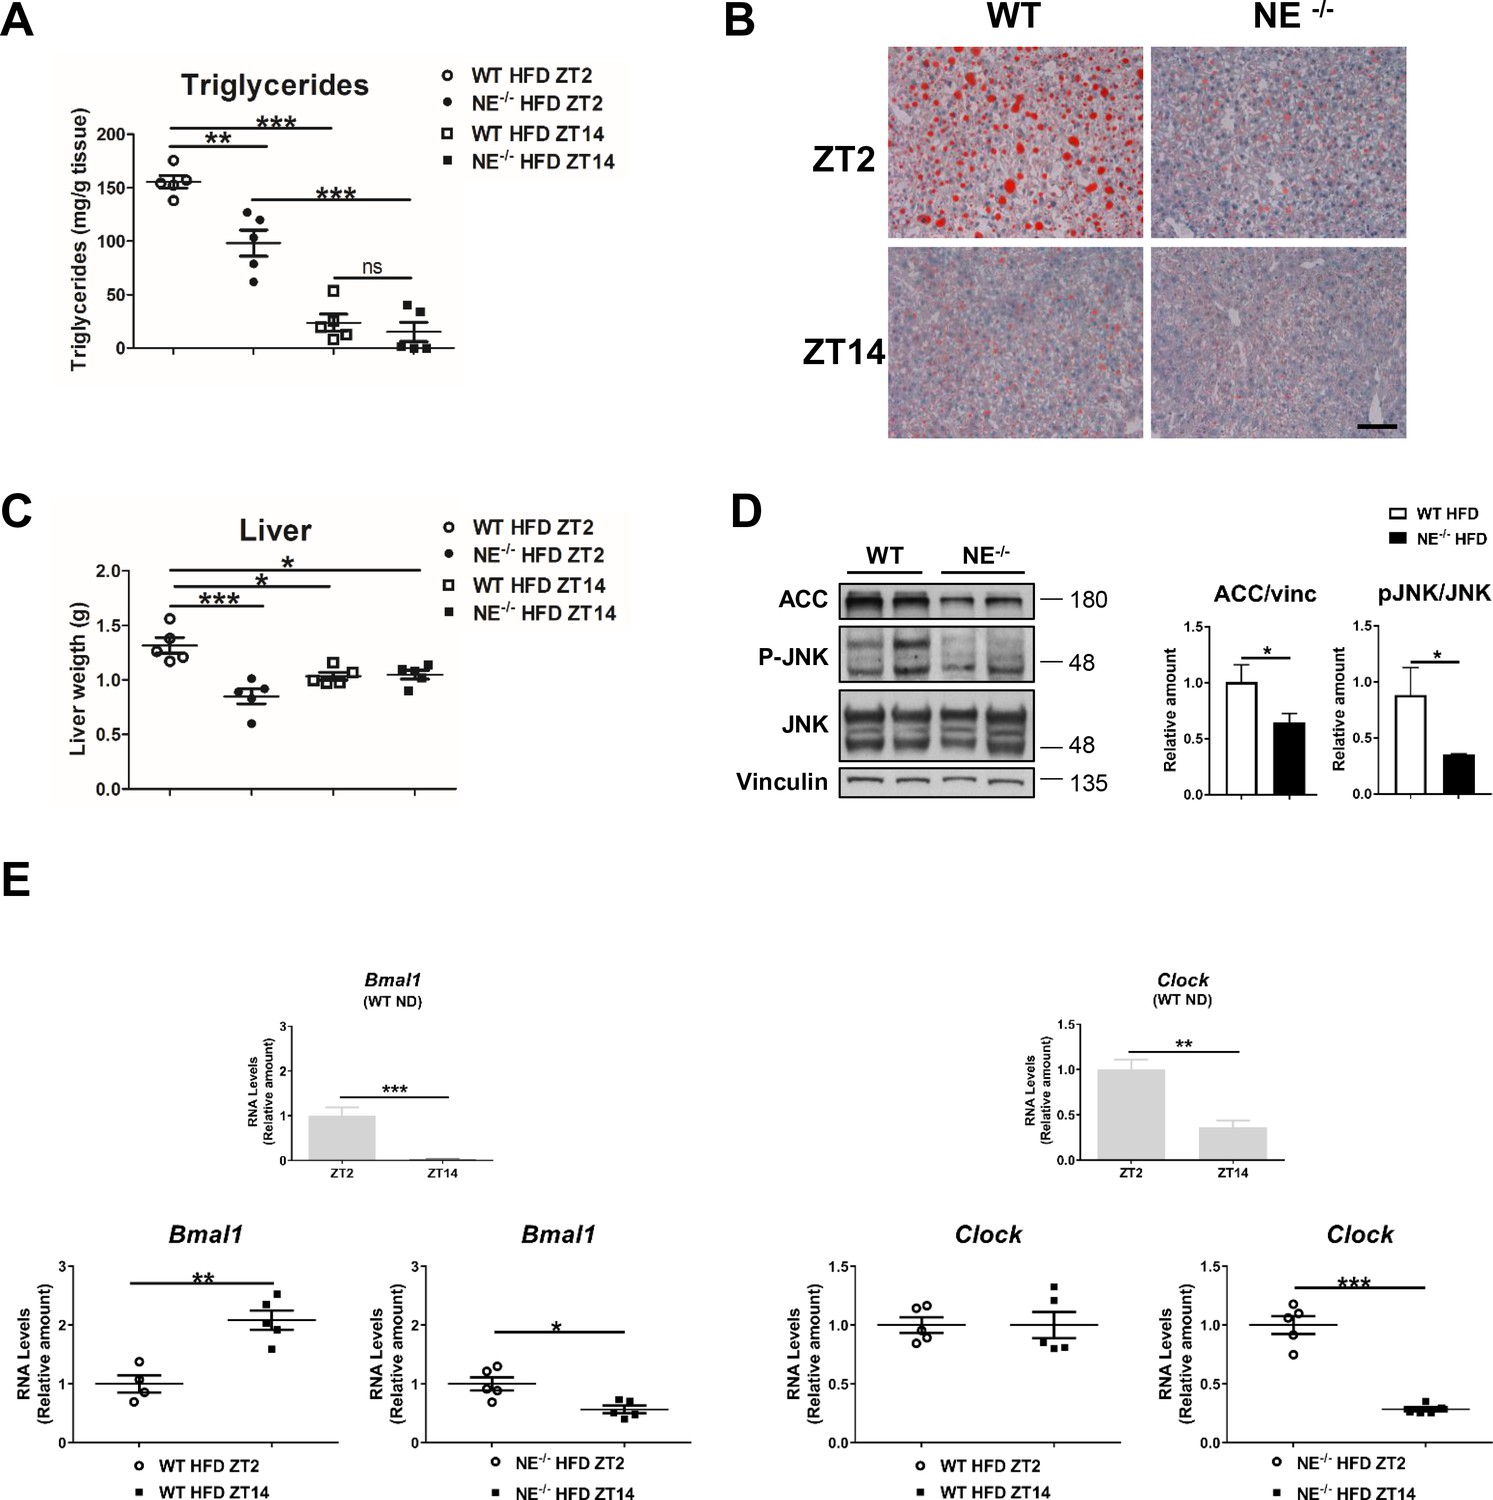
Neutrophil elastase regulates daily hepatic metabolism through JNK.
NE-/- and control mice were fed a HFD for 8 weeks. (A) Liver triglycerides at the end of the diet period (n = 5). (B) Representative oil-red-stained liver sections. Scale bar, 50 μm. (C) Liver weight at the end of the treatment (n = 5). (D) Immunoblot analysis and quantifications of ACC content and JNK content and activation in liver extracts prepared from WT and NE-/- mice. (E) qRT-PCR analysis of clock-genes mRNA expression in livers from WT mice fed a ND (upper panels) and in WT and NE-/- mice fed a HFD (at ZT2 and ZT14 (bottom panels) at ZT12 and ZT14 (n = 5)). Data are means ± SEM from at least 2 independent experiments.*p<0.05; **p<0.01; ***p<0.005 (A and C) One-way ANOVA with Bonferroni post hoc test. (D and E) t-test or Welch’s test.
Figure 5
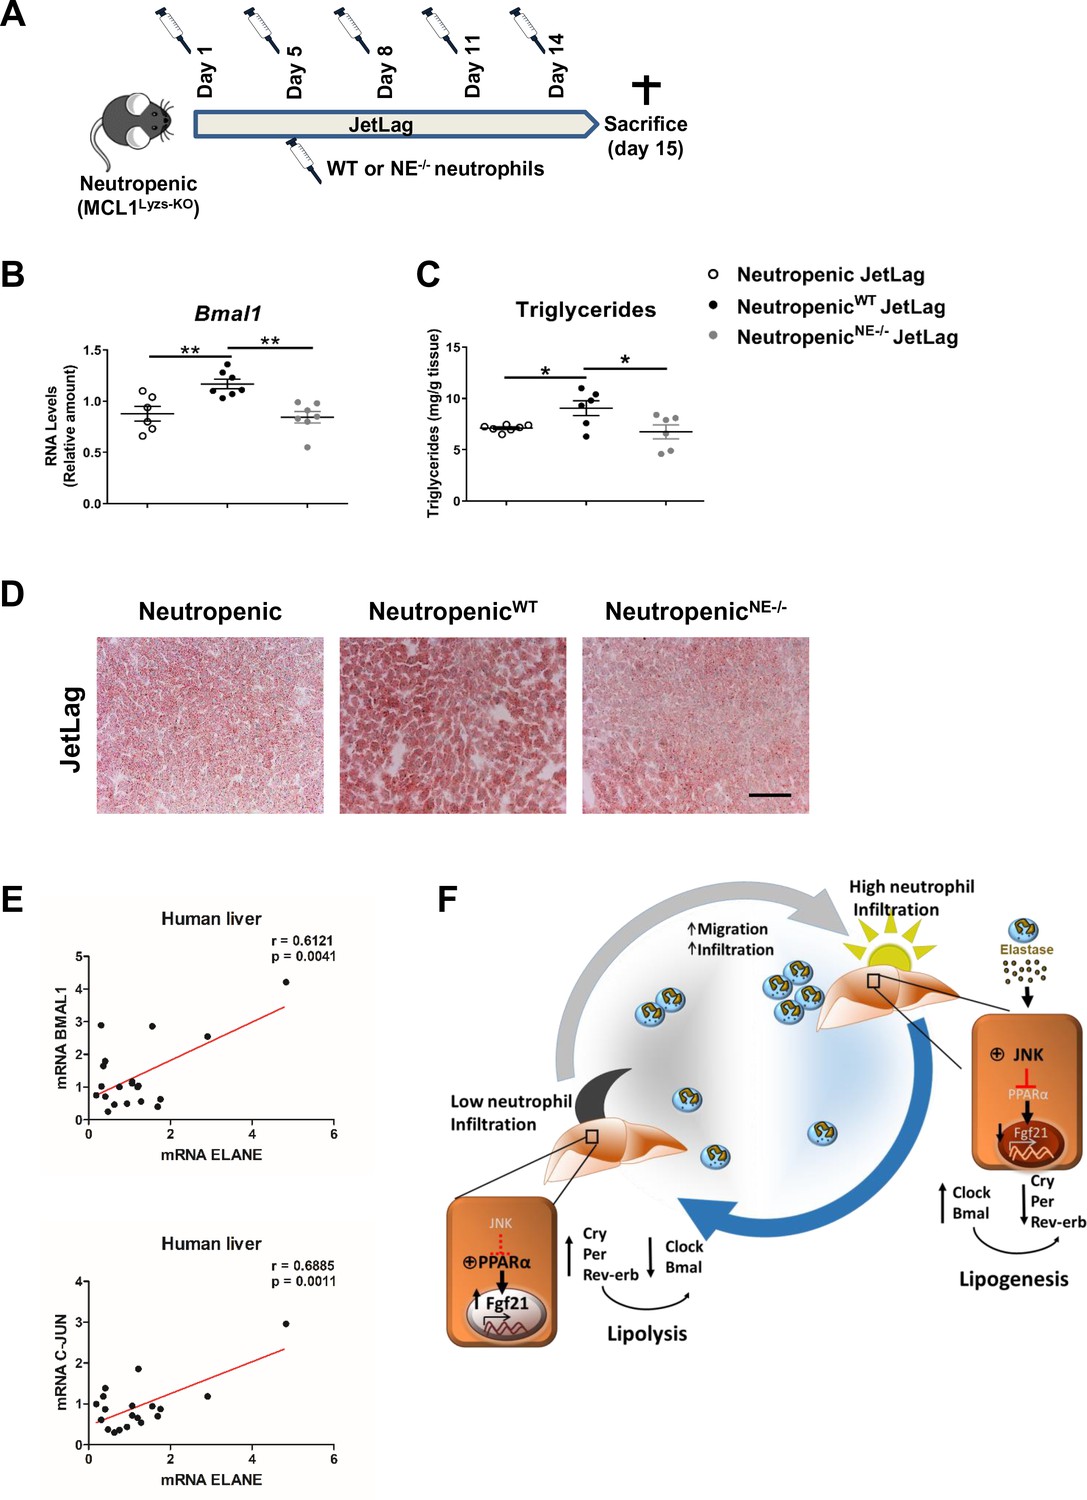
Neutrophil elastase reverses neutropenic mice phenotype through regulation of daily hepatic metabolism.
(A–D) Neutropenic (MCL1Lyzs-KO) mice were housed for 2 weeks with the dark period extended by 12 hr every 5 days (JetLag). Mice were infused with purified WT or NE-/- neutrophils. Samples were obtained at ZT14. (A) Picture describing the neutrophil infusion schedule during the JetLag protocol. (B) qRT-PCR analysis of Bmal1 mRNA in livers. (C) Liver triglycerides and (D) representative oil-red-stained liver sections. Scale bar, 50 µm (n = 6-7). Data are means ± SEM. *p<0.05; t-test. (E) Correlation between mRNA levels of BMAL1 and ELANE (r = 0.6141; p = 0.0052) or JUN and ELANE (r = 0.7362; p = 0.001105) in human livers. The mRNA levels of JUN, BMAL1 and ELANE were determined by qRT-PCR. Linear relationships between variables were tested using Pearson’s correlation coefficient (n = 23). (F) Circadian neutrophil infiltration regulates hepatic metabolism through elastase, JNK and FGF21. Data are means ± SEM. *p< 0.05; **p< 0.01; (B) One-way ANOVA with Tukey’s pots hoc test. (C) t-test or Welch’s test.
-
Figure 5—source data 1
Baseline characteristics of the human cohort.
- https://cdn.elifesciences.org/articles/59258/elife-59258-fig5-data1-v1.xlsx
Author response image 1
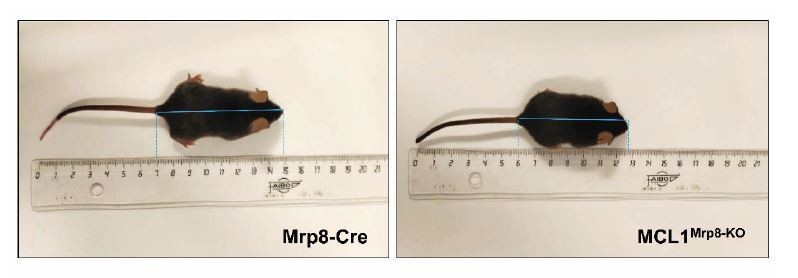
Representative images of MRP8-Cre and MCL-1MRP8-KO mice.
8 weeks-old Mrp8-Cre (size: 8cm, weight: 23.36g) and MCL1Mrp8-KO (size: 6.8cm, weight: 17.3g) male mice and their size are shown.
Tables
Appendix 1—key resources table
| Reagent type (species) or resource | Designation | Source or reference | Identifiers | Additional information |
|---|---|---|---|---|
| Genetic reagent (M. musculus) | C57BL/6J background | Jackson Laboratory | Cat# 000664 RRID:IMSR_JAX:000664 | |
| Genetic reagent (M. musculus) | B6.129-Mcl1tm3Sjk/J | Jackson Laboratory | Cat# 006088 RRID:IMSR_JAX:006088 | |
| Genetic reagent (M. musculus) | B6.Cg-Tg(S100A8-cre,-EGFP)1Ilw/J | Jackson Laboratory | Cat# 021614 RRID:IMSR_JAX:021614 | |
| Genetic reagent (M. musculus) | B6.129P2-Lyz2tm1(cre)Ifo/J | Jackson Laboratory | Cat# 004781 RRID:IMSR_JAX:004781 | |
| Genetic reagent (M. musculus) | B6.129-Mapk12tm1.2 | PMID:26843485 | ||
| Genetic reagent (M. musculus) | B6.129-Mapk13tm1.2 | PMID:26843485 | ||
| Genetic reagent (M. musculus) | B6.129 × 1/SvJ-Elanetm1Sds | Jackson Laboratory | Cat# 006112 RRID:IMSR_JAX:006112 | |
| Genetic reagent (M. musculus) | B6.Cg-Tg(Alb-cre)21Mgn/J | Jackson Laboratory | Cat# 003574 RRID:IMSR_JAX:003574 | |
| Genetic reagent (M. musculus) | B6.129-Mapk8LoxP/LoxP Mapk9tm1Flv/J | PMID:19167327 | ||
| Genetic reagent (M. musculus) | C57BL/6-Cxcr2tm1Rmra/J | Jackson Laboratory | Cat# 024638 RRID:IMSR_JAX:024638 | |
| Cell line (H. sapiens) | HEK-293 | ATCC | Cat# CRL-1573 RRID:CVCL_0045 | |
| Cell line (M. musculus) | Primary hepatocytes | PMID:26843485 | ||
| Transfected construct (synthesized) | pGIZP (pΔ8.9- pVSV-G) | Dharmacon | Cat# RHS4349 | Lentiviral Empty Vector shRNA Control |
| Transfected construct (synthesized) | pGIZP.shFGF21 (pΔ8.9- pVSV-G) | Dharmacon | Cat# V3LMM_430499 | |
| Transfected construct (synthesized) | pGIZP.shFGF21 (pΔ8.9- pVSV-G) | Dharmacon | Cat# V3LMM_430501 | |
| Biological sample (H. sapiens) | Liver human samples | University Hospital of Salamanca-IBSAL | Figure 5—source data 1 | |
| Antibody | Biotinylated monoclonal rat anti-mouse Ly6G (Clone 1A8) | Miltenyi Biotec | Cat# 130-123-854 RRID:AB_1036098 | 1:20 |
| Antibody | Biotinylated monoclonal hamster anti-mouse CD3 (Clone 145–2 C11) | BD Pharmingen | Cat# 553057 RRID:AB_394590 | 1:20 |
| Antibody | Biotinylated monoclonal rat anti-mouse B220 (Clone RA3-6B2) | BD Pharmingen | Cat# 561880 RRID:AB_10897020 | 1:20 |
| Antibody | Monoclonal rat anti-mouse CD45 Pacific Orange (Clone 30-F11) | Invitrogen | Cat# MCD4530 RRID:AB_2539700 | Flow cytometry 1:100 |
| Antibody | Monoclonal rat anti-mouse CD11b FITC (Clone M1/70) | BD Pharmingen | Cat# 557396 RRID:AB_396679 | Flow cytometry 1:100 |
| Antibody | Monoclonal rat anti-mouse Ly6C/G APC (Clone RB6-8C5) | BD Pharmingen | Cat# 553129 RRID:AB_398532 | Flow cytometry 1:200 |
| Antibody | Monoclonal rat anti-mouse F4/80 PE-Cy7 (Clone BM8) | eBioscience | Cat# 25480182 RRID:AB_469653 | Flow cytometry 1:100 |
| Antibody | Monoclonal rat anti-Mouse Ly-6G PE (Clone 1A8) | BD Bioscience | Cat# 551461 RRID:AB_394208 | Flow cytometry 1:200 |
| Antibody | Polyclonal Chicken Anti Goat IgG (H+L) Alexa Fluor 647 | Invitrogen | Cat# A-21469 RRID:AB_2535872 | Flow cytometry 1:500 |
| Antibody | Polyclonal rabbit anti-mouse FGF21 | BioVendor | Cat# RD281108100 RRID:AB_2034054 | WB 1:1000 |
| Antibody | Monolconal rabbit anti-phospho SAPK/JNK (T183/Y185) (Clone 81E11) | Cell Signaling | Cat# 4668S RRID:AB_823588 | WB 1:1000 |
| Antibody | Polyclonal rabbit anti-SAPK/JNK | Cell Signaling | Cat# 9252S RRID:AB_2250373 | WB 1:1000 |
| Antibody | Polyclonal rabbit anti-phospho c-jun | Cell Signaling | Cat# 9164L RRID:AB_330892 | WB 1:1000 |
| Antibody | Monoclonal rabbit anti-c-jun (Clone 60A8) | Cell Signaling | Cat# 9165S RRID:AB_2130165 | WB 1:1000 |
| Antibody | Monoclonal rabbit anti-Acetyl-CoA carboxylase (Clone C83B10) | Cell Signaling | Cat# 3676S RRID:AB_2219397 | WB 1:1000 |
| Antibody | Monoclonal mouse anti-vinculin (Clone hVIN-1) | Sigma | Cat# V9131 RRID:AB_477629 | WB 1:5000 |
| Antibody | Polyclonal goat anti-Mouse IgG (H+L) Secondary Antibody, HRP | ThermoFisher | Cat# 31430 RRID:AB_228307 | WB 1:5000 |
| Antibody | Polyclonal goat anti-Rabbit IgG (H+L) Secondary Antibody, HRP | ThermoFisher | Cat# 31460 RRID:AB_228341 | WB 1:5000 |
| Antibody | Monoclonal rat anti-mouse CD31 (Clone MEC 13.3) | BD Pharmingen | Cat# 553370 RRID:AB_394816 | IF 1:200 |
| Antibody | Monoclonal rabbit anti-mouse S100A9 (mrp14) (Clone EPR22332-75) | Abcam | Cat# AB242945 RRID:AB_2876886 | IF 1:100 |
| Antibody | Polyclonal goat anti-mouse Clec4f | RD System | Cat# AF2784 RRID:AB_2081339 | IF/Flow cytometry 1:200 |
| Antibody | Polyclonal donkey anti rat IgG Alexa 488 | ThermoFisher | Cat# A-21208 RRID:AB_2535794 | IF 1:200 |
| Antibody | Polyclonal Donkey Anti-Rabbit IgG Cy3 AffiniPure Fab Fragment | Jackson Laboratories | Cat# 711-167-003 RRID:AB_2340606 | IF 1:200 |
| Antibody | Polyclonal Donkey Anti Goat IgG (H+L) Alexa Fluor 633 | ThermoFisher | Cat# A21082 RRID:AB_10562400 | IF 1:200 |
| Antibody | Monoclonal rat anti-mouse S100A9 (Mrp-14) (Clone 2B10) | Abcam | Cat# AB105472 RRID:AB_10862594 | IF 1:200 |
| Antibody | Polyclonal rabbit anti-neutrophil elastase | Abcam | Cat# AB68672 RRID:AB_1658868 | IF 1:200 |
| Antibody | Polyclonal goat Anti-Rabbit Alexa Fluor 405 | ThermoFisher | Cat# A-31556 RRID:AB_221605 | IF 1:200 |
| Antibody | Polyclonal goat Anti-Rat IgG Alexa Fluor 568 | ThermoFisher | Cat# A-11077 RRID:AB_2534121 | IF 1:500 |
| Sequence-based reagent | RT-qPCR primers | Sigma-Aldrich | ||
| Peptide, recombinant protein | Recombinant Mouse Neutrophil Elastase/EL | R and D Systems | Cat# 4517-SE-010 | |
| Peptide, recombinant protein | Collagenase A | Roche | Cat# 10 103 586 001 | |
| Peptide, recombinant protein | Collagenase Type 1 CLS1 | Worthington Biochemical | Cat# LS004197 | |
| Peptide, recombinant protein | Liberase TL | Sigma | Cat# 5401020001 | |
| Peptide, recombinant protein | DNase Type II-S | Sigma-Aldrich | Cat# D4513 | |
| Commercial assay or kit | Serum Triglyceride Determination Kit | Sigma-Aldrich | Cat# TR0100-1KT | |
| Commercial assay or kit | Mouse Neutrophil Elastase/ELA2 DuoSet ELISA | R and D systems | Cat# DY4517-05 | |
| Commercial assay or kit | RNa easy Mini Kit | Qiagen | Cat# 74106 | |
| Commercial assay or kit | High-Capacity cDNA Reverse Transcription Kit | Applied Biosystems | Cat# 4368814 | |
| Chemical compound, drug | Fast SYBR Green Master Mix | Applied Biosystems | Cat# 4385616 | |
| Chemical compound, drug | Percoll | GE Healthcare | Cat# 17-0891-01 | |
| Chemical compound, drug | Palmitic acid | Sigma-Aldrich | Cat# P0500 | |
| Chemical compound, drug | N-Formil Met-Leu-Phe (FMLP) | Sigma-Aldrich | Cat# F3506 | |
| Chemical compound, drug | SP600125 (SAPK inhibitor) | Santa Cruz Biotechnology | Cat# sc-200635 | |
| Chemical compound, drug | Amersham ECL Prime Western Blotting Detection Reagent | GE Healthcare | Cat# RPN2232 | |
| Chemical compound, drug | Fluoromount-G | SouthernBiotech | Cat# 0100–01 | |
| Chemical compound, drug | Sucrose | Sigma-Aldrich | Cat# S8501 | |
| Chemical compound, drug | SYTOX Green Nucleic Acid Stain - 5 mM | ThermoFisher | Cat# S7020 | |
| Chemical compound, drug | VECTASHIELD Antifade Mounting Medium | Vector Lab | Cat# H-1000 | |
| Software, algorithm | GraphPad PRISM | GraphPad Software | RRID:SCR_002798 | |
| Software, algorithm | Photoshop CS6 | Adobe | RRID:SCR_014199 | |
| Software, algorithm | Fiji/Image J software | Fiji-Image J | https://imagej.nih.gov/ij/ RRID:SCR_003070 | |
| Software, algorithm | FlowJo | FlowJo | https://www.flowjo.com/ RRID:SCR_008520 | |
| Software, algorithm | Leica LAS X | Leica Software | RRID:SCR_013673 | |
| Other | Hematoxylin | Sigma | Cat# H3136 | |
| Other | Eosin Y Alcoholic | Thermo Scientific | Cat# 6766008 | |
| Other | OCT | Tissue-Tek | Cat# 4583 | |
| Other | Oil Red O (C.I.26125) | American Master Tech Scientific | Cat# SPO1077 | |
| Other | 70 μM cell strainers | Corning Falcon | Cat# 352350 | |
| Other | 22 μM filter | Sigma-Aldrich | Cat# SLGPM33RS | |
| Other | Amicon Ultra centrifugal filters | Sigma-Aldrich | Cat# UFC800324 | |
| Other | Magnetic streptavidin microbeads | Miltenyi Biotec | Cat# 130-048-101 | |
| Other | MACS Separation Columns- MS columns | Miltenyi Biotec | Cat# 130-042-201 | |
| Other | Mini-osmotic pumps | Alzet | Cat# 1004 | |
| Other | Methionine-choline-deficient diet (MCD) | Research Diets Inc | Cat# A02082002B | |
| Other | High-fat diet (HFD) | Research Diets Inc | Cat# D11103002i |
Additional files
Download links
A two-part list of links to download the article, or parts of the article, in various formats.
Downloads (link to download the article as PDF)
Open citations (links to open the citations from this article in various online reference manager services)
Cite this article (links to download the citations from this article in formats compatible with various reference manager tools)
Neutrophil infiltration regulates clock-gene expression to organize daily hepatic metabolism
eLife 9:e59258.
https://doi.org/10.7554/eLife.59258


