Neutrophil infiltration regulates clock-gene expression to organize daily hepatic metabolism
- Centro Nacional de Investigaciones Cardiovasculares Carlos (CNIC), Spain
- CIBER Fisiopatología de la Obesidad y Nutrición (CIBERobn), Spain
- CIMUS, University of Santiago de Compostela-Instituto de Investigación Sanitaria, Spain
- Department of General Surgery, University Hospital of Salamanca-IBSAL, Department of Surgery, University of Salamanca, Spain
- Department of Internal Medicine, University Hospital of Salamanca-IBSAL, Department of Medicine, University of Salamanca, Spain
- Howard Hughes Medical Institute and Program in Molecular Medicine, University of Massachusetts Medical School, United States
Abstract
Liver metabolism follows diurnal fluctuations through the modulation of molecular clock genes. Disruption of this molecular clock can result in metabolic disease but its potential regulation by immune cells remains unexplored. Here, we demonstrated that in steady state, neutrophils infiltrated the mouse liver following a circadian pattern and regulated hepatocyte clock-genes by neutrophil elastase (NE) secretion. NE signals through c-Jun NH2-terminal kinase (JNK) inhibiting fibroblast growth factor 21 (FGF21) and activating Bmal1 expression in the hepatocyte. Interestingly, mice with neutropenia, defective neutrophil infiltration or lacking elastase were protected against steatosis correlating with lower JNK activation, reduced Bmal1 and increased FGF21 expression, together with decreased lipogenesis in the liver. Lastly, using a cohort of human samples we found a direct correlation between JNK activation, NE levels and Bmal1 expression in the liver. This study demonstrates that neutrophils contribute to the maintenance of daily hepatic homeostasis through the regulation of the NE/JNK/Bmal1 axis.
eLife digest
Every day, the body's biological processes work to an internal clock known as the circadian rhythm. This rhythm is controlled by ‘clock genes’ that are switched on or off by daily physical and environmental cues, such as changes in light levels. These daily rhythms are very finely tuned, and disturbances can lead to serious health problems, such as diabetes or high blood pressure.
The ability of the body to cycle through the circadian rhythm each day is heavily influenced by the clock of one key organ: the liver. This organ plays a critical role in converting food and drink into energy. There is evidence that neutrophils – white blood cells that protect the body by being the first response to inflammation – can influence how the liver performs its role in obese people, by for example, releasing a protein called elastase. Additionally, the levels of neutrophils circulating in the blood change following a daily pattern. Crespo, González-Terán et al. wondered whether neutrophils enter the liver at specific times of the day to control liver’s daily rhythm.
Crespo, González-Terán et al. revealed that neutrophils visit the liver in a pattern that peaks when it gets light and dips when it gets dark by counting the number of neutrophils in the livers of mice at different times of the day. During these visits, neutrophils secreted elastase, which activated a protein called JNK in the cells of the mice’s liver. This subsequently blocked the activity of another protein, FGF21, which led to the activation of the genes that allow cells to make fat molecules for storage. JNK activation also switched on the clock gene, Bmal1, ultimately causing fat to build up in the mice’s liver. Crespo, González-Terán et al. also found that, in samples from human livers, the levels of elastase, the activity of JNK, and whether the Bmal1 gene was switched on were tightly linked. This suggests that neutrophils may be controlling the liver’s rhythm in humans the same way they do in mice.
Overall, this research shows that neutrophils can control and reset the liver's daily rhythm using a precisely co-ordinated series of molecular changes. These insights into the liver's molecular clock suggest that elastase, JNK and BmaI1 may represent new therapeutic targets for drugs or smart medicines to treat metabolic diseases such as diabetes or high blood pressure.
Introduction
Circadian rhythms regulate several biological processes through internal molecular mechanisms (Dibner et al., 2010) and the chronic perturbation of circadian rhythms is associated with the appearance of metabolic syndrome (Kolla and Auger, 2011). This homeostasis is closely dependent on the circadian system in the liver, which shows rhythmic expression of enzymes associated with glucose and lipid metabolism (Haus and Halberg, 1966; North et al., 1981; Tahara and Shibata, 2016). Moreover, mice with mutations in clock genes encoding nuclear receptors have impaired glucose and lipid metabolism and are susceptible to diet-induced obesity and metabolic dysfunction, consistent with the idea that these genes control hepatic metabolic homeostasis (Delezie et al., 2012; Kudo et al., 2008; Lamia et al., 2008; Rey et al., 2011; Tong and Yin, 2013; Turek et al., 2005; Yang et al., 2006). Besides, recent reports have shown that hepatic physiology follows a diurnal rhythm driven by clock genes, with expression of proteins involved in fatty acid synthesis higher in the morning while those controlling fatty acid oxidation are higher at sunset (Toledo et al., 2018; Zhou et al., 2015).
Blood leukocyte levels also oscillate diurnally, as does the release of hematopoietic stem cells and progenitor cells from the bone marrow (BM) (Haus and Smolensky, 1999; Lucas et al., 2008; Méndez-Ferrer et al., 2008) and their recruitment into tissues (Adrover et al., 2019; He et al., 2018; Scheiermann et al., 2012). Oscillatory expression of clock genes in peripheral tissues is largely tuned by the suprachiasmatic nucleus (Dibner et al., 2010; Druzd and Scheiermann, 2013; Huang et al., 2011; Reppert and Weaver, 2002); however, the potential regulation of daily rhythms of specific tissues by immune cells remains largely unexplored, both in steady state and during inflammation. Although the molecular mechanisms linking circadian rhythms and metabolic disease are largely unknown, several studies have demonstrated a strong association between leukocyte activation and metabolic diseases (McNelis and Olefsky, 2014). A prime example is the BM, where engulfment of infiltrating neutrophils by tissue-resident macrophages modulates the hematopoietic niche (Casanova-Acebes et al., 2013).
The circadian clock is dysregulated by obesity (Kohsaka et al., 2007; Xu et al., 2014), and recent studies suggest that liver leukocyte recruitment and migration show a circadian rhythm (Scheiermann et al., 2012; Solt et al., 2012) whose alteration can result in steatosis (Solt et al., 2012; Xu et al., 2014). Neutrophils are key factors in steatosis development (González-Terán et al., 2016; Keller et al., 2009; Mansuy-Aubert et al., 2013; Nathan, 2006) and show diurnal oscillations in their recruitment and migration to multiple tissues (Scheiermann et al., 2012; Solt et al., 2012). Here, we demonstrate that circadian neutrophil infiltration into the liver controls the expression of clock genes through the regulation of c-Jun NH2-terminal kinase (JNK) and the hepatokine fibroblast growth factor 21 (FGF21), driving adaptation to daily metabolic rhythm.
Results
Rhythmic neutrophil infiltration into the liver modulates the expression of hepatic clock genes
Virtually all cell types have an internal clock that controls their rhythmicity through the periodic expression of clock genes (Robles et al., 2014; Tahara and Shibata, 2016). However, it is unknown how these multiple cell rhythms are integrated. The liver is an essential metabolic organ that controls body glucose and lipid homeostasis (Manieri and Sabio, 2015), and neutrophil infiltration alters its function (González-Terán et al., 2016). We hypothesized that the metabolic cycles in the liver might be entrained by rhythmic neutrophil infiltration. To test this, we harvested liver, BM, and blood from C57BL6J mice at 4 hr intervals over a 24 hr period. Liver neutrophil infiltration showed a clear diurnal pattern, with a peak at ZT2, coinciding with liver-driven lipogenesis in mice (Zhou et al., 2015), and a nadir during the night, at ZT14 (Figure 1A), correlating with lipolysis (Zhou et al., 2015). These oscillations corresponded directly to changes in neutrophil numbers in blood (Figure 1—figure supplement 1A), suggesting that liver infiltration might result from higher neutrophil migration to the liver. We first confirmed that neutrophils were infiltrated in the liver using 3D microscopy. According to published data (Casanova-Acebes et al., 2018), infiltrated neutrophils presented an intrasinusoidal distribution in the liver, different to that observed in the Kupffer cells population (Figure 1B and Figure 1—figure supplement 1B). Then we evaluated whether myeloid chemokines could be involved in circadian neutrophil recruitment into the liver. Analysis of liver lysates indicated that the expression of the hepatocyte-derived neutrophil chemoattractant Cxcl1 (Su et al., 2018) was higher at ZT2 than a ZT14. Moreover, mRNA of Cxcl1 in liver samples showed the same oscillation pattern than infiltrated neutrophils, suggesting that this chemokine may be important in the regulation of the neutrophil diurnal cycle (Figure 1—figure supplement 1C).
Figure 1 with 2 supplements see all
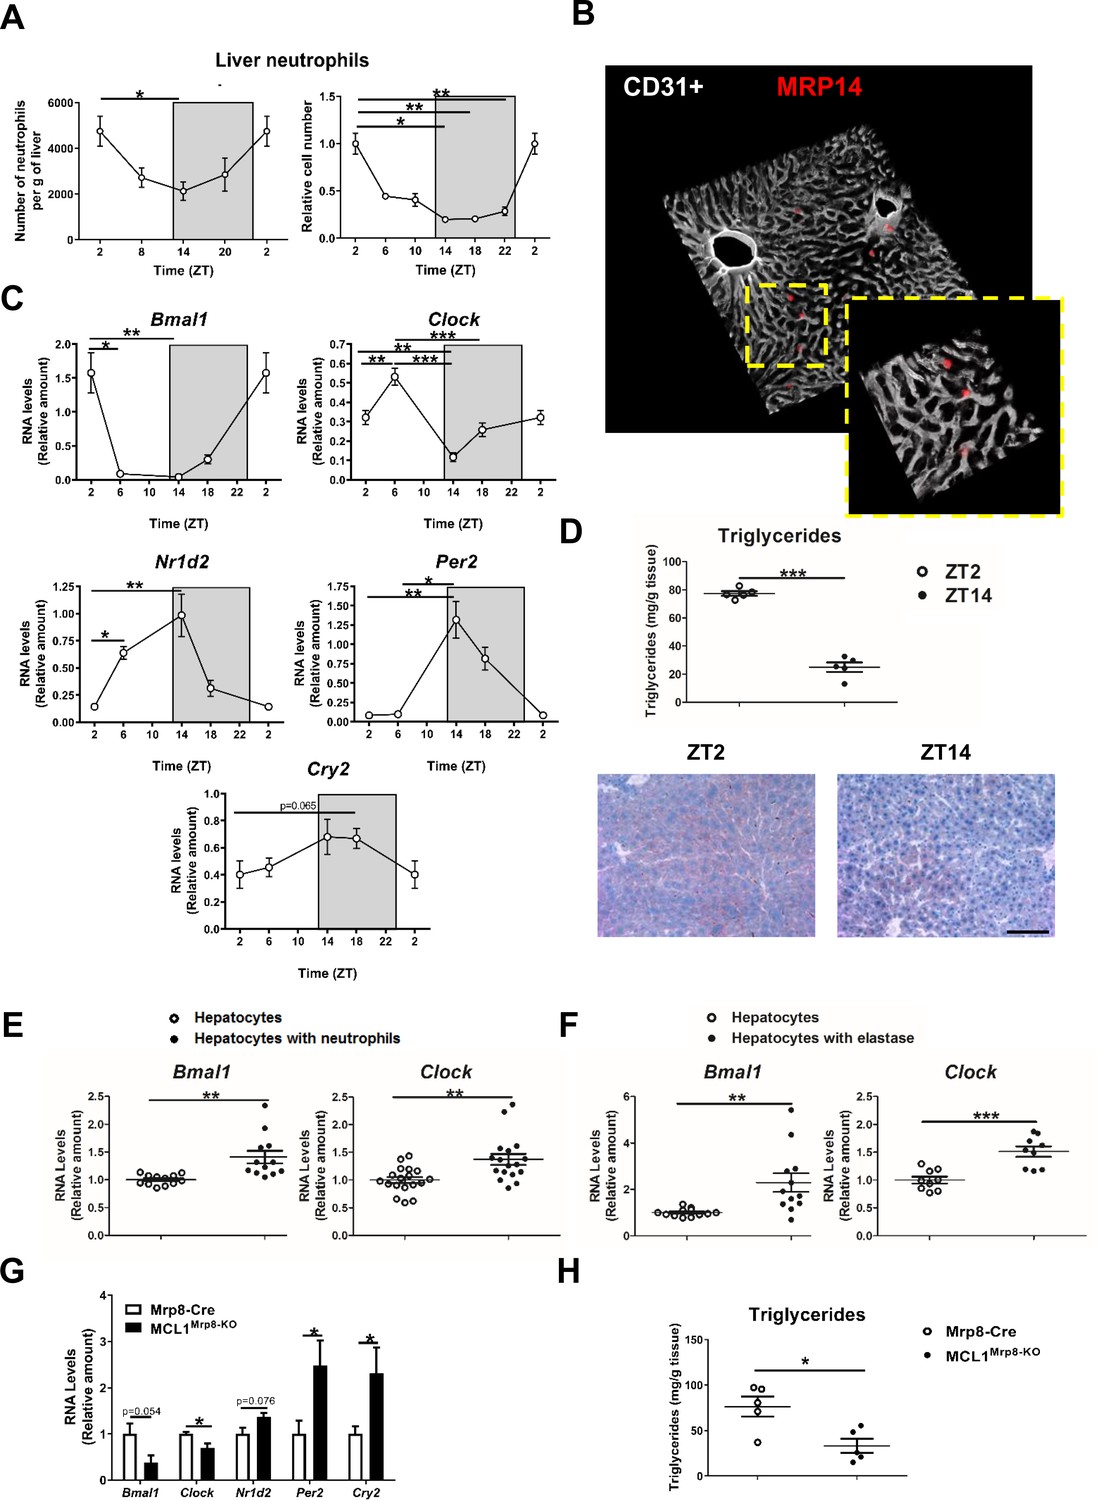
Neutrophil infiltration into the liver controls hepatic clock-gene expression.
(A) Flow cytometry analysis of the CD11b+Ly6G+ liver myeloid subset, isolated from C57BL6J mice at the indicated ZTs. Left, CD11b+Ly6G+ liver myeloid subset analyzed at 6 hr intervals and normalized by the tissue weight. Right, percentage of CD11b+Ly6G+ population analyzed at 4 hr intervals and normalized to ZT2 (n = 5). (B) Representative 3-D image of liver section showing the distribution on infiltrated neutrophils. Livers were stained with anti-S100A9 (Mrp14) (red) and vessels were stained with anti-CD31 and anti-endomucin (grey). Sizes of the liver sections are 510 x 510 x 28 µm and 160 x 160 x 28 µm, respectively. (C) qRT-PCR analysis of circadian clock-gene and nuclear-receptor mRNA expression in livers from C57BL6J mice at the indicated ZTs (n = 5). (D) Liver triglycerides and oil-red-stained liver sections prepared from C57BL6J mice at ZT2 and ZT14. Scale bar, 50 μm (n = 5). (E) qRT-PCR analysis of clock-gene mRNA in hepatocyte cultures exposed to freshly isolated FMLP-activated neutrophils (n = 4-6 wells of 3 independent experiments). (F) qRT-PCR analysis of clock-gene mRNA in hepatocyte cultures treated with 5 nM elastase (n = 3-4 wells of 3 independent experiments). (G) qRT-PCR analysis of clock-gene and nuclear-receptor mRNA expression in livers from control mice (Mrp8-Cre) and neutropenic mice (MCL1Mrp8-KO) sacrificed at ZT2 (n = 5). (H) Hepatic triglycerides detected in livers from control mice (Mrp8-Cre) and neutropenic mice (MCL1Mrp8-KO) at ZT2 (n = 5). Data are means ± SEM from at least 2 independent experiments. *p<0.05; **p<0.01; ***p<0.005 (A, left panel) One-way ANOVA with Tukey’s post hoc test. (A, right panel) Kruskal-Wallis test with Dunn’s post hoc test. (C) One-way ANOVA with Tukey’s post hoc test or Kruskal-Wallis test with Dunn’s post hoc test. (D to H) t-test or Welch’s test. ZT2 point is double plotted to facilitate viewing.
-
Figure 1—source data 1
Raw data and statistical test.
- https://cdn.elifesciences.org/articles/59258/elife-59258-fig1-data1-v1.xlsx
The infiltration pattern correlated with liver expression levels of the clock-gene Bmal1, peaking at ZT2 and bottoming at ZT14 (Figure 1C). Infiltration also correlated inversely with the expression of Nr1d2 (encoding Rev-erb β), Per2, and Cry2 (Figure 1C), which are important proteins in the control of circadian rhythms (Reppert and Weaver, 2002), consistent with the feedback loop that controls their expression. Bmal1 is thought to induce lipogenesis (Zhang et al., 2014), whereas Nr1d2 controls lipid metabolism and its reduced expression promotes lipogenesis and steatosis (Delezie et al., 2012; Solt et al., 2012). In agreement with these studies, liver triglycerides were higher at ZT2 than at ZT14 (Figure 1D).
Our results show a correlation between neutrophil infiltration, hepatocyte Bmal1 expression, and lipid metabolism regulation, raising the possibility that neutrophils signal to hepatocytes to modulate the expression of circadian genes. Exposure of mouse hepatocytes in vitro to freshly isolated neutrophils increased hepatocyte expression of the clock genes Bmal1 and Clock. In contrast, no effect was observed upon exposure to T or B lymphocytes, or macrophages, suggesting the existence of a neutrophil-to-hepatocyte communication that controls hepatocyte clock-gene expression (Figure 1E and Figure 1—figure supplement 1D).
We then investigated whether neutrophil elastase (NE), a proteolytic enzyme reported to regulate liver metabolism, could regulate hepatocyte clock genes (Mansuy-Aubert et al., 2013; Talukdar et al., 2012). Exposure to elastase reproduced the same increase in hepatocyte Bmal1 and Clock expression in contrast with another protease that did not affect Bmal1 expression (Figure 1F and Figure 1—figure supplement 1D).
Next, neutrophil-mediated regulation of liver clock-gene expression in vivo was investigated using a previously characterized genetic model of neutrophil deficiency (Dzhagalov et al., 2007; Steimer et al., 2009; Figure 1—figure supplement 1E,F and Figure 1—figure supplement 2A–C). Low hepatic neutrophil infiltration in neutropenic mice correlated with reduced expression of Bmal1 and Clock (Figure 1G) and increased expression of Cry2 and Per2 at ZT2 (Figure 1G). These changes in clock-gene expression were accompanied by lower liver triglyceride levels (Figure 1H). Furthermore, lack of neutrophils perturbed the diurnal rhythmicity in Bmal1, Clock, and Per2 expression in the liver without affecting clock genes in other organs such as the lung, in which there is no correlation between the peak of neutrophil infiltration and Bmal1 expression (Figure 1—figure supplement 2D,E). Our results thus indicate that neutrophils might specifically control the expression of hepatocyte circadian clock genes in steady state.
Disruption of daily neutrophil infiltration in the liver affects hepatocyte molecular clock and metabolism
Chronic jet lag alters liver circadian genes and disrupts liver metabolism (Kettner et al., 2016). Analysis of a mouse model of jet lag revealed complete disruption of the circadian liver neutrophil infiltration with increased hepatic neutrophil infiltration even at ZT14 (Figure 2A). Abolition of rhythmic neutrophil hepatic infiltration under jet lag correlated with increased steatosis and high levels of liver triglycerides (Figure 2B). To evaluate whether the metabolic effect of circadian perturbation was caused by the increased neutrophil infiltration, we exposed neutropenic and control mice to the jet lag protocol (Figure 2—figure supplement 1A,B). Jet lag-induced steatosis was less severe in neutropenic mice (Figure 2C), and disruption of diurnal liver expression of Bmal1 detected in control jet-lagged mice was partially ablated in neutropenic mice (Figure 2D). Similar results were also observed in mice with impaired neutrophil migration such as Cxcr2MRP8-KO BM transplanted mice (Eash et al., 2010; Mei et al., 2012) and p38γ/δLyzs-KO mice (González-Terán et al., 2016). In both models, the reduction of neutrophil infiltration correlated with decreased levels of liver Bmal1 expression and protection from jet lag-induced steatosis (Figure 2—figure supplement 1C–G). These results are consistent with the role of neutrophils in the control of liver clock genes.
Figure 2 with 2 supplements see all

Increased hepatic neutrophil infiltration alters clock-genes expression and augments triglyceride content in the liver.
(A–D) Control (Lyzs-Cre) (A–B) and control and neutropenic (MCL1Lyzs-KO) mice (C–D) were housed for 3 weeks with a normal 12 hr: 12 hr light/dark cycle (Normal Cycle) or with the dark period extended by 12 hr every 5 days (JetLag). Samples were obtained at the indicated ZTs. (A) Left, flow cytometry analysis of the CD11b+Ly6G+ liver myeloid subset. Data represents the percentage CD11b+Ly6G+ normalized to Normal Cycle ZT2. Right, circulating neutrophils in whole blood. (n = 5-8). (B) Liver triglycerides and representative oil-red-stained liver sections at ZT14. Scale bar, 50 μm (n = 9-10). (C) Hepatic triglyceride content analyzed at 6 hr intervals, and representative oil-red-stained liver sections at ZT14. Scale bar, 50 μm (n = 4-6). (D) qRT-PCR analysis of Bmal1 mRNA in livers. (n = 5-8). (E) Flow cytometry analysis of the CD11b+Ly6G+ liver myeloid subset isolated at 6 hr intervals from C57BL6J mice fed a ND, a HFD (8 weeks) or a MCD (3 weeks). The chart shows the CD11b+Ly6G+ population as a percentage of the total intrahepatic CD11b+ leukocyte population normalized to ND group at ZT2 (n = 5 to 10). (F–I) Control mice (Lyzs-Cre) and neutropenic mice (MCL1Lyzs-KO) or p38γ/δLyzs-KO were fed a ND or the MCD diet for 3 weeks and sacrificed at ZT2. (F) Representative images of the infiltration of neutrophils in the liver stained with anti-Mrp14 (blue) and anti-NE (red); nuclei with Sytox Green. Scale bar, 50 μm (Top) and 25 μm (Bottom). (G) qRT-PCR analysis of clock-gene expression in livers (n = 6). (H) Liver triglycerides and representative oil-red-stained liver sections. Scale bar, 50 μm (n = 7-6). (I) qRT-PCR analysis of clock genes in livers at ZT2 (n = 9-17). Data are means ± SEM from at least two independent experiments. *p<0.05; **p<0.01; ***p<0.005 (A to D) t-test or Welch’s test. (E) Two-way ANOVA with Fisher’s post hoc test; p<0.05 ND vs HFD; p<0.0001 ND vs MCD. *p<0.05; ***p<0.005 (G to I) t-test or Welch’s test. ZT2 point is double plotted to facilitate viewing.
-
Figure 2—source data 1
Raw data and statistical test.
- https://cdn.elifesciences.org/articles/59258/elife-59258-fig2-data1-v1.xlsx
Inflammation plays a key role in the pathogenesis of non-alcoholic fatty liver disease (Tiniakos et al., 2010) and the development of hepatic steatosis is associated with increased liver infiltration by myeloid cells, particularly neutrophils (González-Terán et al., 2016; Mansuy-Aubert et al., 2013; Talukdar et al., 2012; Tiniakos et al., 2010). Two widely used mouse models of hepatic steatosis, high-fat diet (HFD) and methionine-choline-deficient (MCD) diet, increased liver neutrophil infiltration in WT mice at ZT2, ZT14, and ZT18 (Figure 2E,F). Consistent with a neutrophil-to-hepatocyte communication in the regulation of hepatocyte clock genes, the MCD diet enhanced Bmal1 expression and inhibited Cry2 and Per2 expression in control mice, but not in neutropenic mice at ZT2 (Figure 2G). Altered liver clock-gene regulation in neutropenic mice was associated with protection against steatosis and lower liver triglycerides (Figure 2H). To confirm the role of neutrophils in modulating liver clock genes, we depleted neutrophils by injecting anti-Ly6G antibody into MCD diet-fed mice (González-Terán et al., 2016). Anti-Ly6G administration for 7 days reduced circulating neutrophil levels without affecting monocytes (Figure 2—figure supplement 2A,B), and treatment for 21 days markedly decreased hepatic diurnal Bmal1 and Clock expression, increased expression of Cry2, and Per2 (Figure 2—figure supplement 2C) and consequently reduced steatosis (González-Terán et al., 2016).
To further support the role of neutrophil liver infiltration in the regulation of liver clock genes and hepatic lipogenesis during diet-induced steatosis, we leveraged a mouse model (p38γ/δLyzs-KO) that exhibits deficient neutrophil migration and subsequently, reduced liver neutrophil infiltration after MCD diet (González-Terán et al., 2016). Compared with diet-matched control (Lyzs-Cre) mice, MCD-diet-fed p38γ/δLyzs-KO mice showed hepatic down-regulation of Bmal1, which was associated with higher expression of Cry2, and Per2 (Figure 2I). These results suggest that the reduced neutrophil infiltration in mice lacking myeloid p38γ/δ expression is responsible for the altered expression of circadian clock genes. Overall, these findings strongly support that neutrophil infiltration modulates clock-gene expression in the liver, with downstream effects on liver metabolism.
Regulation of daily hepatic metabolism by neutrophils through JNK-FGF21 axis
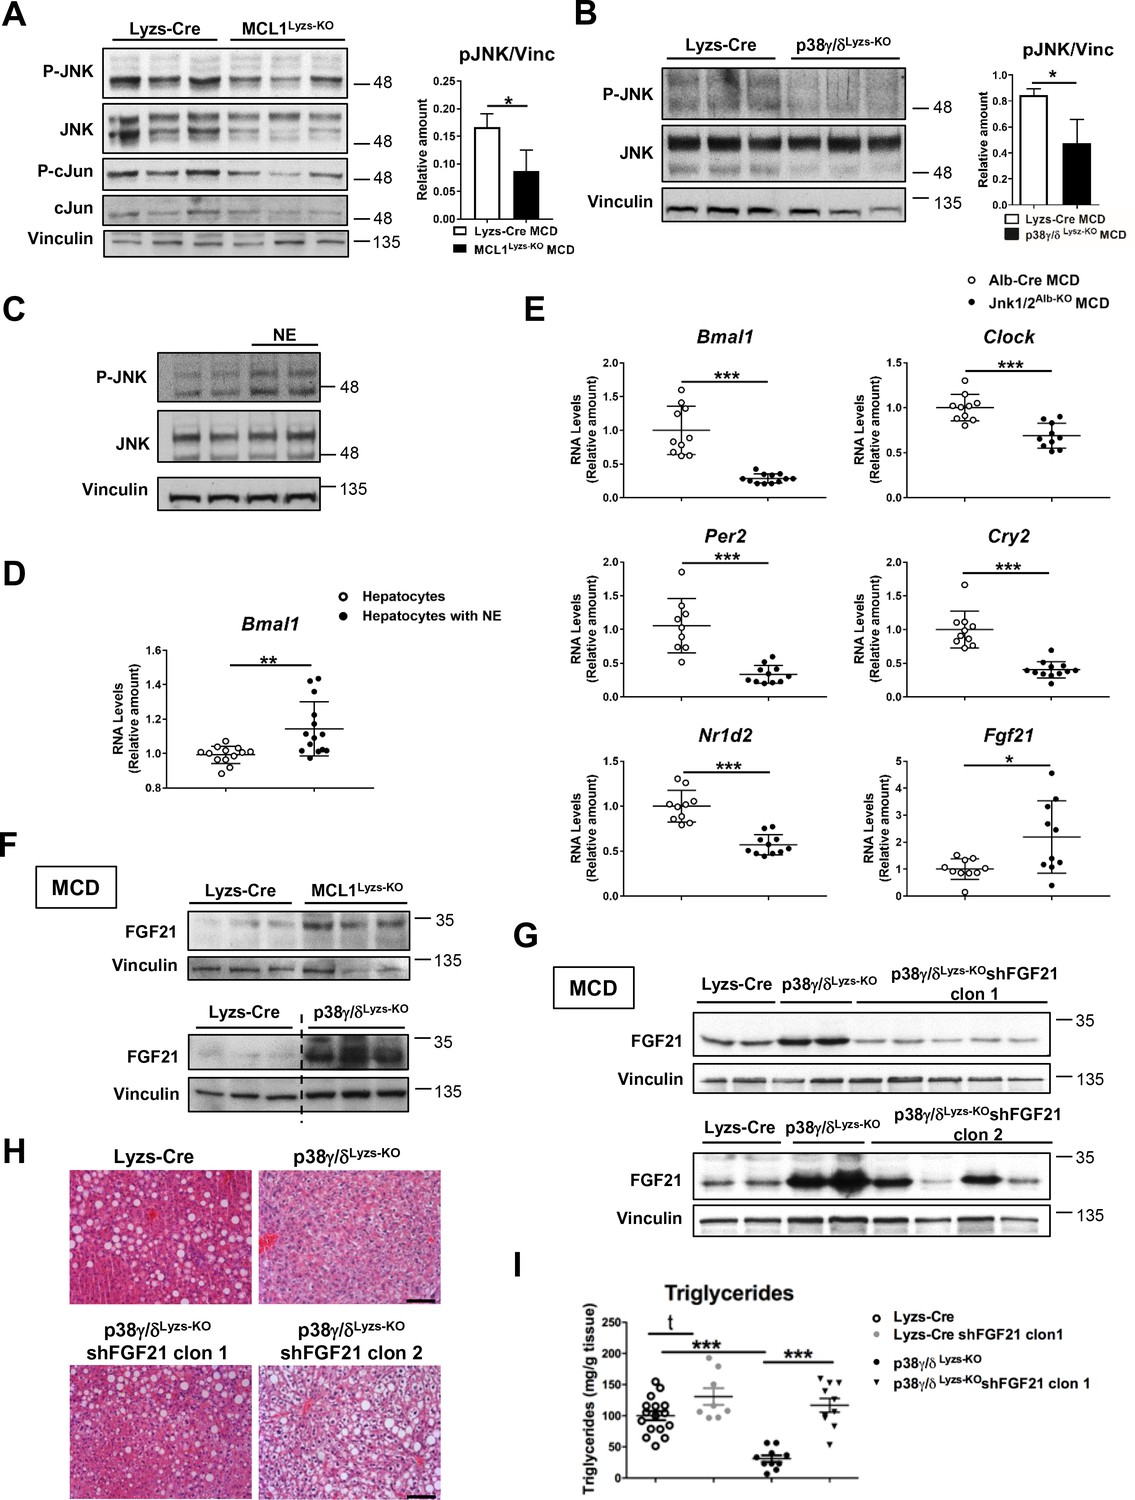
It has been suggested that JNK activation in the liver may be regulated in a circadian manner with a peak at noon (Robles et al., 2014). To evaluate whether neutrophils might mediate this diurnal regulation of JNK, we analyzed JNK activation in neutropenic mice. Lack of neutrophils was associated with lower liver expression and activation of JNK, lower activation of the JNK downstream effector c-Jun, and lower expression of acetyl-CoA carboxylase (Acaca), a key enzyme in metabolic regulation (acetyl-CoA carboxylase; ACC) that mediates inhibition of beta-oxidation and activation of lipid biosynthesis (Figure 3A and Figure 3—figure supplement 1A). Similar results were found in p38γ/δLyzs-KO mice, in which reduced liver neutrophil infiltration was associated with decreased JNK phosphorylation and ACC protein levels (Figure 3B and Figure 3—figure supplement 1B). Moreover, neutrophil-treated hepatocytes showed increased JNK activation together with increased levels of ACC expression (Figure 3—figure supplement 1C). NE represents a potential mediator of this neutrophil function because elastase-treated hepatocytes also showed higher JNK activation, suggesting that this protease modulates the expression of the clock genes through the JNK signaling pathways (Figure 3C and Figure 3—figure supplement 1D). This JNK activation was accompanied by increased Bmal1 expression (Figure 3D), indicating that neutrophils altered liver clock-gene expression through the elastase-JNK pathway.
Figure 3 with 1 supplement see all
Diurnal regulation of liver metabolism involves neutrophil-mediated regulation of JNK and the hepatokine FGF21.
Immunoblot analysis of JNK content and activation at ZT2 in liver extracts prepared from control (Lyzs-Cre) and neutropenic (MCL1Lyzs-KO) mice fed a MCD diet for 3 weeks (A) or Lyzs-Cre and p38γ/δLyzs-KO mice after 3 weeks of MCD diet (B). Immunoblot analysis of JNK content and activation (C) and Bmal1 RNA expression (D) in hepatocyte cultures exposed to NE for 2 hr (n = 14 wells of 3 independent experiments). Immunoblot quantification is shown in Figure 3—figure supplement 1D (E) qRT-PCR analysis of clock genes and Fgf21 in livers from Alb-Cre, and JNK1/2Alb-KO mice after 3 weeks of MCD diet at ZT2 (n = 9-12). (F) Immunoblot analysis of FGF21 content in liver extracts prepared from control (Lyzs-Cre) and neutropenic (MCL1Lyzs-KO) mice, or from Lyzs-Cre, and p38γ/δLyzs-KO mice after 3 weeks of MCD diet sacrificed at ZT2. Immunoblot quantification is shown in Figure 3—figure supplement 1I,J. (G–I) Lyzs-Cre and p38γ/δLyzs-KO mice were injected with 2 shRNA independent clones targeting FGF21. Seven days after infection, mice were placed on the MCD diet and sacrificed after 3 weeks at ZT2. (G) Immunoblot analysis of FGF21 content in liver extracts prepared from Lyzs-Cre, p38γ/δLyzs-KO, and p38γ/δLyzs-KO mice infected with FGF21 shRNA. Immunoblot quantification is shown in Figure 3—figure supplement 1K. (H) Representative H&E-stained liver sections. Scale bar, 50 μm. (I) Hepatic triglyceride content at the end of the treatment period (n = 8-10). Data are means ± SEM from at least 2 independent experiments. *p<0.05; **p<0.01; ***p<0.005 (A, B, D and E) t-test or Welch’s test. (I) One-way ANOVA with Bonferroni post hoc test or t-test.
-
Figure 3—source data 1
Raw data and statistical test.
- https://cdn.elifesciences.org/articles/59258/elife-59258-fig3-data1-v1.xlsx
Our results suggest that neutrophil-mediated JNK activation might modulate hepatocyte clock genes and metabolism through the regulation of ACC. Supporting this hypothesis, specific JNK depletion in hepatocytes downregulated Bmal1, Clock, and Acaca compared to Alb-Cre (Figure 3E and Figure 3—figure supplement 1E). According to these results, JNK inhibition reduced the expression of Bmal1, Clock and Acaca in WT liver but not in neutropenic mice (Figure 3—figure supplement 1F,G). These data strongly suggest that JNK activation caused by neutrophil infiltration modulates clock genes and daily metabolism in hepatocytes.
JNK is an important modulator of the expression of the hepatokine circadian regulator FGF21 (Vernia et al., 2014), which controls glucose and lipid metabolism (Fisher and Maratos-Flier, 2013; Li et al., 2013; Potthoff et al., 2012). Mice lacking JNK in hepatocytes had higher FGF21 mRNA expression (Figure 3E). In concordance with high JNK activation, FGF21 expression was reduced in neutrophil-exposed hepatocytes (Figure 3—figure supplement 1H). Moreover, neutropenic and p38γ/δLyzs-KO mice showed increased FGF21 expression (Figure 3F and Figure 3—figure supplement 1I,J), which was consistent with the reduced hepatocyte JNK activation in these mice.
To further define the role of FGF21 in the neutrophil-mediated regulation of liver metabolism, we suppressed FGF21 expression using two independent lentiviral shRNA vectors (Figure 3G and Figure 3—figure supplement 1K). The protection of p38γ/δLyzs-KO mice against MCD-diet-induced alterations was abrogated by shFGF21 and these mice developed steatosis with an elevated hepatic triglyceride content (Figure 3H,I). These data further supported the idea that neutrophil infiltration controls liver metabolism through the regulation of FGF21 expression.
Neutrophil elastase deficiency affects the expression patterns of clock genes and lipid metabolism
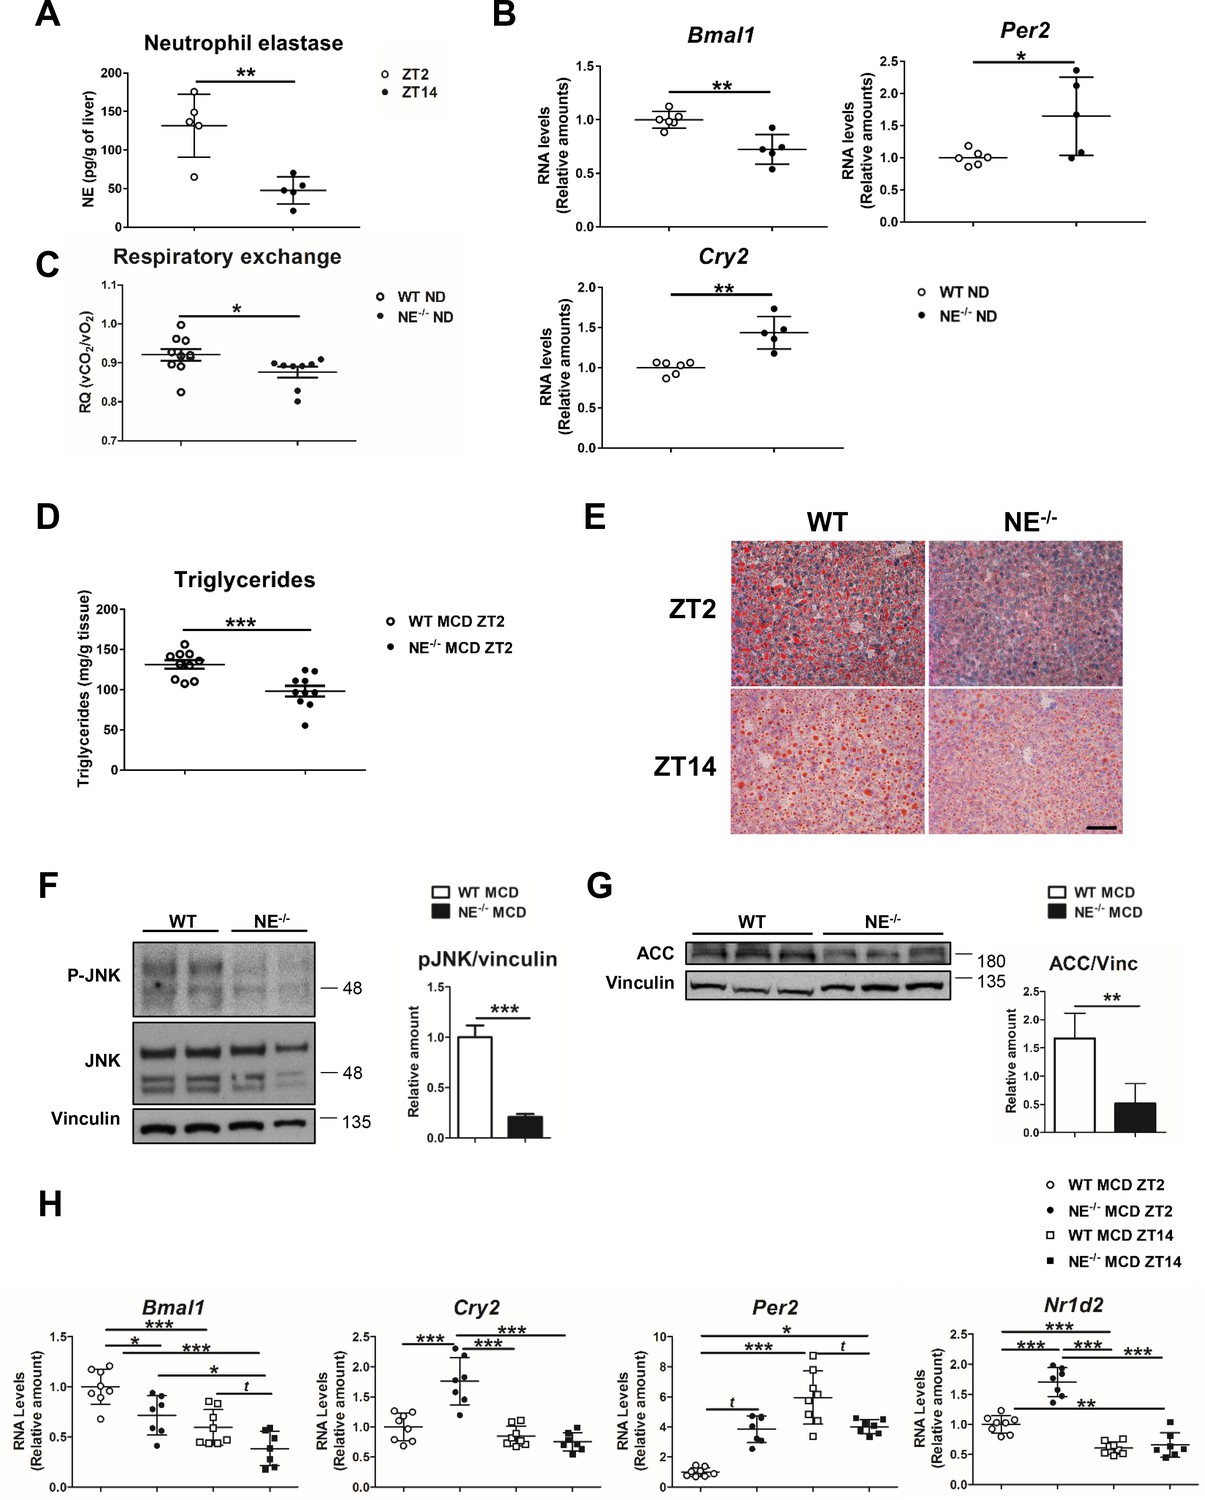
To formally confirm the involvement of NE in circadian clock alteration, we first evaluated the diurnal oscillation of NE levels in liver from WT mice fed a normal diet (ND). According to infiltration pattern of neutrophils in the liver (Figure 1A), we found higher NE levels at ZT2 than at ZT14. (Figure 4A). Next, circadian clock-gene expression in NE-/- mice revealed lower Bmal1 and elevated Per2 and Cry2 expression, compared to control mice (Figure 4B), which mimicked the behavior of neutropenic mice. In addition, NE-/- mice presented lower respiratory quotient during the lights-on period than WT mice, indicating that these mice have increased fat utilization as a source of energy (Figure 4C), supporting the data that reduced liver-neutrophil infiltration results in higher lipid oxidation. Interestingly, when fed MCD or HFD diet, NE-/- mice were protected against steatosis (Figure 4D,E and Figure 4—figure supplement 1A,B), presented lower JNK activation, and expressed less ACC than control mice (Figure 4F,G and Figure 4—figure supplement 1D). Besides, NE-/- mice were protected against alterations in clock-gene expression induced by MCD diet, presenting lower expression of Bmal1 and higher of Cry2 and Per2 comparing to control mice at ZT2 (Figure 4H). Furthermore, under HFD, NE-/- mice were also refractory to these changes as these mice maintained a pattern of clock-gene expression similar to control mice in ND (Figure 4—figure supplement 1E).
Figure 4 with 1 supplement see all
Elastase controls liver clock-gene expression modulating JNK activation.
(A) Extracellular NE levels in livers from WT mice at ZT2 and ZT14. (B) qRT-PCR analysis of clock-genes and nuclear-receptor mRNA expression in livers from WT and NE KO mice (NE-/-) at ZT2 (n = 5–6). (C) Respiratory exchange ratio of WT and NE-/- mice fed with ND. Results are from the lights-on period (n = 9). (D–H) WT and NE-/- mice were fed a MCD diet for 3 weeks and sacrificed at the indicated time. (D) Liver triglycerides at the end of the diet period. (E) Representative oil-red-stained liver sections. Scale bar, 50 μm (n = 10). (F) Immunoblot analysis and quantifications of JNK content and activation in liver extracts prepared from WT and NE-/-. (G) Immunoblot analysis and quantification of ACC content in liver extracts from WT and NE-/- mice. (H) qRT-PCR analysis of clock-genes and nuclear-receptor mRNA expression in livers from WT and NE-/- mice at ZT2 and ZT14 (n = 7–8). Data are means ± SEM from at least two independent experiments. *p<0.05; **p<0.01; ***p<0.005 (A to G) t-test or Welch’s test. (H) One-way ANOVA with to Tukey’s post hoc test, t-test or Welch’s test.
-
Figure 4—source data 1
Raw data and statistical test.
- https://cdn.elifesciences.org/articles/59258/elife-59258-fig4-data1-v1.xlsx
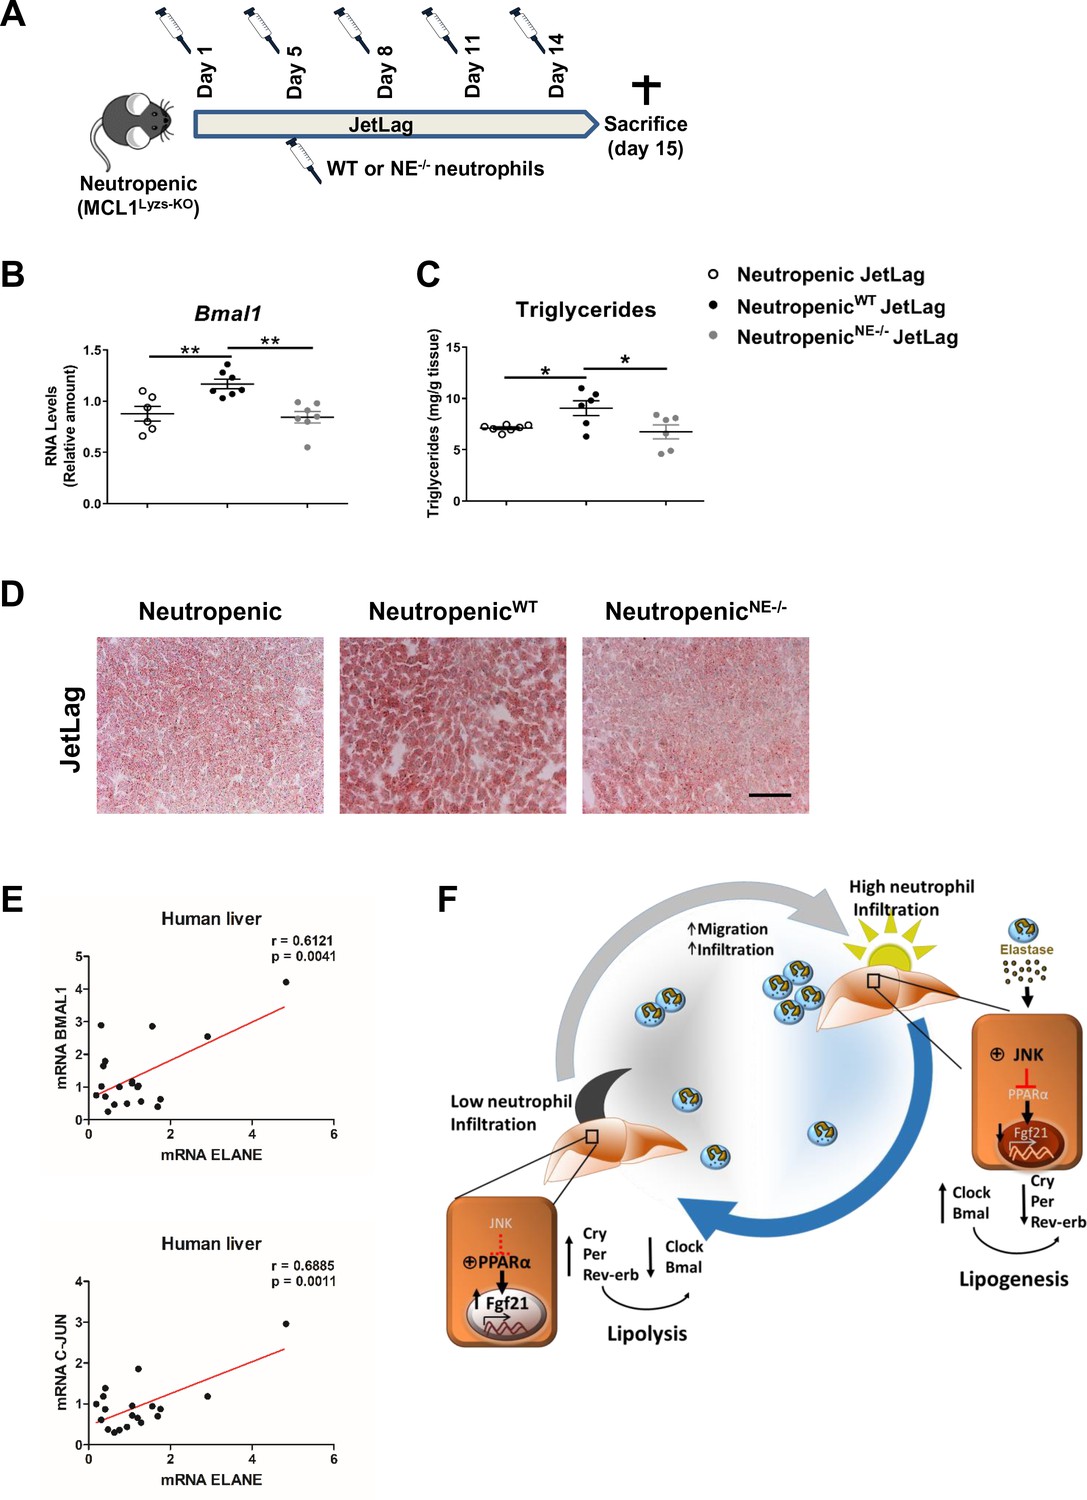
To formally test a direct contribution of NE in the regulation of hepatic clock-gene expression and liver metabolism, we infused WT or NE-/- neutrophils into neutropenic mice under the jet lag protocol (Figure 5A). The infusion of WT neutrophils was able to increase Bmal1 expression in the liver after jet lag, while neutropenic mice infused with NE-/- neutrophils presented the same levels of Bmal1 than non-infused neutropenic mice (Figure 5B). In addition, while infusion of neutropenic mice with WT neutrophils increased steatosis, neutropenic mice infused with NE-/- neutrophils presented the same levels of steatosis than control neutropenic mice (Figure 5C,D). All these data indicate that diet or jet-lag -induced hepatic infiltration of neutrophils results in dysregulation of the liver clock, and the lack of NE is enough to protect mice against these alterations.
Figure 5
Neutrophil elastase reverses neutropenic mice phenotype through regulation of daily hepatic metabolism.
(A–D) Neutropenic (MCL1Lyzs-KO) mice were housed for 2 weeks with the dark period extended by 12 hr every 5 days (JetLag). Mice were infused with purified WT or NE-/- neutrophils. Samples were obtained at ZT14. (A) Picture describing the neutrophil infusion schedule during the JetLag protocol. (B) qRT-PCR analysis of Bmal1 mRNA in livers. (C) Liver triglycerides and (D) representative oil-red-stained liver sections. Scale bar, 50 µm (n = 6-7). Data are means ± SEM. *p<0.05; t-test. (E) Correlation between mRNA levels of BMAL1 and ELANE (r = 0.6141; p = 0.0052) or JUN and ELANE (r = 0.7362; p = 0.001105) in human livers. The mRNA levels of JUN, BMAL1 and ELANE were determined by qRT-PCR. Linear relationships between variables were tested using Pearson’s correlation coefficient (n = 23). (F) Circadian neutrophil infiltration regulates hepatic metabolism through elastase, JNK and FGF21. Data are means ± SEM. *p< 0.05; **p< 0.01; (B) One-way ANOVA with Tukey’s pots hoc test. (C) t-test or Welch’s test.
-
Figure 5—source data 1
Baseline characteristics of the human cohort.
- https://cdn.elifesciences.org/articles/59258/elife-59258-fig5-data1-v1.xlsx
Finally, to evaluate the translational relevance of these findings for human physiology we quantified in human livers the expression levels for the genes encoding NE, JUN (as an indicator of JNK activation) and Bmal. Our results suggest that the levels of ELANE expression directly correlate with BMAL1 and JUN mRNA in livers from a human cohort (Figure 5E). These correlations reinforce the idea that a rhythmic neutrophil infiltration in the liver controls the expression of clock genes through the JNK pathway activation and could be a target for therapeutic intervention during non-alcoholic fatty liver disease.
Discussion
Our analysis demonstrates that neutrophils control clock genes in the liver and that reduced neutrophil infiltration protects against jet lag and diet-induced liver steatosis by altering the expression of these temporal regulators. These findings establish neutrophils as unexpected players in the regulation of daily hepatic metabolism. Our results also demonstrate that at least part of this neutrophil-induced clock modulation is mediated by elastase. These results agree with previous data showing that NE mediates the deleterious effects of neutrophils on liver metabolism and that mice lacking NE are protected against diet-induced steatosis (Mansuy-Aubert et al., 2013; Talukdar et al., 2012). The molecular mechanism underlying this regulation involves neutrophil NE that induces activation of JNK and consequently inhibits the production of the hepatokine FGF21. The JNK pathway is an important modulator of liver metabolism, and lack of JNK1 and JNK2 in hepatocytes protects against steatosis (Manieri and Sabio, 2015). Here, we also demonstrate that JNK also regulates hepatocyte clock genes and, therefore, modulates diurnal adaptation of liver metabolism.
Recently published data have demonstrated that lipogenesis is increased in the light phase, in agreement with our analysis (Guan et al., 2018). We show that neutrophil infiltration causes JNK activation down-stream of elastase secretion, a time-dependent process. Indeed, phosphoproteomic analysis of the hepatic phosphorylation network identifies JNK as a key signaling enzyme with peak activation at ZT6 (Robles et al., 2017) immediately prior to the peak of lipogenic gene expression (Guan et al., 2018). Our results suggest that neutrophils induce an accumulative activation of JNK with a peak during the day that would control the lipogenic program.
Recent evidence established that the metabolic effects of JNK in the liver are mediated by FGF21 (Vernia et al., 2016; Vernia et al., 2014). Our results now show that liver FGF21 expression can be modulated through the control of JNK by neutrophils. Reduction of FGF21 by shRNA reverted the protective effect and metabolic changes induced by reduced neutrophil infiltration. In conclusion, our results show that the diurnal oscillating migratory properties of neutrophils regulate liver function in a manner that preserves daily metabolic rhythms, and that disturbance of this rhythmicity can cause disease. These results might imply a novel mechanism of action for the potential use of clock-modulating small molecules in liver health.
Materials and methods
Study population
Request a detailed protocolFor the analysis of human liver mRNA levels, individuals were recruited among patients who underwent laparoscopic cholecystectomy for gallstone disease. The study was approved by the Ethics Committee of the University Hospital of Salamanca (Spain), and all subjects provided written informed consent to participate. Patients were excluded if they had a history of alcohol use disorders or excessive alcohol consumption, chronic hepatitis C or B, or body mass index ≥35. Baseline characteristics of these groups are listed in Figure 5—source data 1.
Animal models
Request a detailed protocolNeutropenic mice were generated with MCL1 (B6.129-Mcl1tm3Sjk/J) crossed with B6.Cg-Tg(S100A8-Cre,-EGFP)1Ilw/J mice or B6.129P2-Lyz2tm1(cre)Ifo/J mice. Mice deficient in NE, with compound JNK1/2 deficiency in hepatocytes, with Cxcr2 deficiency in neutrophils or with p38γ/δ deficiency in myeloid compartment have been described (Belaaouaj et al., 1998; Das et al., 2011; Das et al., 2009; González-Terán et al., 2016) All mice were backcrossed for 10 generations to the C57BL/6J background (Jackson Laboratory). Genotypes were confirmed by PCR analysis of genomic DNA.
Mice were housed under a 12 hr light:12 hr dark cycle (Light is on at Zeitgeber Time ZT0 and off at ZT12). For jet lag experiments, the 12 hr:12 hr dark/light cycle was disrupted by extending the dark cycle 12 hr every 5 days over 3 weeks (Kettner et al., 2016). Cxcr2MRP8-KO chimeras were generated by exposing WT recipient mice to 2 doses of ionizing radiation (625 Gy) and reconstituting them with 5 × 10⁶ donor BM (Cxcr2MRP8-KO) cells injected into the tail vein.
Mice were fed a methionine-choline-deficient (MCD) diet for 3 weeks or a high-fat diet (HFD) for 8 weeks (Research Diets Inc). For neutrophil depletion, mice mini-osmotic pumps (Alzet) were implanted with anti-Ly6G antibody or saline (0.4 mg/kg per day, 21 days). For JNK inhibition experiments, mice were intraperitoneally injected with SP600125 (15 mg/kg) (Santa Cruz Biotechnology) at ZT0. For neutrophil infusion experiments, mice were intravenously injected with 3 × 10⁶ WT or NE-/- purified neutrophils each 3–4 days. Neutrophils were isolated from BM using biotinylated anti-Ly6G antibody (Clone:1A8) and streptavidin-labeled magnetic microbeads (Miltenyi Biotec).
All animal procedures conformed to EU Directive 86/609/EEC and Recommendation 2007/526/EC regarding the protection of animals used for experimental and other scientific purposes, enacted under Spanish law 1201/2005.
Cell cultures
Request a detailed protocolHepatocytes were isolated from adult females by collagenase liver perfusion and cells were filtered through a 70 μm strainer. Hepatocytes pelleted from centrifuged Percoll gradients were plated at 4 × 10⁵ cells/well on 6-well plates coated with collagen type one and incubated at 37°C. After 24 hr, cells were treated with 0.5 mM palmitate (Sigma-Aldrich) for 6 hr and then exposed for 1 hr to freshly neutrophils (2 × 10⁶ cells/well) in the presence of 1 µM FMLP (Sigma-Aldrich). Neutrophils were isolated from BM as described above. For some experiments, neutrophils were sorted purified form the BM using an anti-Ly6G antibody (Clone: 1A8). T and B lymphocytes were sorted purified from spleens using anti-CD3 (Clone: 145–2 C11) and anti-B220 (Clone: RA3-6B2), and bone marrow macrophages (BMDM) were differentiated as previously described (González-Terán et al., 2013). All antibodies were purchased from BD Pharmingen. Alternatively, hepatocytes were exposed 2 hr to 5 nM NE (R and D Systems) or 0.5 mg/mL of collagenase A (Roche) after palmitate treatment.
Isolation of liver-infiltrating leukocytes
Request a detailed protocolMice were perfused with 20 mL of PBS and livers were collected and dissociated. Cell suspension was passed through a 70 μm strainer and centrifuged twice at 50 xg for 2 min to discard the liver parenchyma. For some experiments, livers were incubated for 15 min with 1 mg/mL Collagenase A (Roche) and 2 U/mL DNase (Sigma) at 37°C, and lungs were incubated for 25 min with 0,25 mg/ml Liberase TL (Sigma) and 5 U/mL DNase (Sigma) at 37°C Leukocyte fraction was collected and stained with anti-CD45 (Clone: 30-F11), from Invitrogen, anti-CD11b (Clone: M1/70), anti-Ly6G (Clone: 1A8) or anti-Ly6C/G (Clone: RB6-8C5), from BD Pharmingen, and alternatively, with anti-F4/80 (Clone: BM8), from Invitrogen, and Goat anti-Clec4F from R and D Systems and conjugated with anti-goat Alexa 647. Cells were sorted on a FACSAria to >95% purity. Flow cytometry experiments were performed with a FACScan cytofluorometer (FACS Canto BD), and data were analyzed with FlowJo software.
Lentivirus vector production
Request a detailed protocolTransient calcium phosphate transfection of HEK-293 cells (#CRL-1573, ATCC) was performed with the pGIPZ empty or pGIPZ.shFGF21 vector (V3LMM_430499 and V3LMM_430501, from Dharmacon) together with pΔ8.9 and pVSV-G. The supernatants were collected, centrifuged (700 xg, 4°C, 10 min) and concentrated (165x) by ultracentrifugation for 2 hr at 121,986 xg at 4°C (Ultraclear Tubes, SW28 rotor and Optima L-100 XP Ultracentrifuge; Beckman). Mice received tail-vein injections of 200 μl of lentiviral particles.
RNA analysis
Request a detailed protocolExpression of mRNA was examined by qRT-PCR using a 7900 Fast Real Time thermocycler and Fast Sybr Green assays (Applied Biosystems). Relative mRNA expression was normalized to Gapdh and Actb mRNA. The primers used were as follows: Actb (F: GGCTGTATTCCCCTCCATCG; R: CCAGTTGGTAACAATGCCATGT); Gapdh (F: TGAAGCAGGCATCTGAGGG; R: CGAAGGTGGAAGAGTGGGA); Clock (F: AGAACTTGGCATTGAAGAGTCTC; R: GTCAGACCCAGAATCTTGGCT); Bmal1 (F: TGACCCTCATGGAAGGTTAGAA; R: GGACATTGCATTGCATGTTGG); Nr1d2 (F: CAGACACTTCTTAAAGCGGCACTG; R: GGAGTTCATGCTTGTGAAGGCTGT); Cry2 (F: CACTGGTTCCGCAAAGGACTA; R: CCACGGGTCGAGGATGTAG); Per2 (F: GAAAGCTGTCACCACCATAGAA; R: AACTCGCACTTCCTTTTCAGG); Acaca (F: GATGAACCATCTCCGTTGGC; R: GACCCAATTATGAATCGGGAGTG); Fgf21 (F: CTGCTGGGGGTCTACCAAG; R: CTGCGCCTACCACTGTTCC); Mip1a (F: TTCTCTGTACCATGACACTCTGC; R: CGTGGAATCTTCCGGCTGTAG); Mip2 (F: CCAACCACCAGGCTACAGG; R: GCGTCACACTCAAGCTCTG); KC (F: CTGGGATTCACCTCAAGAACATC; R: CAGGGTCAAGGCAAGCCTC); Sdf-1 (F: GCTCTGCATCAGTGACGGTA; R: ATCTGAAGGGCACAGTTTGG); Elane (F: ATTTCCGGTCAGTGCAGGTAGT; R: GGTCAAAGCCATTCTCGAAGAT); GAPDH (F: CCATGAGAAGTATGACAACAGCC; R: GGGTGCTAAGCAGTTGGTG); ELANE (F: TCCACGGAATTGCCTCCTTC; R: CCTCGGAGCGTTGGATGATA); BMAL1 (F: GCCGAATGATTGCTGAGG; R: CACTGGAAGGAATGTCTGG); JUN (F: GGATCAAGGCGGAGAGGAAG; R: GCGTTAGCATGAGTTGGCAC).
Measurement of hepatic triglycerides
Request a detailed protocolLipids were extracted from 25 mg of liver in isopropanol (50 mg/mL) and centrifuged (15 min 9500 xg 4°C). Triglycerides were detected in the supernatant (Sigma-Aldrich).
Histology
Request a detailed protocolTissue samples were fixed in 10% formalin for 48 hr, dehydrated, and embedded in paraffin. Sections (5 μm) were cut and stained with hematoxylin and eosin (Sigma-Aldrich and Thermo Scientific). Sections (8 µm) from frozen tissue and embedded in OCT compound (Tissue-Tek) were stained with Oil Red O (American Master Tech Scientific). Sections were examined in Leica DM2500 microscope using 20x objective.
Immunoblotting
Request a detailed protocolTissue extracts were prepared in Triton lysis buffer [20 mM Tris (pH 7.4), 1% Triton X-100, 10% glycerol, 137 mM NaCl, 2 mM EDTA, 25 mM β-glycerophosphate, 1 mM sodium orthovanadate, 1 mM phenylmethylsulfonyl fluoride, and 10 µg/mL aprotinin and leupeptin]. Extracts (20–50 µg protein) were examined by immunoblot. The antibodies employed were anti-FGF21 (1/1000, #RD281108100, BioVendor), anti-phospho JNK (1/1000, #4668S, Cell Signaling), anti-JNK (1/1000, #9252S, Cell Signaling), anti-phospho c-Jun (1/1000, #9164L, Cell Signaling), anti-c-Jun (1/1000, #9165S, Cell Signaling), anti-ACC (1/1000, #3676S, Cell Signaling), and anti-vinculin (1/5000, #V9131, Sigma). Anti-phospho JNK and anti-JNK antibodies recognize the two different JNK isoform (JNK1 and JNK2) and their two spliced variants (JNK1 (46 kDa), JNK1 (54 kDa) and JNK2 (46 kDa) and JNK2 (54 kDa)). Immunocomplexes were detected by enhanced chemiluminescence (Amersham).
Immunofluorescence
Request a detailed protocolFor 3-D imaging, livers were fixed in a solution of paraformaldehyde 4% in PBS at 4°C. After washing in PBS, tissues were stored overnight in 30% sucrose (Sigma) with PBS. Then, livers were embedded in OCT compound (Tissue-Tek) and frozen at −80°C. Cryosections of organs (70 µm) were washed in PBS and blocked/permeabilized in PBS with 10% donkey serum (Millipore) and 1% Triton. Primary antibodies diluted in blocking/permeabilization buffer were incubated overnight at 4°C, followed by three washes in PBS and 2 hr incubation with secondary antibodies and DAPI at room temperature. After three washes in PBS, cells were mounted with Fluoromount-G (SouthernBiotech). The following primary and secondary antibodies were used: rat anti-CD31 (1:200, #553370 BD Pharmingen,), rabbit anti-S100A9 (mrp14) (1:100, #AB242945, Abcam,), goat anti-Clec4f (1:100, #AF2784, RD System), Alexa 488 donkey anti rat IgG (1:200, #A-21208, ThermoFisher), Cy3 AffiniPure Fab Fragment Donkey Anti-Rabbit IgG (1:200, #711-167-003, Jackson Laboratories), Alexa Fluor 633 donkey anti goat IgG (H+L) (1:200, #A21082, ThermoFisher). Immunostaining were imaged with a SP8 confocal microscope using 40x objectives. Individual fields or tiles of large areas were acquired every 2.5 µm for a total of 30 µm in depth. 3D images were obtained with Fiji/ImageJ 3D Viewer plugging.
For 2-D imaging, liver sections (12 µm) prepared from frozen tissue and embedded in OCT compound were fixed with 2% paraformaldehyde and permeabilized with PBS 0.1% Triton. After blocking with PBS 5% BSA 0.1% Triton and washing, tissues were incubated overnight at 4°C with primary antibody. Then, sections were washed and incubated with conjugated secondary antibodies for 1 hr at room temperature and nuclei were stained with Sytox Green (Invitrogen) after washing. The following primary and secondary antibodies were used: rat anti-mouse S100A9 (Mrp-14) antibody (1:200, #AB105472, Abcam), rabbit anti-Neutrophil Elastase antibody (1:200, #AB68672, Abcam), goat Alexa Fluor 405 anti-rabbit (1:200) and goat Alexa Fluor 568 anti-rat IgG (1:500). Sections were mounted in Vectashield mounting medium (Vector, H-1000) and examined using a Leica SP5 multi-line inverted confocal microscope and 20x objectives.
NE measurement
Request a detailed protocol20 mL of PBS prefunded livers were crushed with a syringe plunger, resuspended in 4 mL of PBS/EDTA 5 mM/0.5% FBS and filtered (70 µm). Cell suspension was centrifuged at 1800 rpm 5 min and the supernatant was filtered (22 µm). Supernatants were concentrated using Amicon Ultra centrifugal filters (Sigma-Aldrich). NE levels were determined with Mouse Neutrophil Elastase ELISA kit (R and D system).
Quantification and statistical analysis
Request a detailed protocolAll data are expressed as means ± SEM. For comparisons between two groups, the Student’s t-test was applied. For data with more than two data sets, we used one-way ANOVA coupled with Turkey’s multigroup test. When variances were unequal, Welch’s test or Kruskal-Wallis test coupled with Dunn’s multiple comparison test were applied, respectively. Multiple group comparisons in the rhythmicity of neutrophil infiltration were analyzed with two-way ANOVA followed by Fisher’s post hoc test. Significance was determined as a 2-sided p < 0.05. All statistical analyses were conducted in GraphPad Prism software. Statistical details were indicated in the figure legends.
Appendix 1
Appendix 1—key resources table
| Reagent type (species) or resource | Designation | Source or reference | Identifiers | Additional information |
|---|---|---|---|---|
| Genetic reagent (M. musculus) | C57BL/6J background | Jackson Laboratory | Cat# 000664 RRID:IMSR_JAX:000664 | |
| Genetic reagent (M. musculus) | B6.129-Mcl1tm3Sjk/J | Jackson Laboratory | Cat# 006088 RRID:IMSR_JAX:006088 | |
| Genetic reagent (M. musculus) | B6.Cg-Tg(S100A8-cre,-EGFP)1Ilw/J | Jackson Laboratory | Cat# 021614 RRID:IMSR_JAX:021614 | |
| Genetic reagent (M. musculus) | B6.129P2-Lyz2tm1(cre)Ifo/J | Jackson Laboratory | Cat# 004781 RRID:IMSR_JAX:004781 | |
| Genetic reagent (M. musculus) | B6.129-Mapk12tm1.2 | PMID:26843485 | ||
| Genetic reagent (M. musculus) | B6.129-Mapk13tm1.2 | PMID:26843485 | ||
| Genetic reagent (M. musculus) | B6.129 × 1/SvJ-Elanetm1Sds | Jackson Laboratory | Cat# 006112 RRID:IMSR_JAX:006112 | |
| Genetic reagent (M. musculus) | B6.Cg-Tg(Alb-cre)21Mgn/J | Jackson Laboratory | Cat# 003574 RRID:IMSR_JAX:003574 | |
| Genetic reagent (M. musculus) | B6.129-Mapk8LoxP/LoxP Mapk9tm1Flv/J | PMID:19167327 | ||
| Genetic reagent (M. musculus) | C57BL/6-Cxcr2tm1Rmra/J | Jackson Laboratory | Cat# 024638 RRID:IMSR_JAX:024638 | |
| Cell line (H. sapiens) | HEK-293 | ATCC | Cat# CRL-1573 RRID:CVCL_0045 | |
| Cell line (M. musculus) | Primary hepatocytes | PMID:26843485 | ||
| Transfected construct (synthesized) | pGIZP (pΔ8.9- pVSV-G) | Dharmacon | Cat# RHS4349 | Lentiviral Empty Vector shRNA Control |
| Transfected construct (synthesized) | pGIZP.shFGF21 (pΔ8.9- pVSV-G) | Dharmacon | Cat# V3LMM_430499 | |
| Transfected construct (synthesized) | pGIZP.shFGF21 (pΔ8.9- pVSV-G) | Dharmacon | Cat# V3LMM_430501 | |
| Biological sample (H. sapiens) | Liver human samples | University Hospital of Salamanca-IBSAL | Figure 5—source data 1 | |
| Antibody | Biotinylated monoclonal rat anti-mouse Ly6G (Clone 1A8) | Miltenyi Biotec | Cat# 130-123-854 RRID:AB_1036098 | 1:20 |
| Antibody | Biotinylated monoclonal hamster anti-mouse CD3 (Clone 145–2 C11) | BD Pharmingen | Cat# 553057 RRID:AB_394590 | 1:20 |
| Antibody | Biotinylated monoclonal rat anti-mouse B220 (Clone RA3-6B2) | BD Pharmingen | Cat# 561880 RRID:AB_10897020 | 1:20 |
| Antibody | Monoclonal rat anti-mouse CD45 Pacific Orange (Clone 30-F11) | Invitrogen | Cat# MCD4530 RRID:AB_2539700 | Flow cytometry 1:100 |
| Antibody | Monoclonal rat anti-mouse CD11b FITC (Clone M1/70) | BD Pharmingen | Cat# 557396 RRID:AB_396679 | Flow cytometry 1:100 |
| Antibody | Monoclonal rat anti-mouse Ly6C/G APC (Clone RB6-8C5) | BD Pharmingen | Cat# 553129 RRID:AB_398532 | Flow cytometry 1:200 |
| Antibody | Monoclonal rat anti-mouse F4/80 PE-Cy7 (Clone BM8) | eBioscience | Cat# 25480182 RRID:AB_469653 | Flow cytometry 1:100 |
| Antibody | Monoclonal rat anti-Mouse Ly-6G PE (Clone 1A8) | BD Bioscience | Cat# 551461 RRID:AB_394208 | Flow cytometry 1:200 |
| Antibody | Polyclonal Chicken Anti Goat IgG (H+L) Alexa Fluor 647 | Invitrogen | Cat# A-21469 RRID:AB_2535872 | Flow cytometry 1:500 |
| Antibody | Polyclonal rabbit anti-mouse FGF21 | BioVendor | Cat# RD281108100 RRID:AB_2034054 | WB 1:1000 |
| Antibody | Monolconal rabbit anti-phospho SAPK/JNK (T183/Y185) (Clone 81E11) | Cell Signaling | Cat# 4668S RRID:AB_823588 | WB 1:1000 |
| Antibody | Polyclonal rabbit anti-SAPK/JNK | Cell Signaling | Cat# 9252S RRID:AB_2250373 | WB 1:1000 |
| Antibody | Polyclonal rabbit anti-phospho c-jun | Cell Signaling | Cat# 9164L RRID:AB_330892 | WB 1:1000 |
| Antibody | Monoclonal rabbit anti-c-jun (Clone 60A8) | Cell Signaling | Cat# 9165S RRID:AB_2130165 | WB 1:1000 |
| Antibody | Monoclonal rabbit anti-Acetyl-CoA carboxylase (Clone C83B10) | Cell Signaling | Cat# 3676S RRID:AB_2219397 | WB 1:1000 |
| Antibody | Monoclonal mouse anti-vinculin (Clone hVIN-1) | Sigma | Cat# V9131 RRID:AB_477629 | WB 1:5000 |
| Antibody | Polyclonal goat anti-Mouse IgG (H+L) Secondary Antibody, HRP | ThermoFisher | Cat# 31430 RRID:AB_228307 | WB 1:5000 |
| Antibody | Polyclonal goat anti-Rabbit IgG (H+L) Secondary Antibody, HRP | ThermoFisher | Cat# 31460 RRID:AB_228341 | WB 1:5000 |
| Antibody | Monoclonal rat anti-mouse CD31 (Clone MEC 13.3) | BD Pharmingen | Cat# 553370 RRID:AB_394816 | IF 1:200 |
| Antibody | Monoclonal rabbit anti-mouse S100A9 (mrp14) (Clone EPR22332-75) | Abcam | Cat# AB242945 RRID:AB_2876886 | IF 1:100 |
| Antibody | Polyclonal goat anti-mouse Clec4f | RD System | Cat# AF2784 RRID:AB_2081339 | IF/Flow cytometry 1:200 |
| Antibody | Polyclonal donkey anti rat IgG Alexa 488 | ThermoFisher | Cat# A-21208 RRID:AB_2535794 | IF 1:200 |
| Antibody | Polyclonal Donkey Anti-Rabbit IgG Cy3 AffiniPure Fab Fragment | Jackson Laboratories | Cat# 711-167-003 RRID:AB_2340606 | IF 1:200 |
| Antibody | Polyclonal Donkey Anti Goat IgG (H+L) Alexa Fluor 633 | ThermoFisher | Cat# A21082 RRID:AB_10562400 | IF 1:200 |
| Antibody | Monoclonal rat anti-mouse S100A9 (Mrp-14) (Clone 2B10) | Abcam | Cat# AB105472 RRID:AB_10862594 | IF 1:200 |
| Antibody | Polyclonal rabbit anti-neutrophil elastase | Abcam | Cat# AB68672 RRID:AB_1658868 | IF 1:200 |
| Antibody | Polyclonal goat Anti-Rabbit Alexa Fluor 405 | ThermoFisher | Cat# A-31556 RRID:AB_221605 | IF 1:200 |
| Antibody | Polyclonal goat Anti-Rat IgG Alexa Fluor 568 | ThermoFisher | Cat# A-11077 RRID:AB_2534121 | IF 1:500 |
| Sequence-based reagent | RT-qPCR primers | Sigma-Aldrich | ||
| Peptide, recombinant protein | Recombinant Mouse Neutrophil Elastase/EL | R and D Systems | Cat# 4517-SE-010 | |
| Peptide, recombinant protein | Collagenase A | Roche | Cat# 10 103 586 001 | |
| Peptide, recombinant protein | Collagenase Type 1 CLS1 | Worthington Biochemical | Cat# LS004197 | |
| Peptide, recombinant protein | Liberase TL | Sigma | Cat# 5401020001 | |
| Peptide, recombinant protein | DNase Type II-S | Sigma-Aldrich | Cat# D4513 | |
| Commercial assay or kit | Serum Triglyceride Determination Kit | Sigma-Aldrich | Cat# TR0100-1KT | |
| Commercial assay or kit | Mouse Neutrophil Elastase/ELA2 DuoSet ELISA | R and D systems | Cat# DY4517-05 | |
| Commercial assay or kit | RNa easy Mini Kit | Qiagen | Cat# 74106 | |
| Commercial assay or kit | High-Capacity cDNA Reverse Transcription Kit | Applied Biosystems | Cat# 4368814 | |
| Chemical compound, drug | Fast SYBR Green Master Mix | Applied Biosystems | Cat# 4385616 | |
| Chemical compound, drug | Percoll | GE Healthcare | Cat# 17-0891-01 | |
| Chemical compound, drug | Palmitic acid | Sigma-Aldrich | Cat# P0500 | |
| Chemical compound, drug | N-Formil Met-Leu-Phe (FMLP) | Sigma-Aldrich | Cat# F3506 | |
| Chemical compound, drug | SP600125 (SAPK inhibitor) | Santa Cruz Biotechnology | Cat# sc-200635 | |
| Chemical compound, drug | Amersham ECL Prime Western Blotting Detection Reagent | GE Healthcare | Cat# RPN2232 | |
| Chemical compound, drug | Fluoromount-G | SouthernBiotech | Cat# 0100–01 | |
| Chemical compound, drug | Sucrose | Sigma-Aldrich | Cat# S8501 | |
| Chemical compound, drug | SYTOX Green Nucleic Acid Stain - 5 mM | ThermoFisher | Cat# S7020 | |
| Chemical compound, drug | VECTASHIELD Antifade Mounting Medium | Vector Lab | Cat# H-1000 | |
| Software, algorithm | GraphPad PRISM | GraphPad Software | RRID:SCR_002798 | |
| Software, algorithm | Photoshop CS6 | Adobe | RRID:SCR_014199 | |
| Software, algorithm | Fiji/Image J software | Fiji-Image J | https://imagej.nih.gov/ij/ RRID:SCR_003070 | |
| Software, algorithm | FlowJo | FlowJo | https://www.flowjo.com/ RRID:SCR_008520 | |
| Software, algorithm | Leica LAS X | Leica Software | RRID:SCR_013673 | |
| Other | Hematoxylin | Sigma | Cat# H3136 | |
| Other | Eosin Y Alcoholic | Thermo Scientific | Cat# 6766008 | |
| Other | OCT | Tissue-Tek | Cat# 4583 | |
| Other | Oil Red O (C.I.26125) | American Master Tech Scientific | Cat# SPO1077 | |
| Other | 70 μM cell strainers | Corning Falcon | Cat# 352350 | |
| Other | 22 μM filter | Sigma-Aldrich | Cat# SLGPM33RS | |
| Other | Amicon Ultra centrifugal filters | Sigma-Aldrich | Cat# UFC800324 | |
| Other | Magnetic streptavidin microbeads | Miltenyi Biotec | Cat# 130-048-101 | |
| Other | MACS Separation Columns- MS columns | Miltenyi Biotec | Cat# 130-042-201 | |
| Other | Mini-osmotic pumps | Alzet | Cat# 1004 | |
| Other | Methionine-choline-deficient diet (MCD) | Research Diets Inc | Cat# A02082002B | |
| Other | High-fat diet (HFD) | Research Diets Inc | Cat# D11103002i |
Data availability
All data generated or analysed during this study are included in the manuscript and supporting files.
References
-
Neutrophils instruct homeostatic and pathological states in naive tissuesThe Journal of Experimental Medicine 215:2778–2795.https://doi.org/10.1084/jem.20181468
-
The role of JNK in the development of hepatocellular carcinomaGenes & Development 25:634–645.https://doi.org/10.1101/gad.1989311
-
Immunology. Some monocytes got rhythmScience 341:1462–1464.https://doi.org/10.1126/science.1244445
-
CXCR2 and CXCR4 antagonistically regulate neutrophil trafficking from murine bone marrowThe Journal of Clinical Investigation 120:2423–2431.https://doi.org/10.1172/JCI41649
-
Eukaryotic elongation factor 2 controls TNF-α translation in LPS-induced hepatitisJournal of Clinical Investigation 123:164–178.https://doi.org/10.1172/JCI65124
-
Biologic rhythms in the immune systemChronobiology International 16:581–622.https://doi.org/10.3109/07420529908998730
-
Circadian rhythms, sleep, and metabolismJournal of Clinical Investigation 121:2133–2141.https://doi.org/10.1172/JCI46043
-
Jet lag and shift work sleep disorders: how to help reset the internal clockCleveland Clinic Journal of Medicine 78:675–684.https://doi.org/10.3949/ccjm.78a.10083
-
Clock mutation facilitates accumulation of cholesterol in the liver of mice fed a cholesterol and/or cholic acid dietAmerican Journal of Physiology-Endocrinology and Metabolism 294:E120–E130.https://doi.org/10.1152/ajpendo.00061.2007
-
Stress kinases in the modulation of metabolism and energy balanceJournal of Molecular Endocrinology 55:R11–R22.https://doi.org/10.1530/JME-15-0146
-
Cxcr2 and Cxcl5 regulate the IL-17/G-CSF axis and neutrophil homeostasis in miceThe Journal of Clinical Investigation 122:974–986.https://doi.org/10.1172/JCI60588
-
Neutrophils and immunity: challenges and opportunitiesNature Reviews Immunology 6:173–182.https://doi.org/10.1038/nri1785
-
Circadian organization of thirteen liver and six brain enzymes of the mouseAmerican Journal of Anatomy 162:183–199.https://doi.org/10.1002/aja.1001620302
-
Endocrine fibroblast growth factors 15/19 and 21: from feast to famineGenes & Development 26:312–324.https://doi.org/10.1101/gad.184788.111
-
Circadian rhythms of liver physiology and disease: experimental and clinical evidenceNature Reviews Gastroenterology & Hepatology 13:217–226.https://doi.org/10.1038/nrgastro.2016.8
-
Nonalcoholic fatty liver disease: pathology and pathogenesisAnnual Review of Pathology: Mechanisms of Disease 5:145–171.https://doi.org/10.1146/annurev-pathol-121808-102132
-
Circadian rhythms in liver physiology and liver diseasesComprehensive Physiology 3:917–940.https://doi.org/10.1002/cphy.c120017
-
Myeloid Cell-specific Disruption of Period1 and Period2 Exacerbates Diet-induced Inflammation and Insulin ResistanceJournal of Biological Chemistry 289:16374–16388.https://doi.org/10.1074/jbc.M113.539601
-
Liver clock protein BMAL1 promotes de novo lipogenesis through insulin-mTORC2-AKT signalingJournal of Biological Chemistry 289:25925–25935.https://doi.org/10.1074/jbc.M114.567628
Article and author information
Author details
Barbara Gonzalez-Teran

Funding
European Commission (ERC260464)
- Guadalupe Sabio
Ministerio de Economía y Competitividad (SAF2016-79126-R)
- Guadalupe Sabio
Ministerio de Economía y Competitividad (SAF2015-74112-JIN)
- Magdalena Leiva
Fundación Científica Asociación Española Contra el Cáncer (INVES20026LEIV PROYE19047SABI)
- Magdalena Leiva
- Guadalupe Sabio
Ministerio de Ciencia e Innovación (PID2019-104399RB-I00)
- Guadalupe Sabio
FPI Severo Ochoa- CNIC (SVP‐2013‐067639)
- Barbara Gonzalez-Teran
Ministerio de Economía y Competitividad (BES-2017-079711)
- María Crespo
Juan de la Cierva (JCI-2011-11623)
- Antonia Tomás-Loba
Sara Borrell (CD19/00078)
- Cintia Folgueira
National Institutes of Health (DK R01 DK107220)
- Roger J Davis
Ministerio de Economía y Competitividad (SAF2014-61233-JIN)
- Antonia Tomás-Loba
Fundación BBVA (IN[17]_BBM_BAS_0066)
- Guadalupe Sabio
Ministerio de Economía y Competitividad (EUIN2017-85875)
- Guadalupe Sabio
Comunidad de Madrid (S2010/BMD-2326)
- Guadalupe Sabio
Comunidad de Madrid (B2017/BMD-3733)
- Guadalupe Sabio
Instituto de Salud Carlos III (PI16/01548)
- Miguel Marcos
Junta de Castilla y León (GRS1362/A/16)
- Miguel Marcos
Junta de Castilla y León (INT/M/17/17)
- Miguel Marcos
Junta de Castilla y León (GRS 1356/A/16)
- Jorge L Torres
Junta de Castilla y León (GRS 1587/A/17)
- Jorge L Torres
European Foundation for the Study of Diabetes (ESFD/Lilly Programme)
- Guadalupe Sabio
European Foundation for the Study of Diabetes (EFSD/Lilly Grant 2017 and 2019)
- Ivana Nikolic
CNIC IPP FP7 Marie Curie Programme (PCOFUND-2012-600396)
- Ivana Nikolic
European Foundation for the Study of Diabetes (EFSD Rising Star award 2019)
- Ivana Nikolic
Juan de la Cierva (JDC-2018-Incorporación MIN/JDC1802)
- Ivana Nikolic
The funders had no role in study design, data collection and interpretation, or the decision to submit the work for publication.
Acknowledgements
We thank S Bartlett for English editing. We are grateful to A Zychlinsky for the NE-/- mice. We thank the staff at the CNIC Genomics, Cellomics, Microscopy, and Bioinformatics units for technical support and help with data analysis. BGT and MC were fellows of the FPI: Severo Ochoa CNIC program (SVP-2013–067639) and (BES-2017–079711) respectively. IN was funded by EFSD/Lilly grants (2017 and 2019), the CNIC IPP FP7 Marie Curie Programme (PCOFUND-2012–600396), EFSD Rising Star award (2019), JDC-2018-Incorporación (MIN/JDC1802). T-L was a Juan de la Cierva fellow (JCI-2011–11623). C.F has a Sara Borrell contract (CD19/00078). RJD is an Investigator of the Howard Hughes Medical Institute. This work was funded by the following grants to GS: funding from the European Union's Seventh Framework Programme (FP7/2007-2013) under grant agreement n° ERC 260464, EFSD/Lilly European Diabetes Research Programme Dr Sabio, 2017 Leonardo Grant for Researchers and Cultural Creators, BBVA Foundation (Investigadores-BBVA-2017) IN[17]_BBM_BAS_0066, MINECO-FEDER SAF2016-79126-R and PID2019-104399RB-I00 , EUIN2017-85875, Comunidad de Madrid IMMUNOTHERCAN-CM S2010/BMD-2326 and B2017/BMD-3733 and Fundación AECC AECC PROYE19047SABI and AECC: INVES20026LEIV to ML. MM was funded by ISCIII and FEDER PI16/01548 and Junta de Castilla y León GRS 1362/A/16 and INT/M/17/17 and JL-T by Junta de Castilla y León GRS 1356/A/16 and GRS 1587/A/17. The study was additionally funded by MEIC grants to ML (MINECO-FEDER-SAF2015-74112-JIN) AT-L (MINECO-FEDER-SAF2014-61233-JIN), RJD: Grant DK R01 DK107220 from the National Institutes of Health. AH: (SAF2015-65607-R). The CNIC is supported by the Instituto de Salud Carlos III (ISCIII), the Ministerio de Ciencia, Innovación y Universidades (MCNU) and the Pro CNIC Foundation, and is a Severo Ochoa Center of Excellence (SEV-2015–0505).
Ethics
Human subjects: The study was approved by the Ethics Committee of the University Hospital of Salamanca (Spain), and all subjects provided written informed consent to participate.
Animal experimentation: All animal procedures conformed to EU Directive 86/609/EEC and Recommendation 2007/526/EC regarding the protection of animals used for experimental and other scientific purposes, enacted under Spanish law 1201/2005.
Copyright
© 2020, Crespo et al.
This article is distributed under the terms of the Creative Commons Attribution License, which permits unrestricted use and redistribution provided that the original author and source are credited.
Metrics
-
- 4,097
- views
-
- 547
- downloads
-
- 52
- citations
Views, downloads and citations are aggregated across all versions of this paper published by eLife.
Citations by DOI
-
- 52
- citations for umbrella DOI https://doi.org/10.7554/eLife.59258
Download links
A two-part list of links to download the article, or parts of the article, in various formats.
Downloads (link to download the article as PDF)
Open citations (links to open the citations from this article in various online reference manager services)
Cite this article (links to download the citations from this article in formats compatible with various reference manager tools)
Neutrophil infiltration regulates clock-gene expression to organize daily hepatic metabolism
eLife 9:e59258.
https://doi.org/10.7554/eLife.59258


