AAV ablates neurogenesis in the adult murine hippocampus
- Neurosciences Graduate Program, University of California, San Diego, United States
- Laboratory of Genetics, Salk Institute for Biological Studies, United States
- Department of Neurosciences, University of California, San Diego, United States
- Department of Biology, University of California, San Diego, United States
- Department of Physics, University of California, San Diego, United States
- Laboratory of Experimental Epileptology, Department of Physiology, Second Faculty of Medicine, Charles University, United Kingdom
- Ruth L. and David S. Gottesman Institute for Stem Cell Biology and Regenerative Medicine, Albert Einstein College of Medicine, United States
- Dominick P. Purpura Department of Neuroscience, Albert Einstein College of Medicine, United States
Figures
Figure 1 with 1 supplement
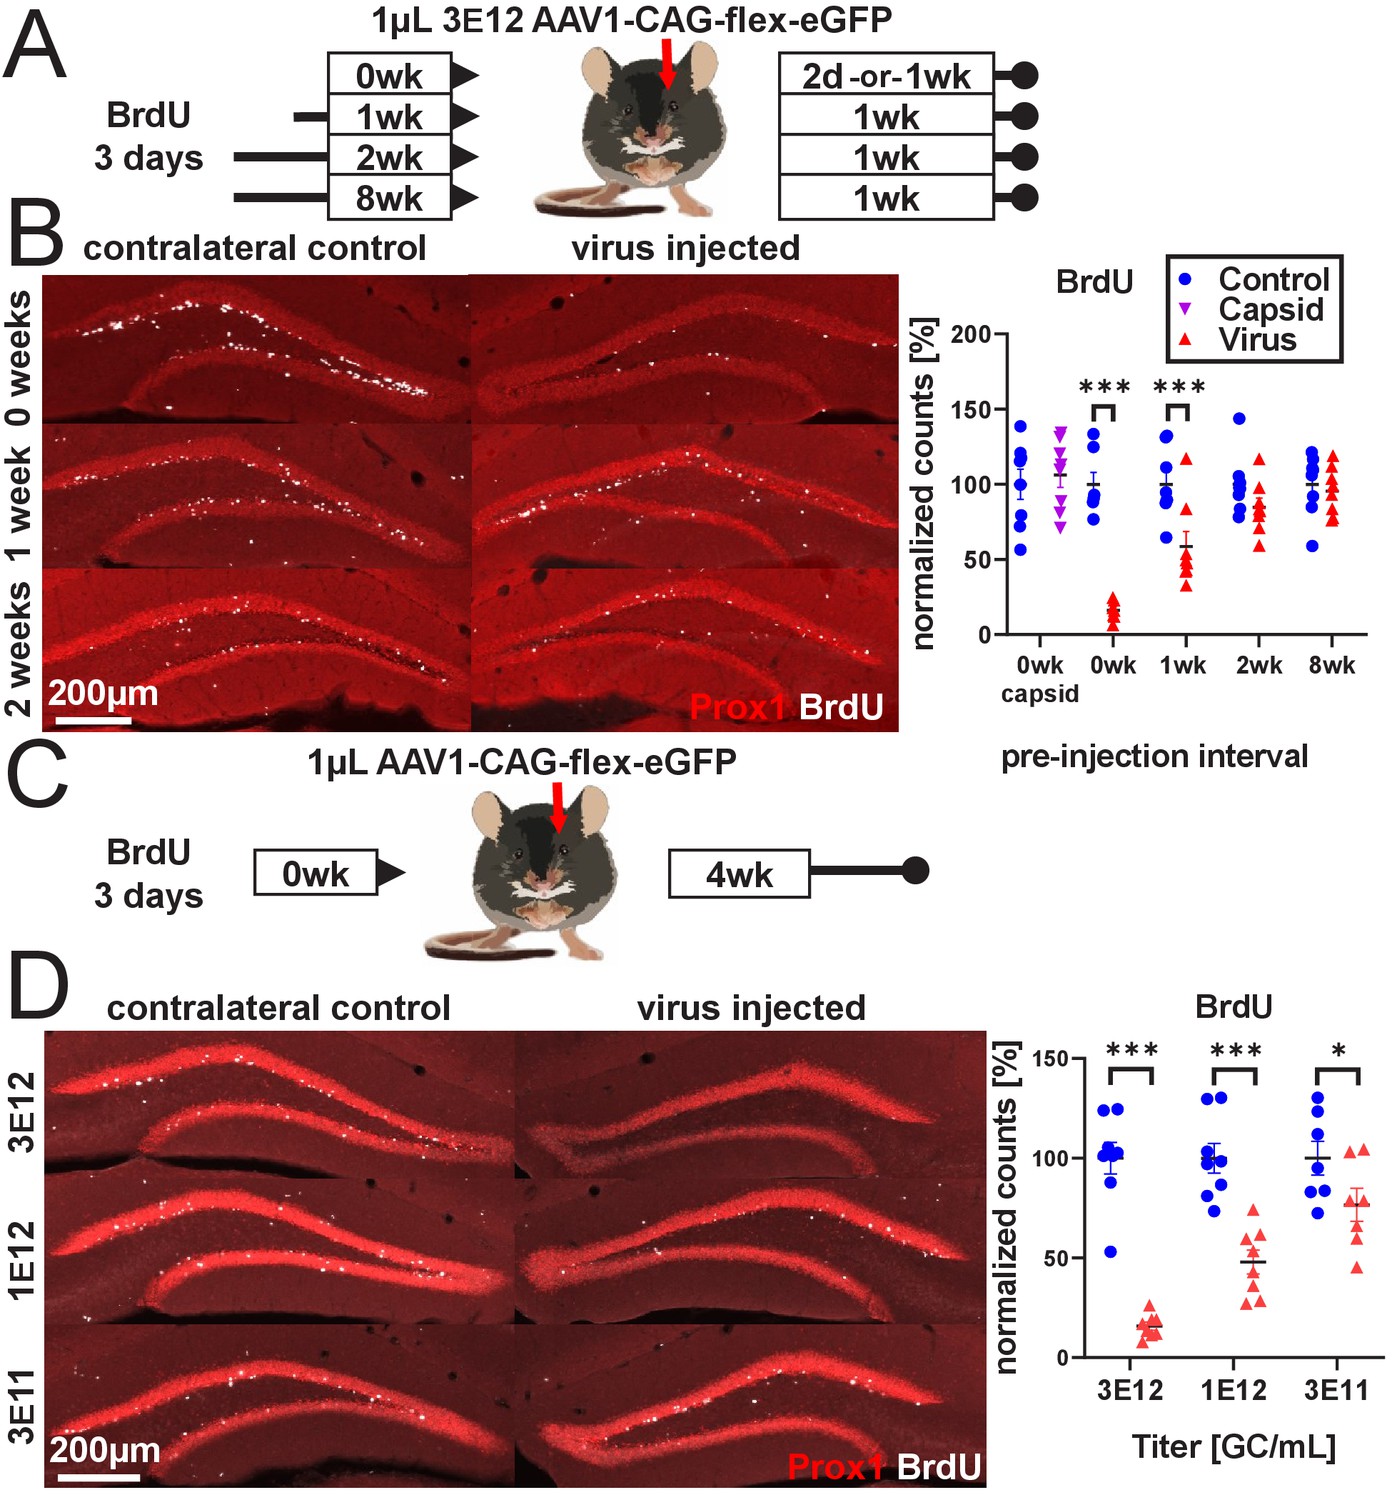
rAAV eliminates abDGCs in a dose-dependent manner.
(A) Experimental design of rAAV injection into DG following indelible labeling of adult-born DGCs with BrdU. (B, left) Representative images showing Prox1 and BrdU used for quantification. (B, right) abDGCs birth-dated with BrdU for 3 days immediately preceding viral injection show near-complete elimination following rAAV injection; cells born 1 week before viral injection are reduced by ~50%. Cells born 2 weeks prior or more, or injection of empty AAV viral capsid, demonstrate no reduction. (C) Experimental design of dose-dependent attenuation of abDGCs by rAAV. (D, left) Representative images showing Prox1 and BrdU used for quantification. (D, right) A near complete ablation of BrdU+ cells is seen in the DG injected with 1 µL 3 E12 GC/mL rAAV, partial ablation of BrdU+ cells results from the injection of 1 µL 1 e12 GC/mL rAAV, and a small but significant reduction of adult neurogenesis results from injection of 1 µL 3 e11 GC/mL rAAV. All data are presented as mean ± s.e.m, significance reported as: *p<0.05, ***p<0.001.
-
Figure 1—source data 1
Source data for Figure 1.
Spreadsheets containing source data for graphs displayed in Figure 1.
- https://cdn.elifesciences.org/articles/59291/elife-59291-fig1-data1-v2.zip
Figure 1—figure supplement 1
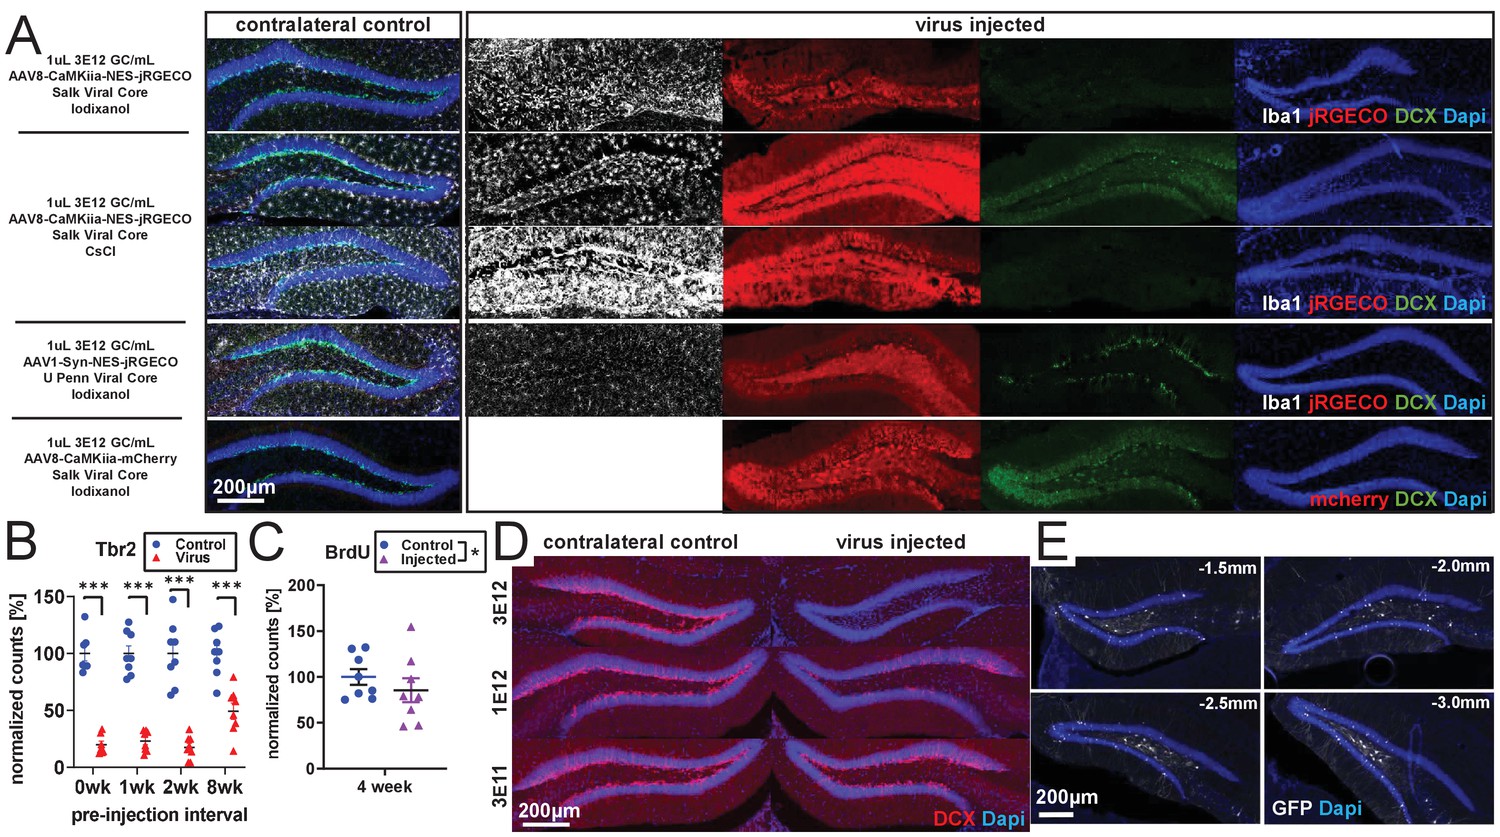
rAAV-dependent toxicity.
(A) The amount of reduction in DCX expression induced by rAAV is variable at 2 weeks post-injection but is present despite differences in viral core (Salk, Upenn), purification method (CsCl, Iodixanol), serotype (AAV1 and AAV8), promoter (CAG, CaMKiia, Syn), and protein expressed (jRGECO1a, mCherry, flex-GFP). Two examples with the same titer and volume of AAV8-CaMKiia-NES-jRGECO1a (Salk Viral Core – CsCl purification) in different animals are shown demonstrating variability in magnitude but consistency in direction of Iba1+ microglia activation and loss of the immature neuronal marker DCX staining across animals. (B) In the same tissue as Figure 1A,B, Tbr2+ intermediate progenitors are lost even when older BrdU+ cells are spared (n = 7, 8, 8, eight mice per time point). (C) Consistent with first column of Figure 1B, BrdU+ cells are largely intact 4 weeks after empty capsid injection (n = eight mice). (D) Consistent with Figure 1C,D, injected titers of 3 E12 result in nearly complete ablation of DCX expression, 1 E12 results in partial abolition of DCX expression, and 3 E11 results in a small loss of DCX expression at 4 weeks post-viral injection. (E) Representative spread of rAAV (AAV1-CAG-flex-eGFP) after 1 µl injection into dorsal DG. Virus (GFP) was consistently detected throughout dorsal DG, with some spread to intermediate DG. Coordinates list A/P position relative to bregma.
-
Figure 1—figure supplement 1—source data 1
Source data for Figure 1—figure supplement 1.
Spreadsheets containing source data for graphs displayed in Figure 1—figure supplement 1.
- https://cdn.elifesciences.org/articles/59291/elife-59291-fig1-figsupp1-data1-v2.zip
Figure 2 with 2 supplements
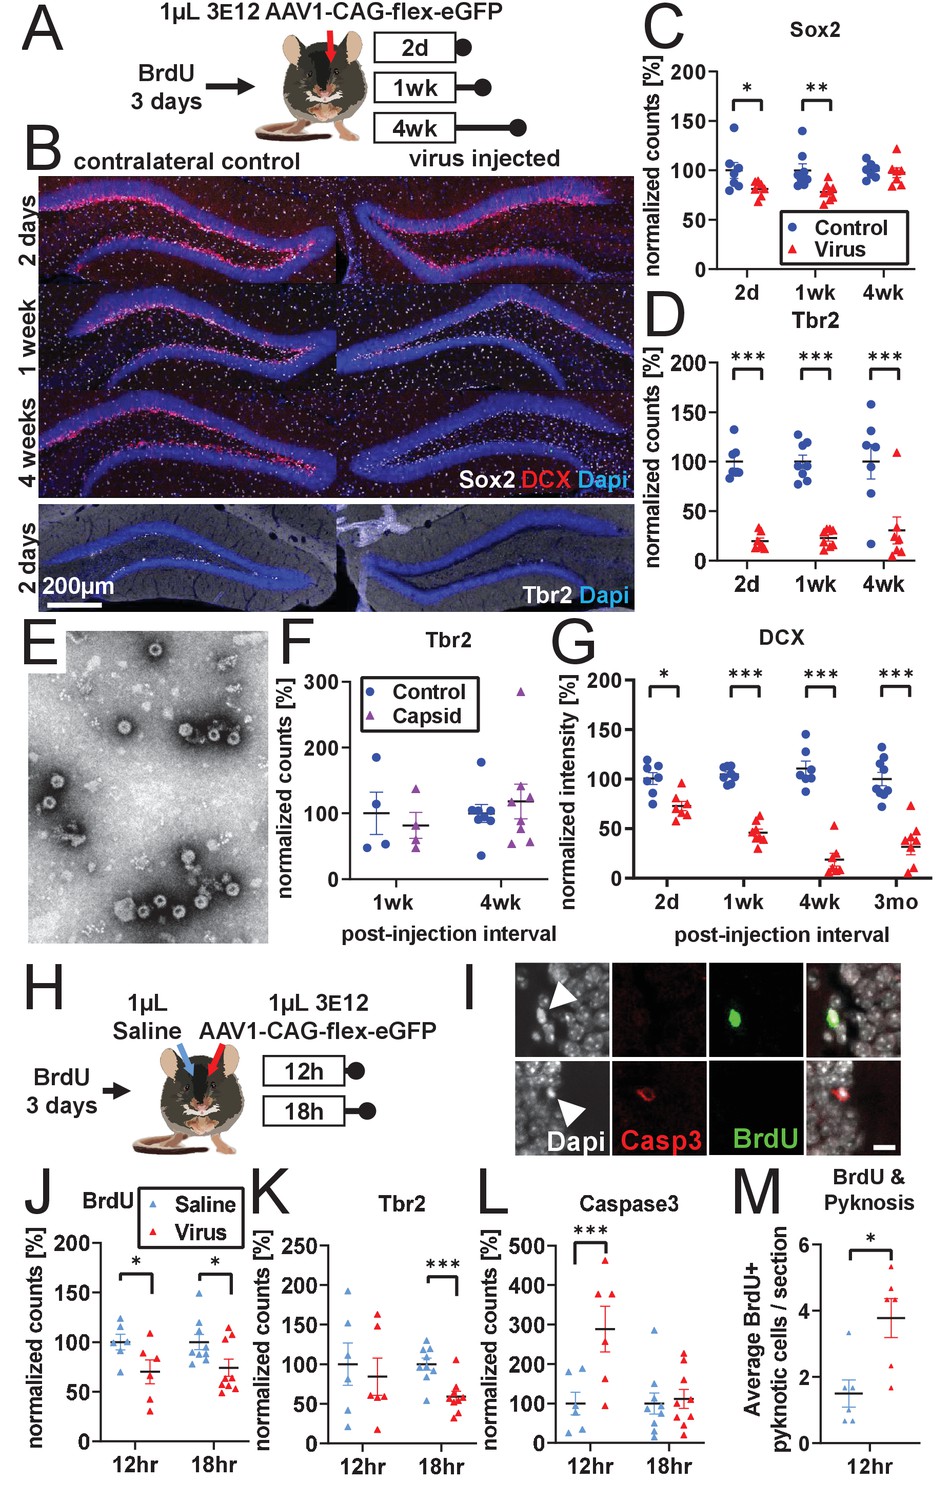
Developmental stage determines susceptibility to rAAV-induced cell loss.
(A) Experimental design to assess the effect of rAAV post-injection interval on the survival of different NPC types. Following labeling with BrdU, mice are injected unilaterally with 1 µL of 3 e12 GC/mL rAAV and sacrificed at 2 days, 1 week, and 4 weeks. (B) Representative histological staining of progenitor and immature neuronal markers Sox2 (white, upper panels), DCX (red, upper panels), and Tbr2 (white, lower panels) following rAAV injection. (C) Sox2+ neural stem cell numbers within the SGZ are reduced by ~20% 2 days and 1 week following rAAV injection but not at 4 weeks post-injection (n = 7, 8, 7 mice per group for each time point in C–D). (D) The majority of intermediate progenitor Tbr2+ cells are lost within 2 days of rAAV injection and do not recover by 4 weeks post-injection. (E) Representative image of empty AAV viral particles (‘empty capsid’) from cryo-electron microscopy used to quantify the number of viral particles. (F) Tbr2+ intermediate progenitors are preserved following injection of empty viral capsid (n = 4 mice per group at 1 week, n = 8 mice at 4 weeks). (G) Immature neuronal marker DCX intensity shows progressive decline until complete loss at 4 weeks post-injection. DCX intensity shows no recovery at 3 months post-injection (n = 7, 8, 7, 9 mice per group for each time point). (H) Experimental design for acute time-line of rAAV-induced cell loss. Following labeling with BrdU, 1 µL 3 e12 GC/mL rAAV and saline control are injected into opposite sides of the DG; mice are sacrificed at 12 and 18 hr. (I) DNA condensation and nuclear fragmentation (pyknosis and karyorrhexsis, white arrowheads) are assessed with BrdU (green), Caspase-3 activation (red), and DAPI. (J) BrdU+ cells show variable decline 12 hr after rAAV injection and significant decline at 18 hr relative to saline control (n = 6 mice per group at 12 hr, n = 9 mice at 18 hr for J–M). (K) Tbr2+ intermediate progenitors show significant decline by 18 hr following rAAV injection. (L) Caspase-3+ apoptotic cells were increased relative to saline-injected controls at 12 hr. (M) BrdU+ cells exhibit a significant increase in pyknosis 12 hr after rAAV injection. All data are presented as mean ± s.e.m, significance reported as: *p<0.05, **p<0.01, ***p<0.001.
-
Figure 2—source data 1
Source data for Figure 2.
Spreadsheets containing source data for graphs displayed in Figure 2.
- https://cdn.elifesciences.org/articles/59291/elife-59291-fig2-data1-v2.zip
Figure 2—figure supplement 1
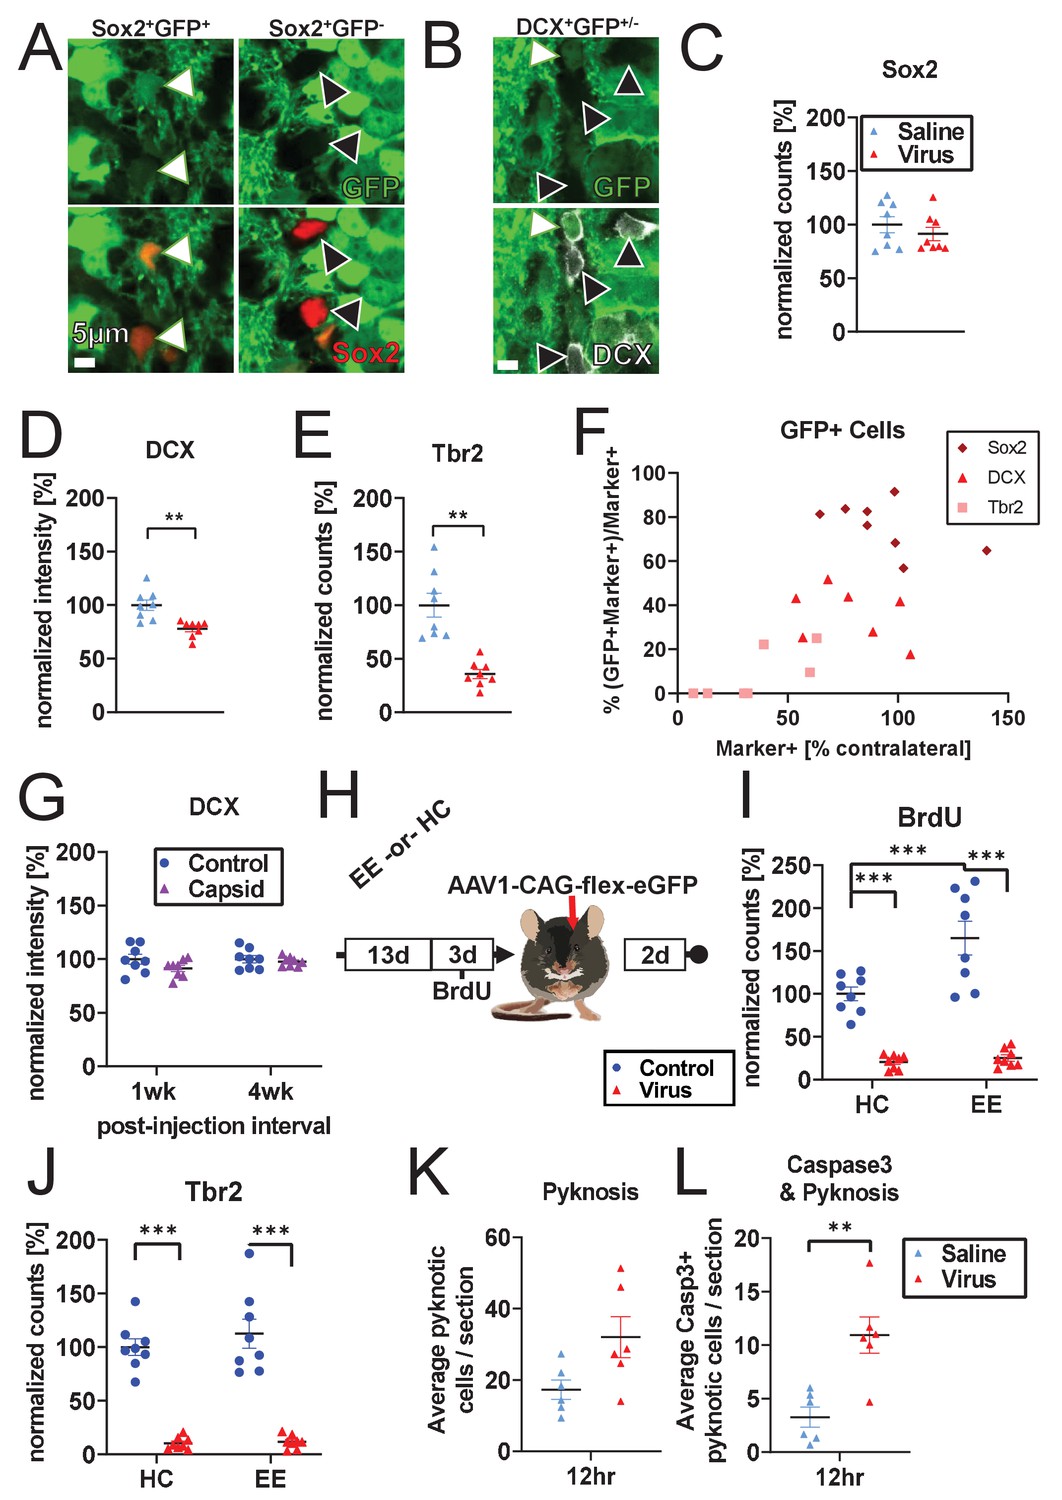
Cell-type-specific cell loss.
(A–F) Co-localization of GFP and neurogenesis markers 1 week after ipsilateral injection of AAV1-CAG-GFP into the DG without BrdU. Animals also received contralateral saline injection. (A, B) Representative histologic staining for Sox2/DCX marker and GFP co-localization (white arrows: marker+GFP+ cells, black arrows: marker+GFP- cells). (C–E) Cell-type specific loss of Tbr2+ and DCX+ cells is recapitulated even when saline is injected contralaterally and BrdU is not administered. (F) Across populations, co-localization of neurogenesis markers and GFP increase with increasing fraction of surviving cells (% marker+ cells compared to contralateral side in same animal). Sox2+ population is largely spared relative to contralateral control, despite substantial GFP co-localization. DCX+ cells show intermediate loss and intermediate GFP co-localization. Tbr2+ cells are significantly decreased and show little GFP co-localization. (G) Consistent with Figures 1B and 2F, and Figure 1—figure supplment 1C, immature neuronal marker DCX is preserved at 1 and 4 weeks post-injection with empty capsid (n = eight mice per time point). (H) Schematic of environmental enrichment experiment. (I) Environmental enrichment increases adult neurogenesis and BrdU labeling but does not protect against rAAV-induced loss of BrdU+ or (J) Tbr2+ cells (n = 8 mice per group). (K) Pyknotic cells in the granule cell layer and SGZ show a non-significant increase in DG injected with rAAV 12 hr post-injection relative to saline control (n = six mice per group; pyknotic category includes both pyknotic and karyorrhexic cells throughout manuscript). (L) Caspase3+ pyknotic cells in the granule cell layer and SGZ are significantly increased 12 hr post-rAAV injection relative to saline controls. All data are presented as mean ± s.e.m, normalized by mean of contralateral controls (except x-axis of F, which is normalized to intra-animal contralateral control), significance reported as: *p<0.05, **p<0.01, ***p<0.001.
-
Figure 2—figure supplement 1—source data 1
Source data for Figure 2—figure supplement 1.
Spreadsheets containing source data for graphs displayed in Figure 2—figure supplement 1.
- https://cdn.elifesciences.org/articles/59291/elife-59291-fig2-figsupp1-data1-v2.zip
Figure 2—figure supplement 2
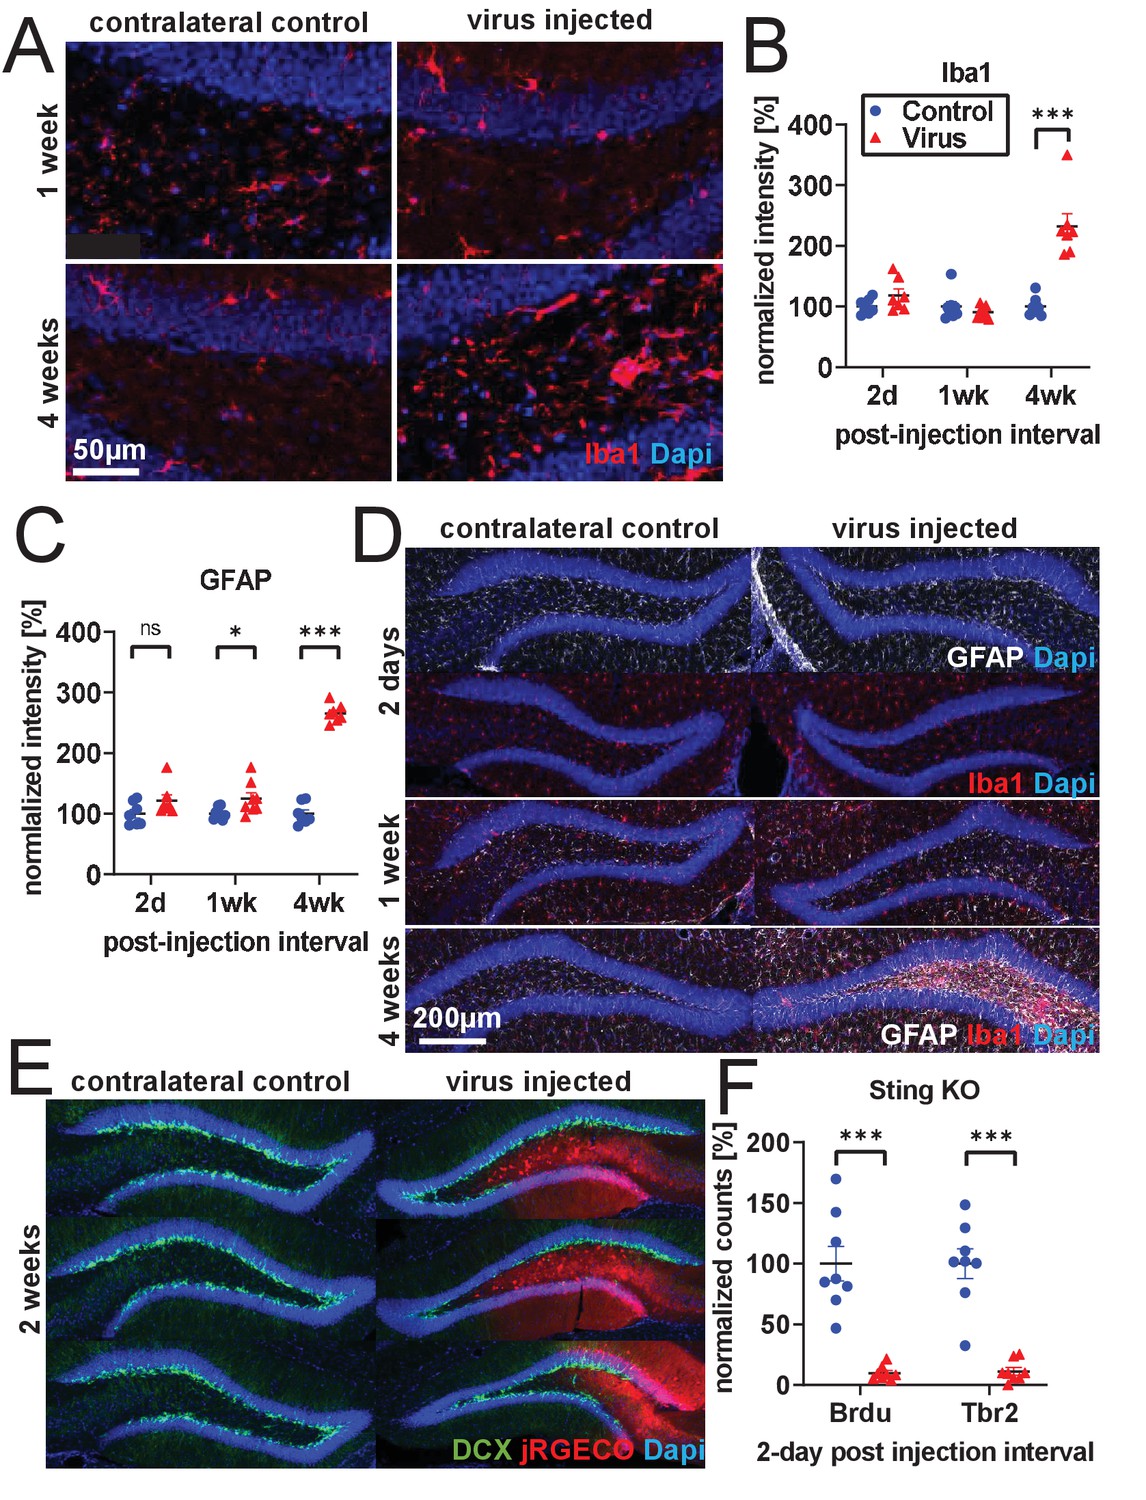
Inflammation and cell loss.
(A) Representative images of increased microglia activation 4 weeks after rAAV injection. (B) Extending experiments from Figure 2A–E, Iba1 intensity is not significantly changed in subgranular zone (SGZ) and hilus 2 days following rAAV injection and is greatly increased 4 weeks following injection (n = 7, 8, seven mice per time point in B, C). (C) GFAP intensity is slightly increased in SGZ and hilus 1 week following rAAV injection and is greatly increased 4 weeks following injection. (D) Representative images of Iba1 and GFAP histology; increases in Iba1 and GFAP activation are not commensurate with time course of rAAV- induced toxicity. No obvious change in microglial morphology was observed at 2 days or 1 week relative to contralateral control; at 4 weeks, microglia exhibit activated amoeboid morphology. (E) Following 30 nL injections of 5E12 GC/mL AAV1-Syn-NES-jRGECO1a into DG, loss of DCX labeling is incomplete and follows boundaries of viral spread. (F) Injection of 1 μL 3E12 GC/mL AAV1-CAG-flexGFP into Sting-KO mice results in BrdU+ and Tbr2+ cell loss (n = eight mice). All data are presented as mean ± s.e.m, significance reported as: *p<0.05, **p<0.01, ***p<0.001.
-
Figure 2—figure supplement 2—source data 1
Source data for Figure 2—figure supplement 2.
Spreadsheets containing source data for graphs displayed in Figure 2—figure supplement 2.
- https://cdn.elifesciences.org/articles/59291/elife-59291-fig2-figsupp2-data1-v2.zip
Figure 3 with 1 supplement

rAAV induces toxicity in NPCs in vitro.
(A) Dose-dependent inhibition of NPC proliferation by rAAV; initial multiplicity of infectivity (MOI) of 1 e7 viral particles/cell arrests mNPC proliferation by 24 hr. MOI of 1 E6 results in slower proliferation relative to PBS control, MOI of 1 e5 and lower are indistinguishable from PBS control (n = 8 per group). (B) Dose-dependent rAAV-induced death; MOI of 1 e7 and 1 e6 result in increased proportion of propidium iodide+ NPCs (n = 8 per group). (C) Representative images showing confluence (brightfield) and propidium iodide penetration (red) into NPCs 12 and 48 hr post-viral transduction for MOI of 107, 106, and for PBS control. (D) Experimental design for 145 bp ssDNA AAV ITR electroporation. Mouse NPCs are electroporated with 5 e6 or 1 e6 copies of 145 bp ssDNA AAV ITR or scrambled ITR sequence control per cell and plated for FLOW analysis time course or treated with propidium iodide for imaging time course on Incucyte S3. Statistical significance shown as post hoc Tukey’s multiple comparison test relative to PBS (also see Supplementary file 1). (E) Electroporation of 5 e6 ITR is sufficient to result in cell loss within hours of electroporation and arrest of proliferation by 40 hr. 5 e6 scrambled ITR shows slight decrease in confluence relative to 1 e6 scrambled ITR; doses of 1 e6 ITR and PBS control are indistinguishable from 1 e6 scrambled ITR (n = 3 per group). (F) Electroporation of ITRs is sufficient to induce greater levels of cell death at higher concentration of 5e6 copies/cell. (G) FLOW analysis demonstrates dose-dependent effect of rAAV ITR on replicating NPCs whereby cells electroporated with 5 e6 ITR in S- and G2- phase are dying and permeable to UVZombie at 12 hr post-electroporation. (H) NPCs in G1 represent the vast majority of cells and are not substantially dying or permeable to UVZombie, regardless of treatment. All data are presented as mean ± s.e.m, significance reported as: *p<0.05, **p<0.01, ***p<0.001.
-
Figure 3—source data 1
Source data for Figure 3.
Spreadsheets containing source data for graphs displayed in Figure 3.
- https://cdn.elifesciences.org/articles/59291/elife-59291-fig3-data1-v2.zip
Figure 3—figure supplement 1
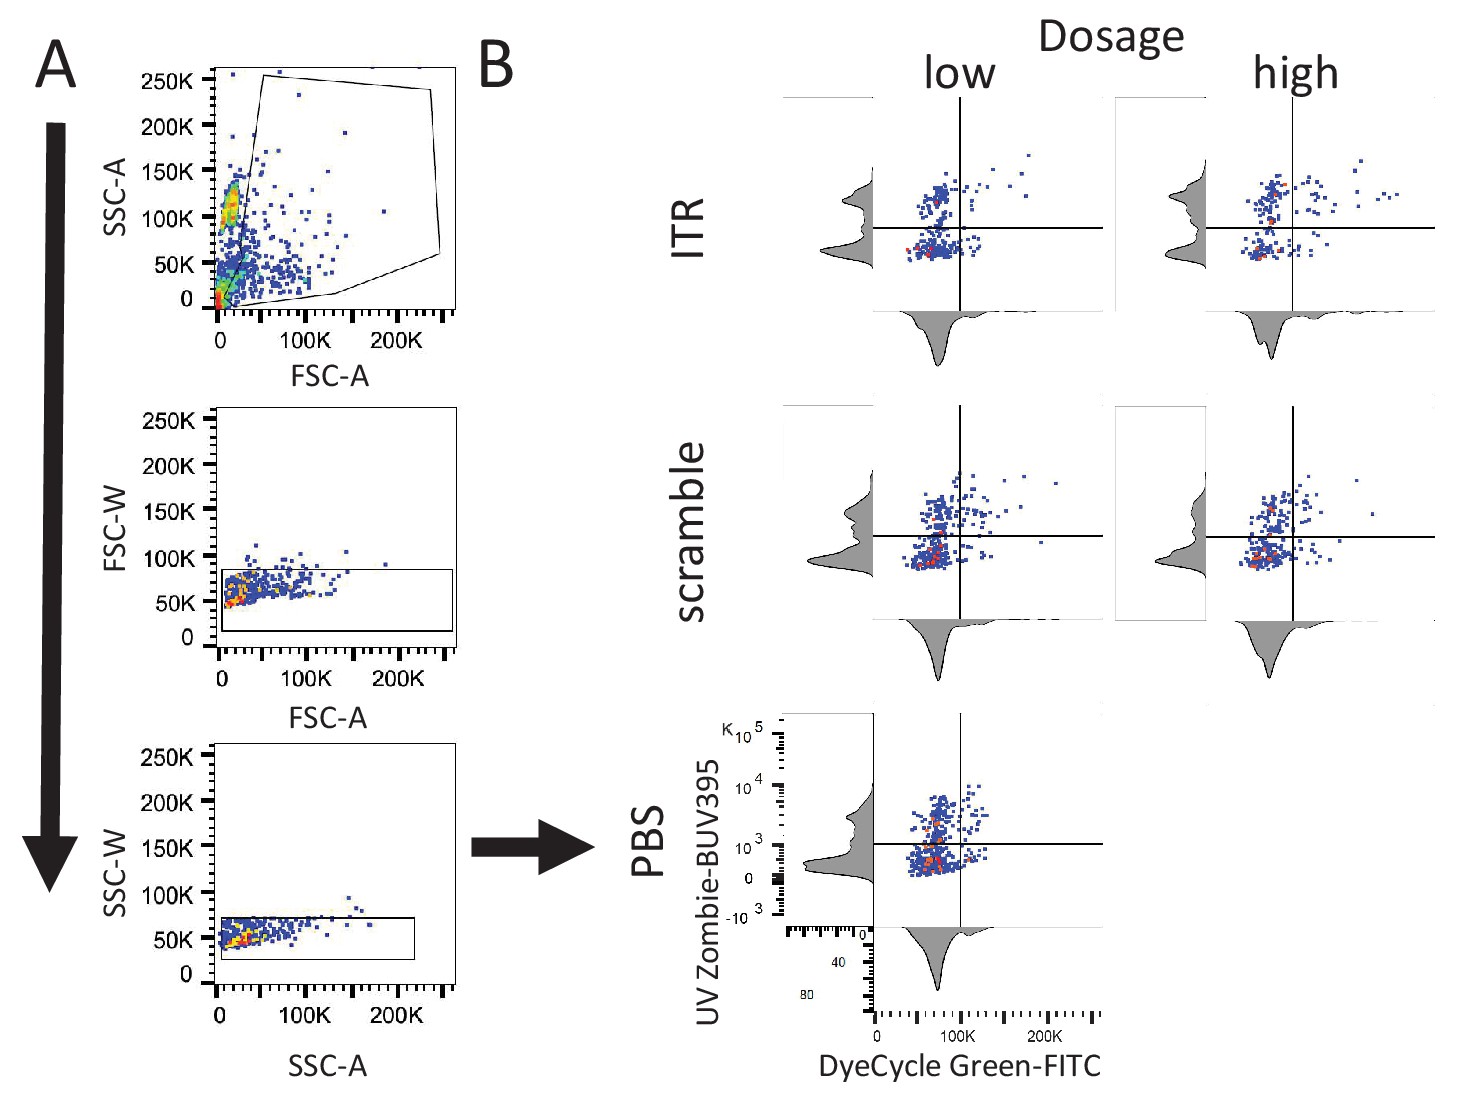
FLOW Cytometry gating strategy for analysis of AAV ITR-induced cell death during cell cycle.
(A) Representative gating strategy for selection of single and dividing cells. Example for PBS sample shown in B. (B) Representative two-parameter density plots used to determine population characteristics for each experimental condition: high and low Vybrant DyeCycle Green (FITC) for cell cycle, and high and low UV-Zombie (BUV395) for cell death. Axes abbreviations: forward scatter (FSC), side scatter (SSC), width (W), area (A).
-
Figure 3—figure supplement 1—source data 1
Source data for Figure 3—figure supplement 1.
Spreadsheets containing source data for graphs displayed in Figure 3—figure supplement 1.
- https://cdn.elifesciences.org/articles/59291/elife-59291-fig3-figsupp1-data1-v2.zip
Figure 4 with 1 supplement
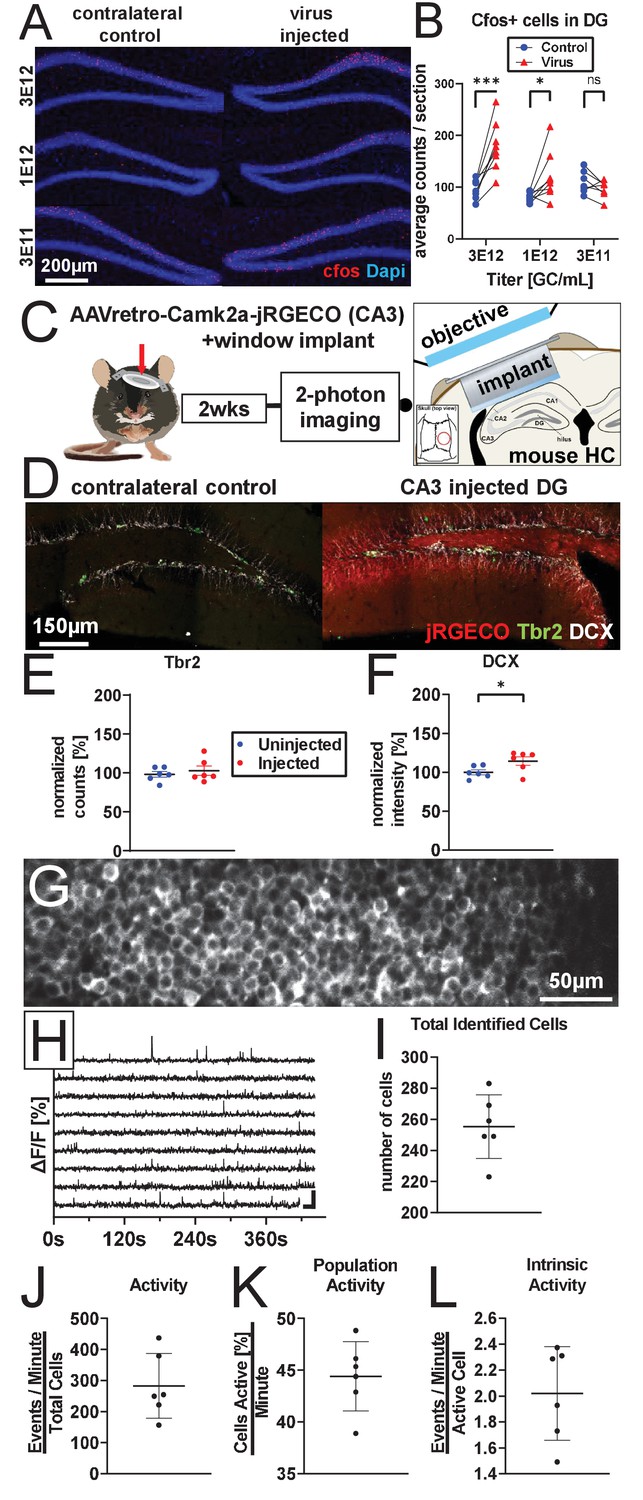
AAV retro serotype permits studies of DGC activity in vivo without ablating adult neurogenesis.
(A) Representative images showing cFos and Dapi used for quantification. (B) Mature DGCs are hyperactive following rAAV-induced cell loss in a dose-dependent manner for injected titers between 3e12 and 3e11. abDGC knockdown efficiency is significantly correlated with cFOS activation in mature DGCs (Figure 4—figure supplment 1A). (C) Experimental design for two-photon imaging of DG utilizing AAV retro. Eight hundred nanoliters of 3 e12 GC/mL AAVretro-CaMKIIa-jRGECO1a is injected into CA3, a cranial window is implanted, and mice undergo two-photon calcium imaging 2 weeks later (adapted from Gonçalves et al., 2016). (D) Representative images show Tbr2+ and DCX+ cells are intact in animals injected with AAV retro in CA3. (E) Quantification of Tbr2+ intermediate progenitors demonstrating adult neurogenesis is intact in AAV retro-injected animals. (F) Quantification of DCX staining demonstrates adult neurogenesis is intact in AAV retro-injected animals. (G) Representative field of view maximum projection for 2-photon calcium imaging showing cytoplasmic expression of jRGECO1a in >200 DGCs within a field of view. (H) Representative calcium traces of 10 randomly selected neurons from the same animal shown above. (I) Total number of identified DGCs in each DG is similar across animals. (J–L) Total activity of these cells was demonstrated to be sparse, with approximately one quarter of all cells active in any given minute while imaging, and only a few calcium transients per active cell a minute. Data are presented as mean ± s.e.m when comparing between groups in C–D and mean ± s.d. when describing variability within groups in I–L, significance reported as: *p<0.05, **p<0.01, ***p<0.001.
© 2016, Gonçalves et al. Graphic in Panel C adapted from Figure 1A in Gonçalves et al., 2016. This image is not covered by the CC-BY 4.0 licence and further reproduction of this panel would require permission from the copyright holder.
-
Figure 4—source data 1
Source data for Figure 4.
Spreadsheets containing source data for graphs displayed in Figure 4.
- https://cdn.elifesciences.org/articles/59291/elife-59291-fig4-data1-v2.zip
Figure 4—figure supplement 1
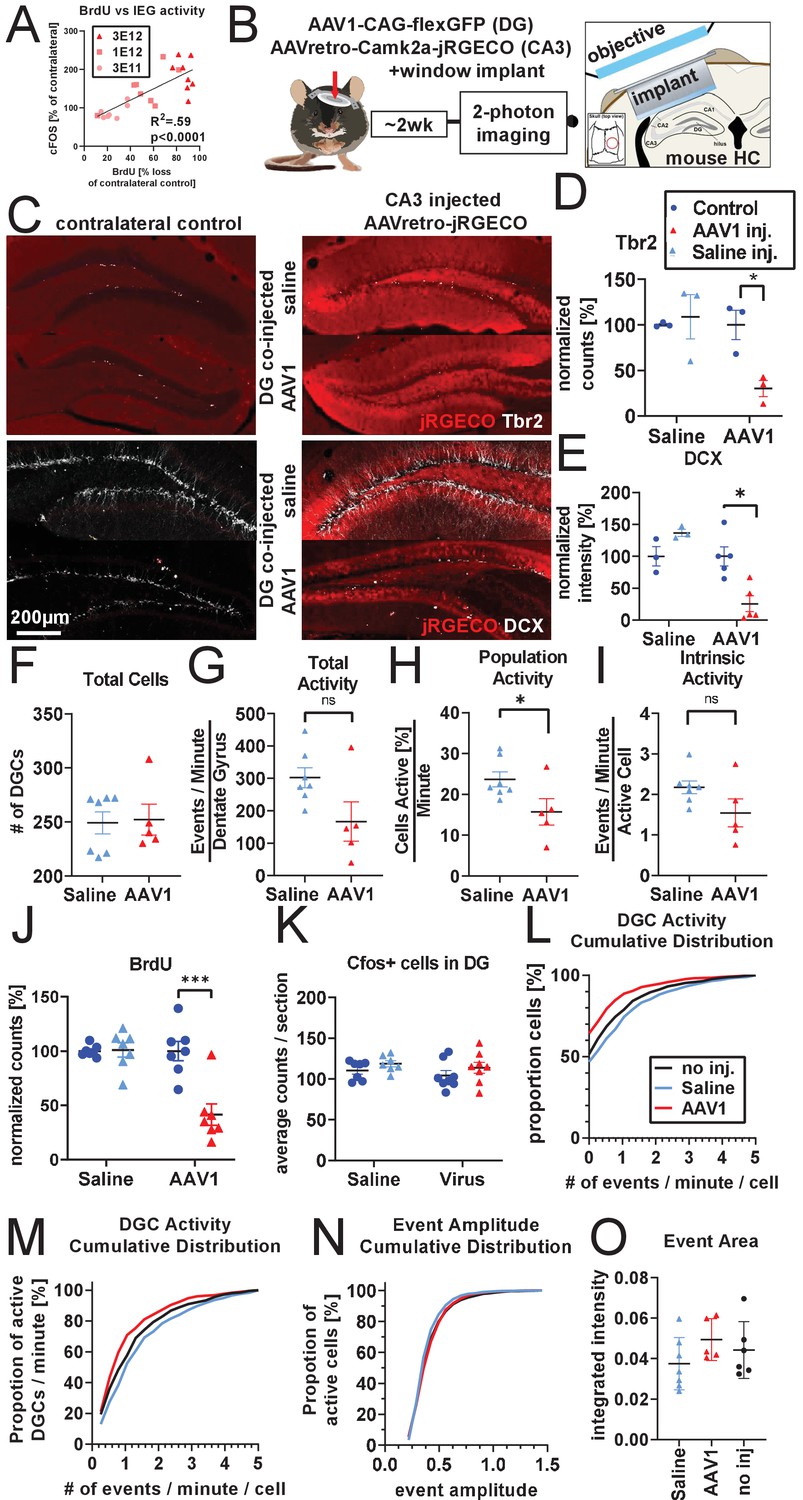
Calcium imaging following 2 week knockdown of adult neurogenesis.
(A) Additional analysis of experiments described in Figure 4A,B demonstrate that cFOS activation in mature DGCs is significantly correlated with knockdown efficiency of adult neurogenesis (n = 23 mice). (B) Experimental design for two-photon imaging of DG utilizing AAVretro. 800 nL of 3 E12 gc/mL AAVretro-CaMKiia-jRGECO1a is injected into CA3 and either 1 μL 3 E12 AAV1-CAG-flex-eGFP or saline is injected into the DG. Contralateral control DG is not injected. Mice are implanted with a cranial window on the DG co-injected side and undergo two-photon calcium imaging 2 weeks later (image adapted from Gonçalves et al., 2016). (C) Representative images show Tbr2+ and DCX+ cells are intact in animals injected with AAV retro in CA3 when saline is injected into DG, but not when AAV1 is injected into DG. (D) Quantification of Tbr2+ cells demonstrates adult neurogenesis is intact in saline co-injected animals but not in AAV1 co-injected animals (FsideXtreatment (1,4)=8.3, p<0.05; saline: 8.8 ± 25.8%, n.s.; AAV1: −69.5 ± 8.3%, p<0.01, n = three mice per group). (E) Quantification of DCX staining demonstrates adult neurogenesis is intact in saline co-injected but not in AAV1 co-injected animals (FsideXtreatment (1,6)=11.8, p<0.05; saline: 36.80% ± 20.6, n.s.; AAV1:−74.40 ± 21.5%, p<0.01, n = 3, five mice per group). (F) Total number of identified DGCs in each animal is not different between treatment groups (3.1 ± 17.1 cells, t(10)=0.2, n.s., n = 7, five mice per group in F–I). (G) AAV1 co-injected animals show a trend toward having fewer total spontaneous calcium transients 2 weeks after injection than saline or non-co-injected controls (−135.3 ± 62.4 events/minute/DG, t(10)=2.2, n.s.). (H) This effect is more apparent in the number of active cells of AAV1 co-injected animals (−8.0 ± 3.5 cell active [%]/minute, t(10)=2.3, p<0.05) but does not reach significance in (I) the level of spontaneous activity of individual active cells (−0.6 ± 0.3 events/minute/active cell, t(10)=1.8, n.s.). (J) A mock-imaging experiment to compare calcium imaging results with IEG activity. Animals received a DG injection of saline or AAV1, with a CA3 injection of AAVretro-Camk2a-jRGECO1a. After 2 weeks, animals were placed in a novel environment instead of undergoing calcium imaging. Adult neurogenesis is intact in saline-injected animals but not in AAV1 co-injected animals (FsideXtreatment(1,12)=12.9, p<0.01; saline: 1.0 ± 7.8%, n.s.;AAV1:−58.6 ± 14.7%, p <0.001, n = seven mice per group). (K) However, there is no difference in number of cfos+ cells in the DG (Fside(1,13)=2.3, n.s.; Ftreatment (1,13)=1.1, n.s.; FsideXtreatment(1,13)=0.01 n.s., n = 7, eight mice per group). (L) Comparing across the AAV retro imaging experiment with no direct viral injection into the DG (Figure 4) and 2 week knockdown experiment above, the increase in inactive cells seen with co-injection of AAV1 into the DG (red) can be seen in a left-shifted cumulative distribution, where saline co-injected animals and animals that received no DG injection are highly similar (n = 224–322 cells per group). (M) The cumulative distribution of active cells demonstrates little difference in the firing rate of active DGCs between conditions. (N) The distribution of DGC event amplitudes is similar between treatment groups (n = 224–322 cells per group). (O) Size of DGC events is not different between treatments (Ftreatment(2,15)=1.3, n.s., n = 7, 5, six mice per group). All data are presented as mean ± s.e.m, significance reported as: *p<0.05, **p<0.01, ***p<0.001.
© 2016, Gonçalves et al. Graphic in Panel B adapted from Figure 1A in Gonçalves et al., 2016. This image is not covered by the CC-BY 4.0 licence and further reproduction of this panel would require permission from the copyright holder.
-
Figure 4—figure supplement 1—source data 1
Source data for Figure 4—figure supplement 1.
Spreadsheets containing source data for graphs displayed in Figure 4—figure supplement 1.
- https://cdn.elifesciences.org/articles/59291/elife-59291-fig4-figsupp1-data1-v2.zip
Tables
Table 1
DG Injection coordinates.
Injection coordinates as measured from bregma adjusted for measured distance between lambda and bregma (Λ-B): anterior–posterior (A/P), medial–lateral (M/L); and dorsoventral depth from dura (D/V).
| Λ-B [mm] | A/P [mm] | M/L [mm] | D/V [mm] |
|---|---|---|---|
| 3.0 | −1.5 | ±1.5 | −1.8 |
| 3.2 | −1.6 | ±1.55 | −1.8 |
| 3.4 | −1.7 | ±1.6 | −1.9 |
| 3.6 | −1.8 | ±1.65 | −1.9 |
| 3.8 | −1.9 | ±1.7 | −1.95 |
| 4.0 | −2.0 | ±1.75 | −2.0 |
Appendix 1—key resources table
| Reagent type (species) or resource | Designation | Source or reference | Identifiers | Additional information |
|---|---|---|---|---|
| Strain, strain background (Mus musculus) | C57BL/6J | The Jackson Laboratory | #000664 | |
| Strain, strain background (Mus musculus) | STING-KO (B6(Cg)-Sting1tm1.2Camb/J ) | The Jackson Laboratory Jin et al., 2011 | #025805 | |
| Chemical compound, drug | BrdU (5-Bromo-2’-deoxyuridine) | Millipore Sigma | B5002 | 50 mg/kg/day i.p. for 3 days |
| Other | Nanoject III | Drummond Science | 3-000-207 | |
| Strain, strain background (AAV) | AAV1-CAG-GFP | Addgene | 37825 | |
| Strain, strain background (AAV) | AAV1-CAG::flex-eGFP-WPRE-bGH | Addgene and University of Pennsylvania | 51502 | |
| Strain, strain background (AAV) | AAVretro-CaMKIIa::NES-jRGECO1a-WPRE-SV40 | Gage, Salk Viral Core | ||
| Strain, strain background (AAV) | AAV8-CaMKIIa::NES-jRGECO1a-WPRE-SV40 | Gage, Salk Viral Core | ||
| Strain, strain background (AAV) | AAV1-Syn::NES-jRGECO1a-WPRE-SV40 | Addgene and University of Pennsylvania | 100854 | |
| Strain, strain background (AAV) | AAV8-CaMKIIa::mCherry-WPRE-bGH | Addgene and Salk Viral Core | 114469 | |
| Strain, strain background (AAV) | AAV8 capsid | University of North Carolina Viral Vector Core pXR8, Salk Viral Core | ||
| Other | 3 mm glass coverslip | Warner Instruments | CS-3R | #1 thickness |
| Other | Optibond All-In-One | Kerr Dental | 33381 | |
| Other | 2-Photon Laser Scanning Microscope Movable Objective Microscope (MOM) | Sutter Instruments | ||
| Other | 1070 nm femtosecond-pulsed laser | Coherent | Fidelity-2 | |
| Other | Nikon 16X water immersion objective | 0.8 NA, Nikon | CFI75 LWD 16X W | |
| Software, algorithm | Matlab | MathWorks | ||
| Software, algorithm | FlowJo | BD Biosciences | ||
| Software, algorithm | Prism 9.0 | GraphPad | ||
| Antibody | Anti-BrdU (rat monoclonal) | Accurate. Novus, Abcam | OBT0030, Accurate; NB500-169, Novus; AB6326, Abcam | IHC (1:250) |
| Antibody | Anti-cleaved-CASPASE3 (rabbit polyclonal) | Cell Signaling | 9661 | IHC (1:200) |
| Antibody | Anti-CFOS (goat polyclonal) | Santa Cruz | sc-52-G | IHC (1:500) |
| Antibody | Anti-CFOS (rabbit polyclonal) | Synaptic Systems | 226003 | IHC (1:500) |
| Antibody | Anti-DCX (goat polyclonal) | Santa Cruz | sc-8066 | IHC (1:50–500) |
| Antibody | Anti-DCX (guinea pig polyclonal) | Millipore | AB2253 | IHC (1:500) |
| Antibody | Anti-GFAP (chicken polyclonal) | Millipore | AB5541 | Ihc (1:1000) |
| Antibody | Anti-GFP (chicken polyclonal) | Aves Labs | GFP-1020 | IHC (1:1000) |
| Antibody | Anti-PROX1 (rabbit polyclonal) | Abcam | ab101851 | IHC (1:500) |
| Antibody | Anti-SOX2 (rabbit polyclonal) | Cell Signaling | 2748 | IHC (1:250) |
| Antibody | Anti-TBR2 (rabbit monoclonal) | Abcam | ab183991 | IHC (1:500–1000) |
| Antibody | Anti-SOX2 (rat monoclonal) | Invitrogen | 14981182 | IHC (1:1000) |
| Antibody | Anti-chicken-AlexaFluor488 (donkey polyclonal) | Jackson Immuno Research Laboratories | 703-545-155 | IHC (1:250) |
| Antibody | Anti-rat-AlexaFluor647 (donkey polyclonal) | Jackson Immuno Research Laboratories | 712-605-153 | IHC (1:250) |
| Antibody | Anti-rabbit-Cy5 (donkey polyclonal) | Jackson Immuno Research Laboratories | 711-175-152 | IHC (1:250) |
| Antibody | Anti-rabbit-Cy3 (donkey polyclonal) | Jackson Immuno Research Laboratories | 711-165-152 | Ihc (1:250) |
| Antibody | Anti-rabbit-AlexaFluor488 (donkey polyclonal) | Jackson Immuno Research Laboratories | 711-545-152 | IHC (1:250) |
| Antibody | Anti-guinea pig-AlexaFluor488 (donkey polyclonal) | Jackson Immuno Research Laboratories | 706-545-148 | IHC (1:250) |
| Antibody | Anti-guinea pig-Cy3 (donkey polyclonal) | Jackson Immuno Research Laboratories | 706-165-148 | IHC (1:250) |
| Antibody | Anti-guinea pig-AlexaFluor647 (donkey polyclonal) | Jackson Immuno Research Laboratories | 706-605-148 | IHC (1:250) |
| Antibody | Anti-goat-Cy5 (donkey polyclonal) | Jackson Immuno Research Laboratories | 705-175-147 | IHC (1:250) |
| Antibody | anti-goat-Cy3 (donkey polyclonal) | Jackson Immuno Research Laboratories | 705-165-147 | IHC (1:250) |
| Antibody | Anti-goat-AlexaFlour488 (donkey polyclonal) | Jackson Immuno Research Laboratories | 705-545-147 | IHC (1:250) |
| Other | Zeiss laser scanning confocal microscope | Zeiss | LSM 710, LSM 780, or Airyscan 880 | 20x and 63x objective |
| Other | Slide scanning microscope | Olympus | VS-120 | 10× objective |
| Other | Libra 120kV PLUS EF/TEM | Carl Zeiss | 2kx2k CCD camera, 20,000x magnification | |
| Commercial assay or kit | Amaxa Mouse NSC Nucleofector Kit | Lonza | VPG-1004 | |
| Sequenced-based reagent | ITR | Integrated DNA Technologies | 20nmole Ultramer DNA Oligo | 5’-Biotin- AGGAACCCC TAGTGATGGAGTTGG CCACTCCCTCTCTGCG CGCTCGCTCGCTCAC TGAGGCCGGGCGACC AAAGGTCGCCCGACG CCCGGGCTTTGCCCGG GCGGCCTCAGTGAGCG AGCGAGCGCGCAGAGA GGGAGTGGCCAA-3’ |
| Sequenced-based reagent | ITR Scramble | Integrated DNA Technologies | 20nmole Ultramer DNA Oligo | 5’-Biotin-CCACATACCGT \CTAACGTACGGATTCC GATGCCCAGATATATAG TAGATGTCTTATTTGTG GCGGAATAGCGCCAGAG CGTGTAGGCCAACCTTA GTTCTCCATGGAAGGCA TCTACCGAACTCGGTTGC GCGGCCAAATTGGAT-3’ |
| Chemical compound, drug | Vybrant DyeCycle Green Stain | Thermo Fisher | V35004 | 1:2000 |
| Chemical compound, drug | Zombie UV Fixable Viability Kit | BioLegend | 423107 | 1:1000 |
| Other | CountBright Absolute Counting Beads | Thermo Fisher | C36950 | ~5000 beads/sample |
| Other | LSRFortessa X-20 | BD Biosciences and UCSD Human Embryonic Stem Cell Core |
Additional files
-
Supplementary file 1
Tukey’s test for group comparisons of AAV ITR and SCR control.
Post hoc comparisons of the electroporation groups presented in Figure 3E,F following two-way ANOVA. *p<0.05, **p<0.01, ***p<0.001, n.s. = not significant.
- https://cdn.elifesciences.org/articles/59291/elife-59291-supp1-v2.docx
-
Transparent reporting form
- https://cdn.elifesciences.org/articles/59291/elife-59291-transrepform-v2.docx
Download links
A two-part list of links to download the article, or parts of the article, in various formats.
Downloads (link to download the article as PDF)
Open citations (links to open the citations from this article in various online reference manager services)
Cite this article (links to download the citations from this article in formats compatible with various reference manager tools)
AAV ablates neurogenesis in the adult murine hippocampus
eLife 10:e59291.
https://doi.org/10.7554/eLife.59291


