4-Hydroxy-2-nonenal antimicrobial toxicity is neutralized by an intracellular pathogen
- Department of Microbiology, University of Washington, United States
- Molecular and Cellular Biology Program, University of Washington, United States
Figures
Figure 1 with 1 supplement
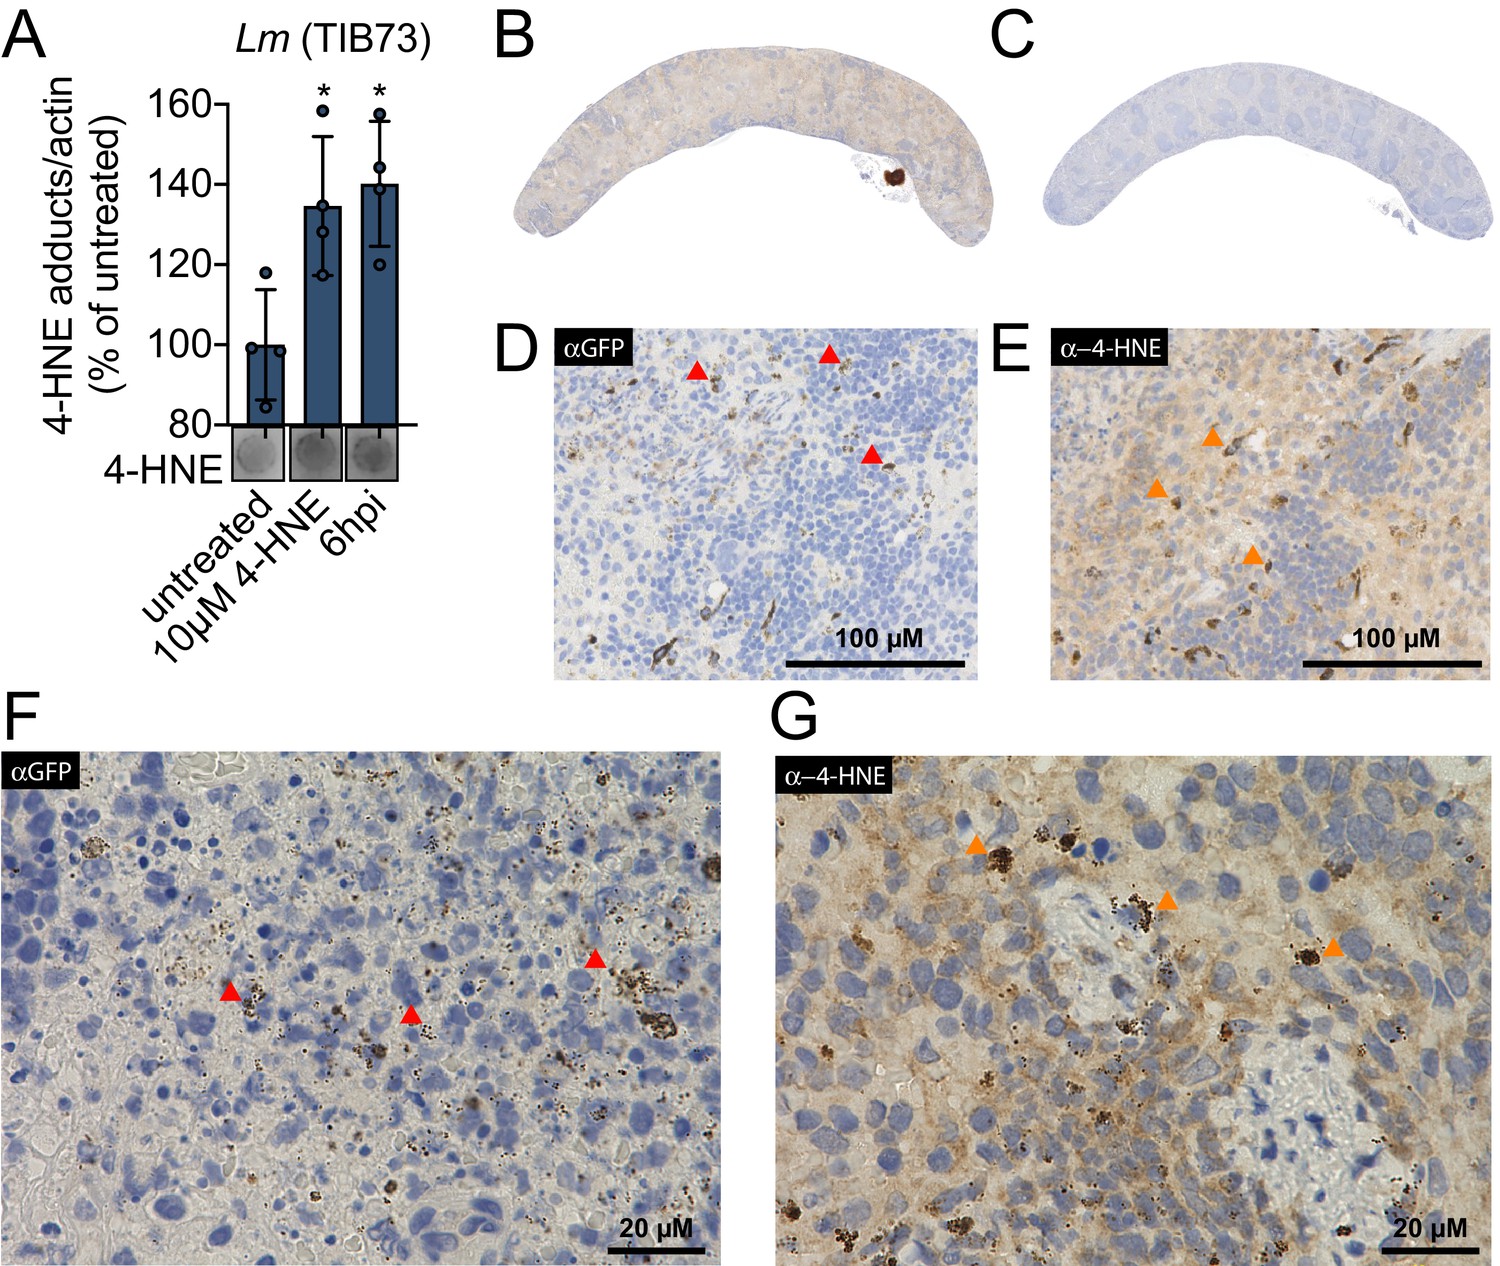
4-HNE accumulates during intracellular bacterial infection by L. monocytogenes.
(A) 4-HNE accumulation in TIB73 murine hepatocytes during intracellular L. monocytogenes infection. 4-HNE adduct accumulation was assessed by dot blot of whole cell lysates normalized to actin levels. Data are normalized 4-HNE/actin levels as percent of 4-HNE/actin in untreated sample. Dot blot image below is representative. (B) 4-HNE accumulation in the spleen after 48 hr murine infection by GFP+ L. monocytogenes assessed by immunohistochemistry analysis with anti-4-HNE antibody. (C) Uninfected spleen with anti-4-HNE antibody. (D) Infected spleen at ×25 magnification with anti-GFP antibody. (E) Infected spleen at ×25 magnification with anti-4-HNE antibody. (F) Infected spleen at ×100 magnification with anti-GFP antibody. (G) Infected spleen at ×100 magnification with anti-4-HNE antibody. Red arrows in D and F indicate L. monocytogenes (GFP) detection in the tissue. Orange arrows in E and G indicate cells with concentrated 4-HNE staining. Antigens were detected with 3,3-diaminobenzidine staining by horseradish peroxidase and cellular nuclei imaged with Hematoxylin counterstain in panels B-G. Data in (A) are in biological quadruplicate. Statistics in (A) are an ordinary one-way ANOVA with a Dunnett’s multiple comparison test against untreated. Error bars are mean ± SD. *p<0.05.
Figure 1—figure supplement 1
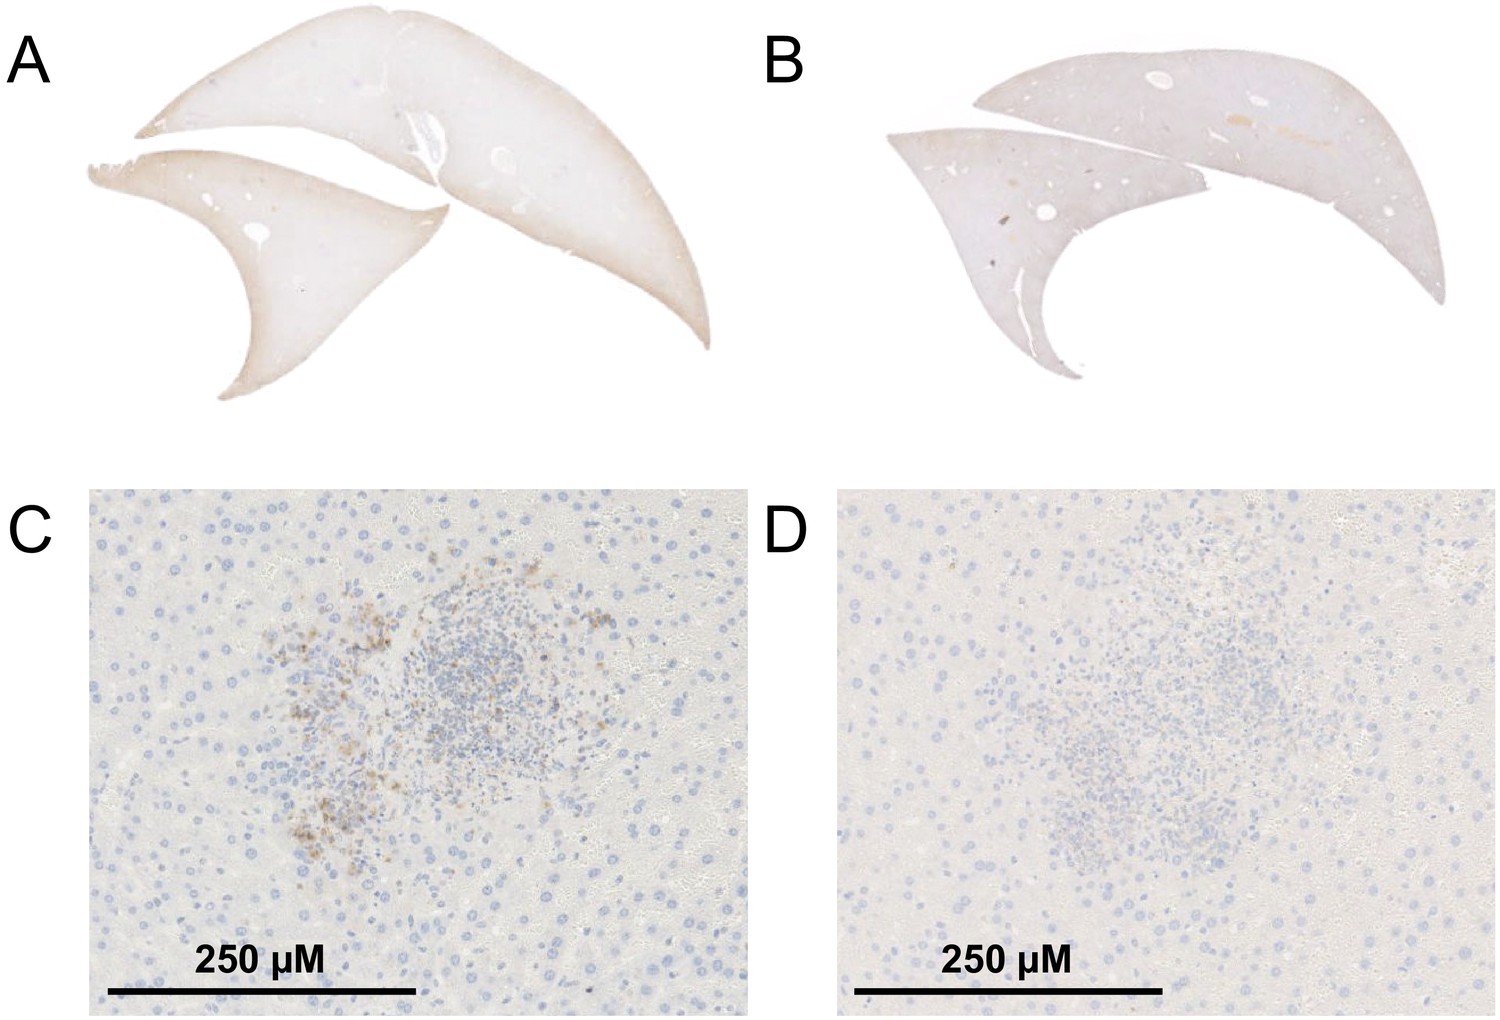
4-HNE does not accumulate in the liver during infection by L. monocytogenes.
(A) 4-HNE accumulation in the spleen after 48 hr murine infection by GFP+ L. monocytogenes assessed by immunohistochemistry analysis with anti-4-HNE antibody. (B) Uninfected spleen with anti-4-HNE antibody. (C) Infected spleen at ×10 magnification with anti-GFP antibody. (D) Infected spleen at ×10 magnification with anti-4-HNE antibody.
Figure 2
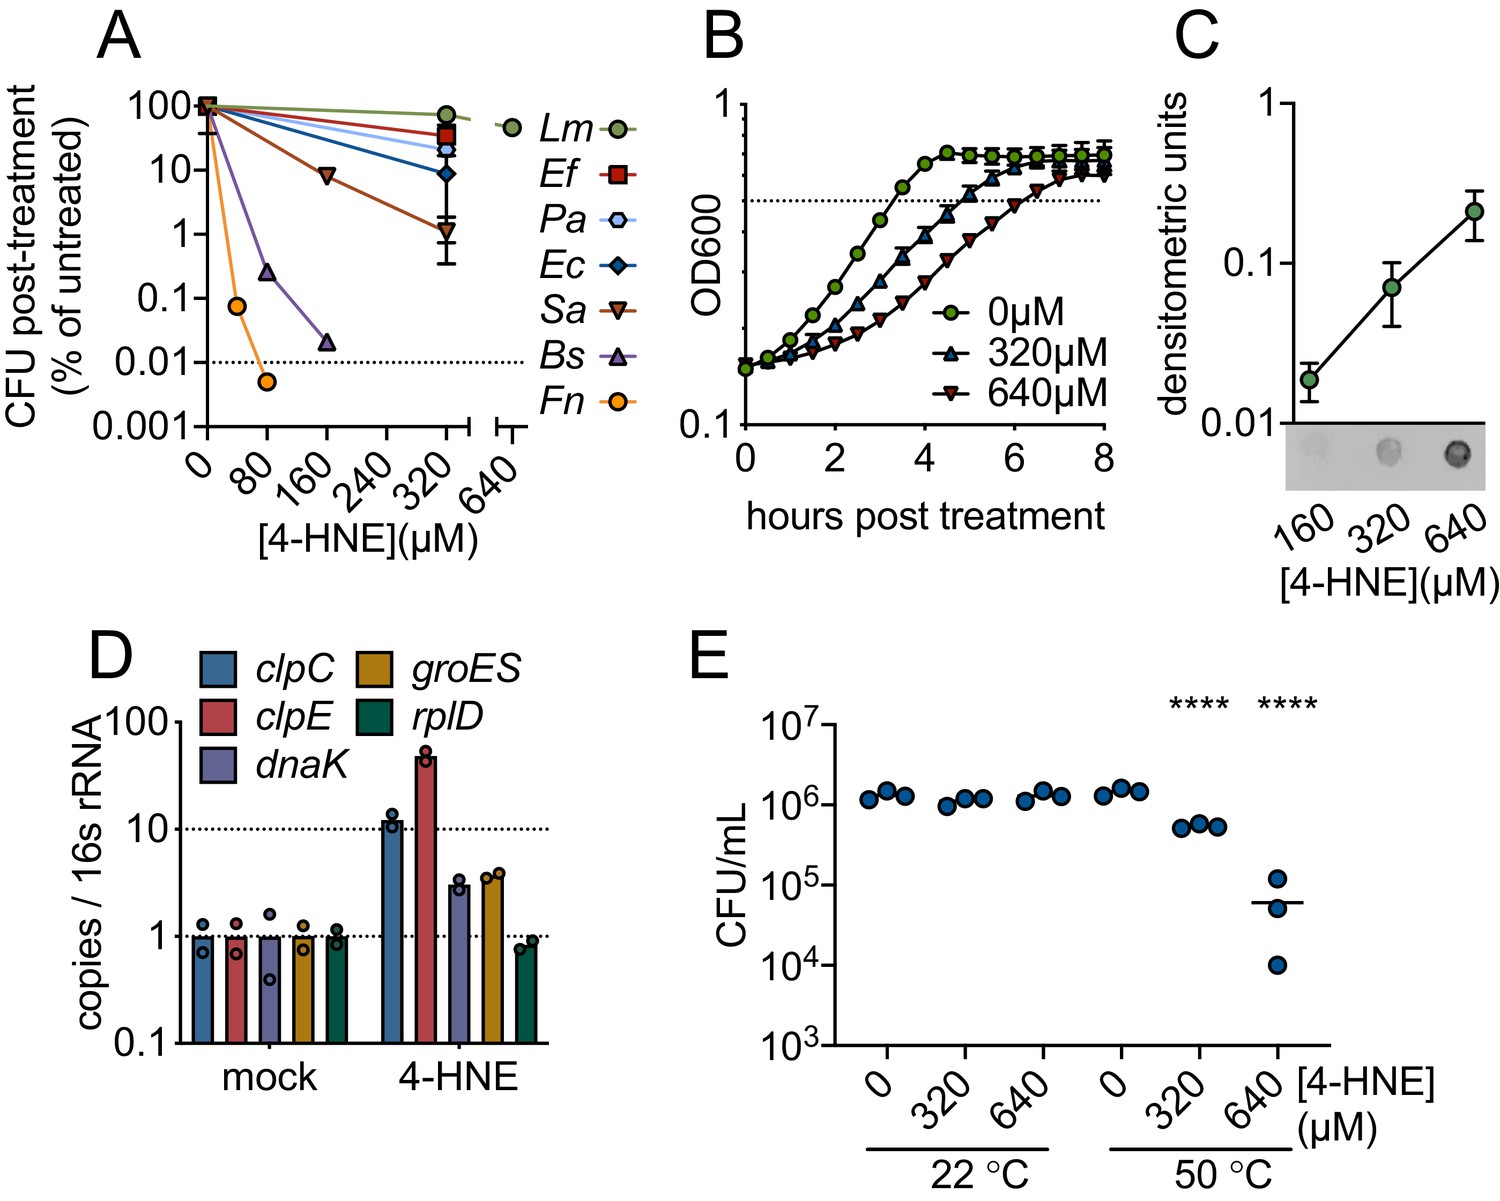
4-HNE is a bactericidal, cell-permeable and protein damaging molecule.
(A) Survival of mid-log (0.4–0.8 OD600) Listeria monocytogenes (Lm), Enterococcus faecalis (Ef), Pseudomonas aeruginosa (Pa), Escherichia coli (Ec), Staphylococcus aureus (Sa), Bacillus subtilis (Bs), and Francisella novicida (Fn) following exposure to various concentrations of 4-HNE or mock vehicle (ethanol) in PBS at 37°C for 1 hr. Data are reported as recovered CFU normalized to mock-treated controls. Dashed line is at the limit of detection. (B) Growth of L. monocytogenes in TSB at 37°C with various concentrations of 4-HNE added at time zero. Dashed line at OD600 0.5 (C) Anti-4-HNE dot blot of soluble bacterial lysates from mid-log L. monocytogenes resuspended in PBS and treated with increasing concentrations of 4-HNE for 30 min. Protein levels were normalized (3 µg total protein) and signal quantified by densitometry on a Licor Odyssey Fc. (D) RT-qPCR measurement of expression of the indicated genes from mid-log L. monocytogenes in TSB treated with 640 µM 4-HNE for 20 min. Expression normalized to 16S rRNA levels. (E) Recovered CFU of WT L. monocytogenes following exposure to 4-HNE or mock vehicle (ethanol) in PBS at 37°C for 1 hr, followed by heat shock (50°C) or no heat shock (22°C) treatment for 10 min. Data in figures (A) and (B) are in biological triplicate. Data in (C) and (D) are biological duplicate. Data in (E) are in technical triplicate and representative of at least two independent experiments. Statistics in (E) are an ordinary one-way ANOVA with a Dunnett’s multiple comparison test against each untreated. Error bars are mean ± SD. *p<0.05; **p<0.01; ***p<0.001; ****p<0.0001. In figure (E), the line is drawn at the median of data.
Figure 3 with 2 supplements
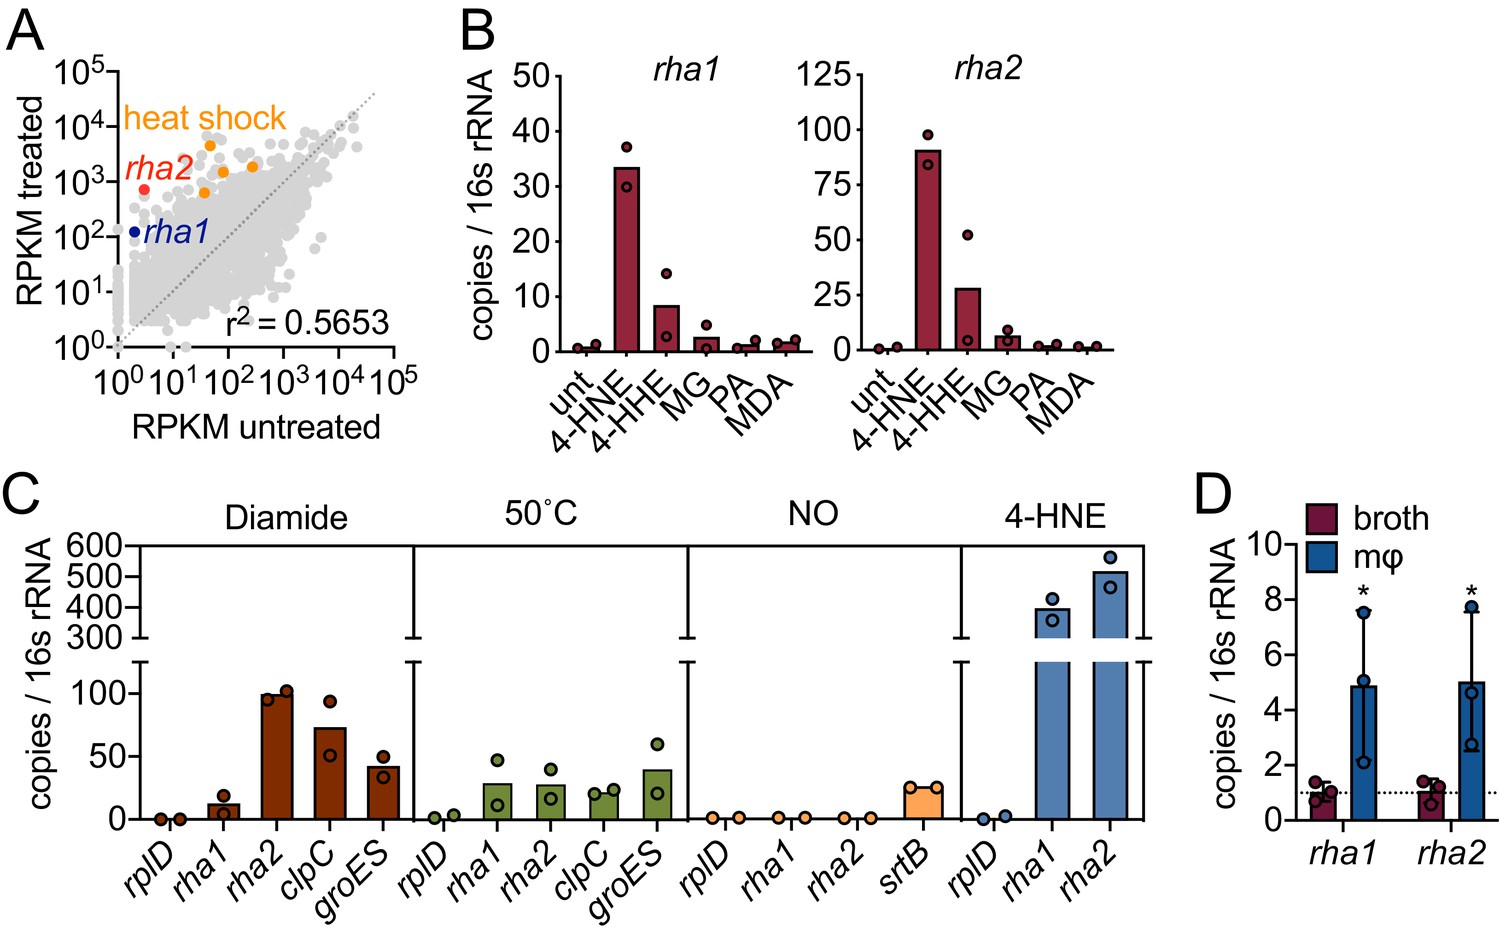
4-HNE exposure induces resistance genes in L. monocytogenes.
(A) Global gene expression of mid-log L. monocytogenes in TSB treated with 640 µM 4-HNE or ethanol control for 20 min. RPKM: reads per kilobase million. Genes of interest rha1, rha2, and heat shock class members are indicated in blue, red, and orange, respectively. (B) RT-qPCR of expression of rha1 and rha2 genes after 20 min treatment of mid-log bacteria in TSB media with 500 µM of selected aldehydes: 4-HNE (4-hydroxy-2-nonenal), 4-HHE (4-hydroxy-2-hexenal), MG (methylglyoxal), PA (propionaldehyde), and MDA (malondialdehyde). (C) RT-qPCR analysis of expression of rha1 and rha1 treated with sublethal levels of diamide (5 mM), heat (50°C), 4-HNE (640 µM), and nitric oxide (1 mM of the NO donor DEA/NO) for 20 min in TSB media. (D) RT-qPCR analysis of expression of rha1 and rha2 at 6 hr post infection in J774 macrophages (mφ). Data in figures (A) and (B) are in biological duplicate. (C) are two independent experiments, with two pooled biological duplicates within each experiment. (D) is in biological triplicate. The bar graphs in (B) (C) and (D) represent the mean of the data. Statistics in (D) are unpaired t-test between the ∆Ct values of broth and macrophage samples. Error bars are mean ± SD. *p<0.05.
Figure 3—figure supplement 1
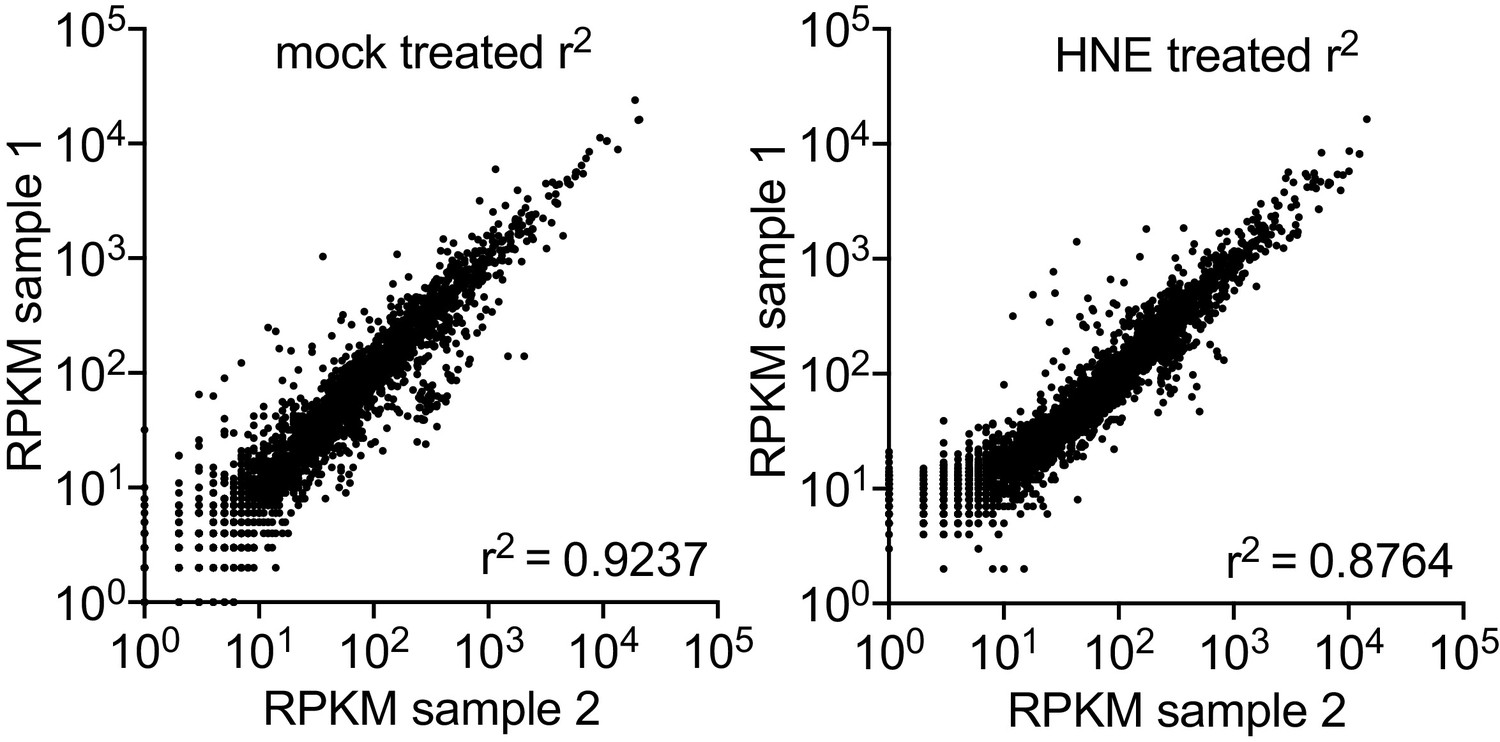
Global gene expression of mid-log L. monocytogenes in TSB treated with ethanol mock control (panel 1) or 640 µM 4-HNE (panel 1) for 20 min.
RPKM: reads per kilobase million.
Figure 3—figure supplement 2
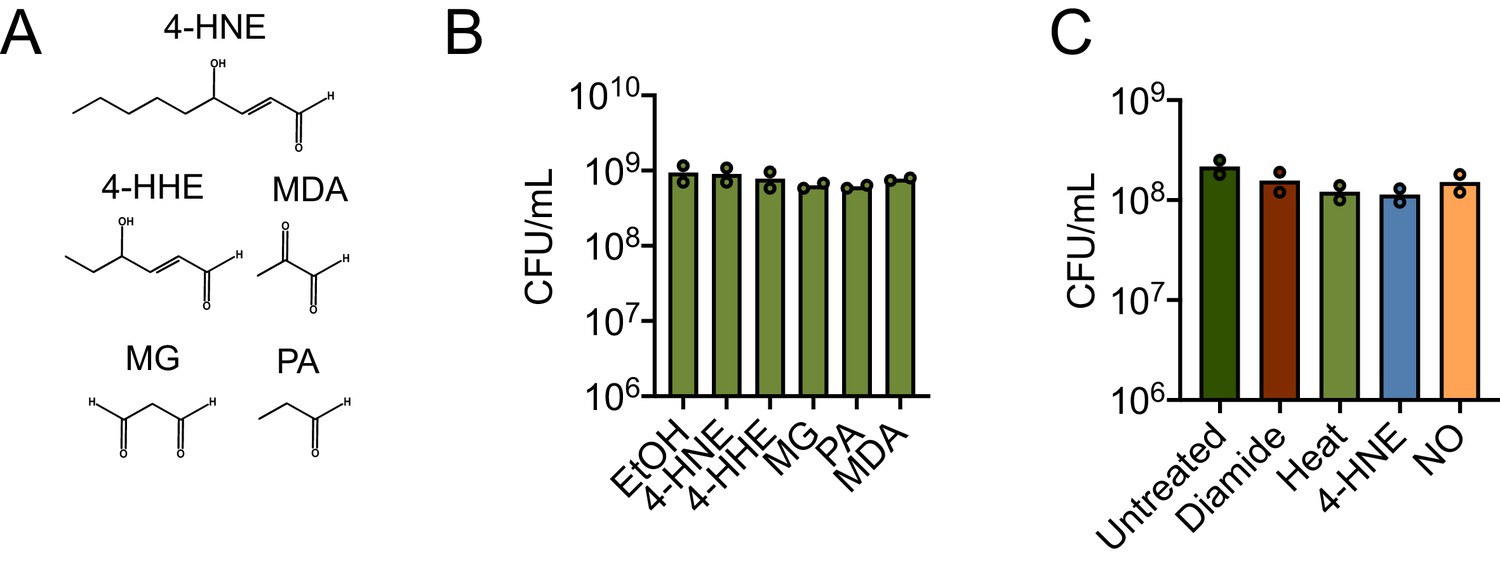
Various aldehydes and chemical stresses and impacts on L. monocytogenes survival.
(A) Structures of the aldehydes used in the experiment. 4-HNE: 4-hydroxy-2-nonenal, 4-HHE: 4-hydroxy-2-hexenal, MDA: malondialdehyde, MG: methylglyoxal, PA: propionaldehyde. (B) CFU post treatment with sublethal concentrations of listed aldehydes. Performed in technical duplicate. (C) CFU post treatment with a sublethal amount of listed stressors. Performed in technical duplicate.
Figure 4 with 1 supplement
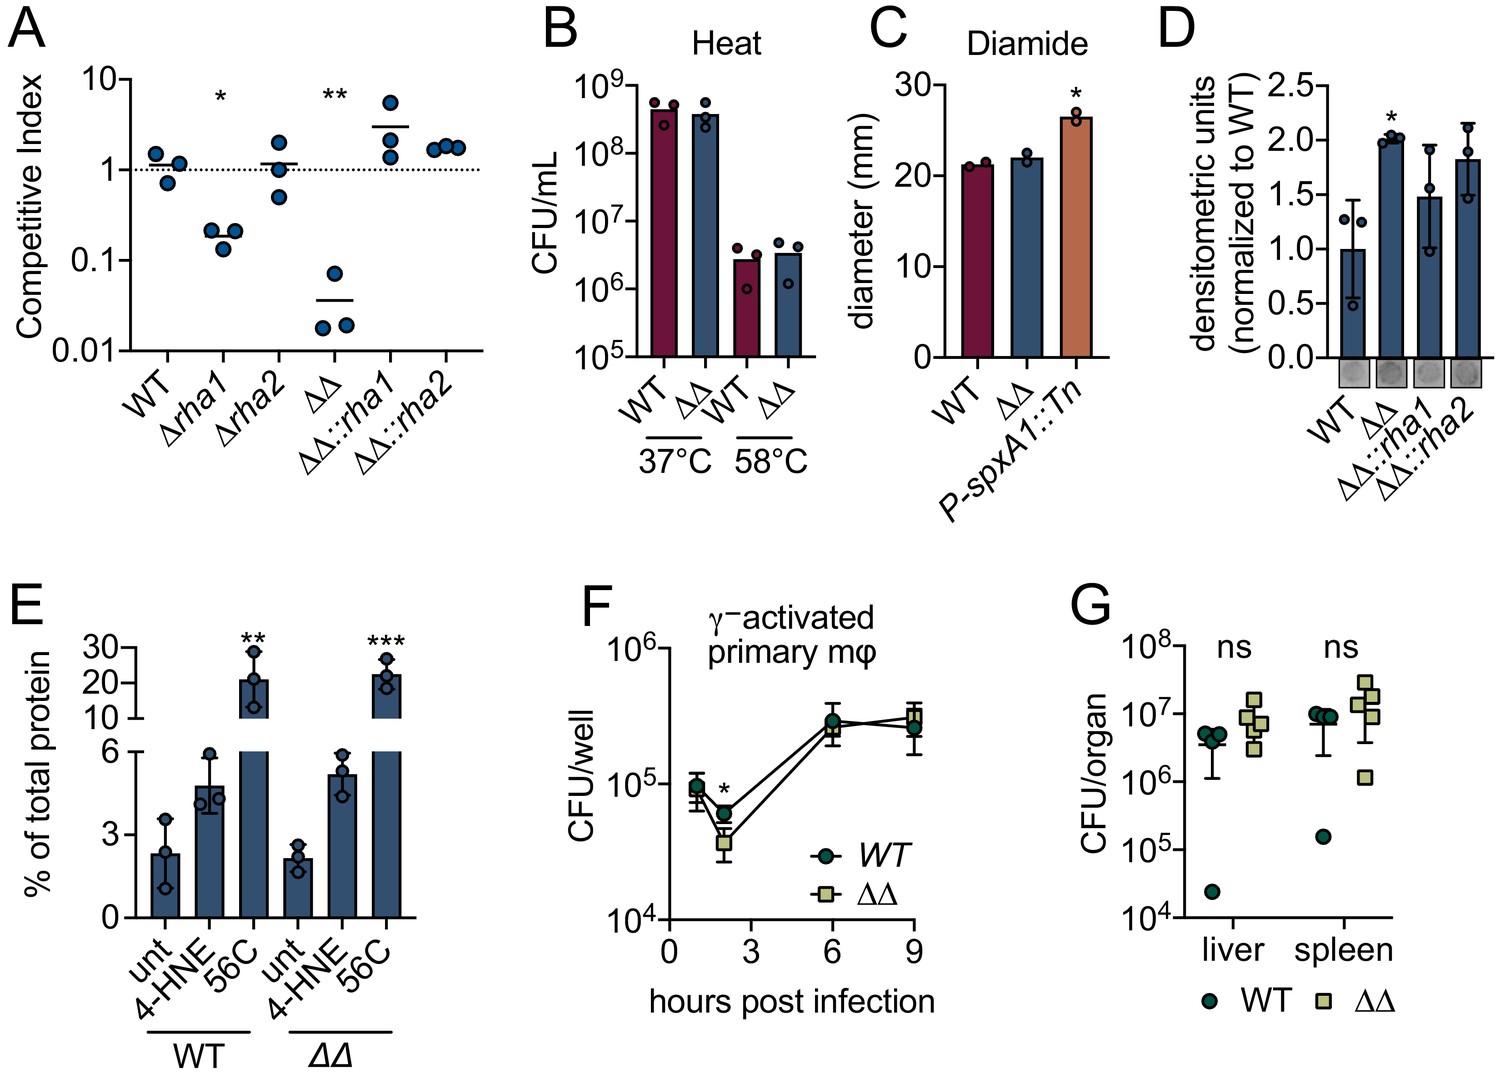
L. monocytogenes ∆rha1∆rha2 has reduced ability to survive 4-HNE toxicity.
(A) Competitive index of WT and mutant L. monocytogenes in PBS treated with 640 µM 4-HNE at 37°C for 1 hr. (B) CFU of WT and ∆rha1∆rha2 L. monocytogenes in TSB exposed to 58°C or 37°C for 15 min. (C) Diameter of zone of clearance by 1M diamide on lawns of WT, ∆rha1∆rha2 and positive control P-spxA1::tn L. monocytogenes on TSA plates as described in Reniere et al., 2016. (D) Accumulation of 4-HNE-adducted proteins in L. monocytogenes exposed to 640 µM 4-HNE for 3 hr in TSB media, assessed by dot blot and normalized to WT. Dot blot images below are representative. (E) Aggregated protein found in the insoluble fraction measured as percent of total protein in WT and ∆rha1∆rha2 L. monocytogenes. Untreated, 4-HNE treatment (640 µL for an hour) and heat shock (56°C for 10 min). (F) CFU/well of WT and ∆rha1∆rha2 L. monocytogenes in recombinant murine IFN-γ (100 ng) activated WT primary murine macrophages. (G) CFU/organ of WT and ∆rha1∆rha2 L. monocytogenes at 48 hr intravenous murine infection. Data in figures (A) and (D) are in technical triplicate, representative of at least three independent experiments. Data in (C) are two independent experiments, with two pooled biological duplicates within each experiment. Data in (B), (E), (F) and (G) are biological triplicate. Statistics in (A) are unpaired t-tests between WT and mutant L. monocytogenes competition pairs. Statistics in (C) are unpaired t-tests between WT and mutant L. monocytogenes. Statistics in (D) and (E) are an ordinary one-way ANOVA with a Dunnett’s multiple comparison test against WT (in D) or untreated sample (in E). Statistics in (F) are unpaired t-tests comparing WT and ∆rha1∆rha2 L. monocytogenes CFU at hour two post infection. Statistics in (G) are unpaired t-tests comparing WT and ∆rha1∆rha2 L. monocytogenes CFU within each organ. Error bars are mean ± SD. *p<0.05; **p<0.01; ***p<0.001. In figures (A) and (G), the line is drawn at the median of data.
Figure 4—figure supplement 1
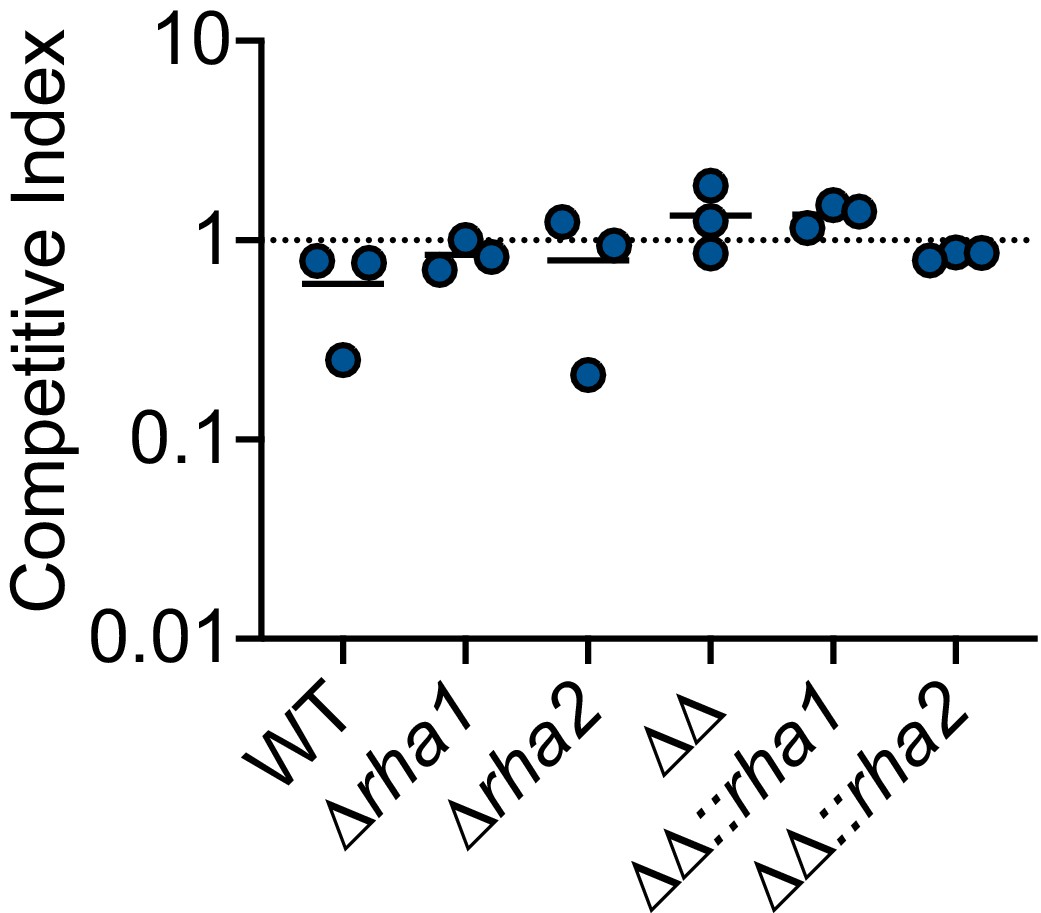
Impact of ∆rha1 and ∆rha2 on L. monocytogenes survival in PBS.
(A) Competitive index of 1 hr mock -treated (ethanol) L. monocytogenes in PBS. The line is drawn at the median of data.
Figure 5

Recombinant Rha1 and Rha2 metabolize 4-HNE to 4-HNA.
(A) Phyre2 structural homology models predict that asparagine-47 interacts with the FMN in Rha1 (left) and tyrosine-195 coordinates NADPH in Rha2 (right). (B) Rates of NADPH oxidation (200 µM) by WT (blue) and mutant (orange) variants of Rha1 and Rha2 in the presence of 4-HNE. (C) Rate of NADPH oxidation (200 µM) by human enzyme AKR1C1 in the presence of 4-HNE. (D) NADPH oxidation rate by Rha1 and Rha2 in the presence of 640 µM final concentration of various aldehydes. (E) TLC plates showing the migration of reaction contents of Lane 1: 4-HNE, Lane 2: 1,4-DHN, and Lanes 3–6: indicated enzymes with 4-HNE in the absence and presence of NADPH after 1 hr of reaction at room temperature. 4-HNE -- black arrow, 4-HNA -- red arrow, 1,4-DHN -- blue arrow. (F) Diagram of 4-HNE to 4-HNA conversion. Data in (B), (C), (D) and (E) are representative of at least three independent experiments.
Figure 6 with 1 supplement
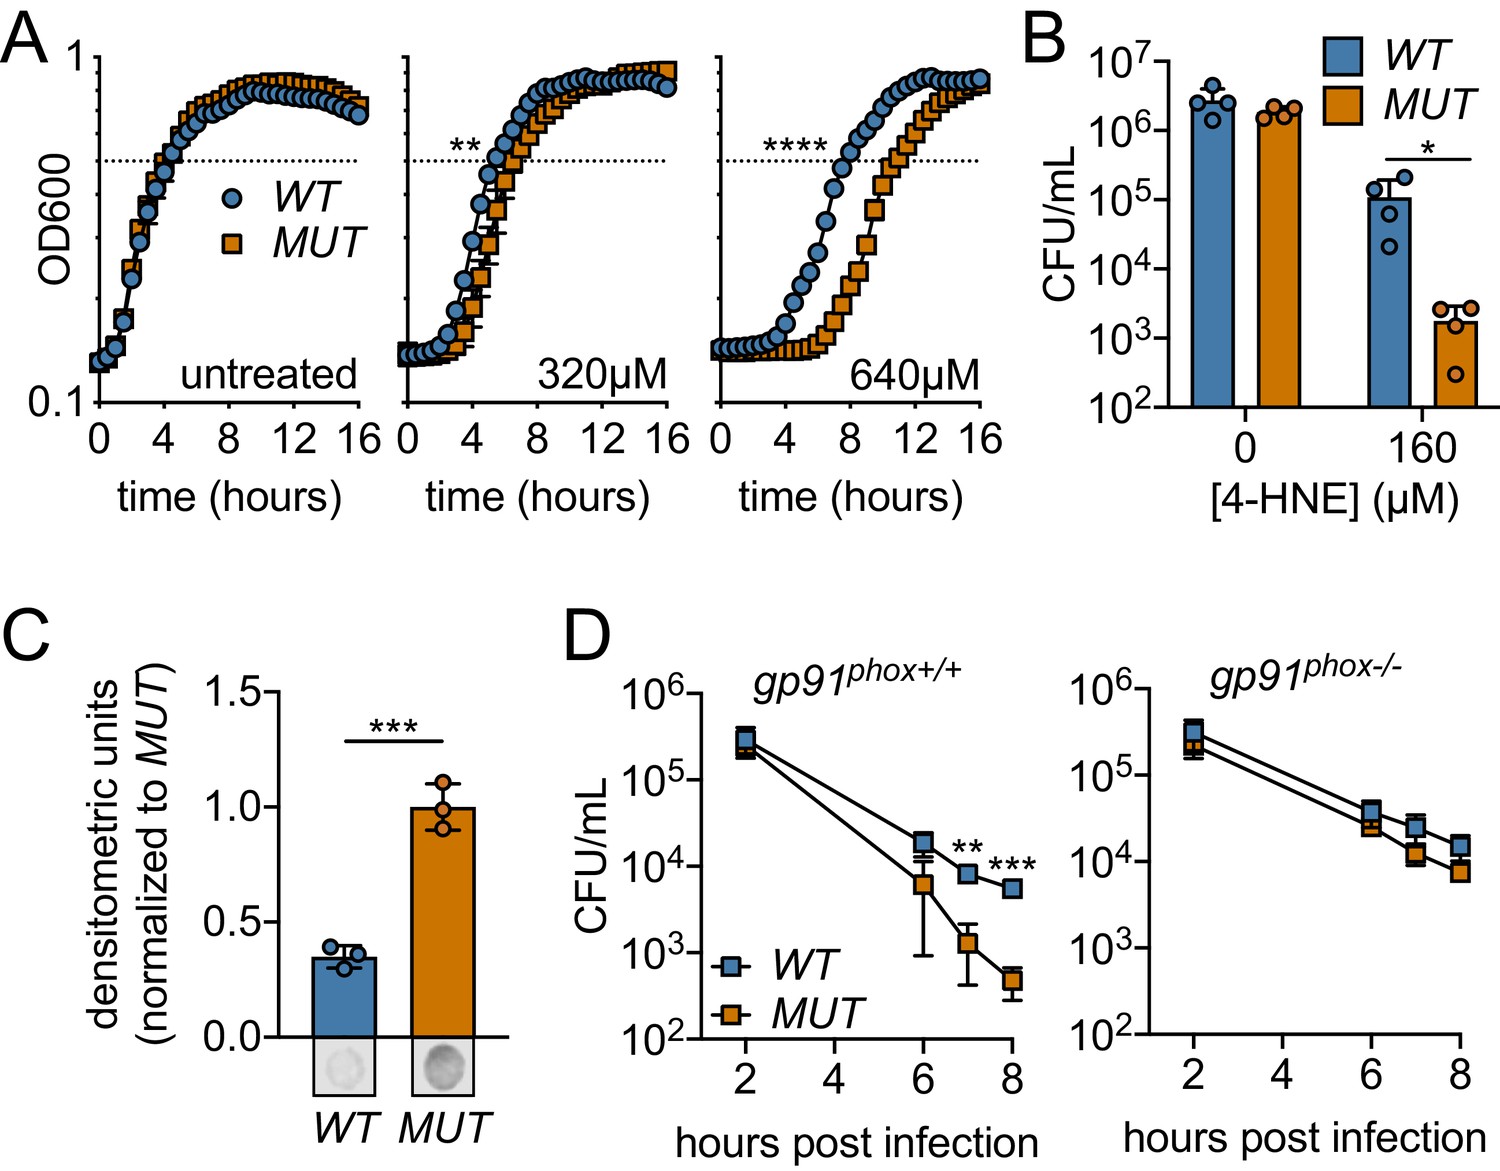
Ectopic expression or Rha1 and Rha2 confers 4-HNE resistance to sensitive bacteria.
(A) Growth of B. subtilis expressing either the WT or MUT (catalytically dead mutant) versions of rha1 and rha2 in TSB at 37°C in the presence of the indicated concentrations of 4-HNE added at time zero. Dotted line represents OD600 0.5. (B) Survival of B. subtilis WT and MUT in PBS at 37°C with 160 µM 4-HNE for 1 hr. (C) 4-HNE conjugates from B. subtilis WT and MUT soluble cell lysates (3 µg total protein) 3 hr after 4-HNE treatment as assessed by dot blot and quantified by densitometry on a Licor Odyssey Fc. Dot blots below are representative. (D) B. subtilis WT and MUT survival following phagocytosis by Interferon gamma-activated primary WT or phagosomal oxidase-deficient bone-marrow-derived macrophages (WT or gp91phox-/- pBMMs). All experiments were performed in biological triplicate. Statistics in (A) are unpaired t-tests comparing the hours to OD600 0.5 between WT and MUT B. subtilis pHT01::rha1/2. Statistics in (B), (C) and (D) are unpaired t-tests comparing WT and MUT B. subtilis pHT01::rha1/2. Error bars are mean ± SD. *p<0.05; **p<0.01; ***p<0.001; ****p<0.0001.
Figure 6—figure supplement 1
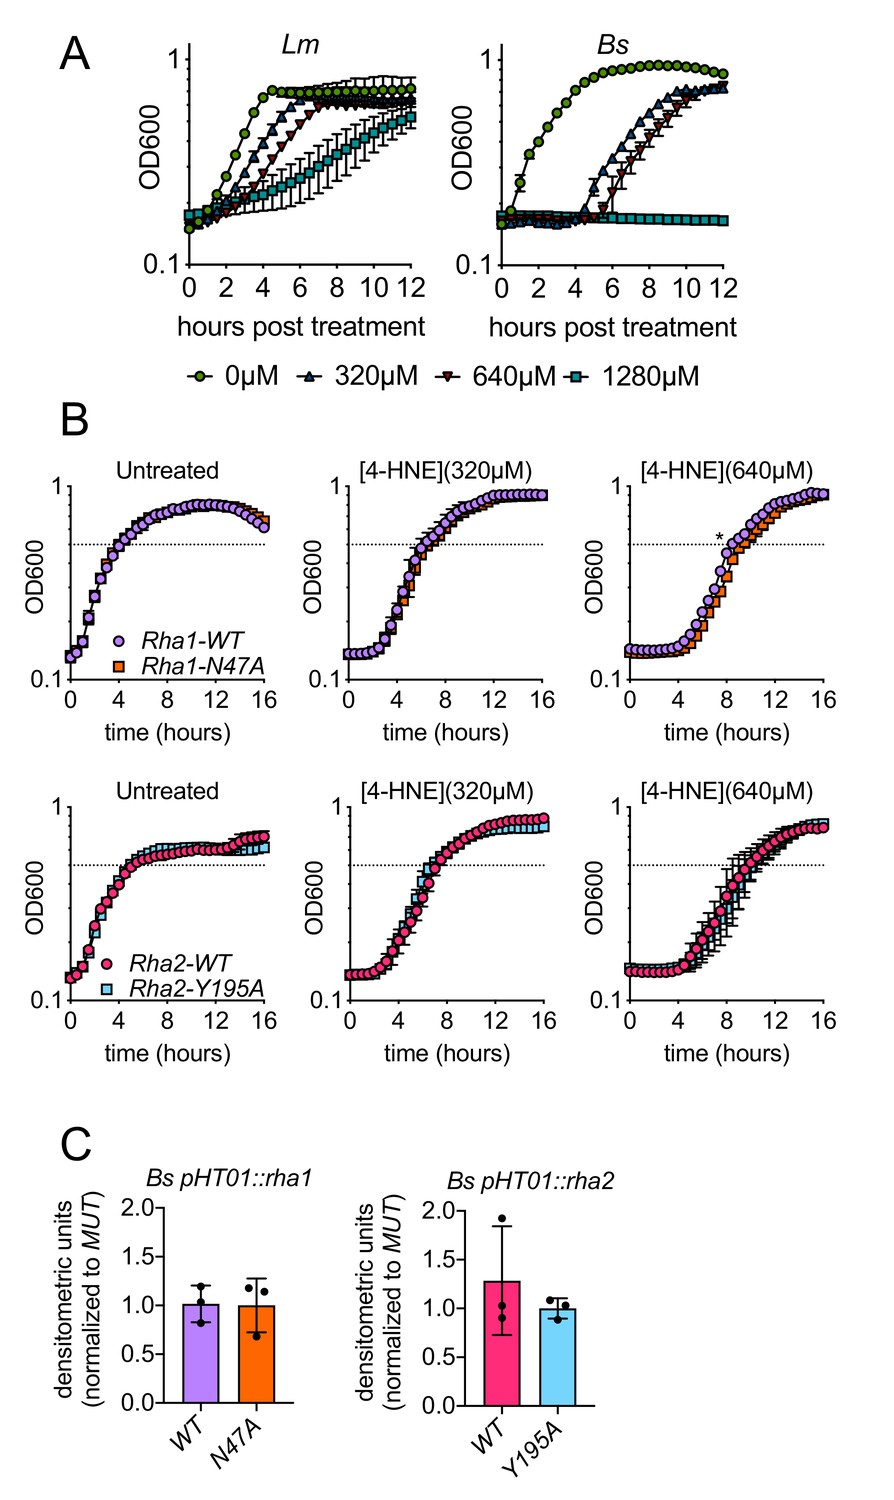
Impacts of 4-HNE, Rha1, and Rha2 on 4-HNE growth delay and adduct accumulation in a sensitive bacteria.
(A) L. monocytogenes (Lm) and B. subtilis (Bs) growth curves in TSB after exposure to various concentrations of 4-HNE. (green circles: 0 µM, blue triangles: 320 µM, red triangles: 640 µM, light blue squares: 1280 µM). Data performed in technical duplicate and representative of at least three independent experiments. (B) Growth curves of B. subtilis::pHT01 expressing various rha1 and rha2 constructs in TSB after exposure to various concentrations of 4-HNE. Dotted line represents OD600 0.5. Performed in biological triplicate. (C) 4-HNE dot blots of B. subtilis::pHT01 expressing various rha1 and rha2 constructs after 3 hr of exposure to 640 µM 4-HNE in TSB. Performed in biological triplicate. Statistics in (B) is an unpaired t-test comparing the hours to OD600 0.5 between B. subtilis pHT01::rha1-WT and pHT01::rha1-N47A. Error bars are mean ± SD. *p<0.05.
Tables
Key resources table
| Reagent type (species) or resource | Designation | Source or reference | Identifiers | Additional information |
|---|---|---|---|---|
| Cell line (Mus musculus) | J774A.1 | PMID:1612739 | Immortalized murine macrophages | |
| Cell line (Mus musculus) | TIB73 | ATCC: BNL CL.2 | Immortalized murine hepatocytes | |
| Strain, strain background (Mus musculus) | C57BL/6J | Jackson Laboratories: 000664 | ||
| Strain, strain background (Mus musculus) | gp91phox- (C57BL/6J backcross) | Jackson Laboratories: 002365 | ||
| Strain, strain background (Escherichia coli) | DH10b | Invitrogen: 10536193 | ||
| Strain, strain background (Escherichia coli) | SM10 | DOI: https://doi.org/10.1038/nbt1183-784 | ||
| Strain, strain background (Escherichia coli) | BL21 (DE3) | EMD Millipore: 69450 | ||
| Strain, strain background (Escherichia coli) | Rosetta (DE3) | EMD Millipore: 70954 | ||
| Strain, strain background (Listeria monocytogenes) | 10403S | PMID:2125302 | WT | |
| Strain, strain background (Bacillus subtilis) | 168 | PMID:18723616 | WT | |
| Strain, strain background (Francisella novicida) | U112 | PMID:17550600 | WT | |
| Strain, strain background (Pseudomonas aeruginosa) | PAO1 | PMID:20023018 | WT | |
| Strain, strain background (Staphylococcus aureus) | Newman | PMID:17951380 | WT | |
| Strain, strain background (Enterococcus faecalis) | OG1RF | PMID:18611278 | WT | |
| Strain, strain background (Listeria monocytogenes) | DP-L3903 | PMID:11500481 | Antibiotic marked competition strain | |
| Strain, strain background (Listeria monocytogenes) | DP-L4056 | PMID:12107135 | Phage-cured 10403S strain for use with pPL1 integration plasmid | |
| Genetic reagent | Genetically modified bacterial strains used in this work | This paper | Supplementary file 1 | |
| recombinant DNA reagent | pPL1077 | This study | pPL1-GFP integration plasmid | (Gift from Peter Lauer; Berkeley, CA) |
| Recombinant DNA reagent | pKSV7 | PMID:8388529 | Shuttle vector for L. monocytogenes gene disruption | |
| Recombinant DNA reagent | pET20b | Novagen: 69739 | C-terminus 6xHis tagged E. coli T7 expression vector | |
| Recombinant DNA reagent | pET28b | Novagen: 69865 | N-terminus 6xHis tagged E. coli T7 expression vector | |
| Recombinant DNA reagent | pPL2-Pspac | PMID:25583510 | Integrative L. monocytogenes plasmid pPL2 engineered with constitutive Pspac promoter | |
| Recombinant DNA reagent | pHT01 | PMID:17624574 | B. subtilis expression vector | |
| Recombinant DNA reagents | Plasmids generated and used in this work | This paper | Supplementary file 2 | |
| Gene (Listeria monocytogenes) | lmo0103 (LMRG_02352) | GenBank: Gene ID 12552319 | Gene rha1 | |
| Gene (Listeria monocytogenes) | lmo0613 (LMRG_00296) | GenBank: Gene ID 12552833 | Gene rha2 | |
| Gene (Homo sapiens) | akr1c1 | GenBank: Gene ID 1645 | Gene akr1c1 | |
| Gene (Arabidopsis thaliana) | p1-zcr | GenBank: Gene ID 831560 | Gene p1-zcr | |
| Sequence-based reagents | RT-qPCR primers | This paper | (See supplementary file 3) | |
| Sequence-based reagents | Cloning primers | This paper | (See supplementary file 3) | |
| Sequence-based reagents | Gene coding sequences for protein expression | This paper | (See supplementary file 4) | |
| Chemical, compound, drug | 4-HNE | Cayman Chemical: 32100 | 64 mM 4-HNE in absolute ethanol | |
| Antibody | Anti-4-HNE adduct | Abcam: ab46545 | Rabbit IgG polyclonal antibody | (1:200) |
| Antibody | Anti-actin | Abcam: ab8226 | Mouse IgG monoclonal antibody | (1:1000) |
| Antibody | Anti-rabbit secondary antibody | Licor: 926–32211 | Goat IgG monoclonal antibody | (1:8000) |
| Antibody | Anti-mouse secondary antibody | Licor: 926–68072 | Donkey IgG monoclonal antibody | (1:8000) |
| Antibody | Anti-GFP primary antibody | Invitrogen: MA5-15256 | Mouse IgG monoclonal antibody | (1:500) |
| Antibody | Isotype control primary antibody, histology | R and D Systems: AB-105-C | Normal Rabbit IgG | (1:1000) |
| Commercial assay, kit | Ovation Complete Prokaryotic RNA-Seq System | Nugen: 0363–32 | RNA-seq processing kit | |
| Software, algorithm | Rockhopper | cs.wellesley.edu/~btjaden/Rockhopper/ | RNA-seq data analysis software |
Author response table 1
| Organism | Rha1 identity (%) | Rha2 identity (%) |
|---|---|---|
| Pa | 29 | 31 |
| SA | Absent | 32 |
| Ef | 59 | 71 |
| Ec | Absent | 34 |
| Fn | 24 | 33 |
| Bs | 58 | 29 |
Additional files
-
Source data 1
Global gene expression of mid-log L. monocytogenes treated with 640 µM 4-HNE or ethanol control for 20 min.
- https://cdn.elifesciences.org/articles/59295/elife-59295-data1-v2.docx
-
Supplementary file 1
Bacterial strains used in this study.
- https://cdn.elifesciences.org/articles/59295/elife-59295-supp1-v2.xlsx
-
Supplementary file 2
Plasmids used in this study.
- https://cdn.elifesciences.org/articles/59295/elife-59295-supp2-v2.xlsx
-
Supplementary file 3
Primers used in this study.
- https://cdn.elifesciences.org/articles/59295/elife-59295-supp3-v2.xlsx
-
Supplementary file 4
DNA coding sequences used for protein expression and trans complementation in this study.
- https://cdn.elifesciences.org/articles/59295/elife-59295-supp4-v2.xlsx
-
Transparent reporting form
- https://cdn.elifesciences.org/articles/59295/elife-59295-transrepform-v2.pdf
Download links
A two-part list of links to download the article, or parts of the article, in various formats.
Downloads (link to download the article as PDF)
Open citations (links to open the citations from this article in various online reference manager services)
Cite this article (links to download the citations from this article in formats compatible with various reference manager tools)
4-Hydroxy-2-nonenal antimicrobial toxicity is neutralized by an intracellular pathogen
eLife 10:e59295.
https://doi.org/10.7554/eLife.59295


