Alstrom syndrome gene is a stem-cell-specific regulator of centriole duplication in the Drosophila testis
- Life Science Institute, Department of Cell and Developmental Biology, Michigan Medicine, University of Michigan, United States
- Howard Hughes Medical Institute, United States
- Whitehead Institute for Biomedical Research, United States
- Department of Biology, Massachusetts Institute of Technology, United States
Figures
Figure 1 with 3 supplements
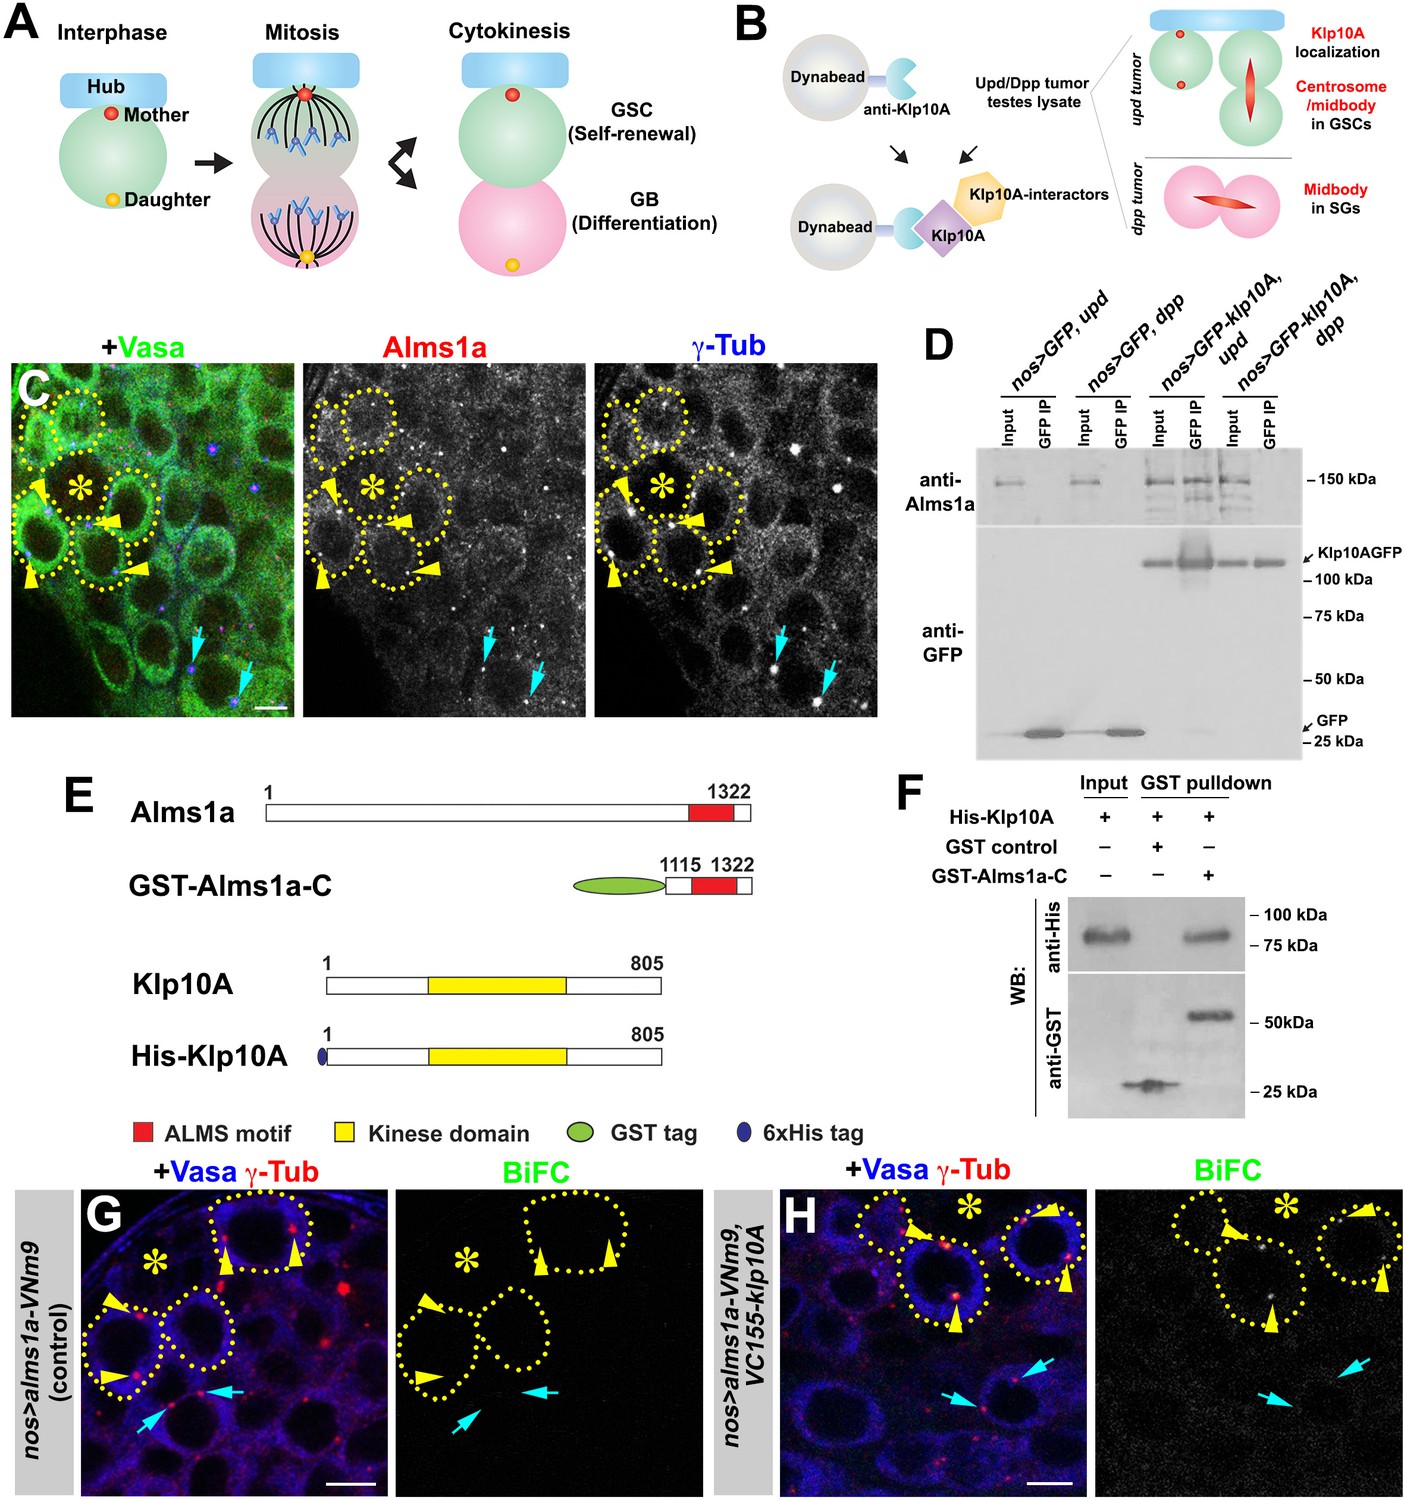
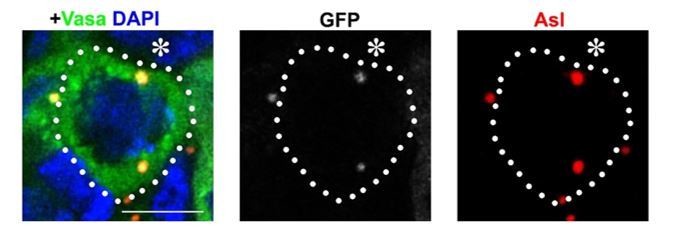
Identification of Alms1a as a germline stem cell (GSC)-specific Klp10A interactor.
(A) Asymmetric centrosome inheritance in Drosophila male GSCs. (B) Scheme of Klp10A pulldown and mass spectrometry. The Klp10A pull down was conducted using either upd-induced tumor (GSC-enriched) or dpp-induced tumor (SG-enriched) extract, followed by mass spectrometry analysis. (C) An apical tip of the Drosophila testis stained for Alms1a (red), γ-Tub (centrosome/pericentriolar matrix, blue) and Vasa (germ cells, green). Asterisk indicates the hub. GSCs are outlined with yellow dotted lines. Arrowheads (yellow) indicate examples of GSC centrosomes. Arrows (cyan) indicate examples of SG centrosomes. Bar: 5 μm. (D) Co-immunoprecipitation of Klp10A and Alms1a. Control GFP and GFP-Klp10A was immunoprecipitated from GSC-enriched extracts (nos-gal4>UAS-upd) using an anti-GFP antibody and blotted with anti-Alms1a and anti-GFP. (E) Schematic of full-length Alms1a, Klp10A and constructs used for GST-pulldown. (F) Direct interaction of Klp10A and Alms1a C-terminal fragment. GST control and recombinant GST-Alms1a-C were immobilized on glutathione agarose beads, incubated with His-Klp10A E. coli lysate, and blotted with anti-GST and anti-His antibody. (G–H) Bimolecular fluorescence complementation (BiFC) analysis of Alms1a-Klp10A interaction. (G) An example of the apical tip in nos-gal4>UAS-alms1a-VNm9 (control) testis, showing no signal. (H) An example of the apical tip in nos-gal4>UAS-alms1a-VNm9, UAS-VC155-klp10A testis, showing signal specifically at GSC centrosomes. Flies are raised at 18°C to minimize ectopic protein expression. Green: BiFC (Venus YFP fluorescence). Red: γ-Tub. Blue: Vasa. Arrowheads (yellow) indicate examples of GSC centrosomes positive for BiFC. Arrows (cyan) indicate examples of SG centrosomes negative for BiFC. Bar: 5 μm.
Figure 1—figure supplement 1
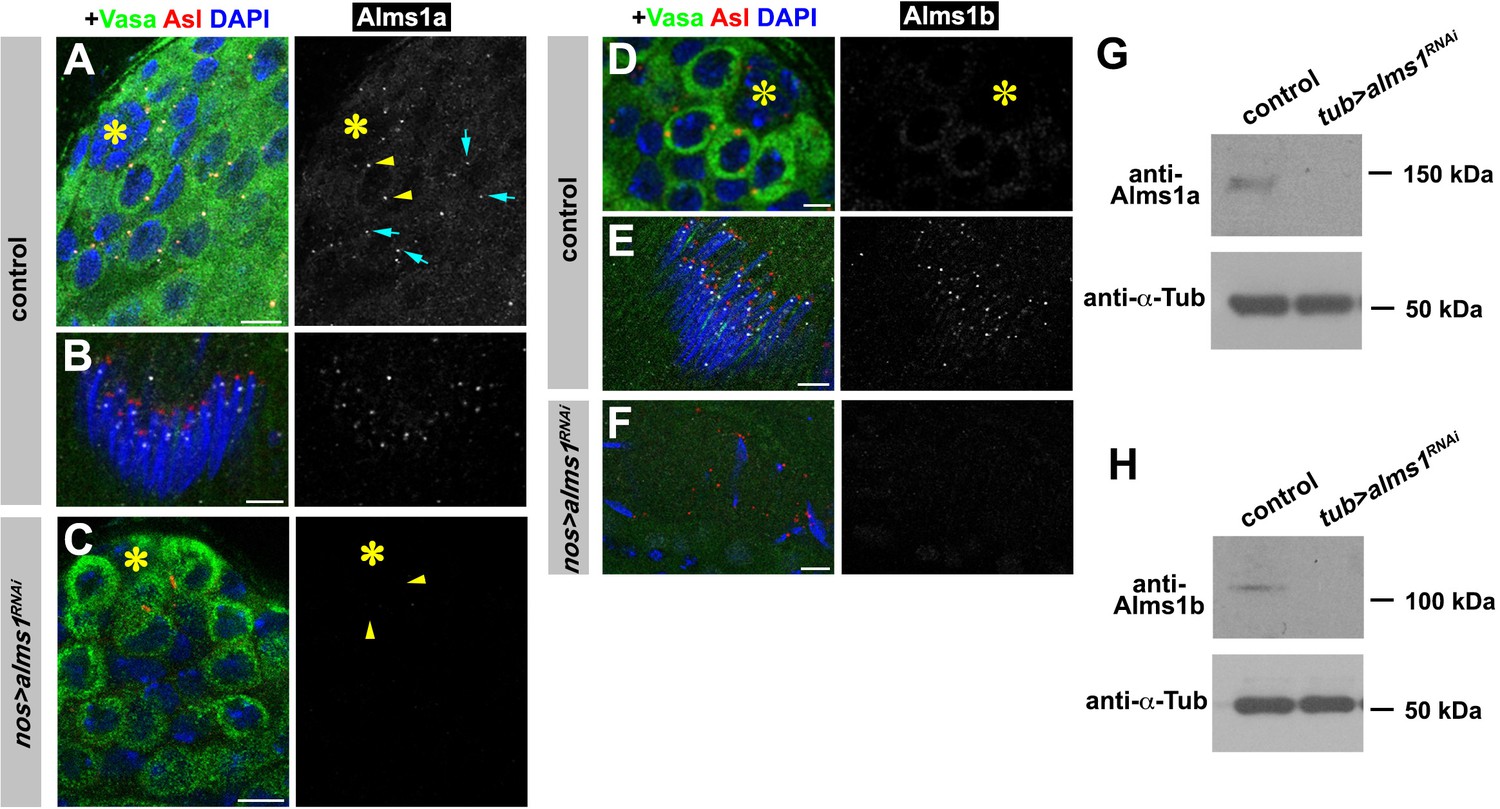
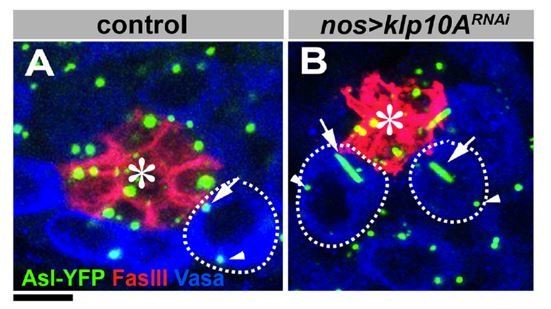
Validation of RNAi-mediated knockdown of alms1 and antibody specificity for Alms1a and Alms1b.
(A–C) Examples of Alms1a staining in control germline stem cells (GSCs) (A), control spermatids (B) and nos-gal4>UAS-alms1RNAi GSCs (C). Green: Vasa. Red: Asl. White: Alms1a. Blue: DAPI. Asterisk indicates the hub. Arrowheads (yellow) indicate GSC centrosomes. Arrows (cyan) indicate SG centrosomes. Bar: 10 μm. (D–F) Examples of Alms1b staining in control (D) GSCs, control (E) spermatids and nos-gal4>UAS-alms1RNAi (F) spermatids. Green: Vasa. Red: Asl. White: Alms1a. Blue: DAPI. Bar: 5 μm. (G–H) Western blot analyses of Alms1a (G) or Alms1b (H) protein in the lysate of either control or tub-gal4>UAS-alms1RNAi testes. α-Tubulin expression was used as a loading control.
Figure 1—figure supplement 2
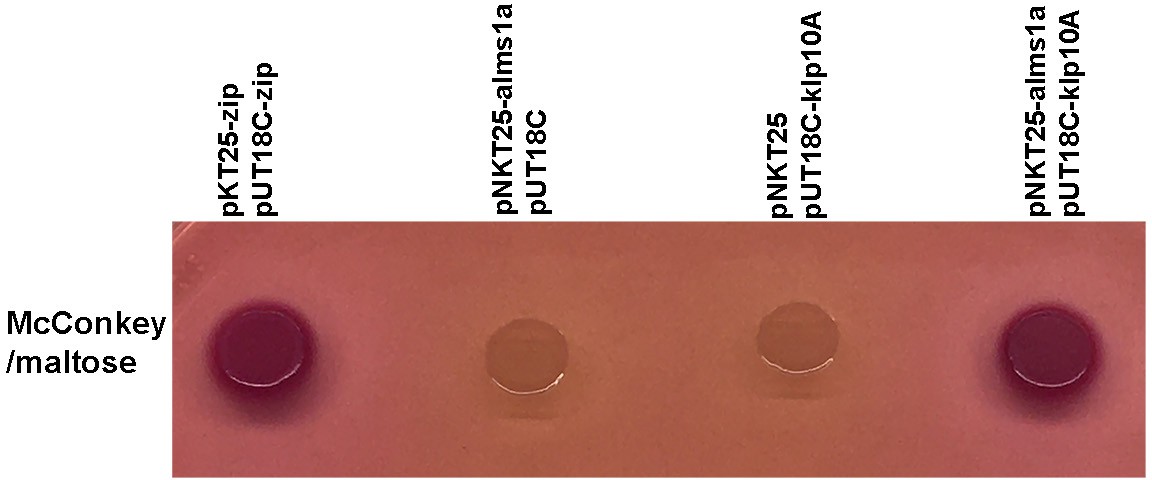
Bacterial two-hybrid assay showing the interaction between full-length Alms1a and full-length Klp10A.
Two recombinant plasmids (pNKT25-alms1a and pUT18C-klp10A) are co-transformed into competent cells. Transformants are plated on MacConkey selective plate. Positive interaction results in red colonies on the selective plates, while colonies will be colorless if no interaction occurs. Co-transformation of pKT25-zip and pUT18C-zip with competent cells was used as a positive control. Co-transformation of pKNT25 or pUT18C with one of the recombinant plasmids served as negative controls.
Figure 1—figure supplement 3
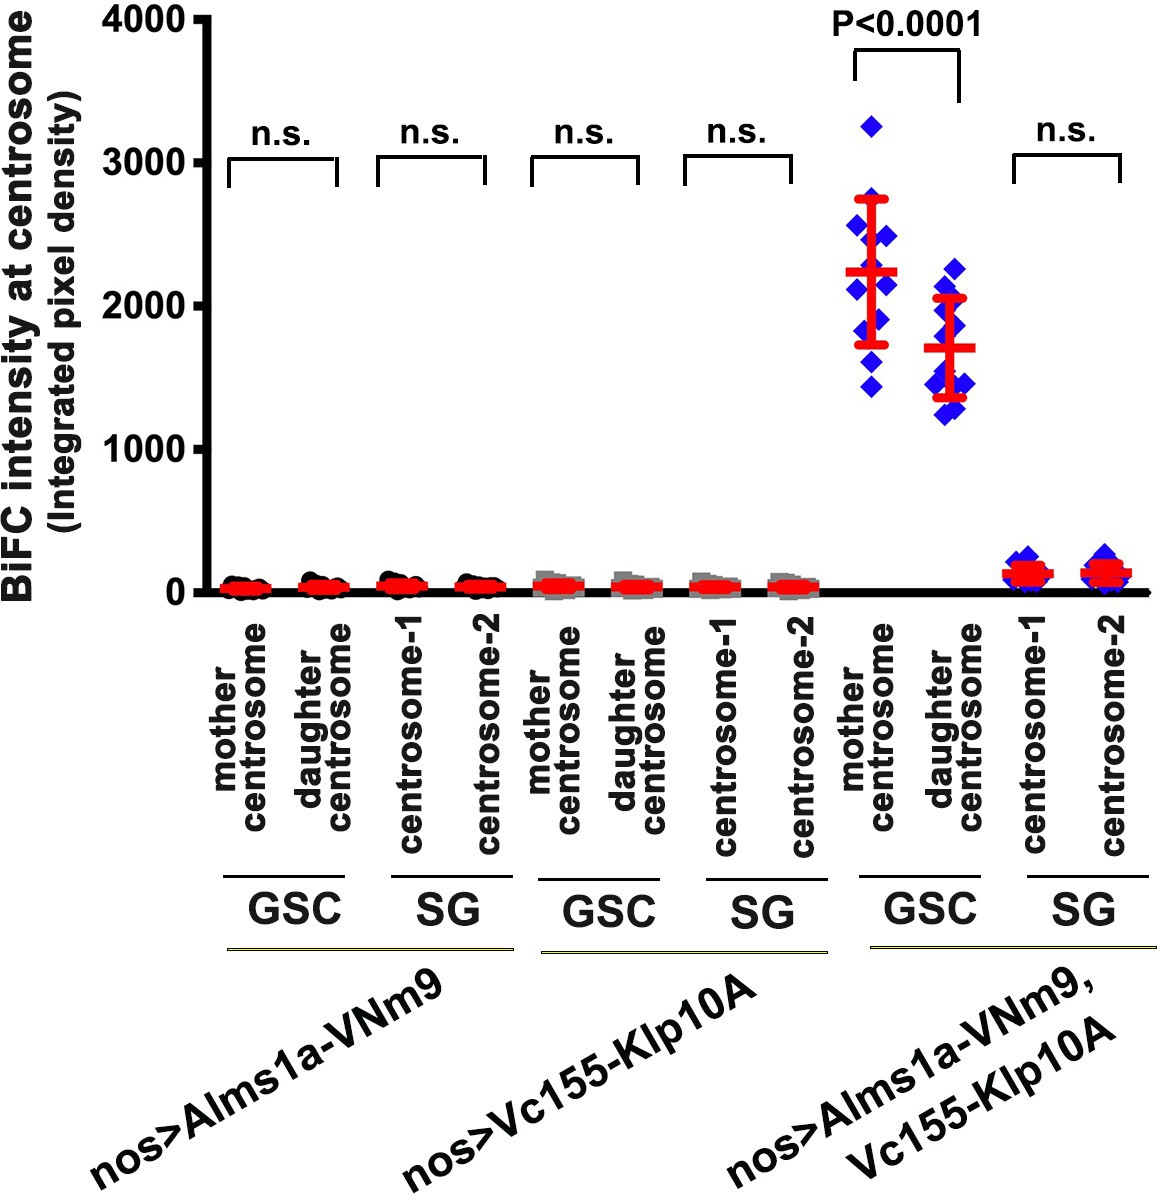
Quantification of BiFC (integrated pixel density) on centrosomes in the indicated genotypes.
p-Value was calculated using two-tailed Student’s t-test. Error bars indicate the standard deviation. GSC/SG numbers for BiFC signals scored in centrosomes n = 12 for each panel.
Figure 2 with 2 supplements
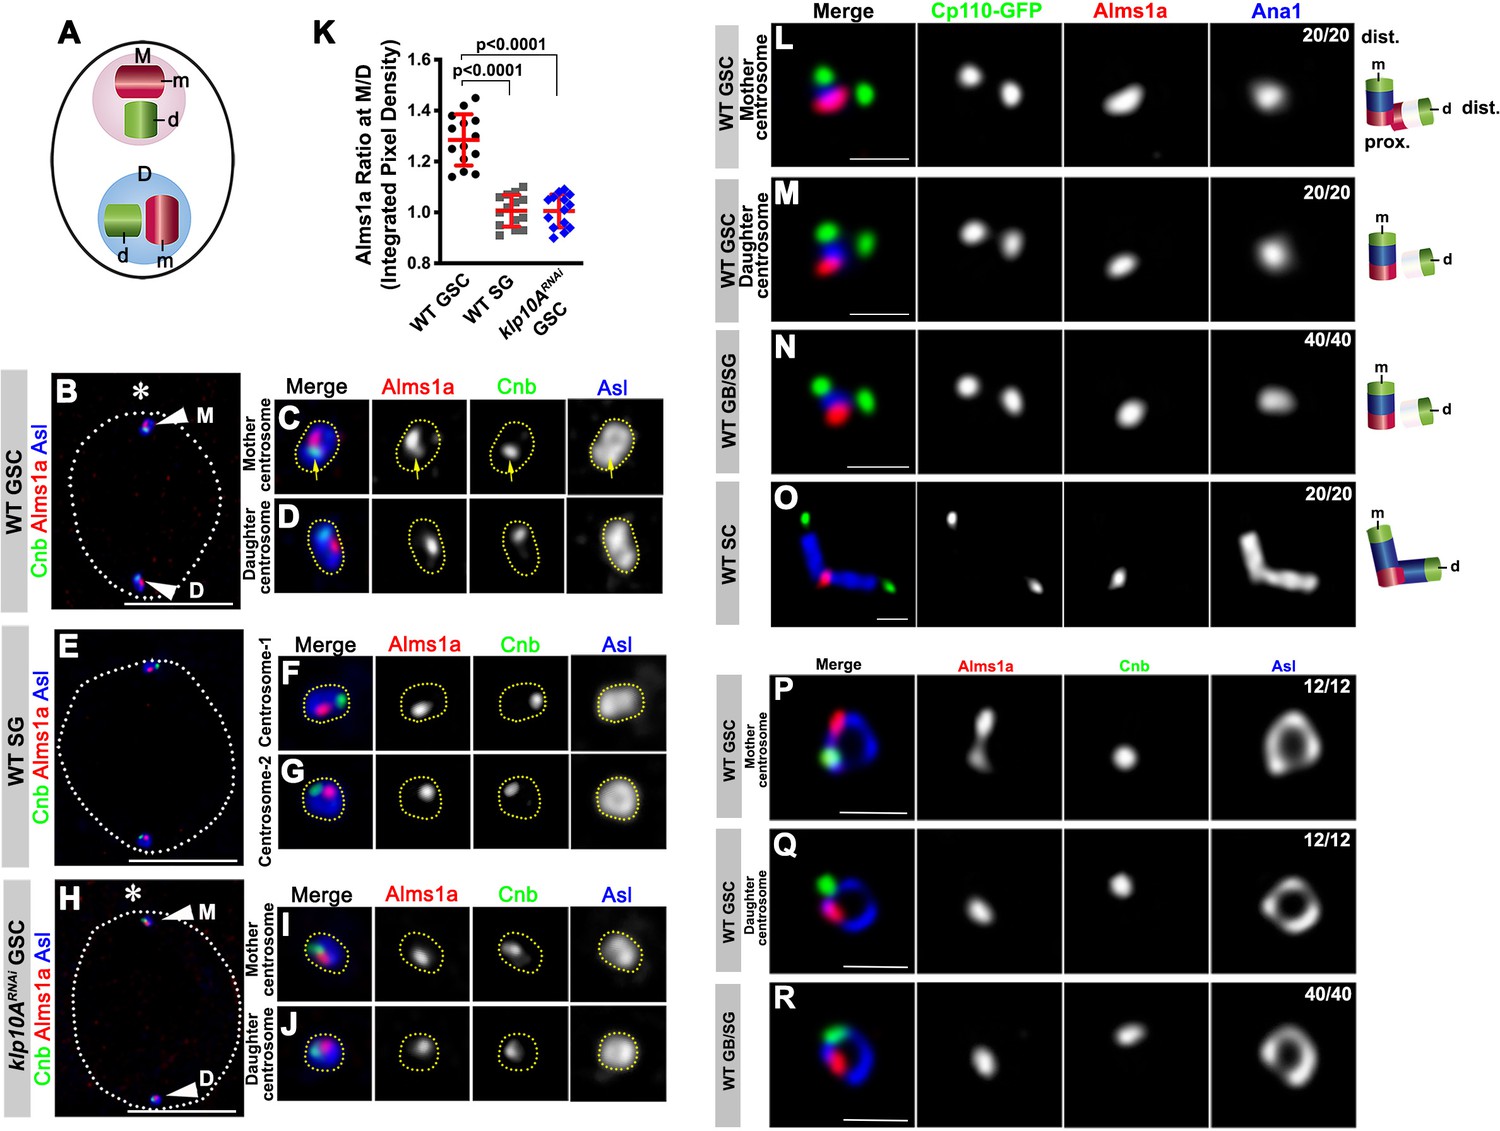
Alms1a exhibits asymmetric localization to the mother centrosome in germline stem cells (GSCs).
(A) Schematic of centrosome structure. Each cell contains two centrosomes, mother centrosome (M, pink) and daughter centrosome (D, blue). Each centrosome consists of two centrioles: mother centriole (m, dark purple) and daughter centriole (d, light purple). (B–D) A HyVolution image of wild-type GSC centrosomes (B). (C–D) Magnified images of a mother centrosome (C) and a daughter centrosome (D) from panel (B). Green: Centrobin (Cnb). Red: Alms1a. Blue: Asl. Asterisk indicates the hub. Arrowheads indicate GSC centrosomes. Arrow indicates mother centrosome. Bar: 5 μm. (E–G) A HyVolution image of wild type SG centrosomes (E). (F–G) Magnified images of SG centrosomes from panel (E). (H–J) A HyVolution image of klp10ARNAi GSC centrosomes (H). (I–J) Magnified images of a mother centrosome (I) and a daughter centrosome (J) from panel (H). (K) Ratio of integrated pixel density of Alms1a signal between mother and daughter centrosomes (M/D) in the indicated genotypes. P value was calculated using two-tailed Student’s t-test. Error bars indicate the standard deviation. 14 cells were scored for each data point. (L–O) Lightning images of a GSC mother centrosome (L), a daughter centrosome (M), a GB/SG centrosome (N) and a SC centrosome (O). Green: Cp110-GFP. Red: Alms1a. Blue: Ana1. Bar: 0.5 μm. Cartoon shows the interpretation of protein localization to the mother and daughter centrioles. (P–R) Stimulated emission depletion (STED) super-resolution images of wild-type GSC mother centrosome (O), a GSC daughter centrosome (P), and a SG centrosome (Q). Red: Alms1a. Blue: Asl. Green: Cnb. Bar: 0.5 μm.
Figure 2—figure supplement 1
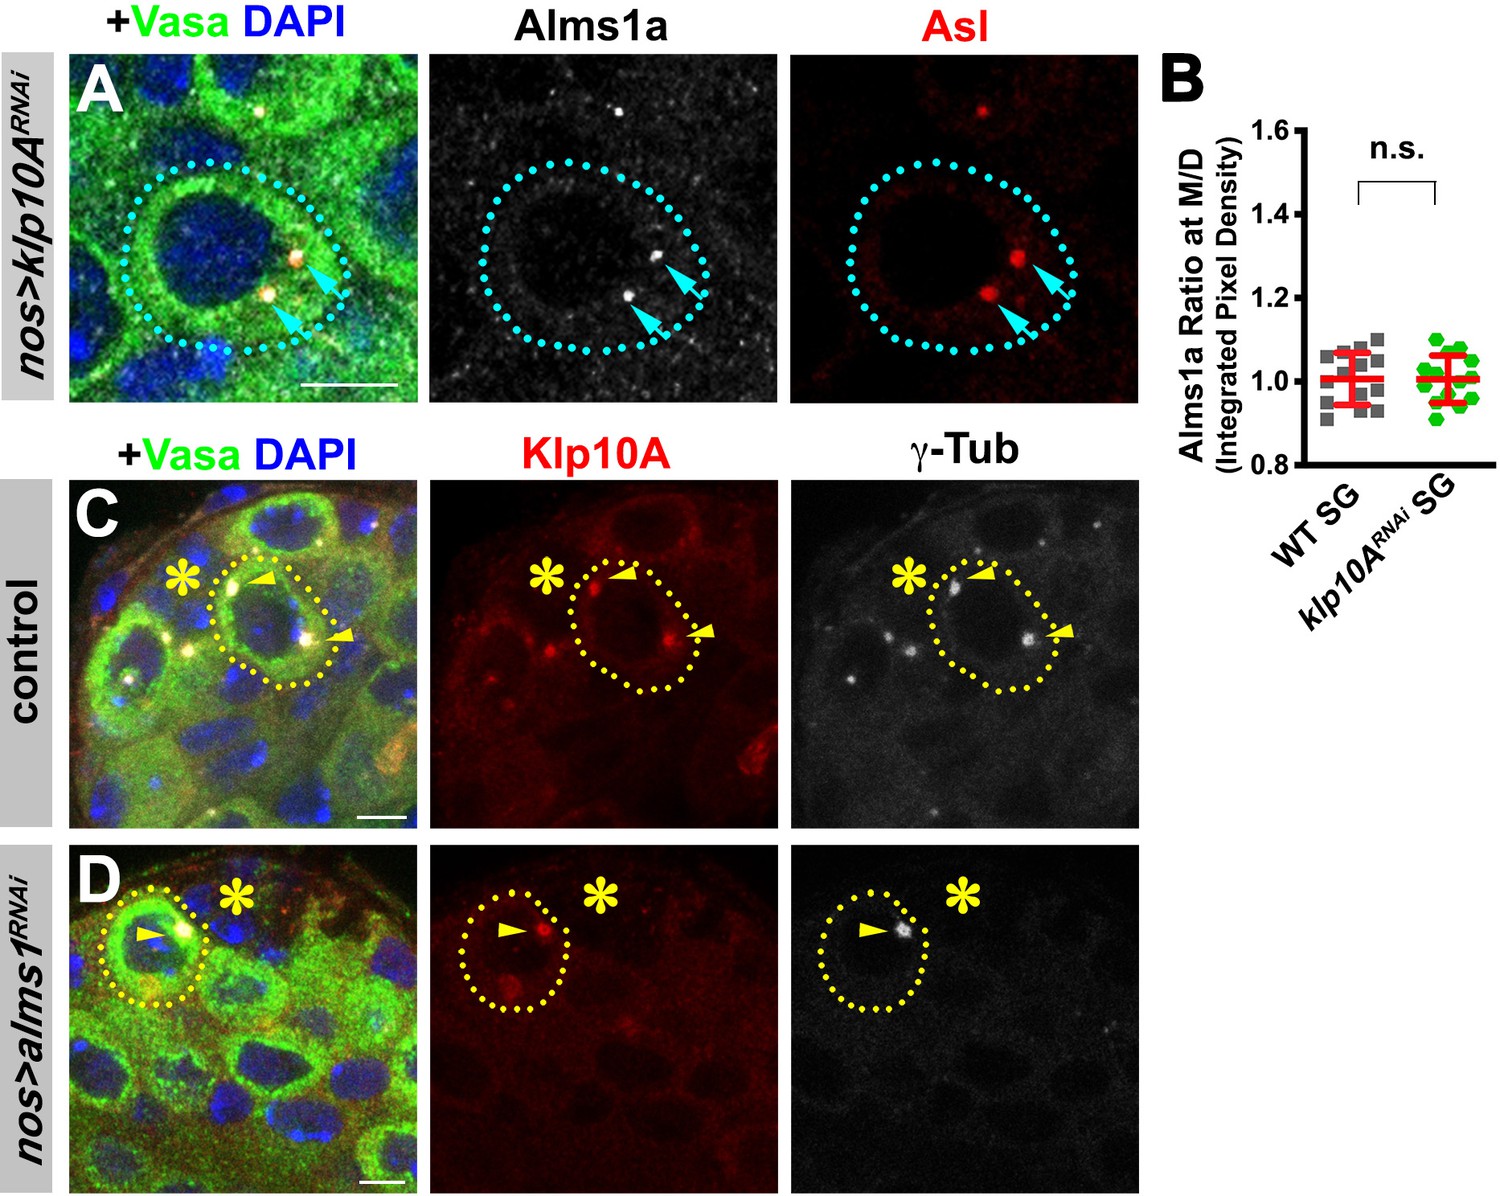
alms1a is not required for Klp10A localization to germline stem cell (GSC) centrosomes.
(A) Localization of Alms1a remains intact in klp10ARNAi SGs. Green: Vasa. Red: Asl. White: Alms1a. Blue: DAPI. Asterisk indicates the hub. SG is indicated by a dotted line. Arrows indicate SG centrosomes. Bar: 5 μm. (B) Ratio of Alms1a signal (integrated pixel density) between mother and daughter centrosomes (M/D) in the indicated genotypes. p-Value was calculated using two-tailed Student’s t-test. Error bars indicate the standard deviation. Twelve cells were scored for Alms1a signals for each data point. (C–D) Localization of Klp10A in control (C) and alms1RNAi (D) GSCs. Green: Vasa. Red: Klp10A. White: γ-Tub. Blue: DAPI. Note that alms1RNAi results in centrosome loss, thus Klp10A localization was assessed on the remaining mother centrosome. Asterisk indicates the hub. Bar: 5 μm.
Figure 2—figure supplement 2
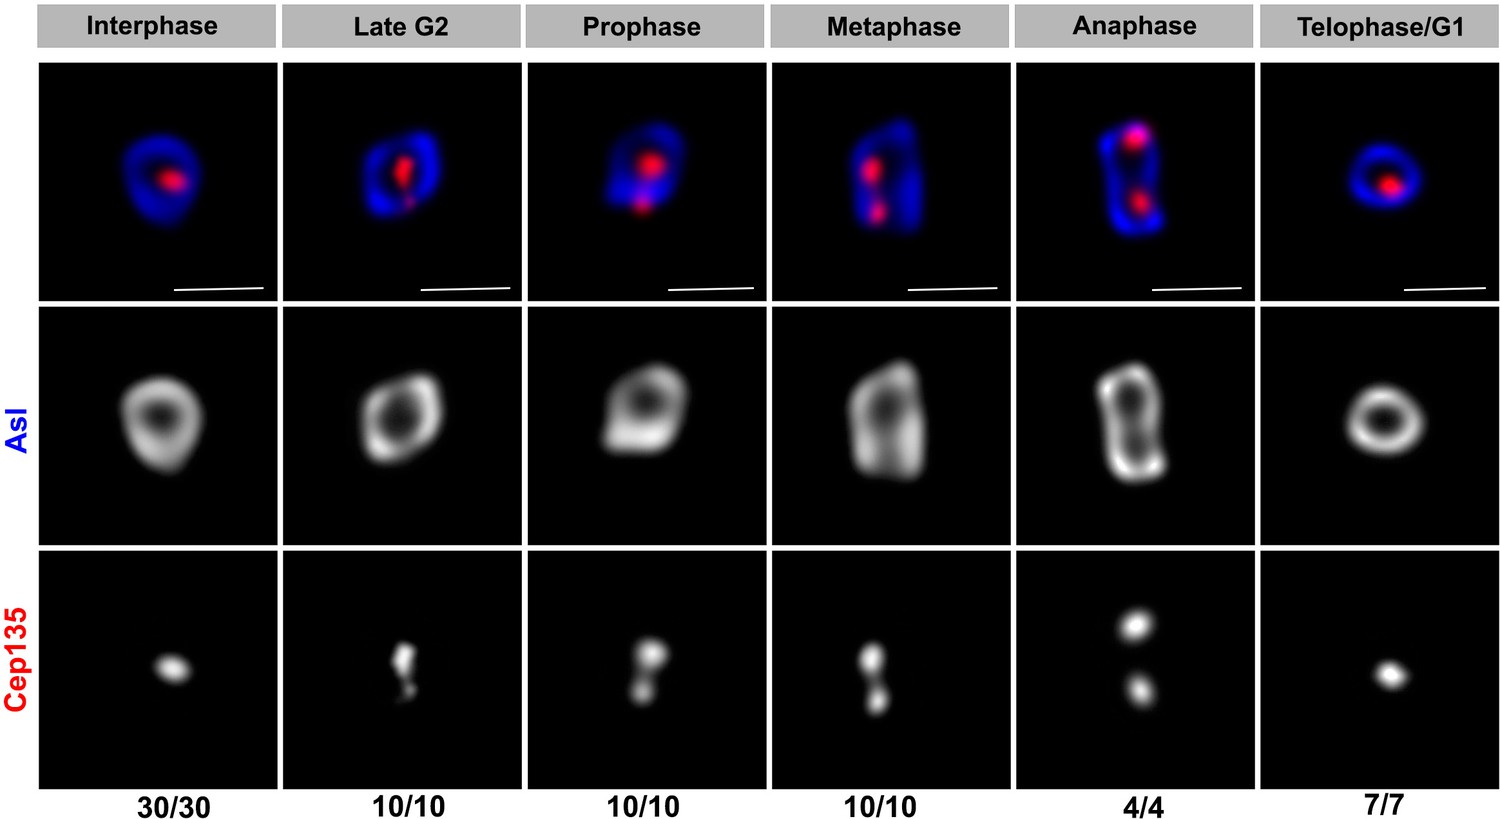
Stimulated emission depletion (STED) super-resolution images of endogenous Asl and Cep135 localization throughout the cell cycle in germline stem cells (GSCs).
Red: Cep135. Blue: Asl. Bar: 0.5 μm. n = GSC centrosomes numbers scored for each panel.
Figure 3 with 3 supplements
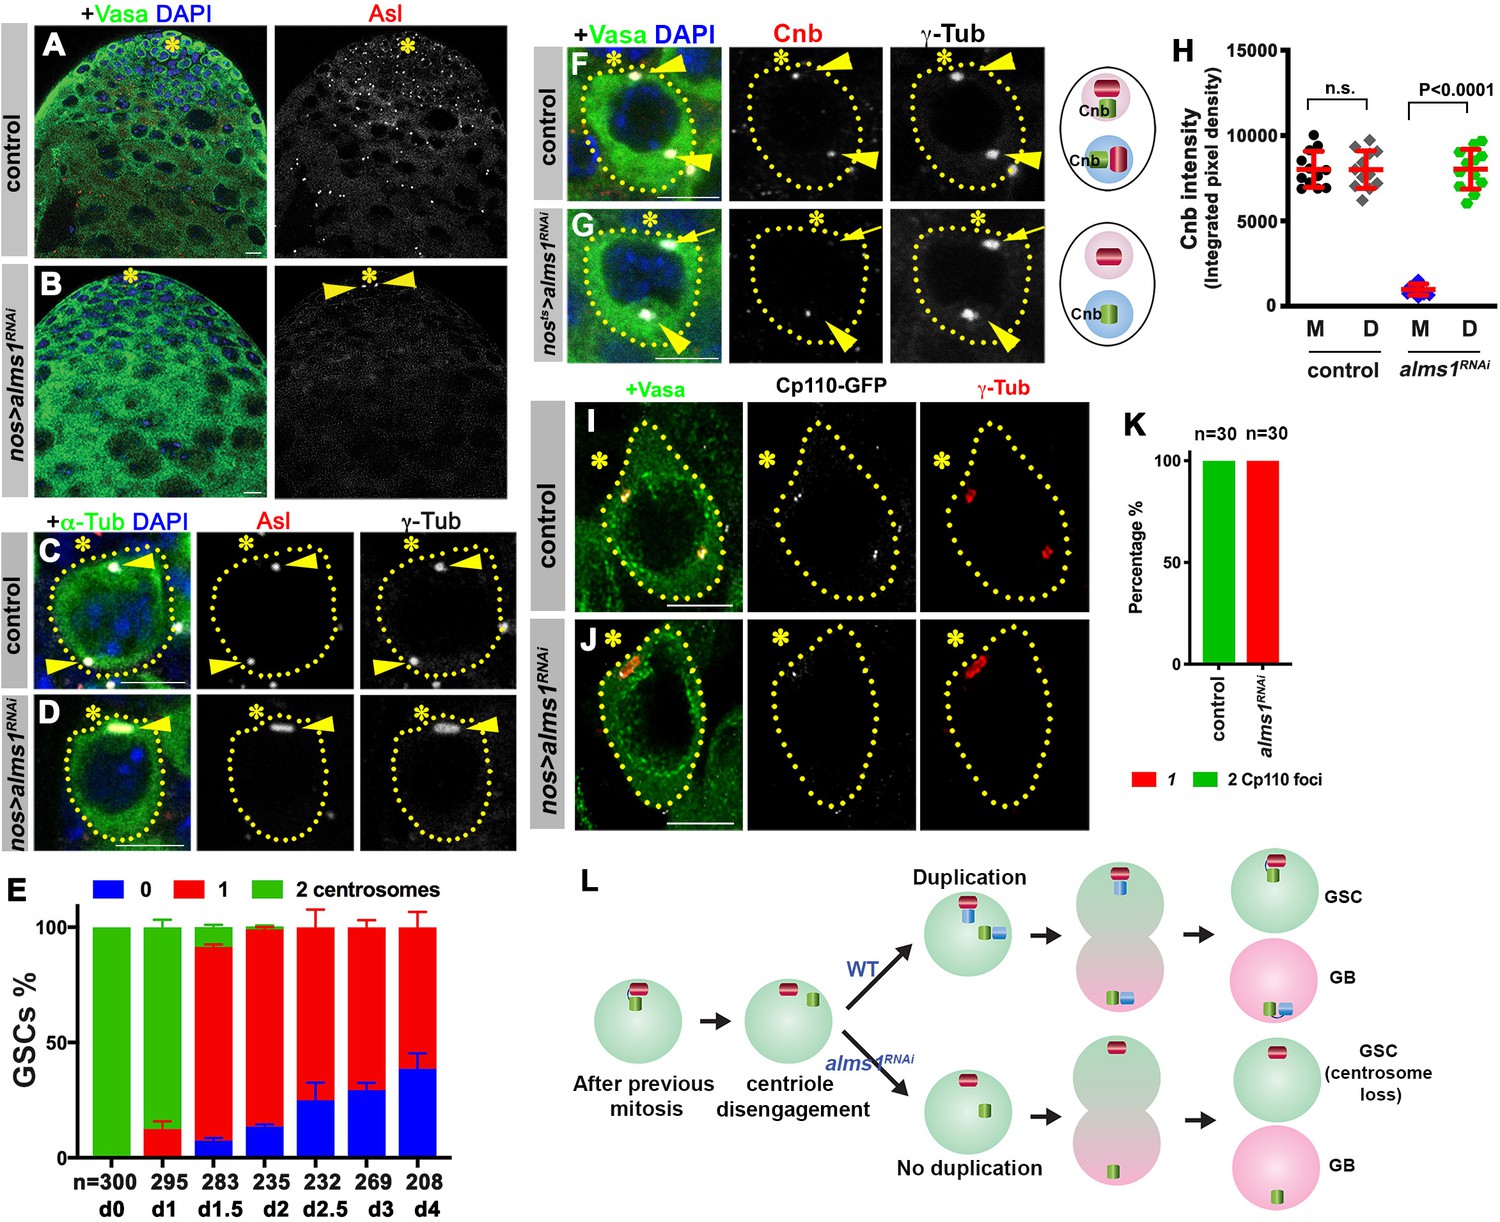
alms1a is required for daughter centriole duplication in germline stem cells (GSCs).
(A–B) Examples of apical tips in control (A) and nos-gal4>UAS-alms1RNAi (B) testes (in this genotype, RNAi is induced since embryogenesis). Green: Vasa. Red: Asl. Blue: DAPI. Asterisk indicates the hub. Arrowheads indicate remaining centrosomes in alms1RNAi GSCs. Bar: 10 μm. (C–D) Examples of centrosomes in control (C) and nos-gal4>UAS-alms1RNAi (D) GSCs. Green: GFP-α-tubulin. Red: Asl. White: γ-Tub. Blue: DAPI. GSCs are outlined with yellow dotted lines. Arrowheads indicate GSC centrosomes. Bar: 5 μm. (E) Quantification of centrosome number in temporarily controlled alms1RNAi GSCs. (0–4 days after RNAi induction, nos-gal4ΔVP16, tub-gal80ts>UAS-alms1RNAi). Centrosome number was quantified by Asl and γ-Tub double staining. Error bars indicate the standard deviation. n = GSC numbers scored for each data point. (F, G) Examples of GSCs in control GSC (F) and alms1RNAi GSC (G, 2 days after RNAi induction, nos-gal4ΔVP16, tub-gal80ts>UAS-alms1RNAi) stained for daughter centriole protein Cnb. Green: Vasa. Red: Cnb. White: γ-Tub. Blue: DAPI. Arrowheads indicate GSC centrosomes. Arrow indicates mother centrosome in alms1RNAi GSC lacking Cnb staining (2 days after RNAi induction). The daughter centrioles are marked by Cnb. Cartoon shows interpretation of centriole composition. The color scheme is the same as Figure 2A. Bar: 5 μm. N = 30 GSCs for each genotype. (H) Quantification of Cnb amount (integrated pixel density) on the mother (M) vs. daughter (D) centrosomes in the indicated genotypes. p-Value was calculated using two-tailed Student’s t-test. Error bars indicate the standard deviation. Twelvecells were scored for each data point. (I, J) Lightning images of GSCs in control (I) and nos-gal4>UAS-alms1RNAi (J) testes. Green: Vasa. Red: Asl. White: Cp110. Asterisk indicates the hub. Bar: 10 μm. (K) Quantification of Cp110 dot number/centrosome in control vs. alms1RNAi GSCs. (L) Model of centrosome loss in alms1RNAi GSCs. Red centriole: the original mother centriole. Green centriole: the original daughter centriole that becomes a mother for the first time after centriole duplication. Blue centriole: the newest daughter centriole generated in the latest cell cycle.
Figure 3—figure supplement 1
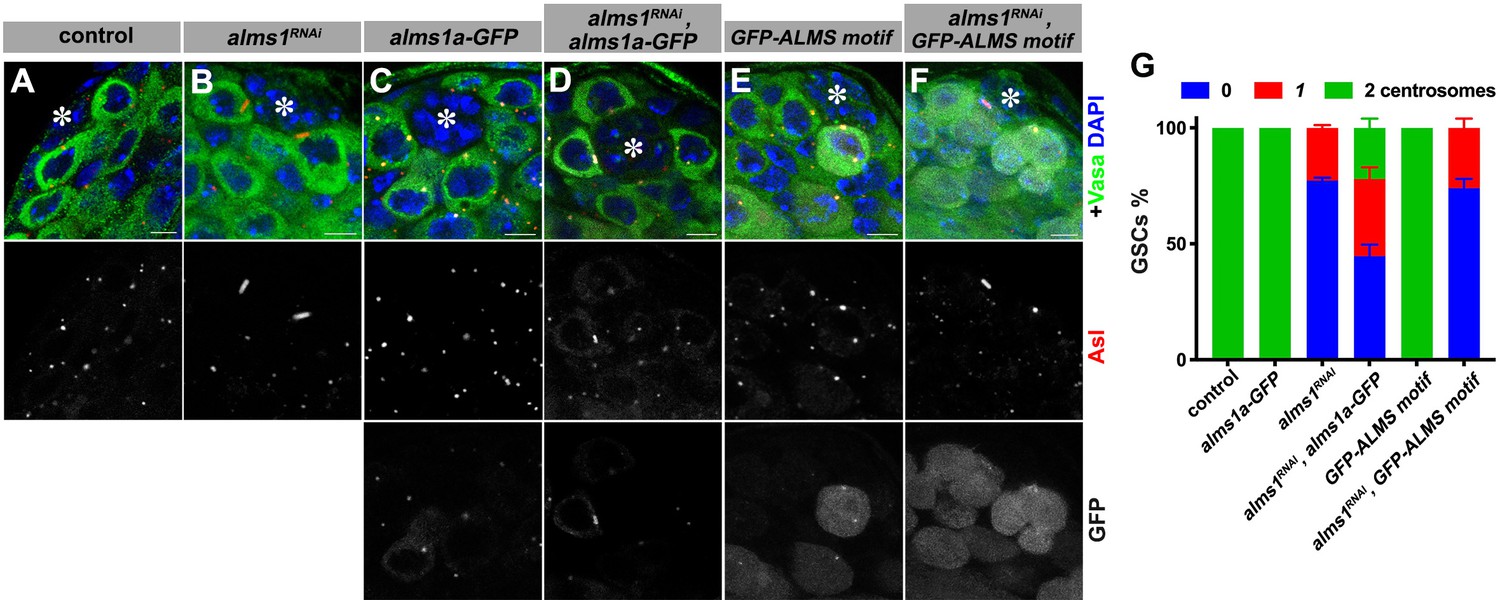
alms1a transgene partially rescues the centrosome loss phenotype in alms1RNAi.
(A–F) Examples of centrosomes in control germline stem cells (GSCs) (A), nos-gal4>UAS-alms1RNAi GSCs (B), nos-gal4>UAS-alms1a-GFP GSCs (C), nos-gal4>alms1a-GFP, UAS-alms1RNAi GSCs (D), nos-gal4>UAS GFP-ALMS motif GSCs (E), nos-gal4>GFP-ALMS motif, UAS-alms1RNAi GSCs (F). Green: Vasa. Red: Asl. White: GFP. Blue: DAPI. Asterisk indicates the hub. Bar: 5 μm. (G) Quantification of centrosome numbers in the indicated genotypes. p-Value was calculated using two-tailed Student’s t-test. Error bars indicate the standard deviation. n = 150 GSCs were scored for each data point.
Figure 3—figure supplement 2
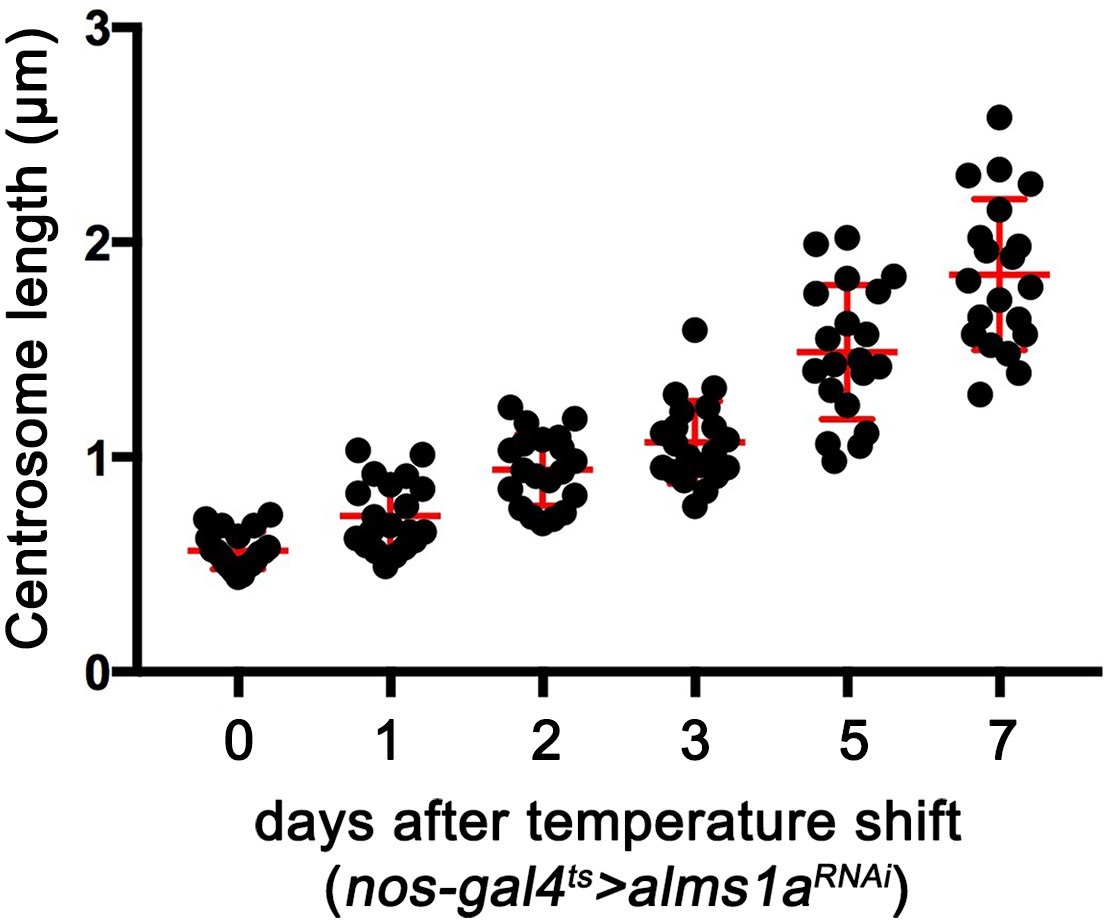
Quantification of germline stem cell (GSC) mother centrosome length after the induction of alms1RNAi.
nos-gal4ΔVP16, tub-gal80ts>UAS-alms1RNAi GSCs were shifted to 29°C to induce RNAi. Centrosome size was examined at 0–7 days after RNAi induction. Error bars indicate the standard deviation. n = 20 GSCs were scored for each data point.
Figure 3—figure supplement 3
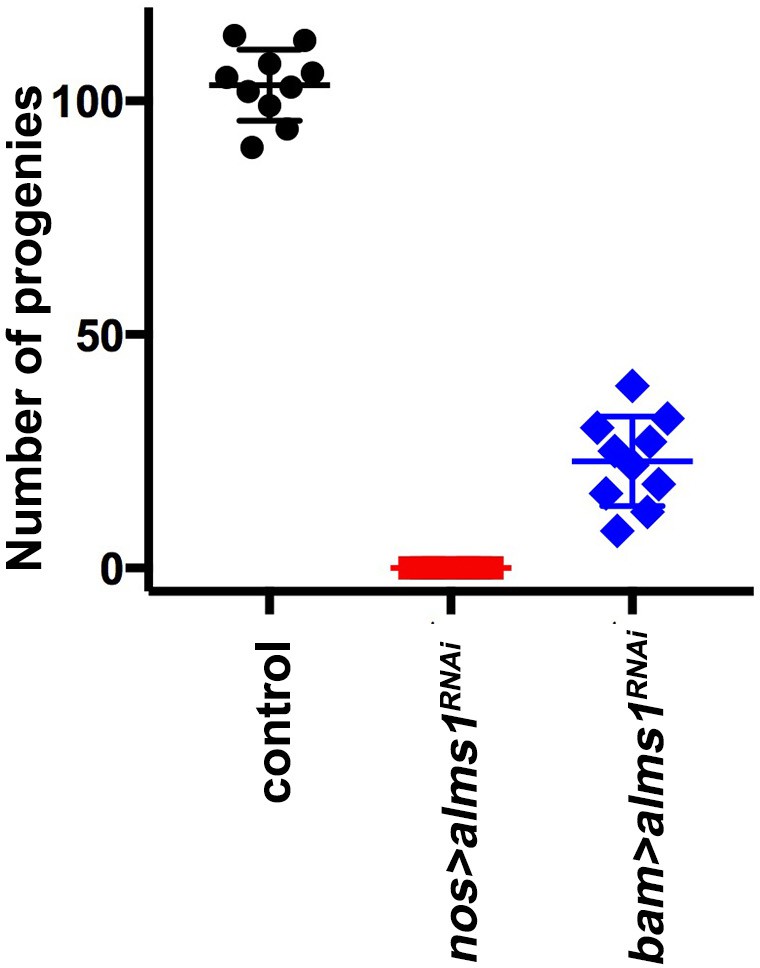
Fertility of control, nos-gal4>UAS-alms1RNAi and bam-gal4>UAS-alms1RNAi males.
Error bars indicate the standard deviation. Ten independent crosses were used for each genotype. Note that the sterility of nos-gal4>UAS-alms1RNAi flies likely reflects the depletion of both alms1a and alms1b. However, the depletion of alms1 (bam-gal4>UAS-alms1RNAi) leads to milder fertility defect, suggesting that centrosome depletion in early germ cells due to alms1a depletion compromises fertility.
Figure 4
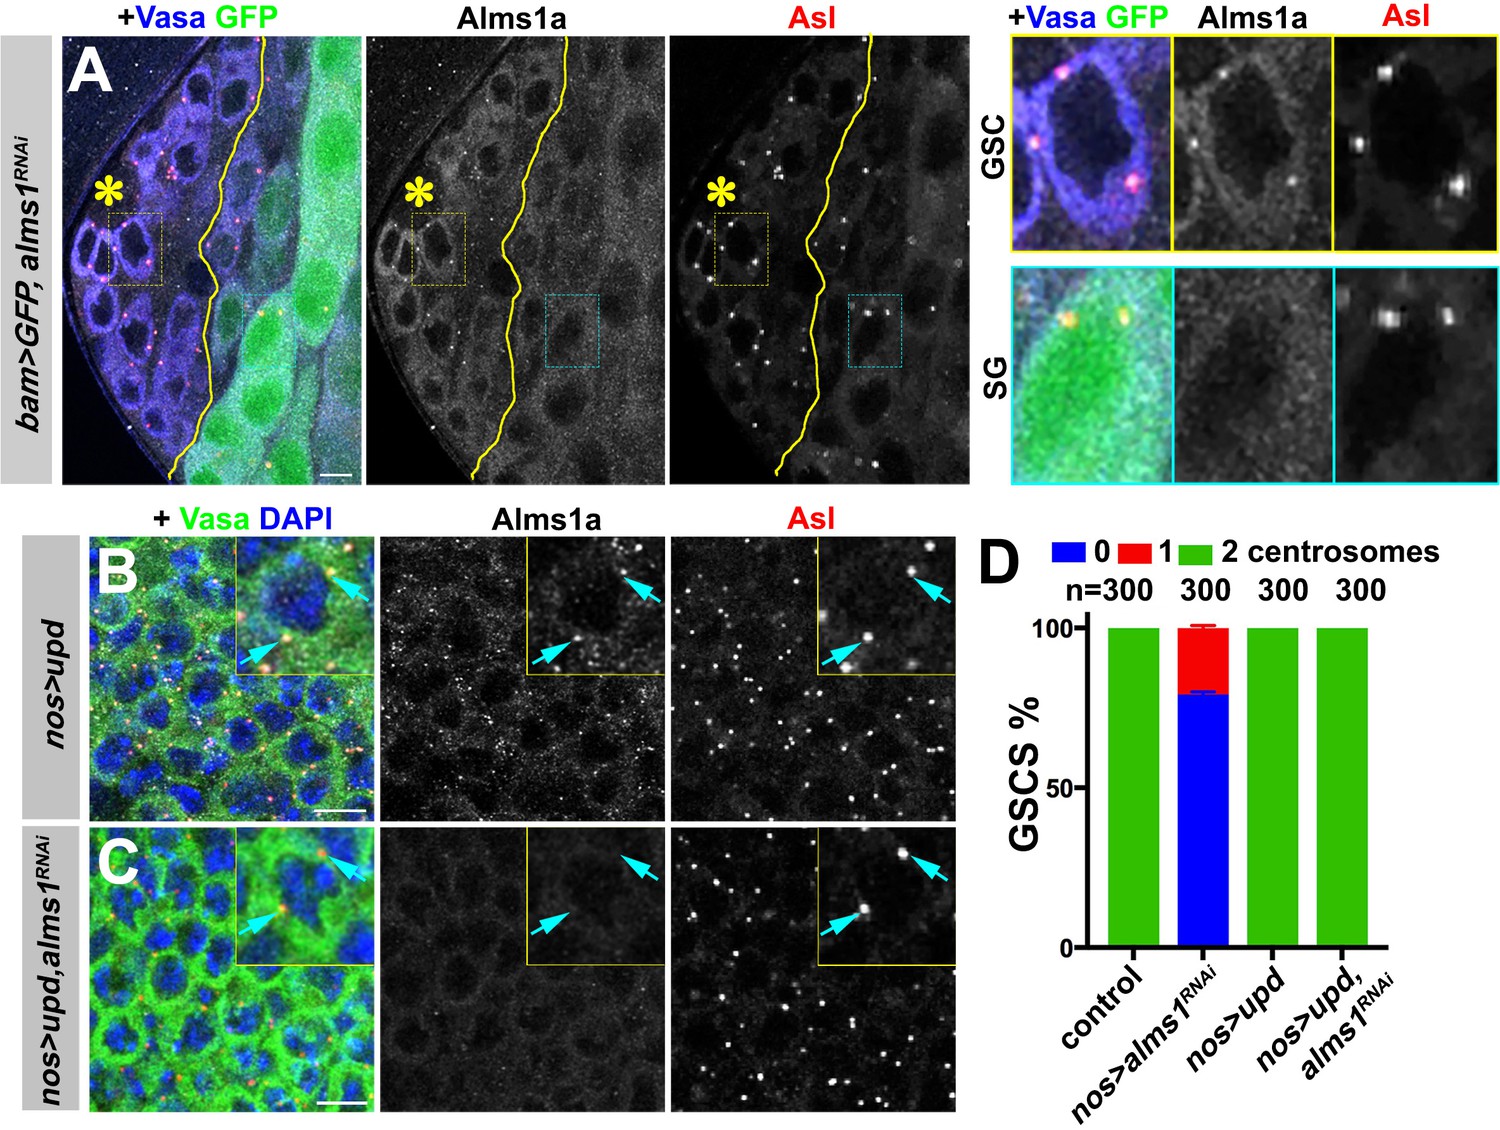
alms1a is dispensable for centrosome duplication in symmetrically dividing cells.
(A) An example of Alms1a staining in bam-gal4>UAS-GFP, UAS-alms1RNAi testis. The boundary of bam-gal4-positive vs. -negative SGs is indicated by the yellow line (note that bam expression marked by GFP is initially weak). Green: GFP. White: Alms1a. Red: Asl. Blue: Vasa. Asterisk indicates the hub. Yellow box inset indicates an example of Alms1a staining in germline stem cell (GSC). Cyan box inset indicates an example of Alms1a staining in SG. Bar: 10 μm. (B–C) Examples of upd-induced GSCs without alms1RNAi (B, nos-gal4>UAS-upd) or with alms1RNAi (C, nos-gal4>UAS-upd, UAS-alms1RNAi). Green: Vasa. Red: Asl. White: Alms1a. Blue: DAPI. Inset is magnified image of a single GSC. Arrows indicate centrosomes. Bar: 10 μm. (D) Quantification of centrosome numbers (quantified by Asl and γ-Tub double staining) in the indicated genotypes. Error bars indicate the standard deviation. n = GSC numbers scored.
Figure 5 with 1 supplement
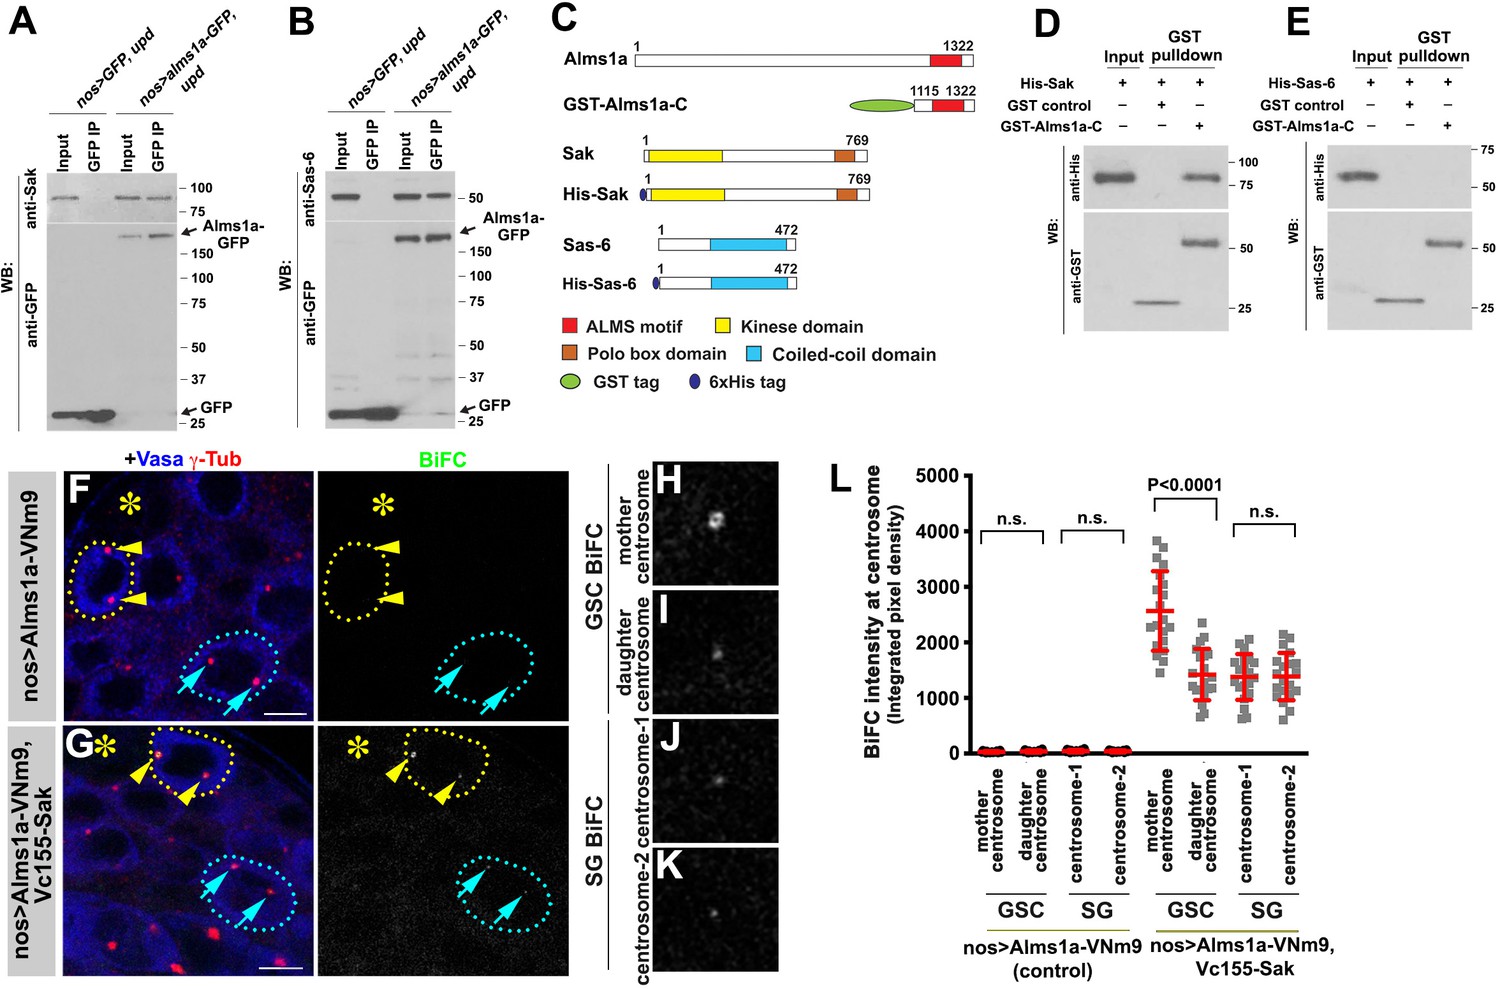
Alms1a interacts with Sak and Sas-6 in germline stem cells (GSCs).
(A) Co-immunoprecipitation of Sak and Alms1a. Control GFP and Alms1a-GFP were immunoprecipitated from GSC-enriched extracts (nos-gal4>UAS-upd) using an anti-GFP antibody and blotted with anti-Sak and anti-GFP. (B) Co-immunoprecipitation of Sas-6 and Alms1a. Control GFP and Alms1a-GFP were immunoprecipitated from GSC-enriched extracts (nos-gal4>UAS-upd) using an anti-GFP antibody and blotted with anti-Sas-6 and anti-GFP. (C–H) BiFC analysis of Alms1a-Sak interaction. (C) Schematic of Alms1a, Sak and Sas-6 and constructs used for in vitro pull-down experiments. (D–E) GST-pulldown of Sak, Sas-6 and Alms1a C-terminal fragment. GST control and recombinant GST-Alms1a-C was immobilized on glutathione agarose beads and incubated with His-Sak (D) or His-Sas-6 (E) lysate for pull-down assay and blotted with anti-GST and anti-His antibody. (F–G) Examples of apical tips in nos-gal4 >UAS-alms1a-VNm9 (control) and nos-gal4>UAS-alms1a-VNm9, UAS-VC155-sak testes. Flies are raised at 18°C to minimize centrosome over-duplication due to ectopic protein expression. (H–K) Magnified images of a GSC mother centrosome (H), a GSC daughter centrosome (I) and two SG centrosomes (J–K) from panel (G). Green: BiFC. Red: γ-Tub. Blue: Vasa. Asterisk indicates the hub. GSCs are outlined with yellow dotted lines. Arrowheads (yellow) indicate examples of GSC centrosomes. Arrows (cyan) indicate examples of SG centrosomes. Bar: 5 μm. (L) Quantification of BiFC integrated pixel density in the indicated genotypes. P value was calculated using two-tailed Student’s t-test. Error bars indicate the standard deviation. Twenty cells were scored for BiFC signals for each data point.
Figure 5—figure supplement 1
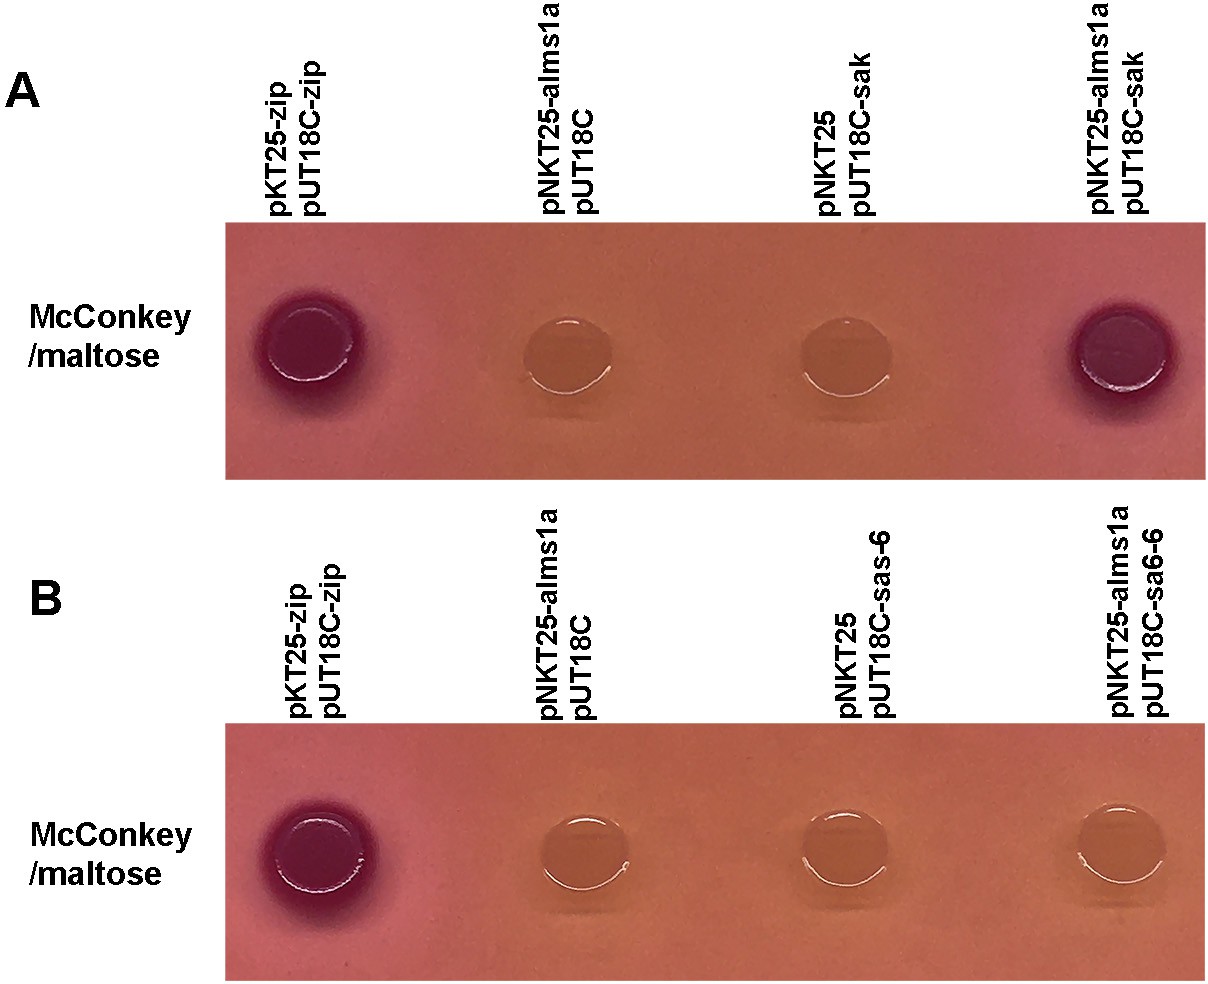
Bacterial two-hybrid assay showing the interactions between full-length Alms1a and full-length Sak or Sas-6.
Recombinant plasmids (pNKT25-alms1a and pUT18C-sak/pUT18C-sas-6) are co-transformed into competent cells. Transformants are plated on MacConkey selective plate. Positive interaction results in red colonies on the selective plates, while colonies will be colorless if no interaction occurs. Co-transformation of pKT25-zip and pUT18C-zip with competent cells was used as a positive control. Co-transformation of pKNT25 or pUT18C with one of the recombinant plasmids served as negative controls.
Figure 6 with 1 supplement
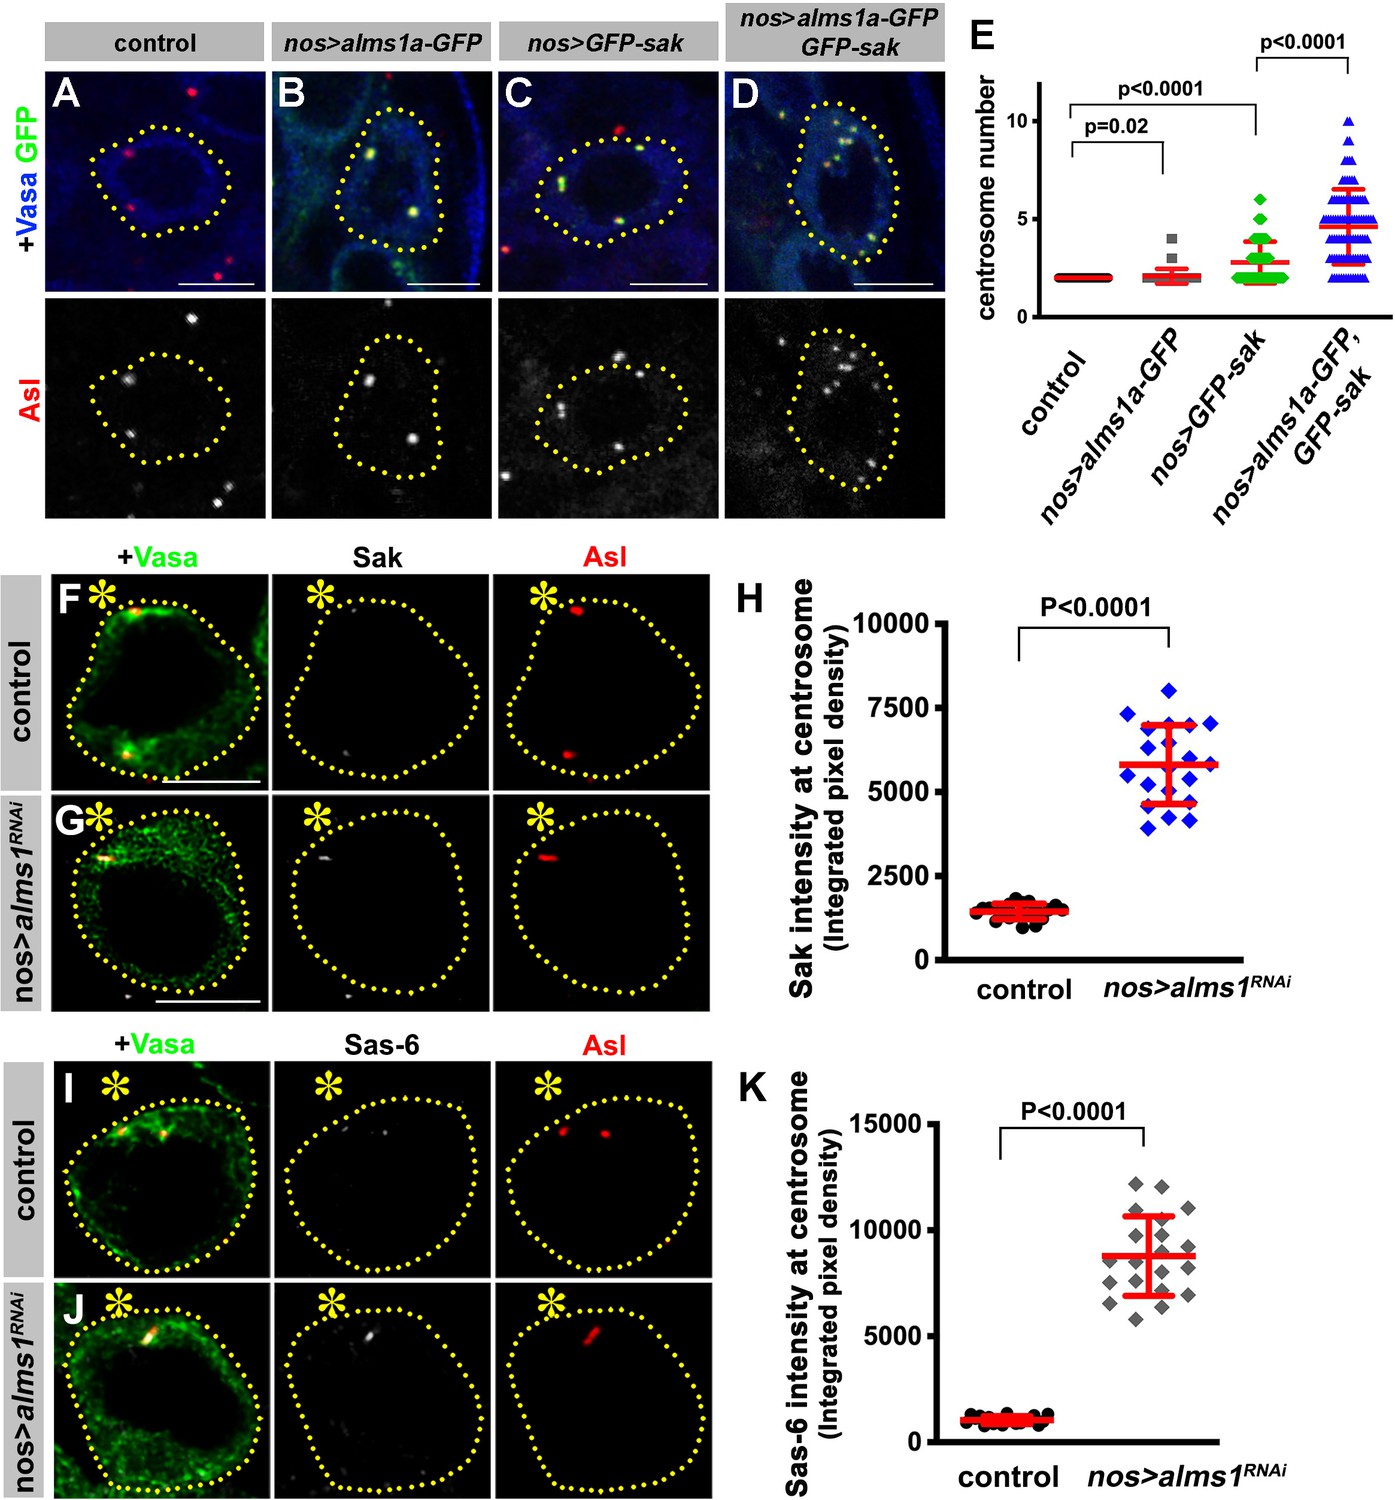
Alms1a promotes centrosome duplication together with Sak.
(A–E) Alms1a overexpression enhances centrosome overduplication induced by Sak overexpression. Examples of germ cells in control (A), nos-gal4>UAS-alms1a-GFP (B), nos-gal4>UAS-GFP-sak (C) and nos-gal4>UAS-alms1a-GFP, UAS-GFP-sak (D). Flies were raised at 25°C to drive a higher level of protein expression. Green: GFP. Red: Asl. Blue: Vasa. Germ cells are outlined with yellow dotted lines. Bar: 5 μm. (E) Quantification of centrosome number (quantified by Asl and γ-Tub double staining) in GSCs/SGs in indicated genotypes. p-Value was calculated using two-tailed Student’s t-test. Error bars indicate the standard deviation. n = 100 cells were scored for each data point. (F–K) Sak and Sas-6 accumulate on the remaining mother centrioles in alms1RNAi GSCs. (F–G) Examples of GSC centrosomes in control (F) and nos-gal4>UAS-alms1RNAi (G) testes stained for Sak (white), Asl (red), and Vasa (green). Asterisk indicates the hub. GSCs are outlined with yellow dotted lines. Bar: 5 μm. (H) Quantification of Sak integrated pixel density in the indicated genotypes. P value was calculated using two-tailed Student’s t-test. Error bars indicate the standard deviation. n = 20 GSCs were scored for Sak signals for each data point. (I–J) Examples of GSC centrosomes in control (I) and nos-gal4>UAS-alms1RNAi (J) testes stained for Sas-6 (white), Asl (red), and Vasa (green). Bar: 5 μm. (K) Quantification of Sas-6 integrated pixel density in the indicated genotypes. P value was calculated using two-tailed Student’s t-test. Error bars indicate the standard deviation. n = 20 GSCs were scored for Sas-6 signals for each data point.
Figure 6—figure supplement 1
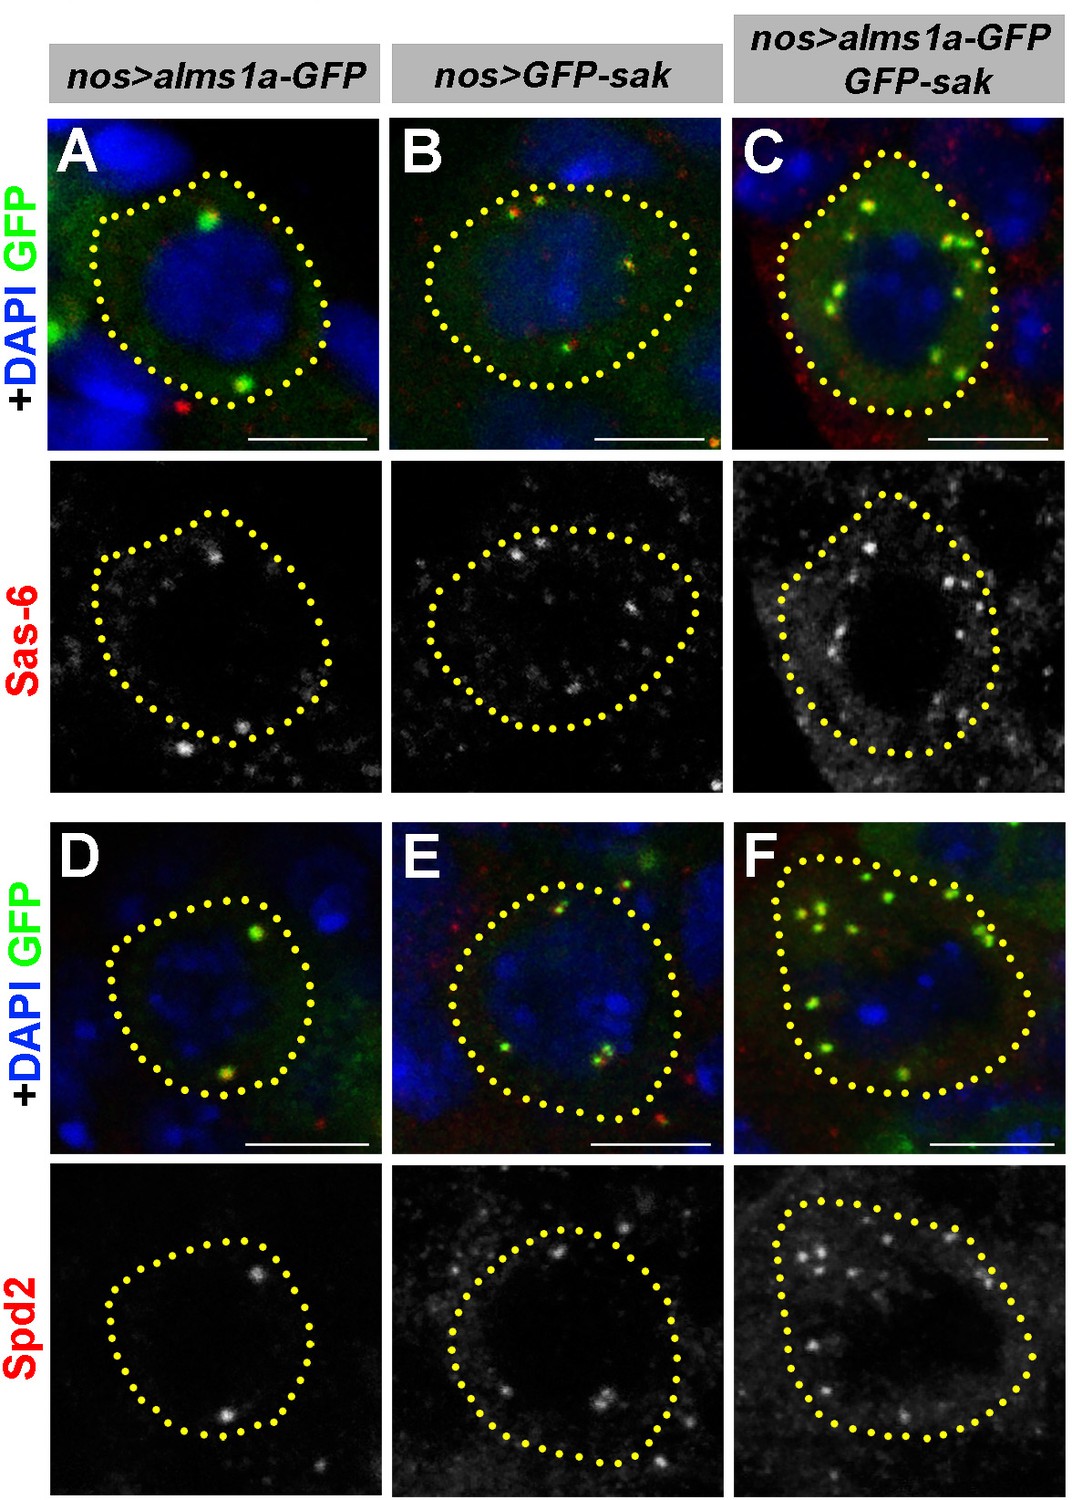
Alms1a overexpression enhances centrosome overduplication induced by Sak overexpression.
(A–C) Examples of Sas-6 staining in nos-gal4>UAS-alms1a-GFP (A), nos-gal4>UAS-GFP-sak (B) and nos-gal4>UAS-alms1a-GFP, UAS-GFP-sak (C) germ cells. Flies were raised at 25°C to drive a higher level of protein expression. Green: GFP. Red: Sas-6. Blue: DAPI. (D–F) Examples of in nos-gal4>UAS-alms1a-GFP (D), nos-gal4>UAS-GFP-sak (E) and nos-gal4>UAS-alms1a-GFP, UAS-GFP-sak (F) germ cells. Flies were raised at 25°C to drive a higher level of protein expression. Green: GFP. Red: Spd2. Blue: DAPI. Germ cells are outlined with yellow dotted lines. Bar: 5 μm.
Author response image 1
Author response image 2
Tables
Key resources table
| Reagent type (species) or resource | Designation | Source or reference | Identifiers | Additional information |
|---|---|---|---|---|
| Strain, strain background (D. melanogaster) | nos-gal4 | PMID:9501989 | ||
| Strain, strain background (D. melanogaster) | bam-gal4 | PMID:12571107 | ||
| Strain, strain background (D. melanogaster) | tub-gal4 | Bloomington Stock Center | ID_BSC: 5138 | |
| Strain, strain background (D. melanogaster) | UAS-upd | PMID:10346822 | ||
| Strain, strain background (D. melanogaster) | tub-gal80ts | PMID:14657498 | ||
| Strain, strain background (D. melanogaster) | nos-gal4 without VP16 (nos-gal4ΔVP16) | PMID:26131929 | ||
| Strain, strain background (D. melanogaster) | UAS-EGFP | Bloomington Stock Center | ID_BSC: 5430 | |
| Strain, strain background (D. melanogaster) | UAS-dpp | Bloomington Stock Center | ID_BSC: 1486 | |
| Strain, strain background (D. melanogaster) | yw | Bloomington Stock Center | ID_BSC: 189 | |
| Strain, strain background (D. melanogaster) | UAS-GFP-alpha-tubulin84B | Bloomington Stock Center | ID_BSC: 7373 | |
| Strain, strain background (D. melanogaster) | UAS-klp10ARNAi | Bloomington Stock Center | ID_BSC: 33963 | |
| Strain, strain background (D. melanogaster) | UAS-klp10A-EGFP | PMID:26131929 | ||
| Strain, strain background (D. melanogaster) | centrobin-YFP | PMID:21407209 | ||
| Strain, strain background (D. melanogaster) | ubi-asl-tdTomato | PMID:21694707 | ||
| Strain, strain background (D. melanogaster) | ubi-ana1-tdTomato | PMID:18854586 | ||
| Strain, strain background (D. melanogaster) | ubi-Cp110-GFP | PMID:27185836 | ||
| Strain, strain background (D. melanogaster) | UAS-alms1RNAi | Bloomington Stock Center | ID_BSC: 63721 | |
| Strain, strain background (D. melanogaster) | UAS-alms1a-EGFP | This study | ||
| Strain, strain background (D. melanogaster) | UAS-alms1a-EGFP (insensitive to RNAi) | This study | ||
| Strain, strain background (D. melanogaster) | UAS-alms1a-VNm9 | This study | ||
| Strain, strain background (D. melanogaster) | UAS-VC155-klp10A | This study | ||
| Strain, strain background (D. melanogaster) | UAS-VC155-sak | This study | ||
| Strain, strain background (D. melanogaster) | UAS-EGFP-ALMS motif | This study | ||
| Strain, strain background (D. melanogaster) | cep135-EGFP | Bloomington Stock Center | ID_BSC: 60183 | |
| Antibody | Anti-vasa (Rabbit polyclonal) | Santa Cruz Biotechnology | ID_SCB: d-26 | IF: 1:200 |
| Antibody | Anti-alpha-Tubulin (Mouse monoclonal) | Developmental Studies Hybridoma Bank | WB: 1:2000 | |
| Antibody | Anti-vasa (Rat monoclonal) | Developmental Studies Hybridoma Bank | IF: 1:20 | |
| Antibody | Anti-gamma-Tubulin (Mouse monoclonal) | Sigma-Aldrich | ID_Sigma:T6557 | IF: 1:100 |
| Antibody | Anti-Asl (Rabbit polyclonal) | A gift from Jordan Raff | IF: 1:5000 | |
| Antibody | Anti-Sas-6 (Rabbit polyclonal) | A gift from Jordan Raff | IF: 1:5000 WB: 1:40000 | |
| Antibody | Anti-Sak (Rabbit polyclonal) | A gift from Monica Bettencourt-Dias | IF: 1:400 WB: 1:4000 | |
| Antibody | Anti-Spd2 (Rabbit polyclonal) | A gift from Maurizio Gatti | IF: 1:25 | |
| Antibody | Anti-GFP (Chick monoclonal) | Aves Labs | ID_aves: GFP-1020 | WB: 1:6000 |
| Antibody | Anti-GST (Mouse monoclonal) | Biolegend | WB: 1:4000 | |
| Antibody | Anti-His (Mouse monoclonal) | Millipore-Sigma | WB: 1:4000 | |
| Antibody | Anti-Alms1a (Guinea pig polyclonal) | This study | IF: 1:4000 WB: 1:40000 | |
| Antibody | Anti-Alms1b (Guinea pig polyclonal) | This study | IF: 1:4000 | |
| Antibody | Anti-Centrobin (Rabbit polyclonal) | This study | IF: 1:4000 | |
| Recombinant DNA reagent | pGEX-4T-LP (plasmid) | Addgene | ||
| Recombinant DNA reagent | pMCSG7 (plasmid) | Addgene | ||
| Recombinant DNA reagent | pGEX-alms1a-C (plasmid) | This study | ||
| Recombinant DNA reagent | pMCSG7-klp10A (plasmid) | This study | ||
| Recombinant DNA reagent | pMCSG7-sak (plasmid) | This study | ||
| Recombinant DNA reagent | pMCSG7-sas-6 (plasmid) | This study | ||
| Recombinant DNA reagent | pKNT-25 (plasmid) | Euromedex | ||
| Recombinant DNA reagent | pUT18C (plasmid) | Euromedex | ||
| Recombinant DNA reagent | pKT25-zip (plasmid) | Euromedex | ||
| Recombinant DNA reagent | pUT18C-zip (plasmid) | Euromedex | ||
| Recombinant DNA reagent | pKNT-alms1a (plasmid) | This study | ||
| Recombinant DNA reagent | pUT-klp10A (plasmid) | This study | ||
| Recombinant DNA reagent | pUT-sak (plasmid) | This study | ||
| Recombinant DNA reagent | pUT-sas-6 (plasmid) | This study |
Additional files
-
Supplementary file 1
List of Klp10A-interaction proteins enriched in GSCs identified by mass spectrometry.
- https://cdn.elifesciences.org/articles/59368/elife-59368-supp1-v2.xlsx
-
Transparent reporting form
- https://cdn.elifesciences.org/articles/59368/elife-59368-transrepform-v2.pdf
Download links
A two-part list of links to download the article, or parts of the article, in various formats.
Downloads (link to download the article as PDF)
Open citations (links to open the citations from this article in various online reference manager services)
Cite this article (links to download the citations from this article in formats compatible with various reference manager tools)
Alstrom syndrome gene is a stem-cell-specific regulator of centriole duplication in the Drosophila testis
eLife 9:e59368.
https://doi.org/10.7554/eLife.59368


