Drosophila serotonin 2A receptor signaling coordinates central metabolic processes to modulate aging in response to nutrient choice
- Department of Molecular and Integrative Physiology and Geriatrics Center, Biomedical Sciences and Research Building, University of Michigan, United States
- College of Literature, Science, and the Arts, University of Michigan, United States
- Department of Lab Medicine & Pathology, University of Washington School of Medicine, United States
- Department of Biology, University of Washington, United States
Figures
Figure 1 with 3 supplements
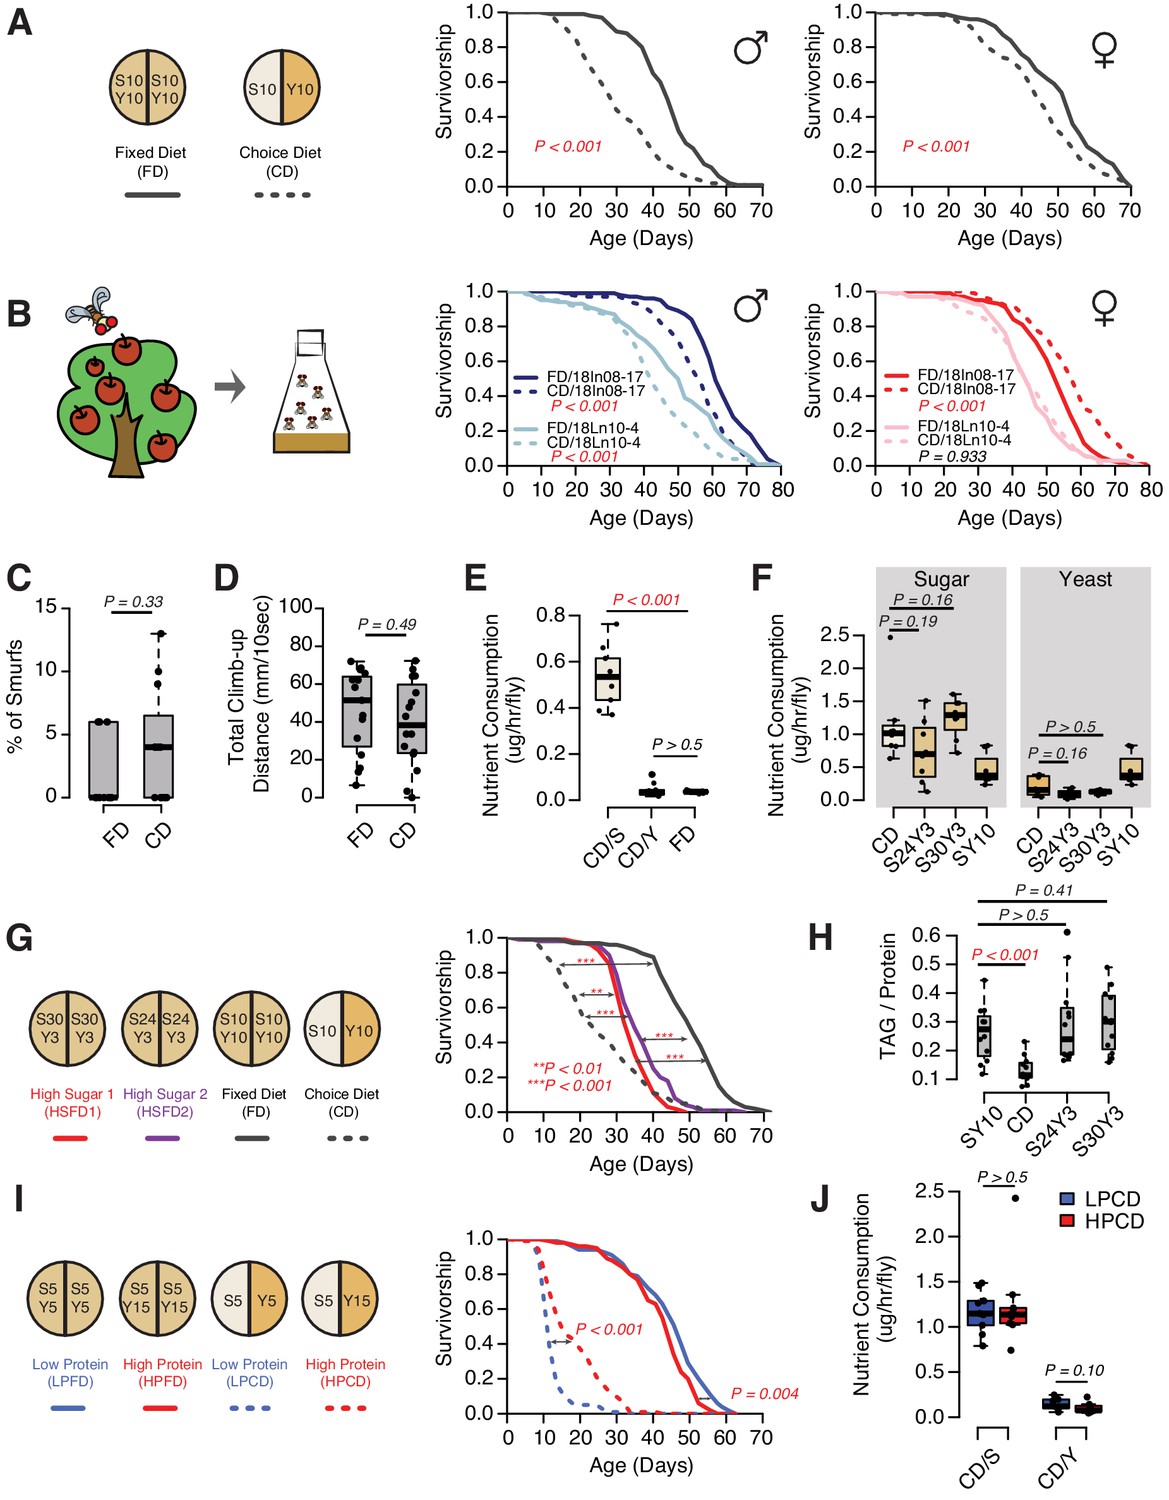
The presentation of nutrients significantly affects lifespan independent of the consumption of each nutrient in Drosophila.
(A) Separating macronutrients in diet is sufficient to modulate aging. The left panel illustrates the two-well food containers for presenting either a fixed diet (FD, 10% [w/v] sugar and 10% [w/v] yeast mixed together) or a choice diet (CD, 10% [w/v] sugar and 10% [w/v] yeast presented on different sides). The right panel shows that both Canton-S males and females fed on the choice diet have shorter lifespans relative to their siblings that fed on the fixed diet (N = 104–112 per group). (B) Dietary effects are presented in two Drosophila melanogaster strains that were recently collected from the wild. Males from both strains exhibit a choice diet effect, whereas the responses of females are variable: one strain shows no lifespan difference between the two diets and the other one lives longer on a choice diet (N = 144–152 for each group). (C–D) Males fed on a choice diet exhibit the same intestinal integrity (C, N = 246–291 per diet) and climbing ability (D, N = 14 per diet) compared to fixed diet siblings. (E) Males on a choice diet consume more sugar and the same amount of yeast compared to their siblings that are fed on a fixed diet (N = 68–89 per diet). (F) Males on a choice diet consume a similar amount of sugar compared to their siblings on high-sugar fixed diets (S30Y3 and S24Y3; i.e., 30% [w/v] sugar or 24% [w/v] sucrose mixed with 3% [w/v] yeast, respectively; N = 65–82 per diet). (G–H) Dietary effects on lifespan (G, N = 144–149 for each group) and triglycerides/protein ratio (H, N = 60 for each group) differ between a choice diet and two high-sugar fixed diets. (I–J) Increased dietary protein in a choice diet is sufficient to promote longevity (I, N = 102–154 for each group) without affecting the macronutrient intake (J, N = 52–71). p-Values were obtained for lifespan using a log-rank test and for smurf assay, climbing ability, nutrient consumption, and TAG amounts using a Mann–Whitney U test. Boxplots in (C–F, H and J) represent the medians (the middle bar) and the first and the third quartiles (box boundaries) for each experimental group. Male flies were used in the experiments unless otherwise mentioned.
-
Figure 1—source data 1
Effects of dietary choice on lifespan and behavior.
- https://cdn.elifesciences.org/articles/59399/elife-59399-fig1-data1-v2.xlsx
Figure 1—figure supplement 1
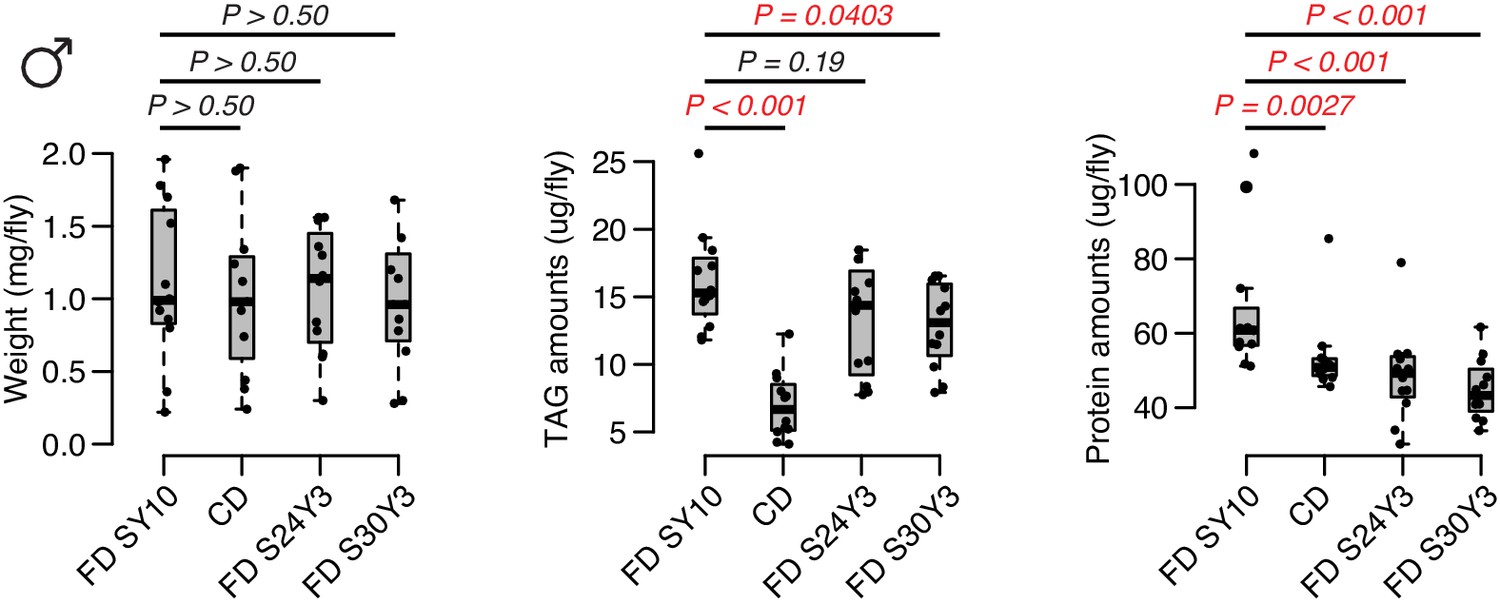
Compared to a standard fixed diet SY10, either choice diet or high-sugar diet have an effect on weight.
For TAG and protein amounts, dietary choice induces a dramatic reduction on TAG amounts but only mild decrease in protein levels, whereas the effect of dietary sugar is more significant on protein amounts. N = 60 flies per each diet, which are 12 independent replicates (of five flies each). Comparisons were accomplished using a Mann–Whitney U test.
-
Figure 1—figure supplement 1—source data 1
Effects of dietary choice or dietary sugar on weight, TAG, and protein abundance.
- https://cdn.elifesciences.org/articles/59399/elife-59399-fig1-figsupp1-data1-v2.xlsx
Figure 1—figure supplement 2
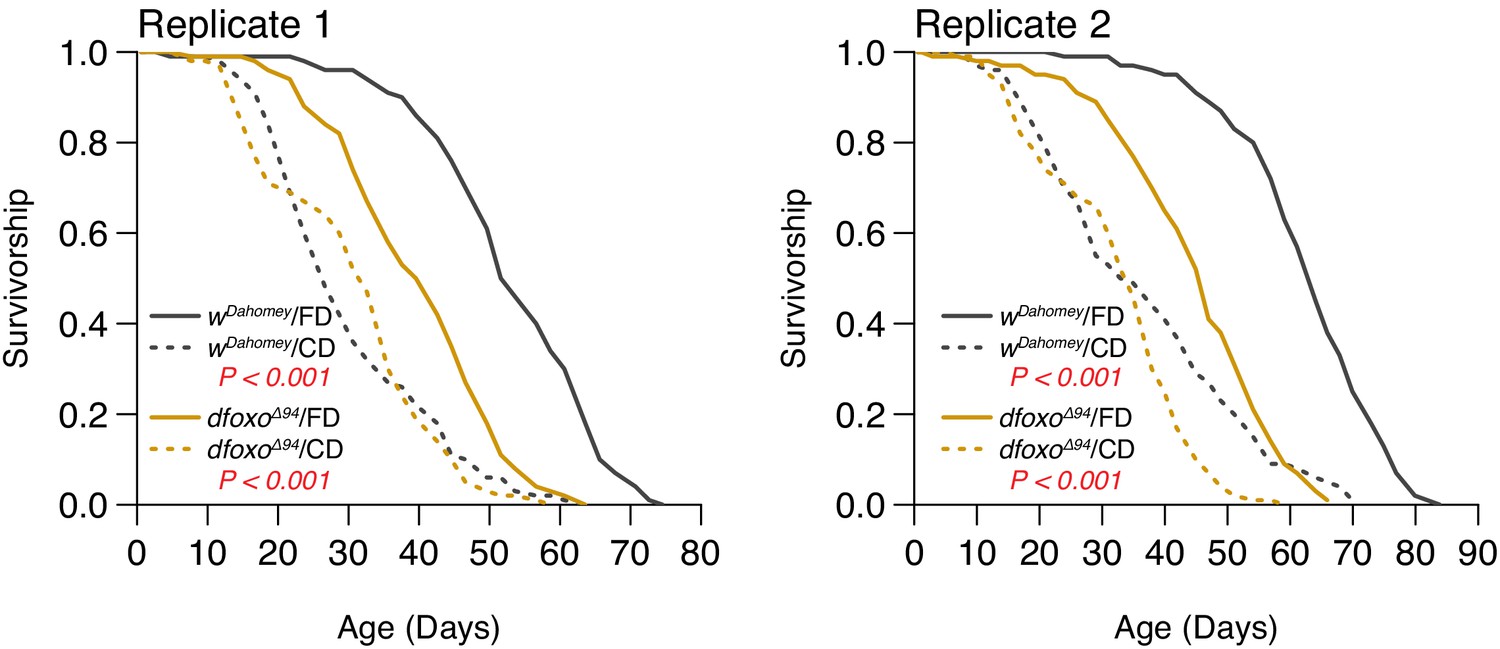
Two independent replicates support that the lifespan effect through dietary choice is largely independent of dFOXO (N = 126–150).
Comparison of survival curves was via log-rank test.
-
Figure 1—figure supplement 2—source data 1
dFOXO lifespan data.
- https://cdn.elifesciences.org/articles/59399/elife-59399-fig1-figsupp2-data1-v2.xlsx
Figure 1—figure supplement 3
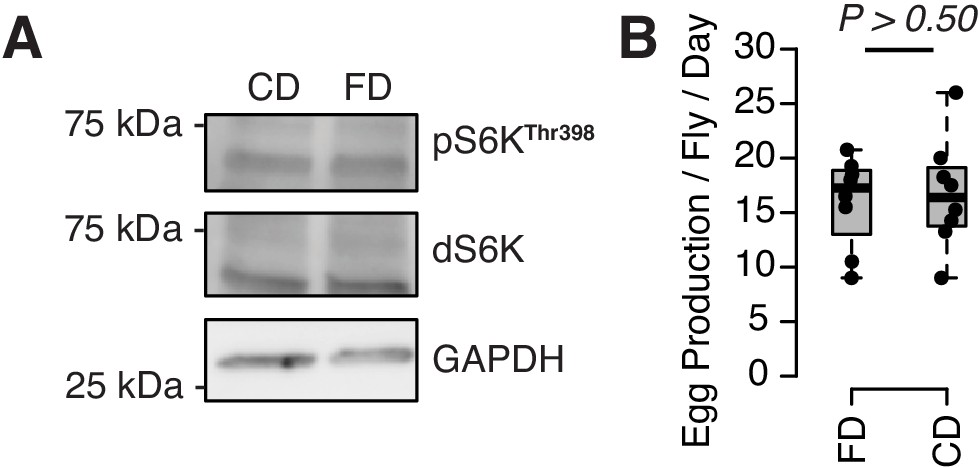
Neither TOR activity (A) nor egg production (B) responds to a choice diet.
For western blot, 10 flies are pooled for each sample. For egging, eight biological replicates were used per diet (eight females and eight males each). Measures were taken over 4 days (see our Materials and methods). p-Value was obtained using a Mann–Whitney U test.
-
Figure 1—figure supplement 3—source data 1
Egg production data.
- https://cdn.elifesciences.org/articles/59399/elife-59399-fig1-figsupp3-data1-v2.xlsx
Figure 2 with 1 supplement
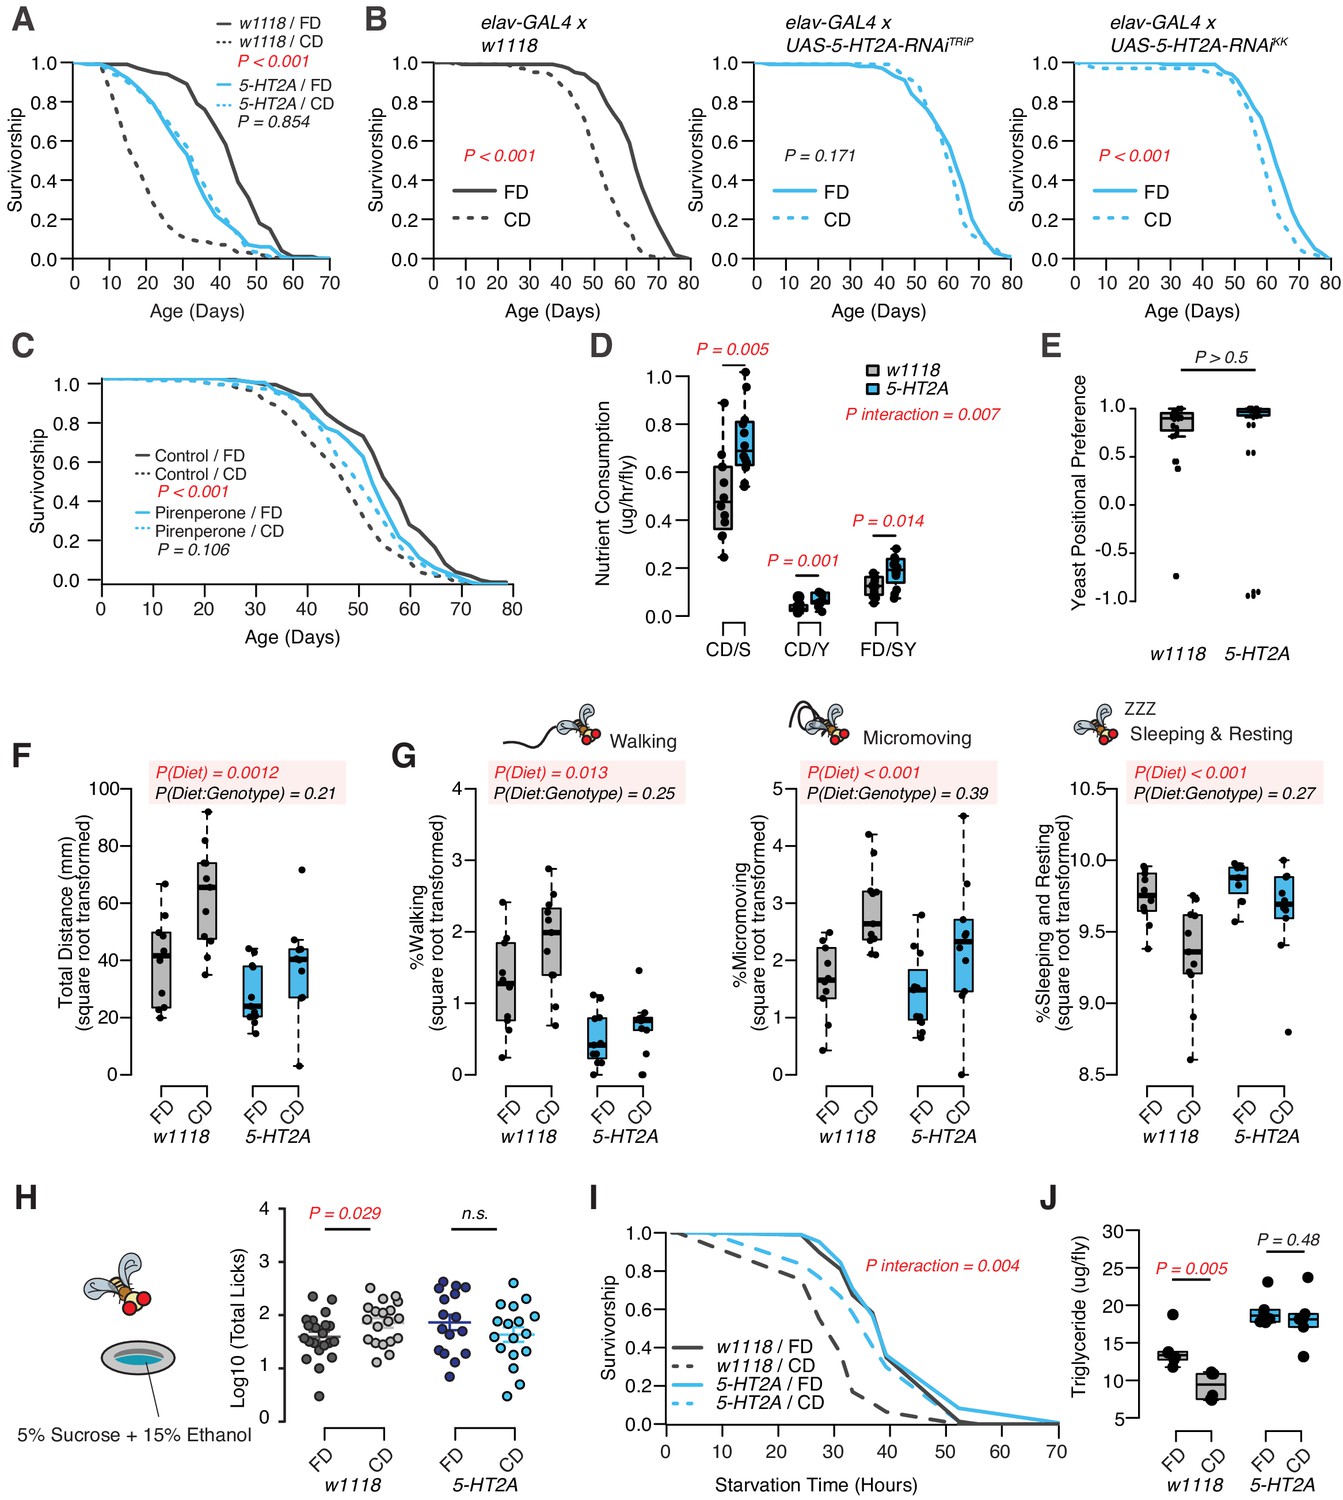
Dietary choice influences lifespan, behavior, and physiology through the serotonin receptor 2A (5-HT2A).
(A) P-element insertion in 5-HT2A abrogates the differences in male lifespan caused by dietary choice (N = 145–148 per group). (B) Pan-neuronal knockdown of 5-HT2A expression eliminates (with UAS-5-HT2A-RNAiTRiP) or reduces (with UAS-5-HT2A-RNAiKK) the choice effect compared to control flies (N = 145–150 per group). (C) Pharmacological treatment of Canton-S males with a serotonin receptor 5HT2-antagonist, pirenperone, during adulthood effectively abrogates the lifespan differences caused by dietary choice (N = 145–153 per treatment). (D) 5-HT2A males exhibit similar feeding preferences on the choice diet, but consume more nutrients than w1118 animals on both diets (N = 97–115 for each group). (E) Both w1118 and 5-HT2A males spent a majority of their time on yeast food in a choice environment (PI = (Tyeast− Tsugar)/(Tyeast + Tsugar); N = 24 for each group). (F–G) Males in a choice environment exhibit increased activity: they traveled farther (F), demonstrated more walking and micromovements, and spent less time sleeping and resting (G) when they are exposed to choice diet, and such effects are independent of 5-HT2A (N = 10 or 11 per group.) (H) A schematic illustrating the ethanol feeding assay. Males were fed on choice diet or fixed diet for 10 days before being placed in chambers where they could feed from wells containing food solutions with 15% ethanol (refer to the Materials and methods for more details). w1118 flies previously fed on choice diet show significantly more licks on ethanol-containing food than sibling flies fed on fixed diet. 5-HT2A mutants show the same trend independent of the diet they previously fed on (N = 16–21 for each treatment). (I–J) One to 2 week’s feeding on choice diet decreases starvation resistance (I, N = 72–88 per group) and TAG amounts (J, N = 48 per group), and both effects require 5-HT2A. p-Values were obtained for lifespan and starvation resistance using a log-rank test, for nutrient consumption and activity using a two-way ANOVA analysis, for positional preference using a Mann–Whitney U test, and for ethanol feeding using a one-tail Student’s t-test. Boxplots in (D, E, F, G, H, and J) represent the medians (the middle bar) and the first and the third quartiles (box boundaries) for each experimental group.
-
Figure 2—source data 1
Requirement of 5-HT2A in the dietary choice effects.
- https://cdn.elifesciences.org/articles/59399/elife-59399-fig2-data1-v2.xlsx
Figure 2—figure supplement 1
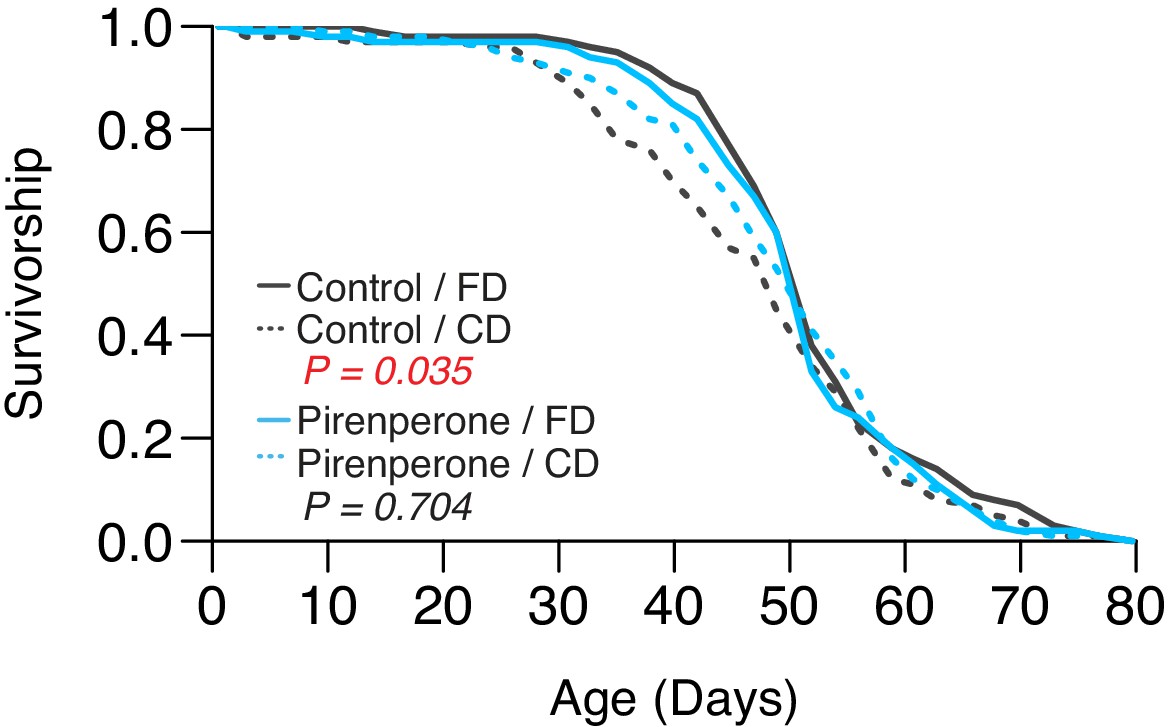
Second replicate to validate the role of pirenperone in abrogating the lifespan effect of dietary choice.
p-Values were obtained using a log-rank test (N = 130–144).
-
Figure 2—figure supplement 1—source data 1
Lifespan data from pirenperone adminstration.
- https://cdn.elifesciences.org/articles/59399/elife-59399-fig2-figsupp1-data1-v2.xlsx
Figure 3 with 3 supplements
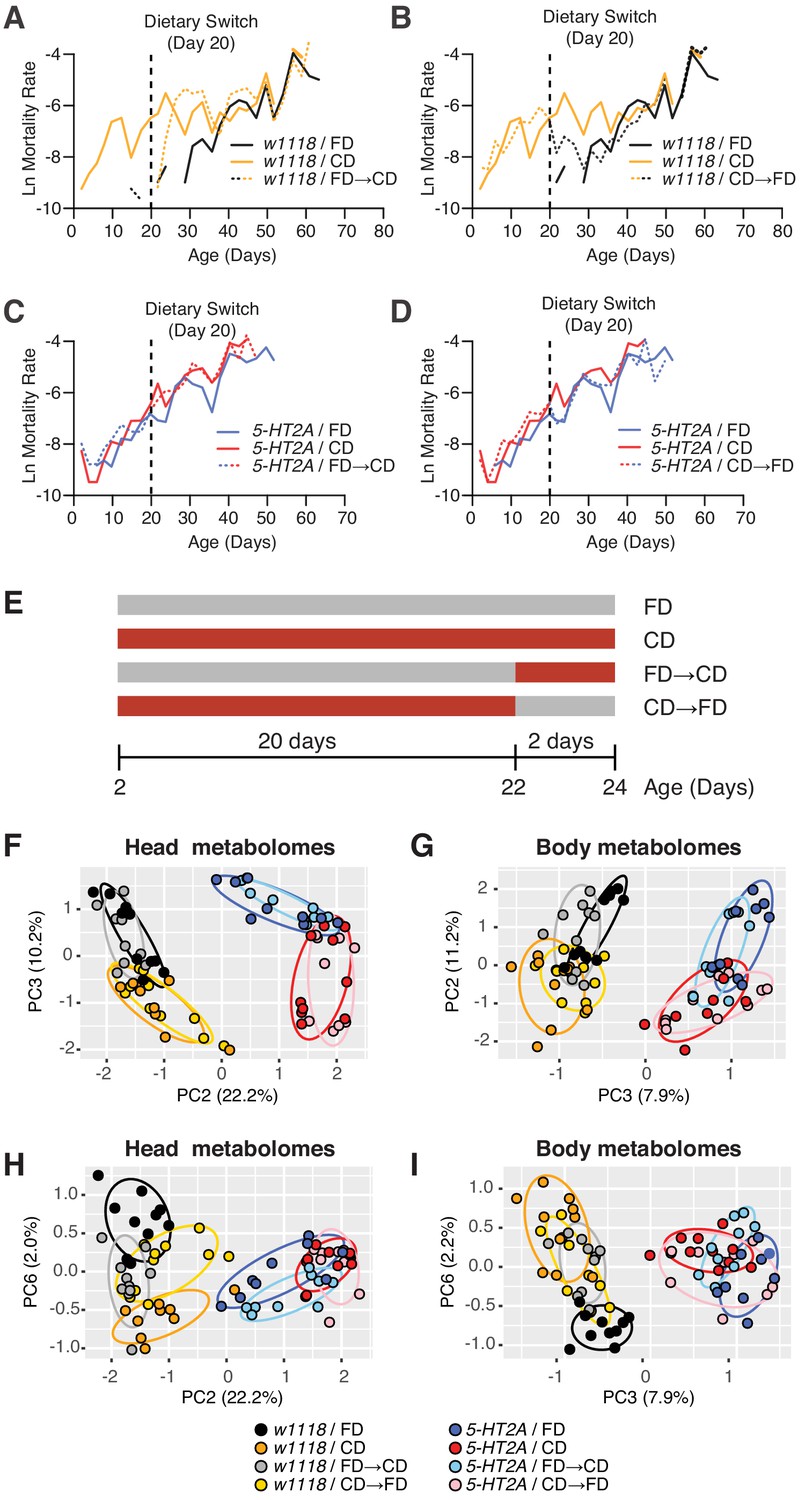
Temporal effects of dietary choice on mortality and metabolomes.
(A–D) 5-HT2A mediates mortality responses to the introduction or removal of a choice diet. Mortality rate is plotted on the natural log scale (N = 225–282). Male flies are either fed on a choice diet (CD) or a fixed diet (FD) at the onset of adulthood. The dietary switch regime, either switched from FD to CD or switched from CD to FD, was applied at 20 days of adulthood, where the mortality rate of w1118 males fed on CD is significantly higher than w1118 males fed on FD. (A) w1118 flies that previously fed on FD showed a rapid increase in mortality within 48 hr when switched to CD at 20 days of adulthood, compared to those of the same age that continually fed on FD. About 5 days after the switch, the switched cohorts were indistinguishable from those of the same-age flies maintained on a CD through adulthood. (B) Reciprocal switches from CD to FD resulted in immediate reduction in mortality rate within 48 hr. At 30 days of adulthood, the mortality rate of the switched cohorts was virtually the same as flies that fed on a CD throughout the adulthood. (C–D) 5-HT2A flies from different dietary groups did not show differences in mortality rate, suggesting that the mortality effect is mediated through serotonin signaling. (E) Dietary switch paradigm illustrated at the different time points for metabolomics samples. (F–I) Principal component analysis (PCA) isolated the metabolome component that encodes the memory of previous diet and the component that represents the response to new diet. PCA plot shows the distribution of samples for each treatment in the head metabolomes and in body metabolomes. In the head (F–H), metabolites weighted heavily in PC3 (in the top panel), PC6 (in the bottom panel), and PC2 (in both panels) distinguish the memory of previous diet, the response to new diet, and the genotype, respectively. In the body (G–I), the effect of previous diet, the effect of new diet, and the effect of genotype were distinguished by the metabolites heavily weighted in PC2, PC6, and PC3, respectively (N = 8–10 samples for each treatment, and 30–50 heads or bodies were used for each sample).
-
Figure 3—source data 1
Mortality data.
- https://cdn.elifesciences.org/articles/59399/elife-59399-fig3-data1-v2.xlsx
Figure 3—figure supplement 1
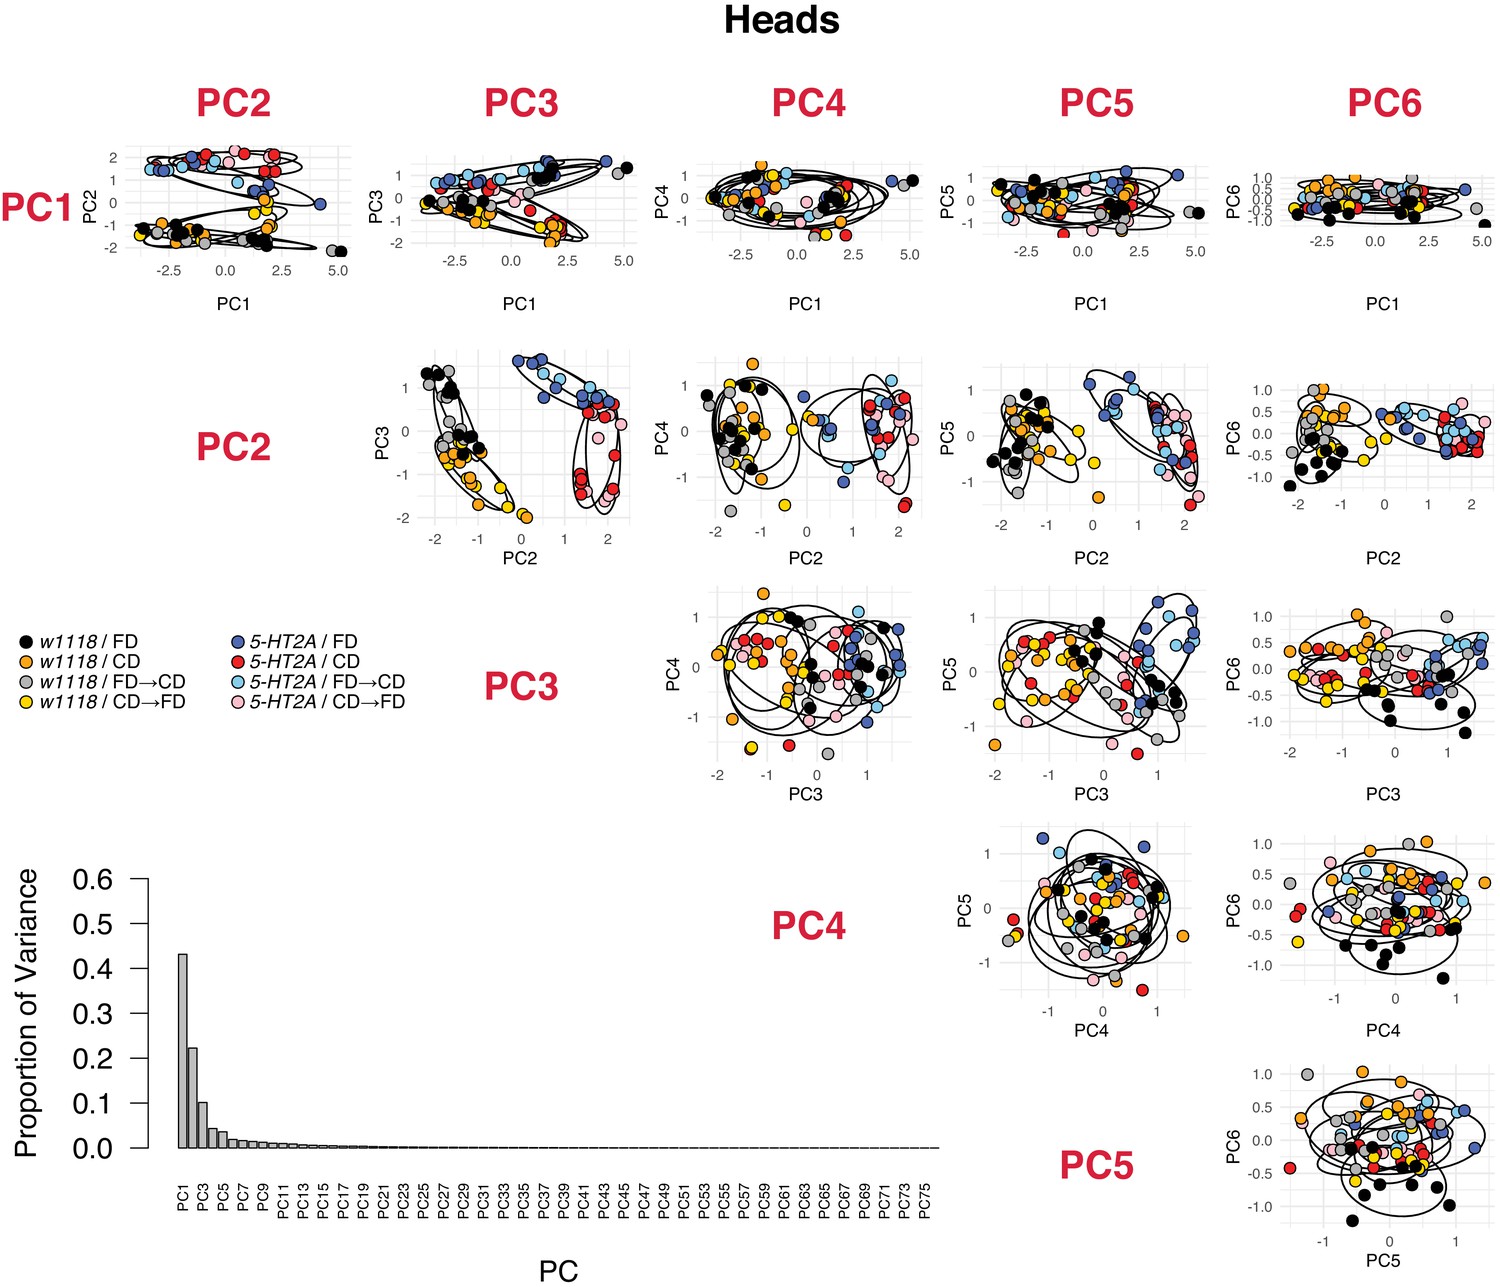
PCA analyses in head metabolomes, including the proportion of variance of each PC and the PCA plots for the first six PCs.
Figure 3—figure supplement 2
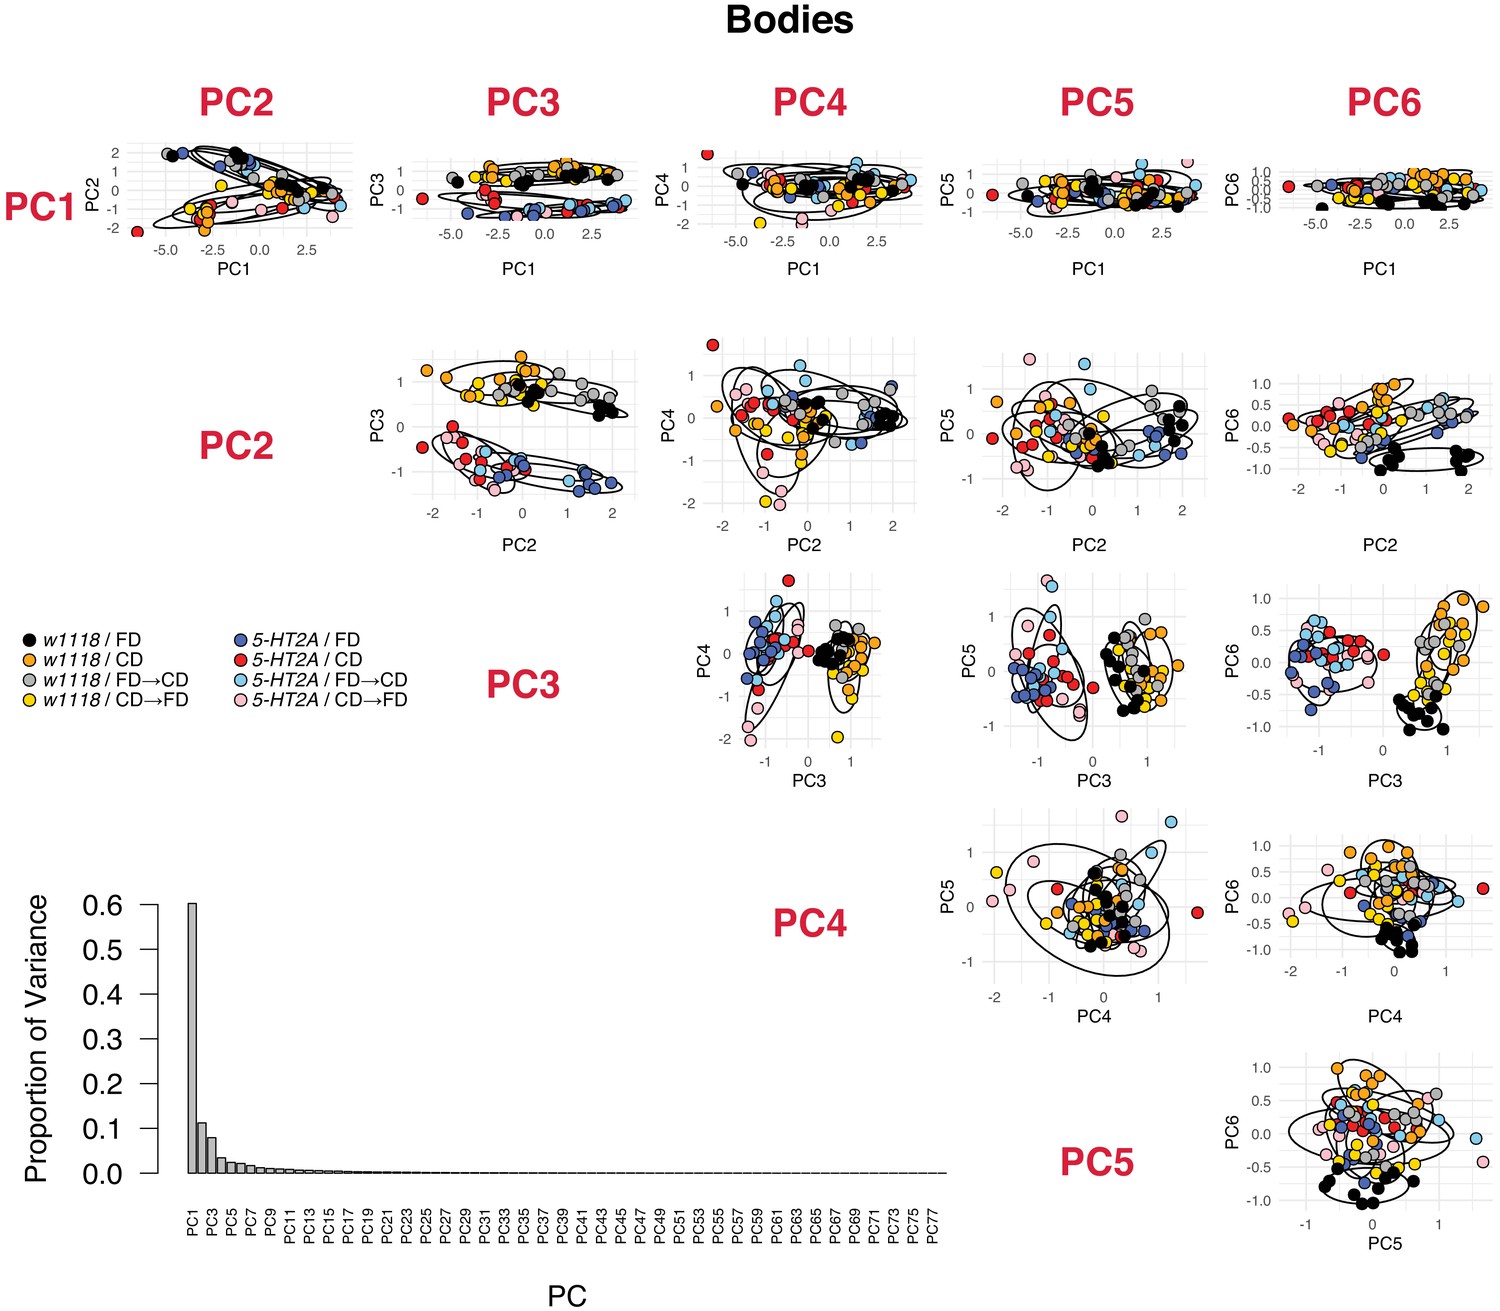
PCA analyses in body metabolomes, including the proportion of variance of each PC and the PCA plots for the first six PCs.
Figure 3—figure supplement 3
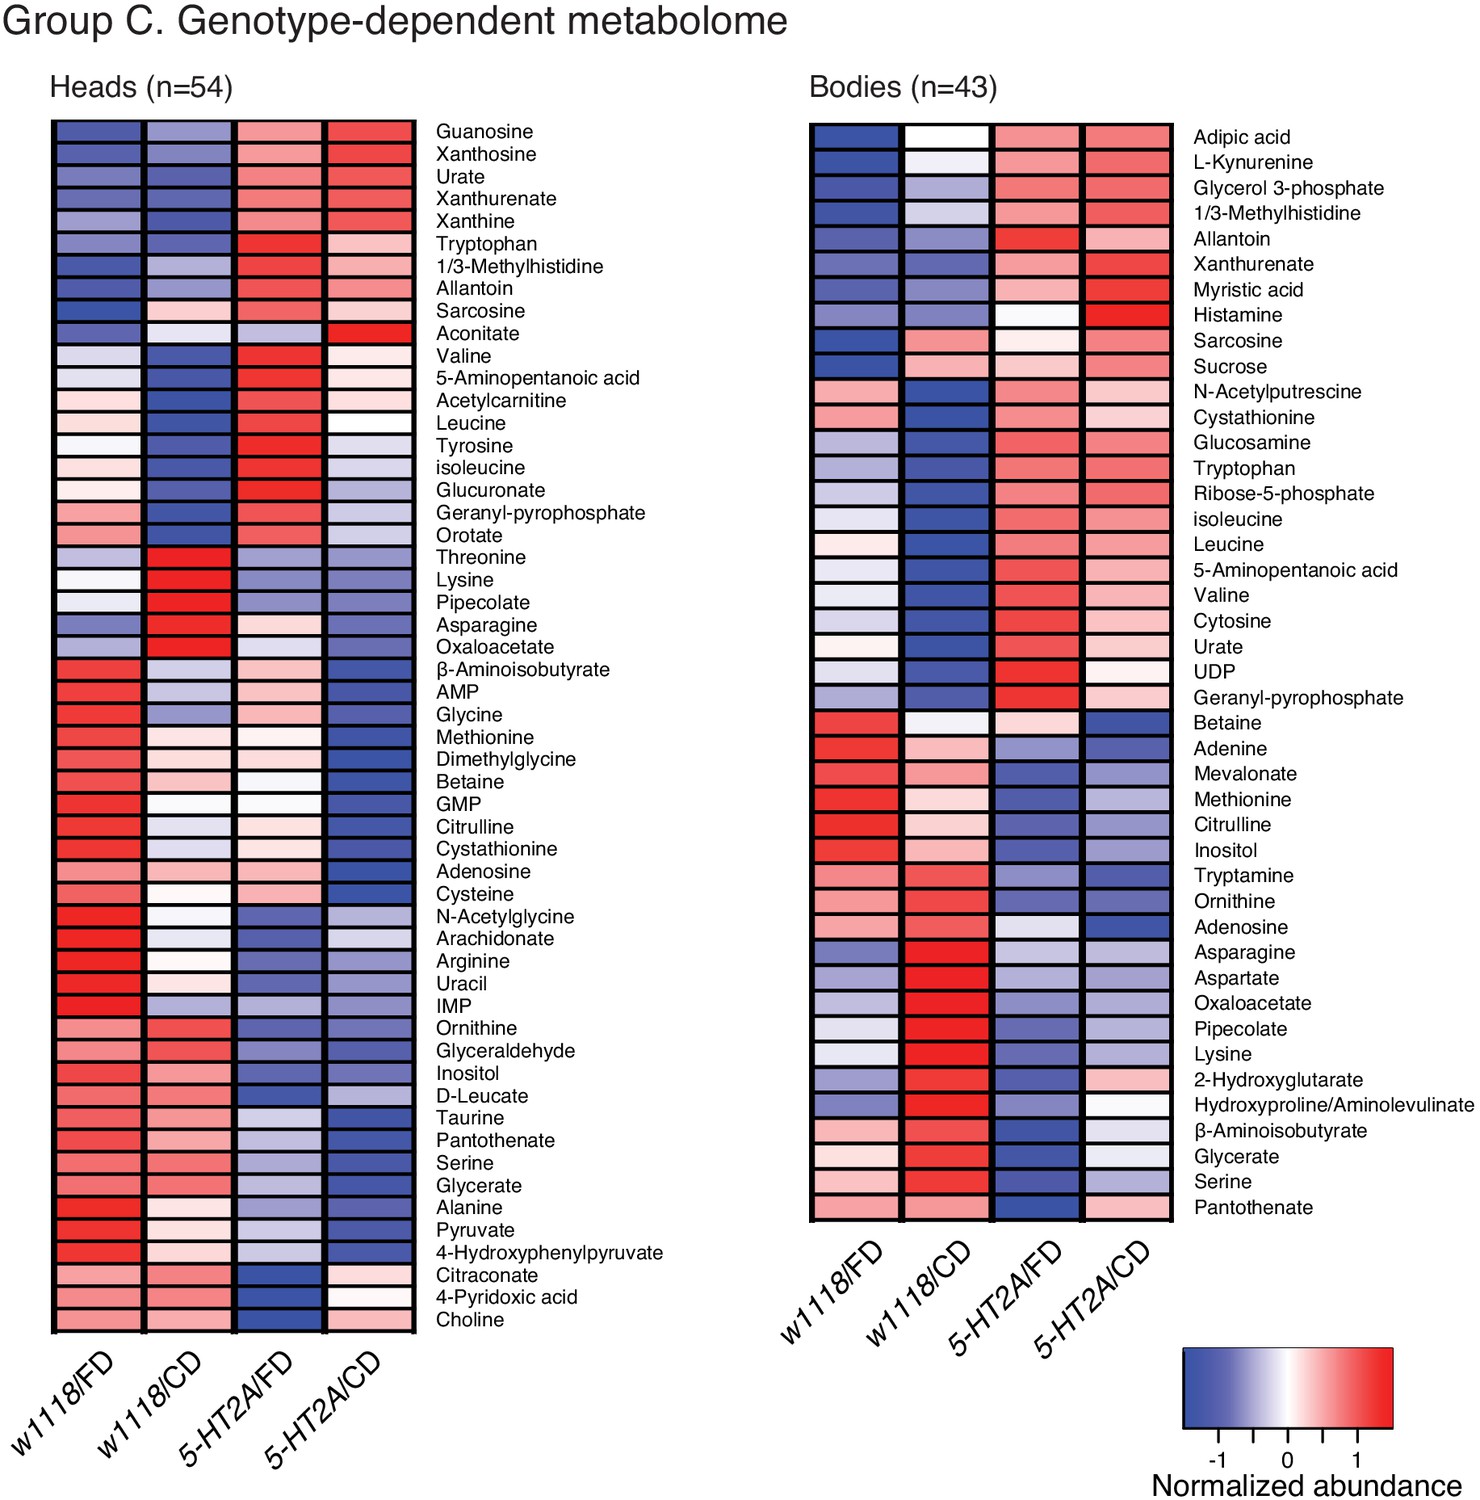
Clustering of the abundance of each metabolite that differed between genotypes in head or body metabolomes.
Figure 4

Nutrient presentation mediates metabolic changes in both head and body.
(A–B) Generalized linear model separates the metabolites that respond to dietary choice in a 5-HT2A-independent (A) or -dependent (B) manner. Up- or down-regulation of metabolites upon choice are represented by red and blue, respectively. Metabolites that were altered in both heads and bodies are indicated by asterisks. (C–D) Metabolic pathways that are influenced by choice diet are revealed by MetaboAnalystR. Pathways with a number of hits > 3 are shown.
Figure 5 with 2 supplements
Nutrient presentation modulates central metabolic pathways through serotonin signaling.
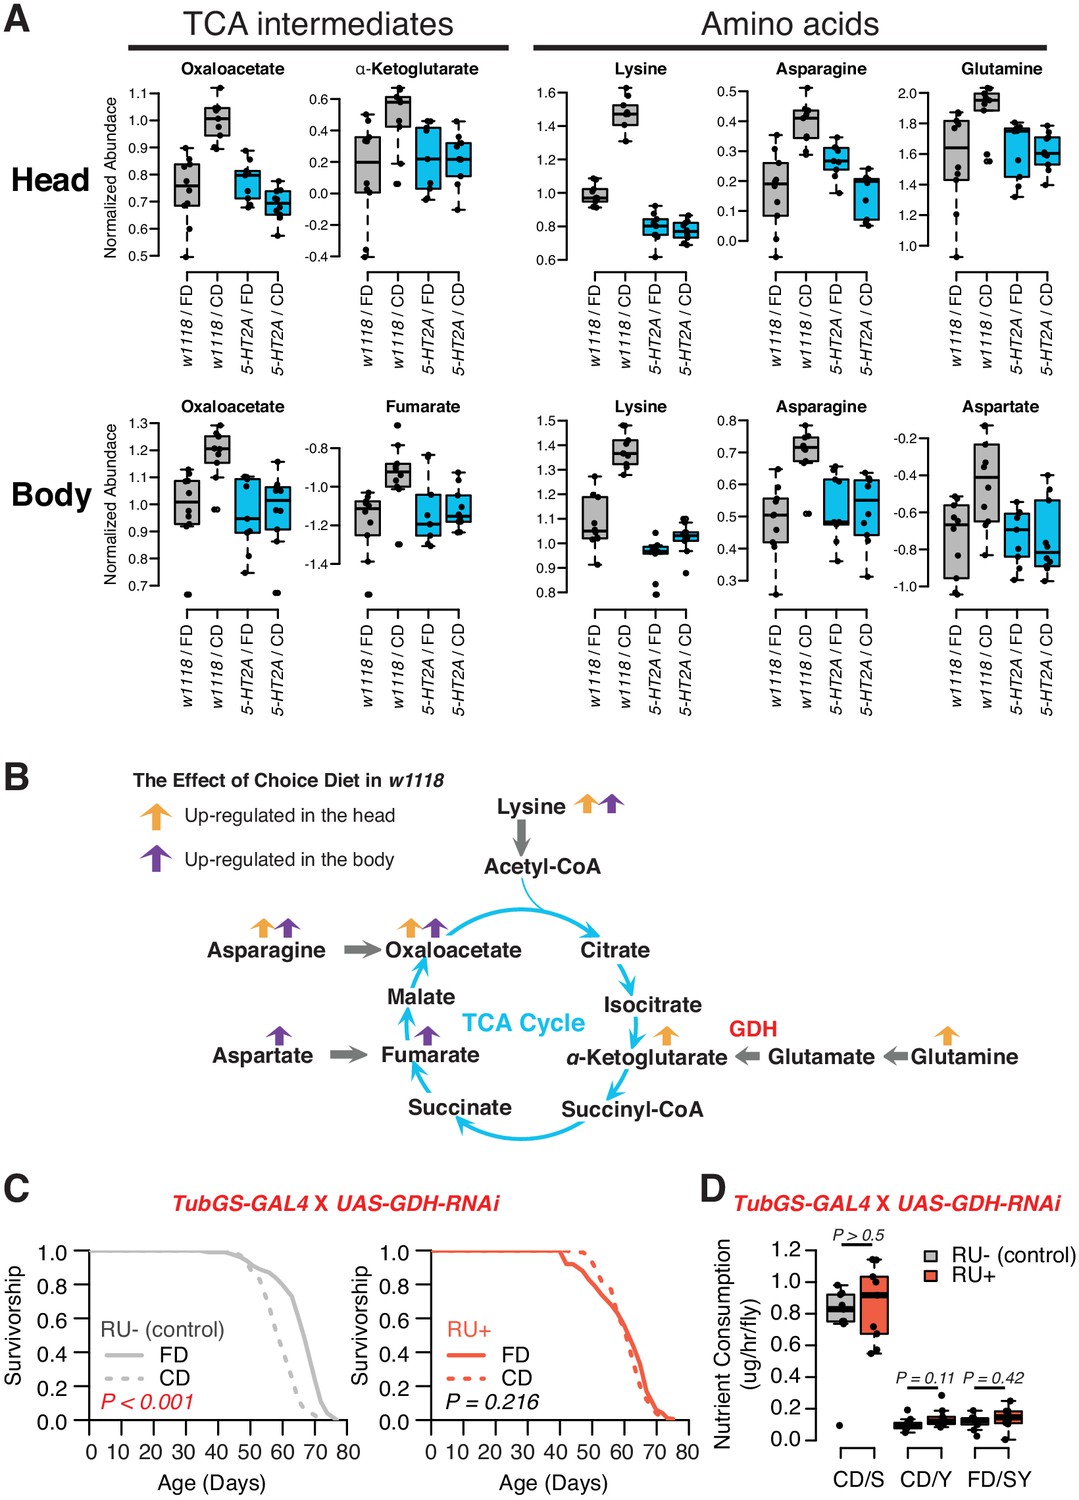
(A) Boxplots show the TCA intermediates and amino acids that are modulated by choice diet in a 5-HT2A-dependent manner (two-way ANOVA, p<0.05 for the interaction between diet and genotype). (B) The metabolites of the TCA cycle. Orange and purple arrows indicate the metabolites that are regulated in head and body when the flies are given choice diet conditions, respectively. (C) Ubiquitous knockdown of glutamine dehydrogenase (GDH) using the GeneSwitch system fully abrogates the lifespan differences between the two diets when RU-486 was administrated in the food (N = 144–153 per group; p-values are calculated using a log-rank test). (D) Knockdown of GDH has no effects in nutrient consumption on either diet (N = 71–94 per group, p-Values are calculated using a Mann–Whitney U test).
-
Figure 5—source data 1
Lifespan and feeding data from GDH knock-down.
- https://cdn.elifesciences.org/articles/59399/elife-59399-fig5-data1-v2.xlsx
Figure 5—figure supplement 1
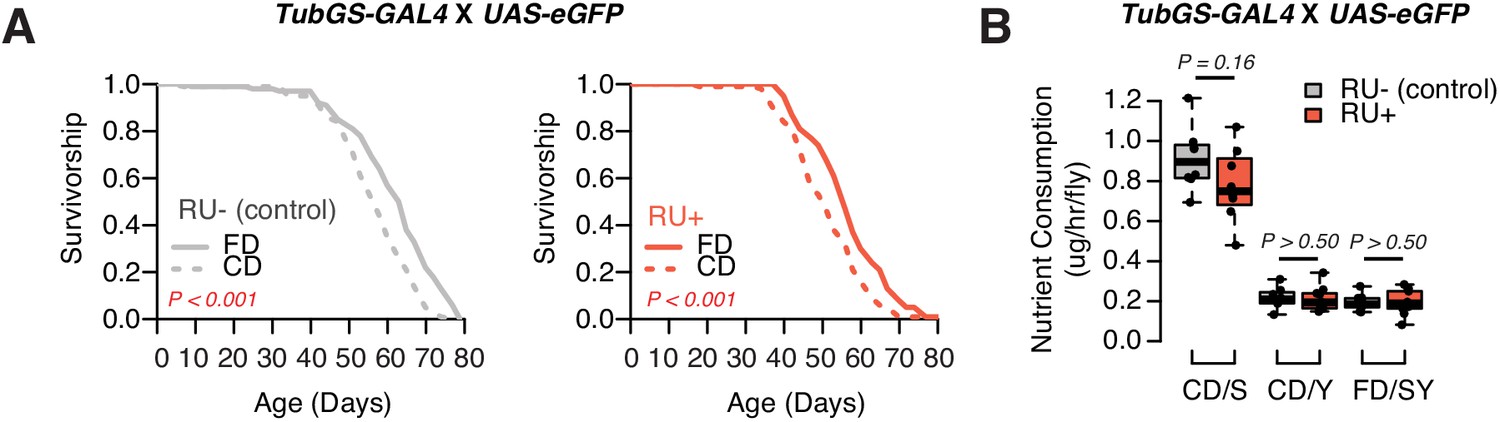
RU has no effects in the lifespan and feeding.
(A) GeneSwitch control flies (TubGS-GAL4 X UAS-eGFP) still exhibit shortened lifespan on a choice diet, in both RU+ and RU- conditions, indicating RU486 has no impact on the choice effect. N = 143–152. Comparison of survival curves was via a log-rank test. (B) Similarly, RU486 has no effects in nutrient consumption on either diet (N = 60–79, p-Values were obtained using a Mann–Whitney U test).
-
Figure 5—figure supplement 1—source data 1
Lifespan and feeding data from RU administration.
- https://cdn.elifesciences.org/articles/59399/elife-59399-fig5-figsupp1-data1-v2.xlsx
Figure 5—figure supplement 2
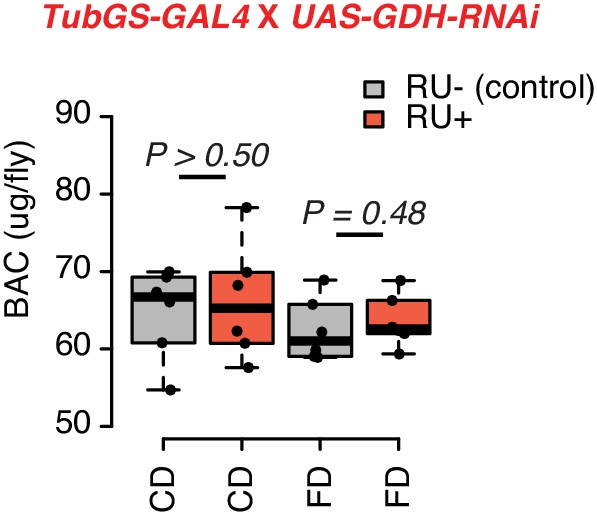
Knockdown GDH has no effects on the protein amount of flies.
N = 60, including six independent samples per each group (of 10 flies each). p-Values were obtained using a Mann–Whitney U test.
-
Figure 5—figure supplement 2—source data 1
Protein data from GDH knock-down.
- https://cdn.elifesciences.org/articles/59399/elife-59399-fig5-figsupp2-data1-v2.xlsx
Figure 6
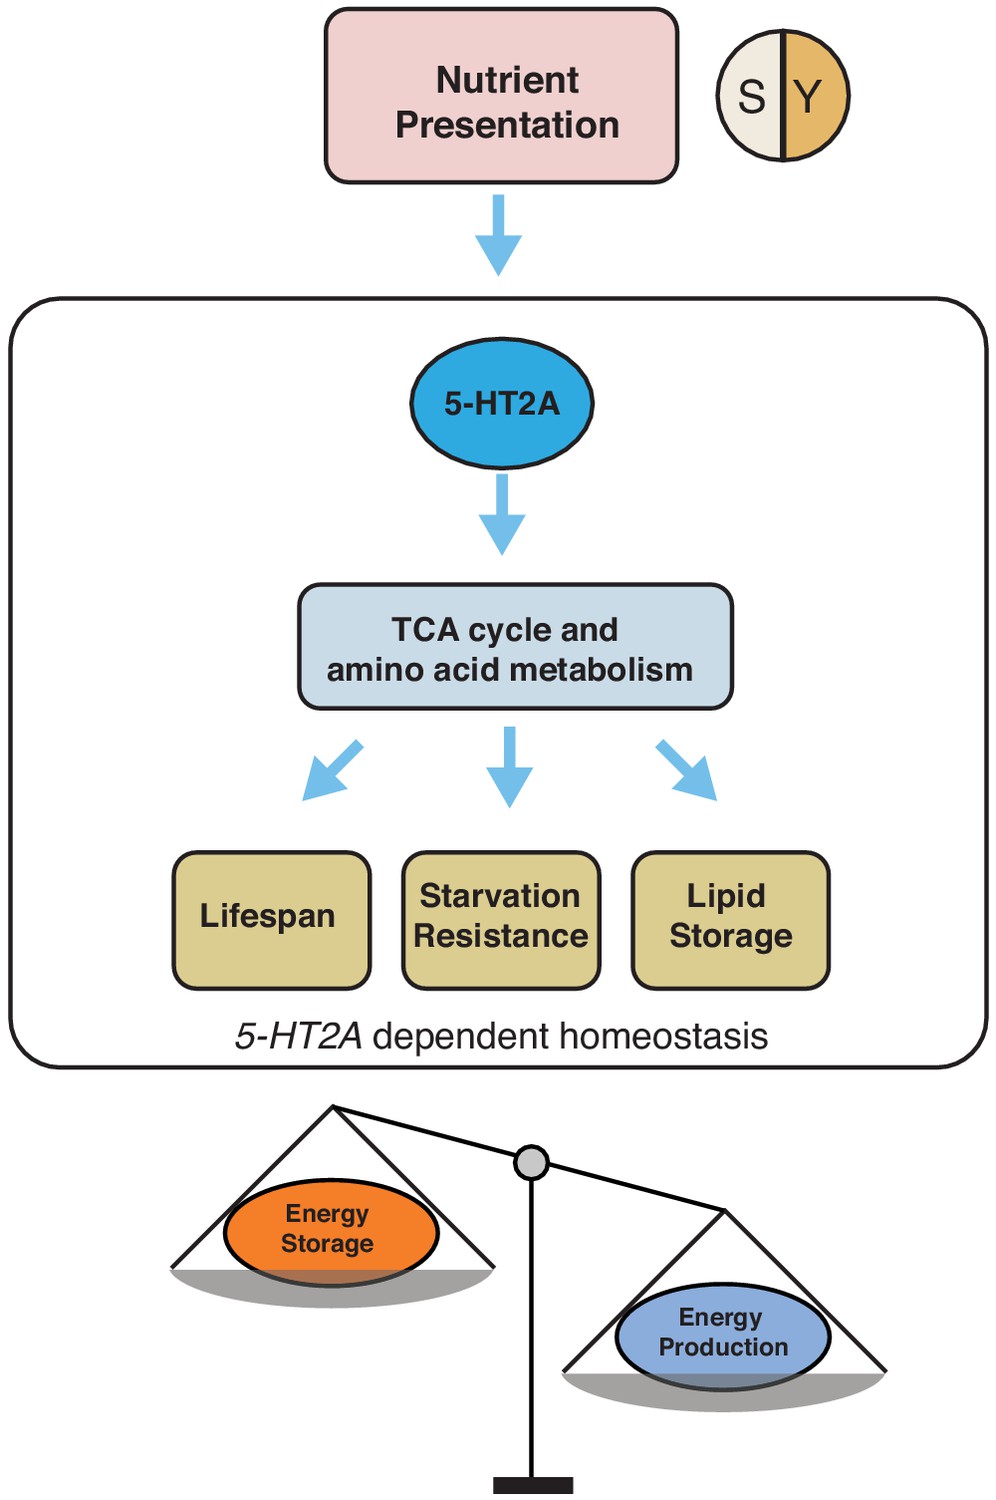
Our working model showing how 5-HT2A regulates energy homeostasis to influence aging and physiology in response to nutrient presentation.
Author response image 1

Tables
Key resources table
| Reagent type (species) or resource | Designation | Source or reference | Identifiers | Additional information |
|---|---|---|---|---|
| Gene (Drosophila melanogaster) | 5-HT2A | FlyBase | FLYB:FBgn0087012 | |
| Gene (Drosophila melanogaster) | GDH | FlyBase | FLYB:FBgn0001098 | |
| Genetic reagent (Drosophila melanogaster) | w1118 | Bloomington Drosophila Stock Center | ||
| Genetic reagent (Drosophila melanogaster) | Canton-S | Bloomington Drosophila stock Center | ||
| Genetic reagent (Drosophila melanogaster) | 5-HT2APL00052 | Bloomington Drosophila Stock Center | BDSC Cat# 19367, RRID:BDSC_19367 | Also see Materials and methods, section 1 |
| Genetic reagent (Drosophila melanogaster) | wDahomey | Other | L. Partridge (University College London, UK) | |
| Genetic reagent (Drosophila melanogaster) | dFoxoΔ94 | Other | BDSC Cat# 42220; RRID:BDSC_42220 | L. Partridge (University College London, UK) |
| Genetic reagent (Drosophila melanogaster) | Tub-GS-GAL4 | Other | R. Davis (The Scripps Research Institute, Jupiter, FL) | |
| Genetic reagent (Drosophila melanogaster) | elav-GAL4 | Bloomington Drosophila Stock Center | BDSC Cat# 458 | |
| Genetic reagent (Drosophila melanogaster) | UAS-5-HT2A-RNAiTRiP | Bloomington Drosophila Stock Center | BDSC Cat# 31882; RRID:BDSC_31882 | |
| Genetic reagent (Drosophila melanogaster) | UAS-5-HT2A-RNAiKK | Vienna Drosophila Resource Center | VDRC Cat# 102105; RRID:FlyBase_FBst0475582 | |
| Genetic reagent (Drosophila melanogaster) | UAS-GDH-RNAi | Bloomington Drosophila Stock Center | BDSC Cat# 51473; RRID:BDSC_51473 | |
| Genetic reagent (Drosophila melanogaster) | UAS-eGFP | Bloomington Drosophila Stock Center | BDSC Cat# 79025; RRID:BDSC_79025 | |
| Strain, strain background (Drosophila melanogaster) | 18In08-17 | Other | P. Schmidt (University of Pennsylvania, PA) | |
| Strain, strain background (Drosophila melanogaster) | 18Ln10-4 | Other | P. Schmidt (University of Pennsylvania, PA) | |
| Software, algorithm | DLife | Other | S. Pletcher (University of Michigan) | |
| Software, algorithm | DTrack | Other | S. Pletcher (University of Michigan) | |
| Software, algorithm | DDrop | Other | S. Pletcher (University of Michigan) | |
| Software, algorithm | RStudio | RStudio |
Additional files
-
Supplementary file 1
Summary of dietary choice effects on lifespan of flies from different wild-type strains.
Values represent mean lifespan (SEM) in days for each cohort. p-Values are from log-rank ratio test.
- https://cdn.elifesciences.org/articles/59399/elife-59399-supp1-v2.docx
-
Supplementary file 2
Summary of 5-HT2A gene expression in various tissues.
RNA-seq data are obtained from FlyAtlas2 (flyatlas.gla.ac.uk/FlyAtlas2/).
- https://cdn.elifesciences.org/articles/59399/elife-59399-supp2-v2.docx
-
Supplementary file 3
Statistics of metabolomic analysis.
- https://cdn.elifesciences.org/articles/59399/elife-59399-supp3-v2.xlsx
-
Supplementary file 4
Raw data, sample information, and quality controls of metabolomic data.
- https://cdn.elifesciences.org/articles/59399/elife-59399-supp4-v2.xlsx
-
Transparent reporting form
- https://cdn.elifesciences.org/articles/59399/elife-59399-transrepform-v2.docx
Download links
A two-part list of links to download the article, or parts of the article, in various formats.
Downloads (link to download the article as PDF)
Open citations (links to open the citations from this article in various online reference manager services)
Cite this article (links to download the citations from this article in formats compatible with various reference manager tools)
Drosophila serotonin 2A receptor signaling coordinates central metabolic processes to modulate aging in response to nutrient choice
eLife 10:e59399.
https://doi.org/10.7554/eLife.59399


