A physical mechanism of TANGO1-mediated bulky cargo export
- Centre for Genomic Regulation (CRG), The Barcelona Institute of Science and Technology, Spain
- ICFO-Institut de Ciencies Fotoniques, The Barcelona Institute of Science and Technology, Spain
- Universitat Politècnica de Catalunya-BarcelonaTech, Spain
- Institute for Bioengineering of Catalonia, The Barcelona Institute of Science and Technology, Spain
- Centre Internacional de Mètodes Numèrics en Enginyeria (CIMNE), Spain
- ICREA, Spain
- Universitat Pompeu Fabra (UPF), Spain
Figures
Figure 1 with 1 supplement
Physical model of TANGO1 ring formation.
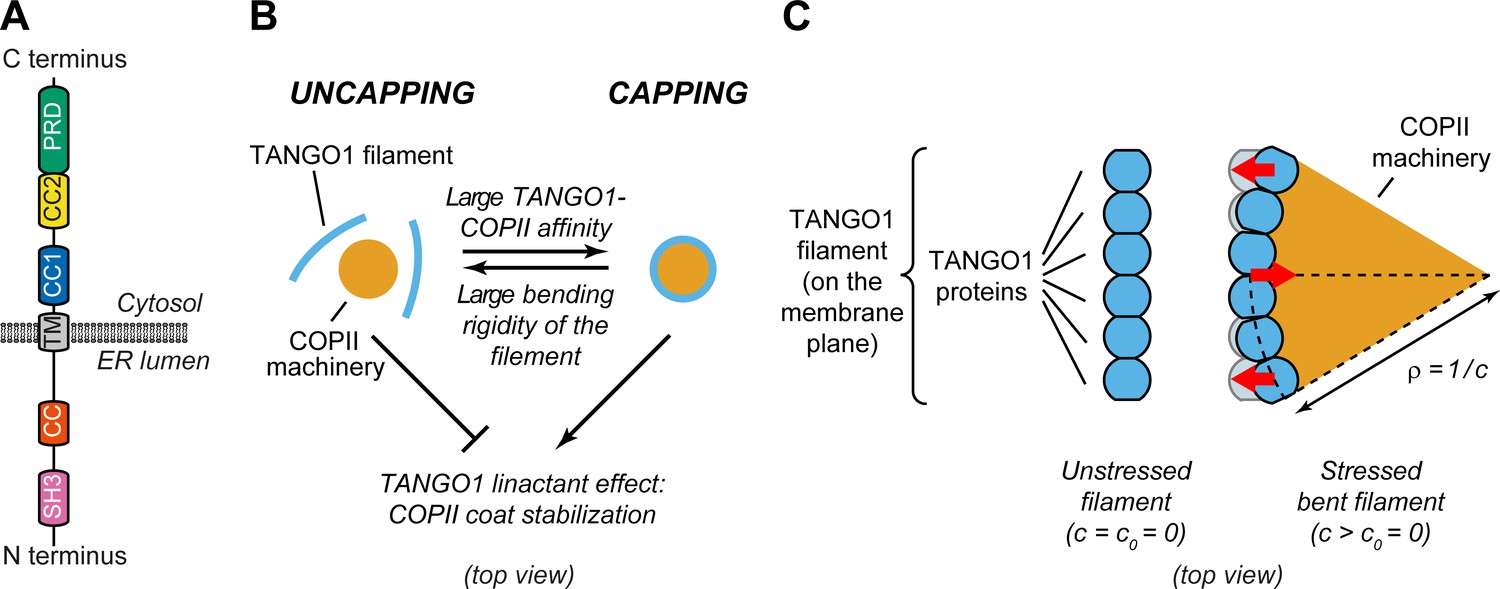
(A) Schematic representation of the domain structure and topology of TANGO1, indicating the SH3 domain, a lumenal coiled-coiled domain (CC), the one and a half transmembrane region (TM), the coiled-coiled 1 (CC1) and 2 (CC2) domains, and the PRD. (B) Schematic description of the TANGO1 ring formation model (top view). ERES consisting of COPII subunits assemble into in-plane circular lattices (orange), whereas proteins of the TANGO1 family assemble into filaments by lateral protein-protein interactions (light blue). The competition between the affinity of the TANGO1 filament to bind COPII subunits (promoting capping of peripheral COPII subunits) and the resistance of the filament to be bent (promoting uncapping) controls the capping-uncapping transition. Only when TANGO1 caps the COPII lattice, it acts as a linactant by stabilizing the peripheral COPII subunits. (C) Schematic representation of individual proteins that constitute a TANGO1 filament and of how filament bending is associated with elastic stress generation. Individual TANGO1 family proteins (blue shapes) bind each other in a way that is controlled by the structure of protein-protein binding interfaces, leading to formation of an unstressed filament of a certain preferred curvature, (left cartoon, showing the case where = 0). Filament bending can be caused by the capping of TANGO1 filament to peripheral COPII machinery (orange area), which generates a stressed bent filament of a certain radius of curvature, (right cartoon). Such deviations from the preferred shape (shown in light blue) are associated with elastic stress generation (red arrows point to the direction of the generated bending torque, which correspond to the direction of recovery of the filament preferred shape).
Figure 1—figure supplement 1
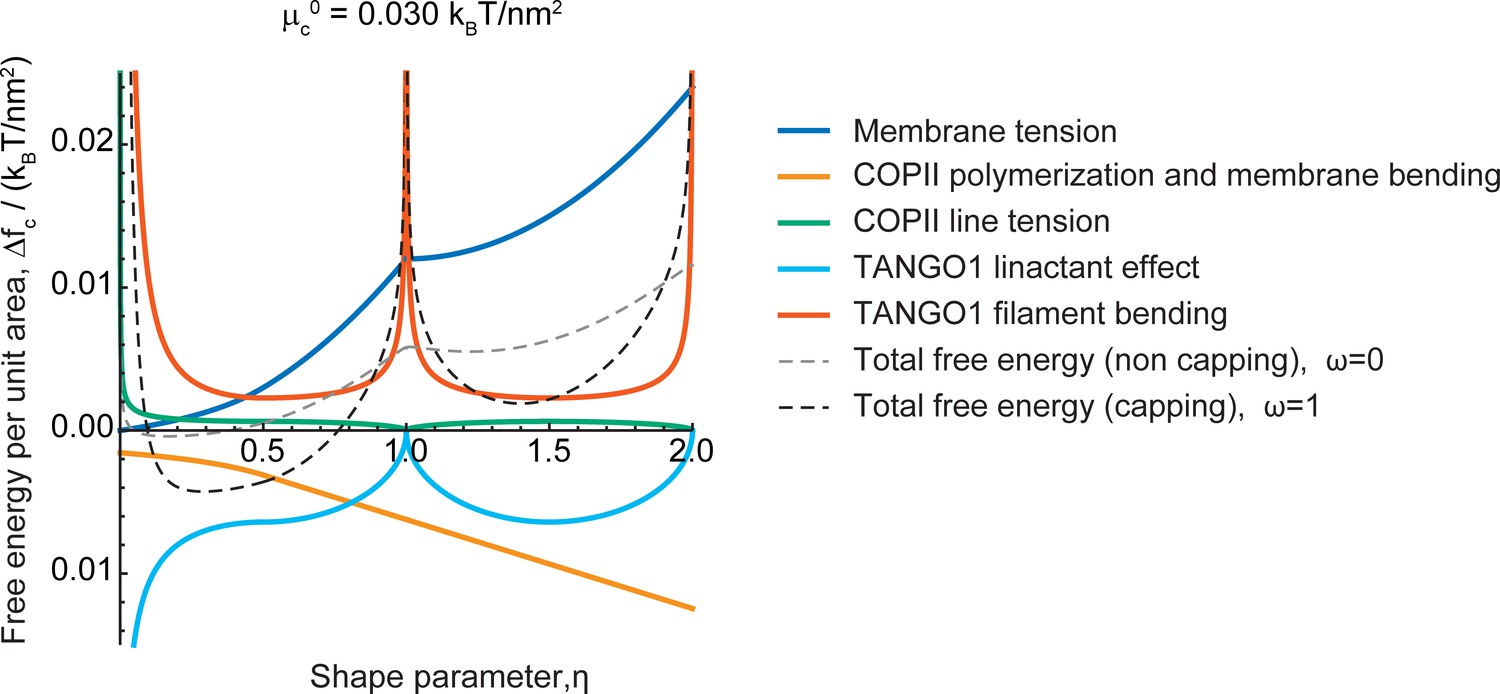
Different contributions to the free energy profile of a transport intermediate as a function of its shape and TANGO1 capping.
The free energy change per unit area of the transport intermediate-TANGO1 system, , plotted as a function of the shape parameter, , for the COPII coat polymerization energy, , for both full COPII capping by TANGO1 (, black, dashed curve) and non-capping conditions (, gray, dashed curve), are shown. Each separate contribution to the total free energy per unit area (Appendix 2) is individually represented: the contributions of (i) membrane tension (dark blue); (ii) COPII polymerization and membrane bending (orange); (iii) COPII line energy (green); (iv) TANGO1-mediated reduction of the COPII line energy (light blue); and (v) TANGO1 filament bending energy (vermillion). We considered no applied force, , and the rest of the elastic parameters used for the calculations are specified in Appendix 2—table 1.
Figure 2 with 2 supplements

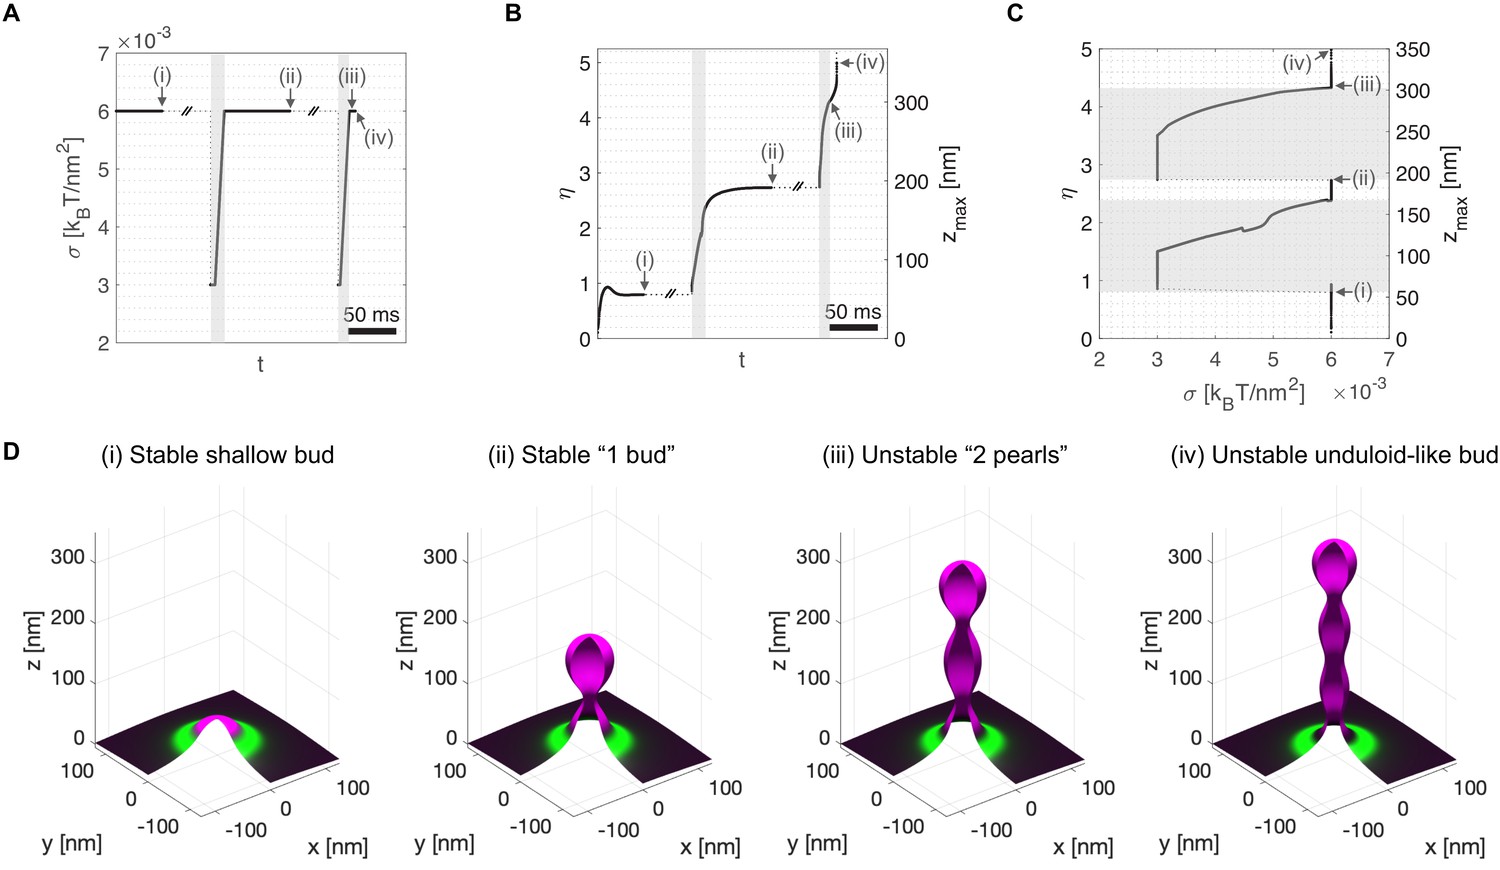
Computational dynamic model (Model A) recapitulates TANGO1 ring self-organization around COPII coats and highlights its role in stabilizing incomplete transporters.
Shape factor () and height () of the transport intermediate as a function of time for (A) inert TANGO1 and (B) functional TANGO1. (i-iii) Snapshots of the buds at the times indicated in the left graphs. All results obtained for parameters as given in Appendix 1—table 1, with and . Gray areas correspond to the coat nucleation stages (see Appendix 1 for details). See corresponding Figure 2—video 1 and Figure 2—video 2 for a dynamic representation of the simulations shown in (A) and (B), respectively.
Figure 2—video 1
Video corresponding to Figure 2A.
Membrane tension and COPII self interaction . (A) Shape of the membrane and distribution of proteins of more than 20% surface coverage. (B) Distribution of COPII and TANGO1 surface coverage as a function of the radius . (C) Imposed membrane tension. (D) Imposed vertical point force at . The value of is non-zero only during the initial COPII nucleation phase marked in gray. (E) Shape factor and bud height as a function of time. (F) Three-dimensional reconstitution of the transport intermediate and distribution of COPII (magenta) and TANGO1 (green).
Figure 2—video 2
Dynamic of COPII bud formation with functional TANGO1 leads to a stable shallow bud.
Video corresponding to Figure 2B. Membrane tension and COPII self interaction . The final state is a closed bud. (A) Shape of the membrane and distribution of proteins of more than 20% surface coverage. (B) Distribution of COPII and TANGO1 surface coverage as a function of the radius . (C) Imposed membrane tension. (D) Imposed vertical point force , at . The value of is non-zero only during the initial COPII nucleation phase marked in gray. (E) Shape factor and bud height as a function of time. (F) Three-dimensional reconstitution of the transport intermediate and distribution of COPII (magenta) and TANGO1 (green).
Figure 3 with 1 supplement
Transient membrane tension reduction in TANGO1-stabilized buds enables the formation of large procollagen-containing transport intermediates.
A transient decrease of membrane tension mimicking ERGIC membrane recruitment by TANGO1 enables the sequential growth of COPII-TANGO1 transport intermediates. (A) Computational protocol for the applied membrane tension as a function of time. When an equilibrium state is reached, is transiently reduced from to until the transport intermediate grows to either or Then is progressively restored to following a linear ramp of ~10 ms. (B) Resulting shape parameter, , as a function of time. Double-barred lines indicate that the system can remain at equilibrium for an arbitrarily long time. (C) Shape parameter as a function of membrane tension, . Gray regions in (A–C) correspond to low-tension regimes. (D) Three-dimensional rendering of the shape of the transport intermediate and protein surface distribution at the respective points indicated in panels (A–C). Parameters as in Appendix 1—table 1, with (see Appendix 1 for details, and Figure 3—video 1 for a dynamic representation of the simulation).
Figure 3—video 1
Transient membrane tension reduction in TANGO1 stabilized carriers enables the formation of large procollagen-containing transport intermediates.
Video corresponding to Figure 3. Dynamics of an elongated COPII-coated transport intermediate formation with functional TANGO1. Membrane tension is transiently reduced from to and back to allow the transition from a stable shallow bud to a stable 'key-hole' shape, and then growing 'unduloid' shape of larger than 300 nm long, the typical size of a procollagen molecule. To mimic the presence of procollagen in the bud, a minimal neck radius if set at (see Appendix 1 for details). (A) Shape of the membrane and distribution of proteins of more than 20% surface coverage. (B) Distribution of COPII and TANGO1 surface coverage as a function of the radius . (C) Imposed membrane tension. (D) Imposed vertical point force, at . The value of is non-zero only during the initial COPII nucleation phase marked in gray. (E) Shape factor and bud height as a function of time. (F) Three-dimensional reconstitution of the transport intermediate and distribution of COPII (magenta) and TANGO1 (green).
Figure 4 with 1 supplement
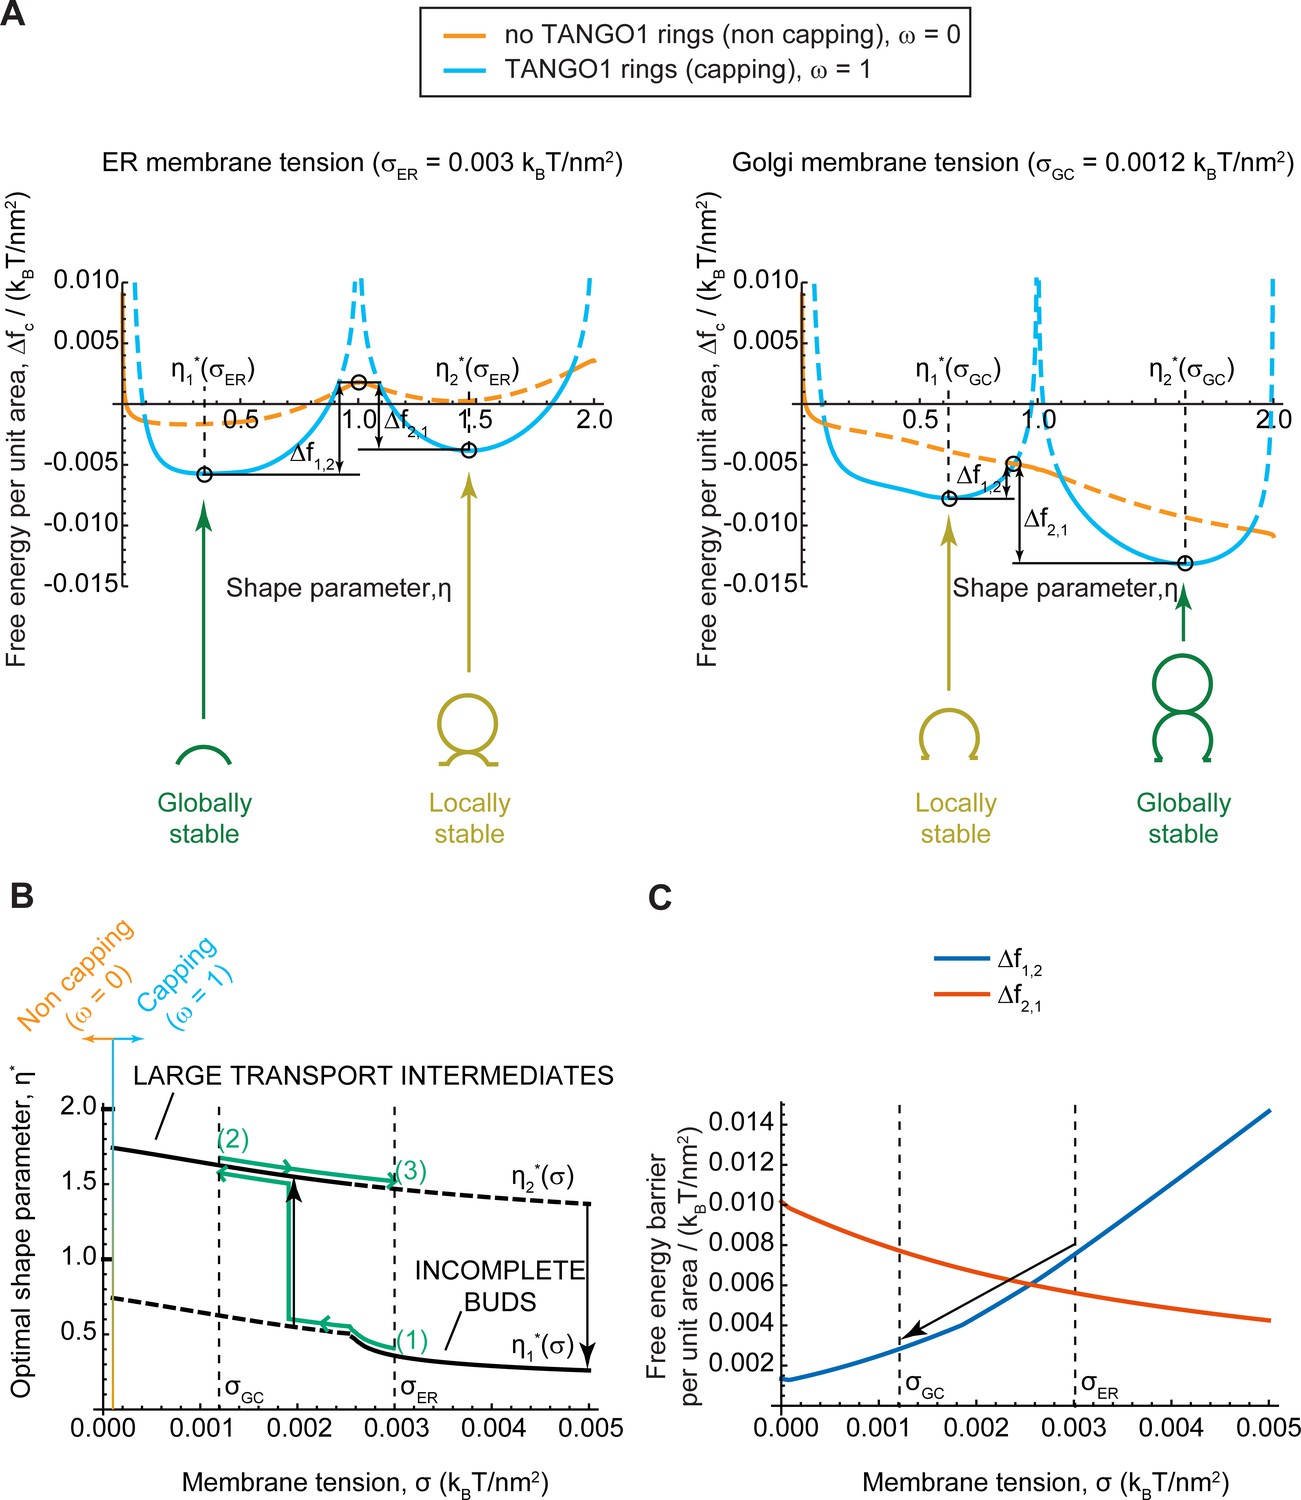
Equilibrium analytic model explains tension-mediated carrier growth in terms of energetically accessible configurations.
(A) Free energy per unit area of the transport intermediate-TANGO1 system, , as a function of the shape parameter, , at typical ER membrane tension (left), and Golgi membrane tension (right), for fully capped (, sly blue curves), and non-capped (, orange curves) cases. Solid lines indicate the locally stable states (lower free energy). Schematics of the transport intermediate shapes for the optimal shape parameters, , are represented at the global and local equilibrium states. (B) Optimal shape parameters,, as a function of the membrane tension, . Globally stable shapes are indicated with solid lines, while locally stables shapes are shown by dashed lines. A transient reduction in the membrane tension (green arrows from point (1) to point (2)) can lead to the growth of the transport intermediate (black vertical arrow), whereas recovery of the tension to the initial value (green arrows from point (2) to point (3)) can keep the system in a kinetically arrested metastable configuration. The capping-uncapping transition is depicted by the orange-to-sky blue gradient line. (C) The free energy barriers separating the incomplete bud from the large intermediate morphologies, (blue line), and (vermillion line) as defined in (A), plotted as a function of the membrane tension, . The arrow illustrates how a decrease in membrane tension reduces the energy barrier for growth of the transport intermediate. All parameter values are reported in Appendix 2—table 1, with no applied force, .
Figure 4—figure supplement 1

Equilibrium analytic model in no capping conditions.
(A) Optimal shape parameters, , as a function of the membrane tension, in a case where no capping is forced (). Globally stable shapes are indicated with solid lines, while locally stables shapes are shown by dashed lines. A transient reduction in the membrane tension (green arrows from point (1) to point (2)) can lead to full closure of the bud neck. This open to full neck closure transition is depicted by the orange-to-sky blue gradient line. Parameter values are reported in Appendix 2—table 1, with no applied force, .
Figure 5

TANGO1 widens the parameter space at which membrane tension regulation can trigger the growth of a stable incomplete carrier.
(A) Phase diagram obtained with Model B displaying the optimal shape parameter as a function of the COPII coat binding energy, , and of the membrane tension, . Different shapes can be identified, from flat uncoated membranes, , to incomplete coated buds, , and to large transport intermediates, . Unless otherwise specified, parameters used for all the calculations are listed in Appendix 2—table 1. ER and Golgi membrane tensions are marked by yellow dashed lines. (B) Shape factor (color code) and final state (symbol) obtained with Model A as a function of membrane tension () and COPII self-interaction (). (i) Inert TANGO1 but functional COPII. (ii) Functional TANGO1 and COPII. Each symbol represents the final state of a dynamic simulation, while iso-contours and colors are interpolated from the values at each symbol. (C) Snapshots of final states obtained for functional TANGO1 at as indicated in panel (B). Note that (i) and (ii) reached local equilibrium states.
Figure 6 with 2 supplements
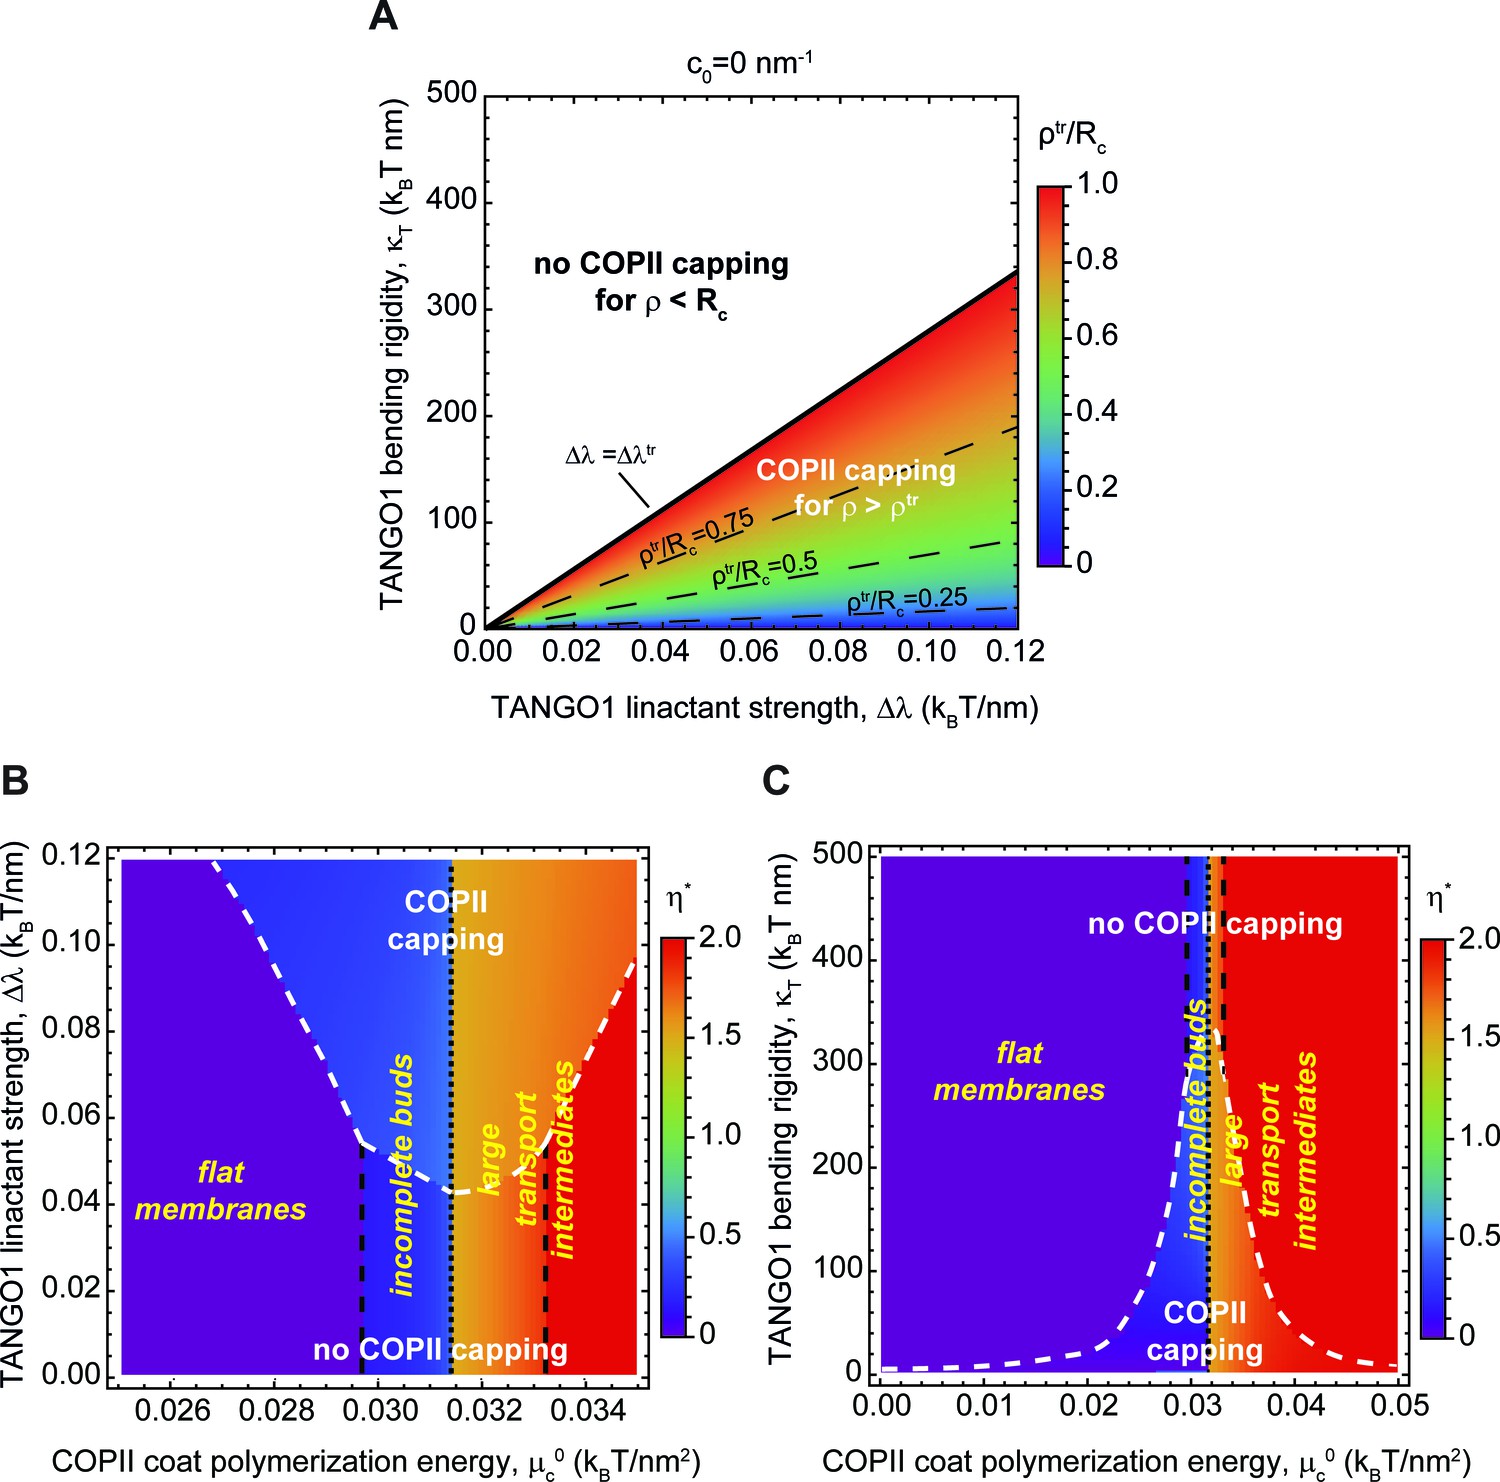
Capping is controlled by TANGO1 bending rigidity and linactant strength.
(A) Capping-uncapping phase diagram where the membrane neck radius at the radius at the trasition, (color-coded), given by Equation 4, is plotted against TANGO1 linactant strength, , and the bending rigidity, , for a filament of zero spontaneous curvature. Below the critical value of TANGO1 linactant strength, , no capping occurs (no functional TANGO1 rings). Isolines for different values of are indicated by the denoted dashed lines. (B,C) Shape diagrams indicating the shape of minimal free energy, represented by the optimal shape parameter, (color-coded), as a function of the COPII coat polymerization energy, , and of the TANGO1 linactant strength, (B), or the TANGO1 filament bending rigidity, (C). Capping-uncapping transitions are marked by thick, dashed, white lines, whereas the different shape transitions are denoted by the different dashed lines.
Figure 6—figure supplement 1
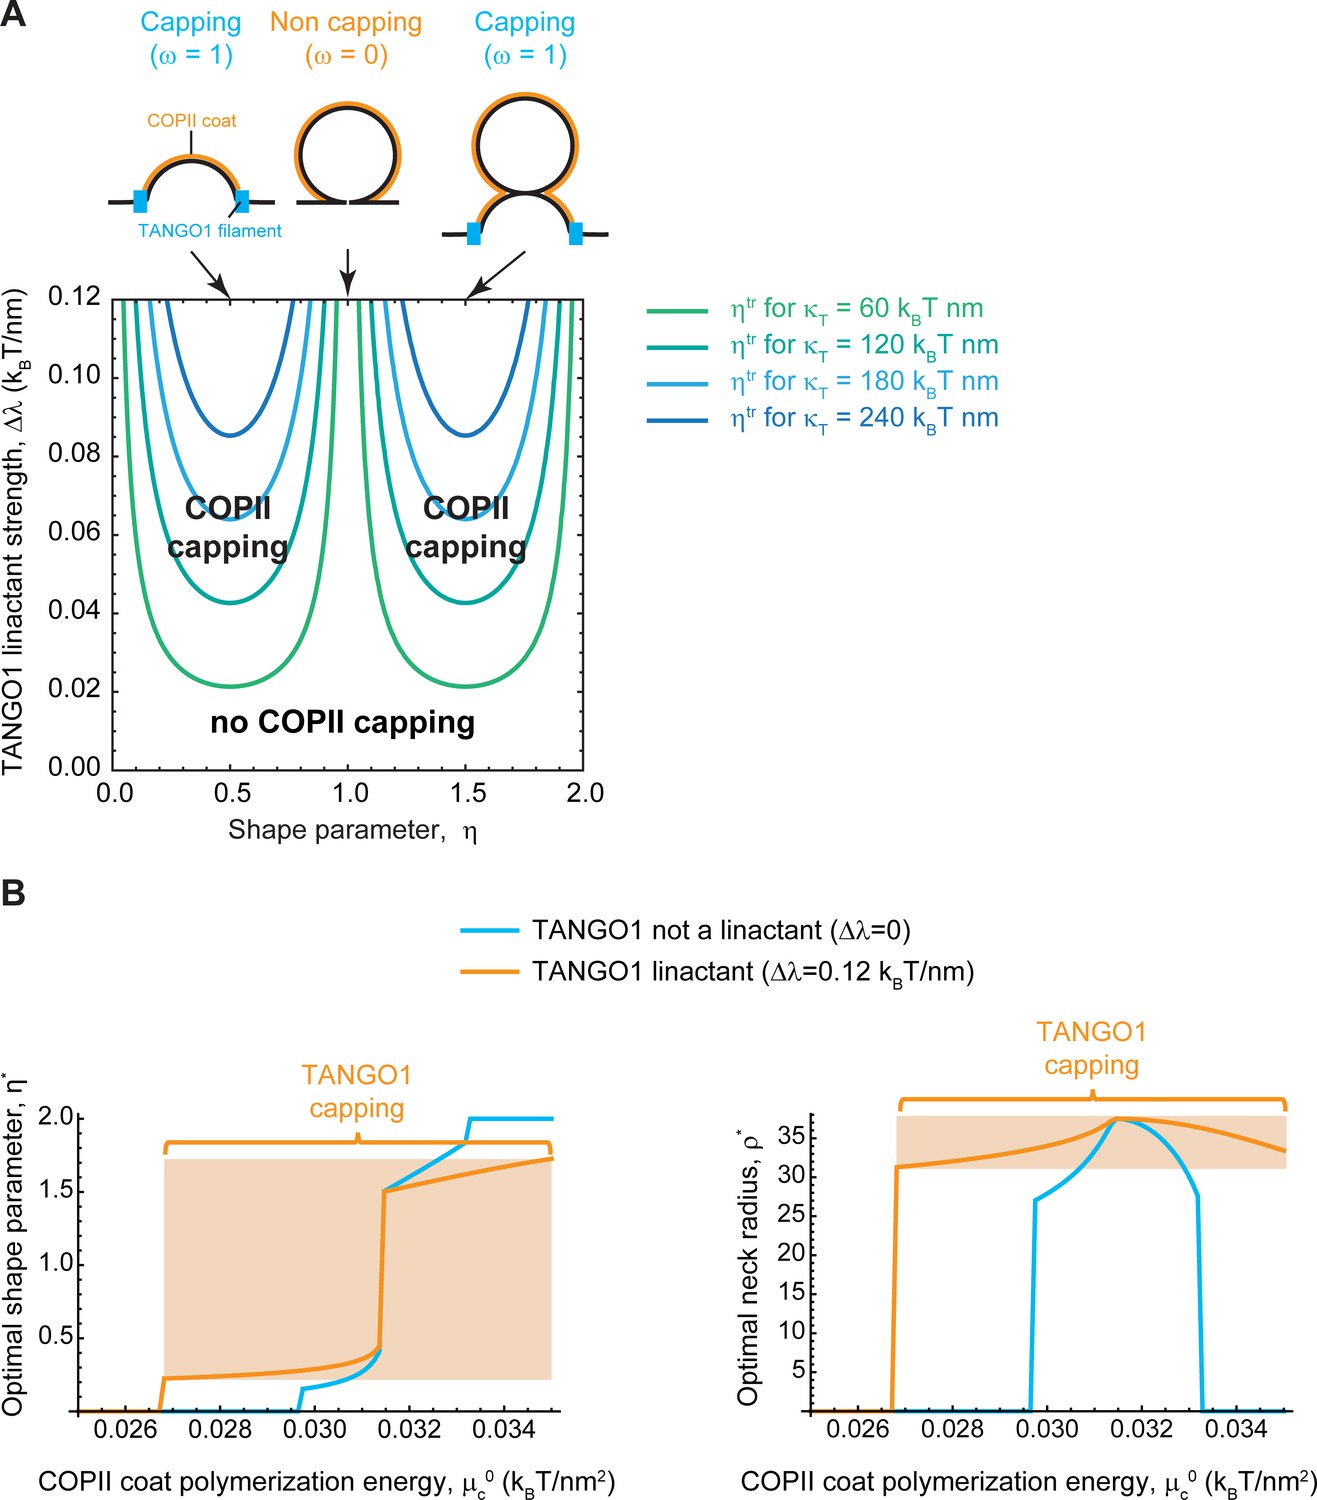
Capping is controlled by TANGO1 bending rigidity and linactant strength.
(A, B) Capping-uncapping transitions of TANGO1 as a function of the shape of the transport carrier, , plotted against the TANGO1 linactant strength, , for different values of the filament bending rigidity, (colored curves). Snapshots of the shapes corresponding to the different pointed values of the shape parameter and indicating the capping-uncapping transitions are shown in the top part of the panel. (B) Plots of the optimal shape parameter, (left plot), and of the optimal neck radius, (right plot), as a function of the COPII coat polymerization energy, , for two discrete values of the TANGO1 linactant strength: (light blue curves); and (orange curves). No capping is observed when TANGO1 is not a linactant, whereas a region of TANGO1 capping is found in the high linactant condition (orange region).
Figure 6—figure supplement 2
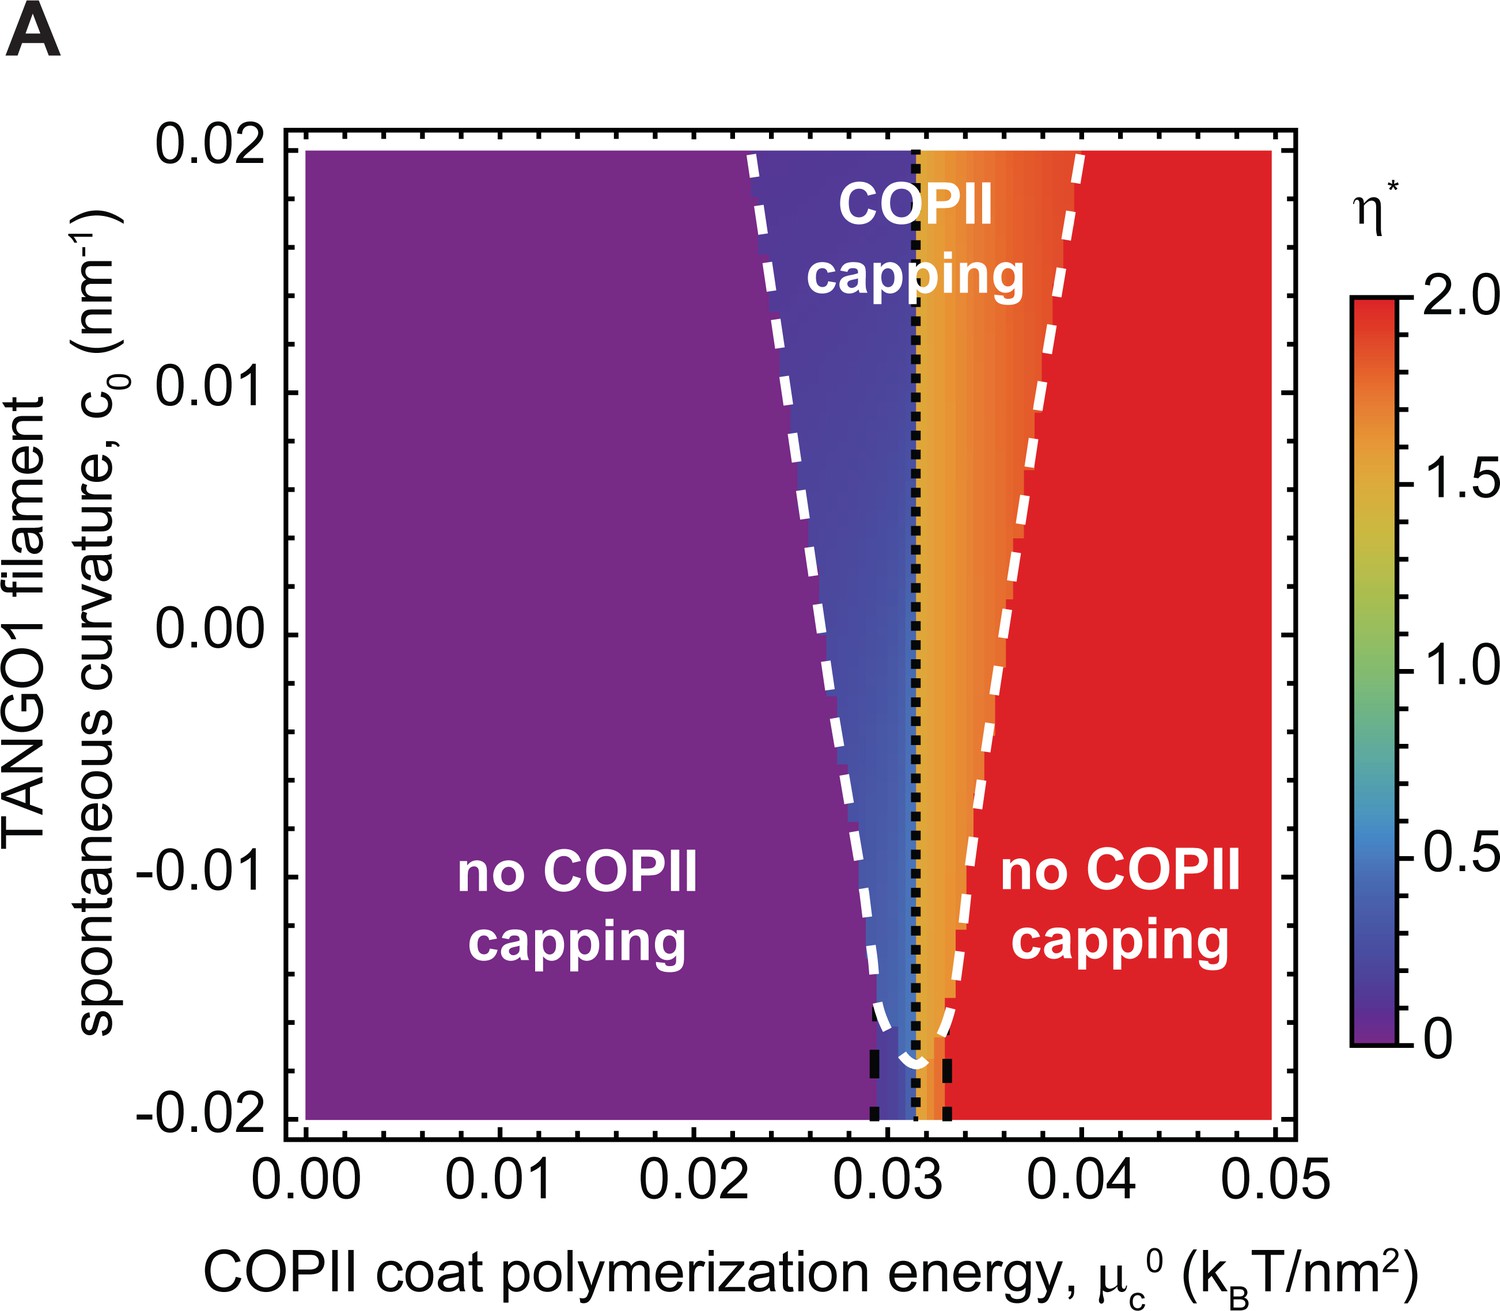
Capping is controlled by TANGO1 filament spontaneous curvature.
(A) Shape diagram indicating the shape of minimal free energy, represented by the optimal shape parameter, (color-coded), as a function of the COPII coat polymerization energy, , and of the TANGO1 filament spontaneous curvature, . Capping-uncapping transitions are marked by thick, dashed, white lines, whereas the different shape transitions are denoted by the different dashed lines.
Figure 7

Outward force shifts capping transitions and facilitates bud formation.
(A, B) Shape diagrams showing the optimal shape parameter, (color coded), as a function of the applied force, , and the COPII coat polymerization energy, , for (A); or the membrane tension, , for (B). (C) Three-dimensional shape diagram, indicating the transition zones between flat membranes (), incomplete buds (), and large transport intermediates () – as given by Equation 5 (light blue surface) and by numerical solution of model B (dark blue and orange surfaces) –, as a function of the COPII coat polymerization energy, , membrane tension, , and applied force, . Unless otherwise specified, the elastic parameters used for all the calculations shown in (A–C) are listed in Appendix 2—table 1.
Figure 8
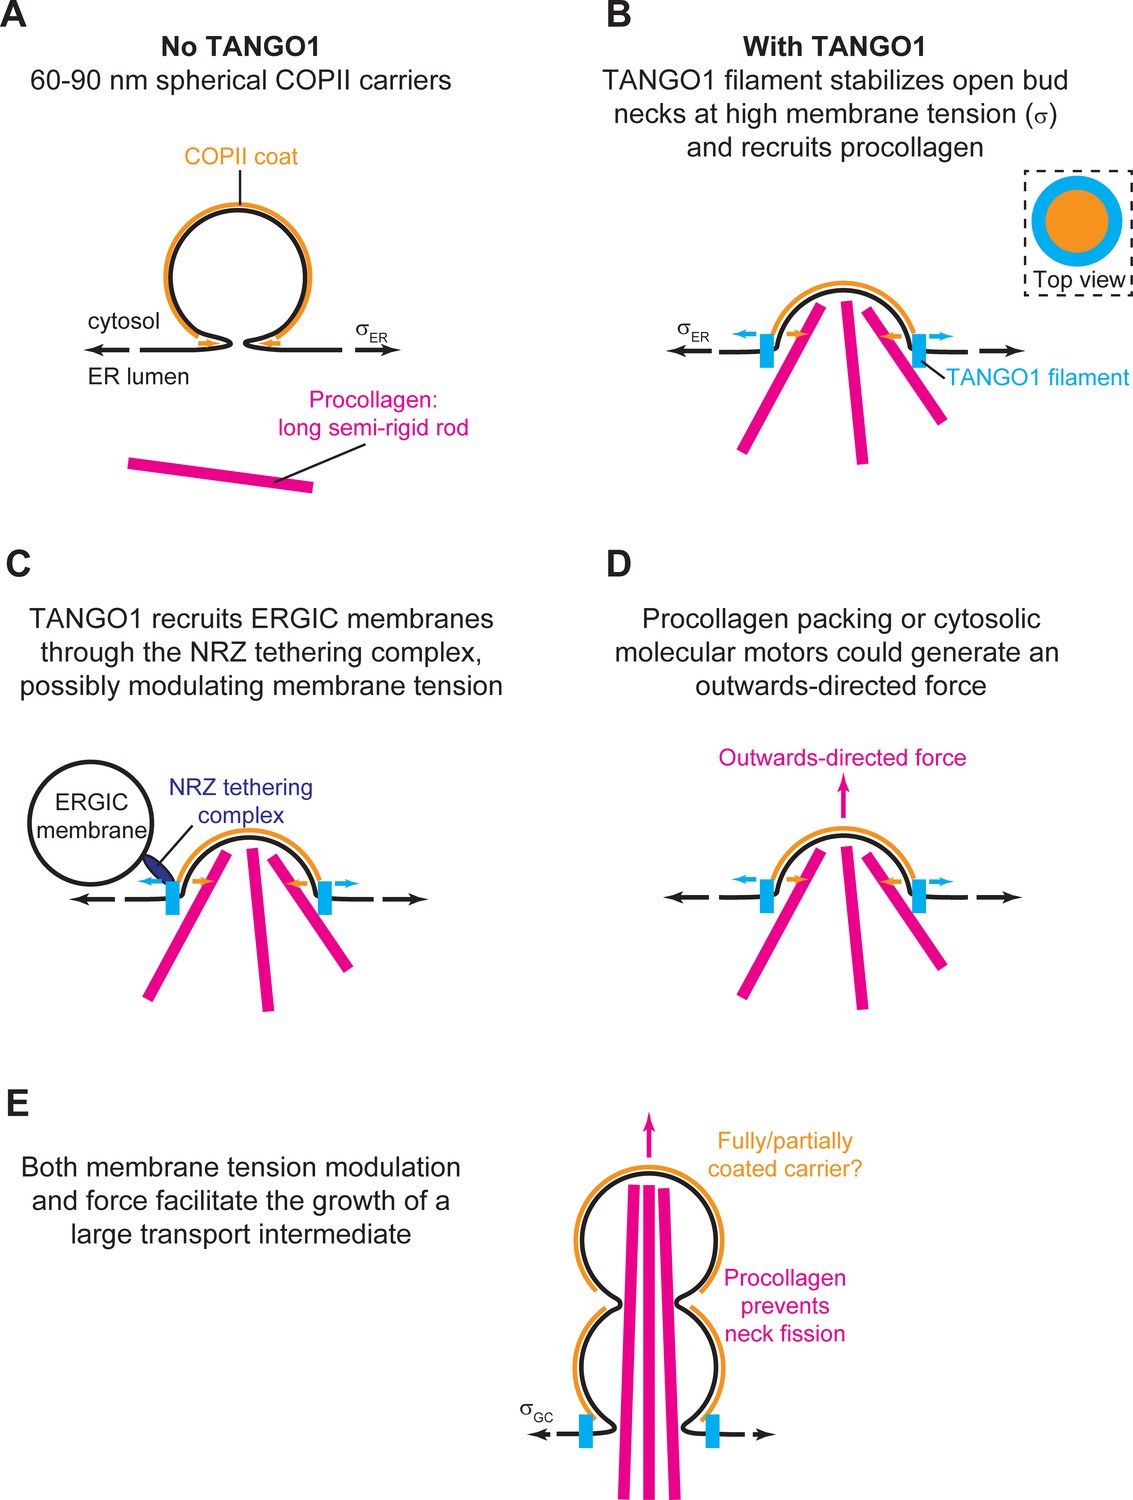
Schematic working model of TANGO-mediated bulky cargo export.
(A) In absence of functional TANGO1, COPII-coated (orange) spherical vesicles assemble normally, generating spherical carriers of between 60–90 nm in size. In absence of TANGO1, procollagens (magenta) cannot be packed into such small carriers. (B) In presence of a functional TANGO1 (light blue), a filament forms capping the base of a growing COPII patch (see top view in the top right subpanel) and packages procollagens to the export sites. At the high membrane tension of the ER, our results showed that this TANGO1 fence stabilizes a shallow bud, which might allow the efficient packaging of export-competent procollagens. (C) The NRZ complex (dark blue), which is recruited to the procollagen export sites by the TANGO1 TEER domain, tethers ERGIC53-containing membranes. (D) A possible outwards-directed force (magenta arrow) facilitates the generation of a large transport intermediate. (E) A combination of membrane tension decrease (possibly mediated by fusion of ERGIC membranes), outwards-directed force, and the polymerization of COPII lattices, contribute to the growth of a large transport intermediate commensurate with long semi-rigid procollagen molecules. The actual shape of the transport intermediate and whether it is fully or only partially coated still remain unknown.
Appendix 1—figure 1
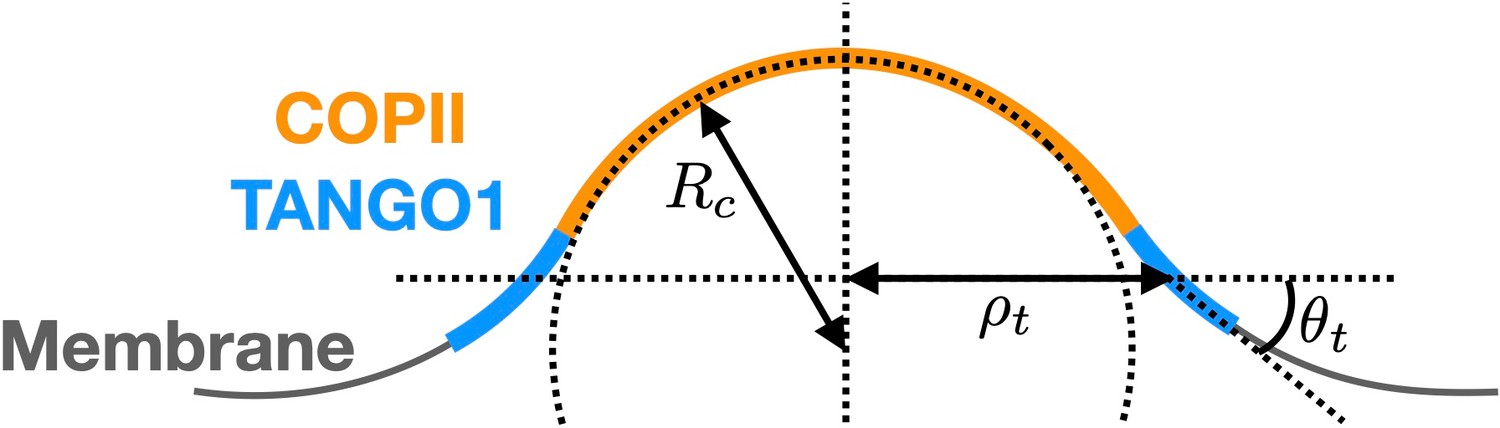
Schematic of a shallow COPII/TANGO1 bud and definition of the geometrical parameters favored by the proteins.
Appendix 2—figure 1
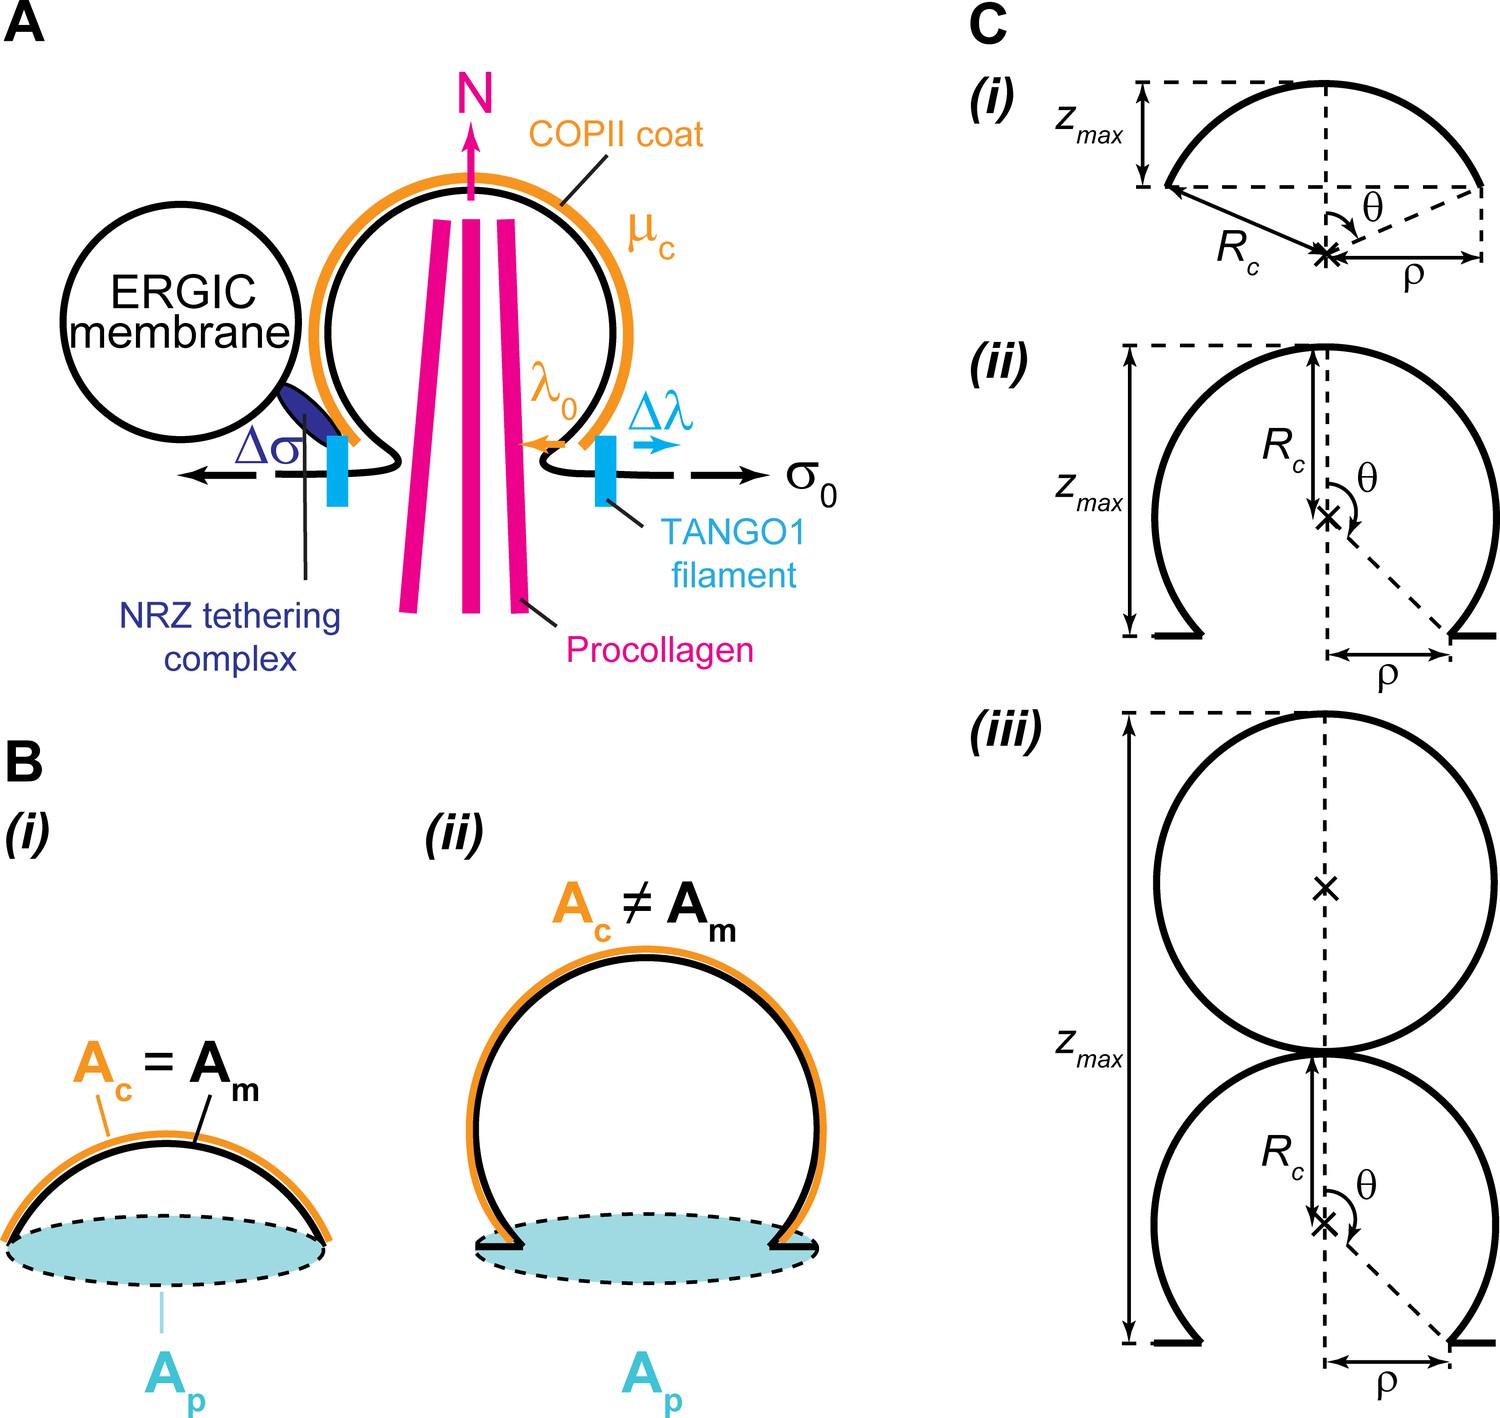
Geometry and physical forces in the transport intermediate generation model.
(A) TANGO1 rings assembling on the ER membrane are depicted in light blue, accounting for a line tension reduction of the COPII coat, . The ER membrane is shown in black, associated with a tension, . The COPII coat polymerizing on the membrane is depicted in orange, and accounts for a coat binding free energy (or chemical potential), , and a COPII coat line tension, . Packaged procollagen rods are shown in magenta, which can (but not necessarily) contribute with a pushing normal force, , and sterically prevent membrane fission. Finally, ERGIC53-containing membranes tethered to the export site through the NRZ complex (dark blue) are shown, which can be a source of membrane tension reduction, . (B) Schematics of the different surface areas used in the model for both shallow (i) and deep (ii) buds: the projected area, , shown in light blue; the membrane area, , shown in black; and the coat area, , shown in orange. (C) Scheme of the carrier geometry used for shallow buds (i), deep buds (ii); and pearled carriers (iii).
Tables
Appendix 1—table 1
Model parameters.
| Symbol | Parameter | Value |
|---|---|---|
| Material parameters | ||
| Membrane bending rigidity | 20 kBT | |
| Preferred radius of curvature of COPII | 35 nm | |
| COPII spontaneous curvature | nm−1 | |
| TANGO1 preferred radius of curvature | 45 nm | |
| TANGO1 preferred angle of curvature | ||
| TANGO1 ring radius rigidity | 120 kBT | |
| TANGO1 ring angle rigidity | kBT nm−2 | |
| ap | Characteristic area of a protein | 100 nm2 |
| COPII self-interaction coefficient | −2 kBT | |
| TANGO1 self-interaction coefficient | −1.2 kBT | |
| Affinity coefficient between COPII and TANGO 1 | −0.4 kBT | |
| COPII interfacial coefficient | two kBT | |
| TANGO1 interfacial coefficient | 0.4 kBT | |
| Coupling interfactial coefficient | 0.4 kBT | |
| Membrane viscosity | N s m−1 | |
| Molecular drag coefficient () | N s m−1 | |
| Model constraints | ||
| COPII protein surface fraction at the open boundary | 0.1 | |
| TANGO1 protein surface fraction at the open boundary | 0.02 | |
| Membrane tension | 0.004–0.0096 kBT/nm2 | |
| N | Vertical axial force (applied for nucleation) | 0–0.56 kBT/nm |
| Minimal neck radius in presence of procollagen molecules | 7.5 nm |
Appendix 2—table 1
Parameters used in the large transport intermediate formation model.
The free energy Equation (2) depends on a number of different parameters, which are described in this table.
| Parameter | Description | Value | Notes | Reference |
|---|---|---|---|---|
| Membrane tension | 0.003 kBT/nm2 (ER); 0.0012 kBT/nm2 (Golgi membranes) | Upadhyaya and Sheetz, 2004 | ||
| Membrane bending rigidity | 20 kBT | Niggemann et al., 1995 | ||
| Radius of curvature of the COPII coat | 37.5 nm | Miller and Schekman, 2013 | ||
| Bare coat line tension | 0.012 kBT/nm | Not measured for COPII. Used the clathrin value as a reference | Saleem et al., 2015 | |
| COPII coat polymerization energy | 0.024 ± 0.012 kBT/nm2 | Not measured for COPII. Used the clathrin values as a reference | Saleem et al., 2015 | |
| TANGO1 filament bending rigidity | 120 kBT nm | Not measured. Range based on standard filament rigidities (see text) | ||
| TANGO1 filament spontaneous curvature | (−0.02, 0.02) nm−1 | Not measured. Range based on observed TANGO1 ring sizes | Raote et al., 2017 | |
| TANGO1 linactant strength | 0.12 kBT/nm | Not measured. Range based on protein-protein affinity (see text) | - | |
| Outwards-directed force | 0 – 5kBT/nm | Not measured. Range based on known intracellular forces | Kovar and Pollard, 2004 (Actin); Block et al., 2003 (Molecular motors) |
Additional files
Download links
A two-part list of links to download the article, or parts of the article, in various formats.
Downloads (link to download the article as PDF)
Open citations (links to open the citations from this article in various online reference manager services)
Cite this article (links to download the citations from this article in formats compatible with various reference manager tools)
A physical mechanism of TANGO1-mediated bulky cargo export
eLife 9:e59426.
https://doi.org/10.7554/eLife.59426


