High-resolution transcriptional and morphogenetic profiling of cells from micropatterned human ESC gastruloid cultures
- Department of Biomedical Engineering, Washington University, United States
- Department of Developmental Biology, Washington University School of Medicine, United States
- Department of Genetics, Washington University School of Medicine, United States
- Center of Regenerative Medicine, Washington University School of Medicine, United States
- Department of Computer Science & Engineering, Washington University, United States
- Division of Nephrology, Washington University School of Medicine, United States
- Institute for Informatics, Washington University School of Medicine, United States
- Department of Biomedical Engineering, University of California, Davis, United States
- Department of Bioengineering, University of Illinois, United States
Figures
Figure 1 with 2 supplements
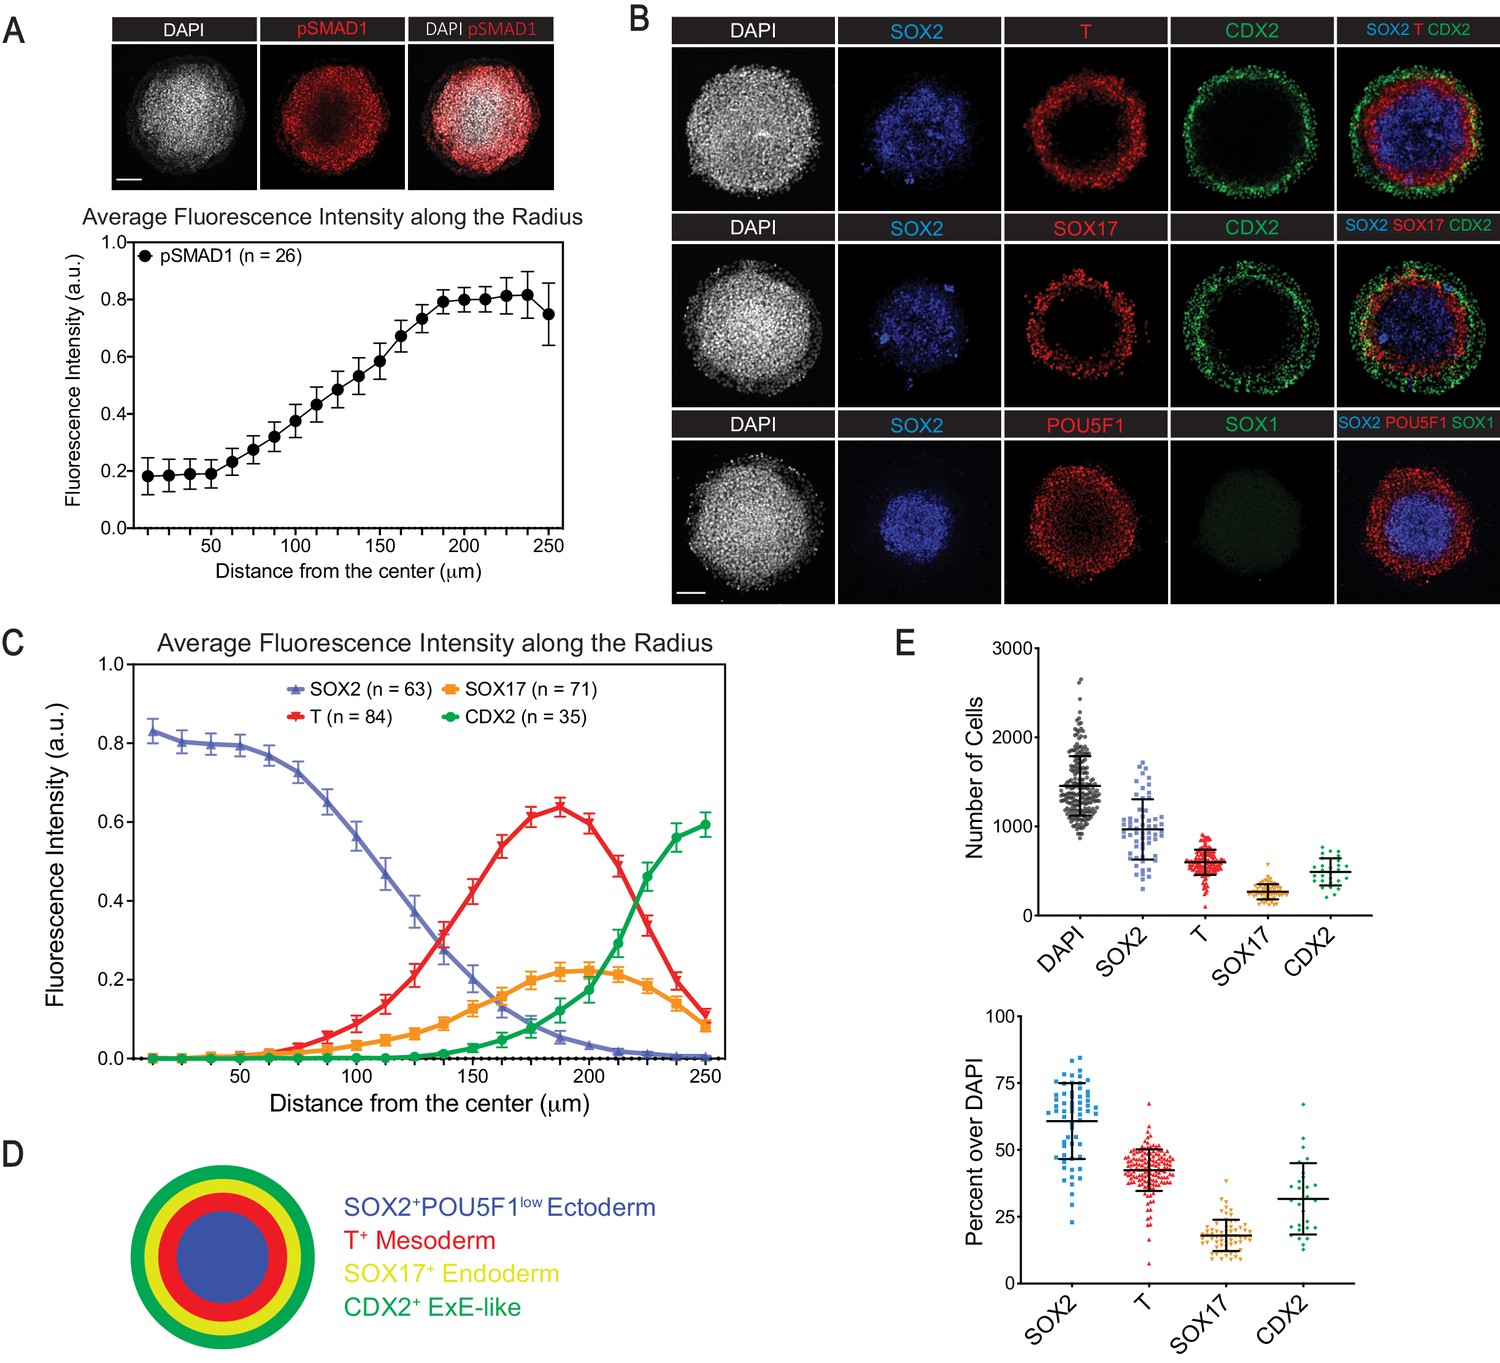
BMP4 induces differentiation of H1 hESCs in Matrigel micro-discs into radially-arranged germ layers and ExE-like cells after 44 hr.
(A) Immunofluorescence images (top) and quantification of fluorescence intensity (bottom) for BMP4 downstream effector pSMAD1 relative to the DAPI fluorescence marking nuclei (N = 4 experiments; n = 26 gastruloids; pSAMD1 fluorescence intensity normalized against that of DAPI for each gastruloid along the radius and average normalized value of all gastruloids is shown; error bar represents standard error of the mean). (B) Immunofluorescence images of ectoderm marker SOX2, mesoderm marker T, endoderm marker SOX17, and TE marker CDX2. (C) Quantification of fluorescence intensity of indicated markers, normalized to DAPI and shown as averages along the radius of gastruloid (N = 2, 5, 6, 4 experiments; n = 63, 84, 71, 35 gastruloids, respectively for SOX2, T, SOX17, CDX2; fluorescence intensity of each marker is normalized against that of DAPI for each gastruloid along the radius and average normalized value of all gastruloids is shown; error bars represent standard error of the mean). (D) Schematic representation of cell differentiation in gastruloids. (E) Total number (top) and fraction (bottom) of cells expressing indicated markers in gastruloids (each dot represents a gastruloid; same number of gastruloids for each marker as in (C); error bars represent standard deviation). Scale bar is 100 µm.
Figure 1—figure supplement 1
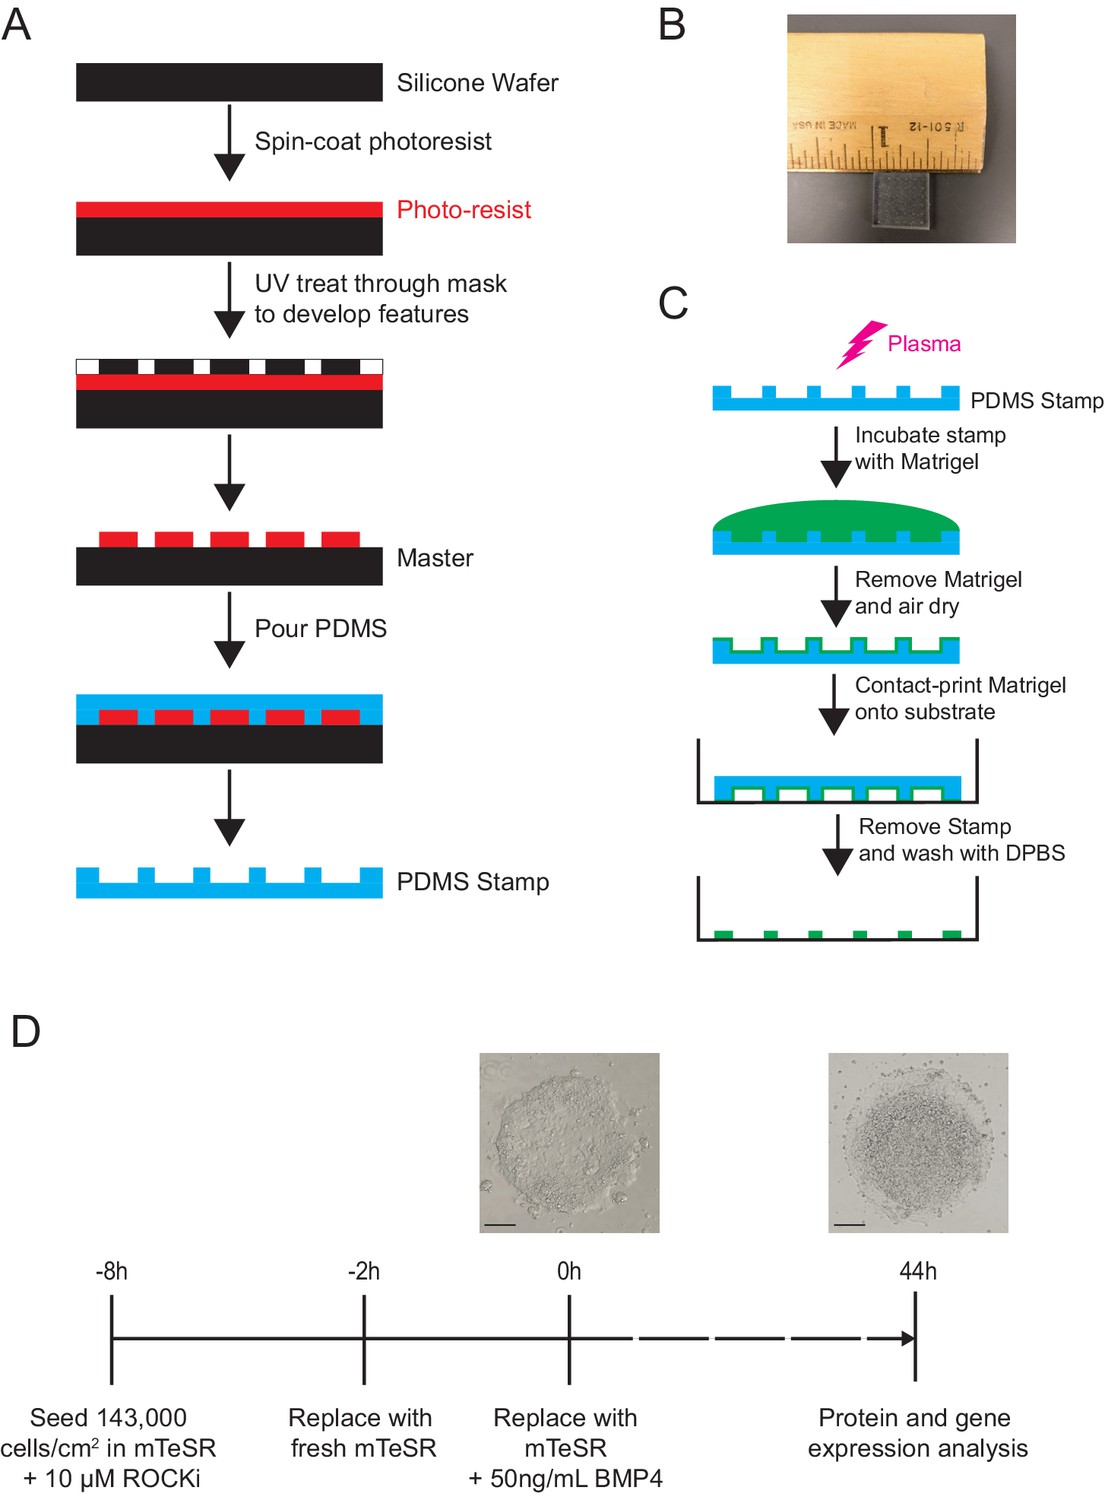
Protocol for microcontact printing method and micropatterned differentiation of gastruloids.
(A) Schematic of protocol for fabricating PDMS (poly-dimethylsiloxane) stamp used in microcontact printing. (B) An image of a typical stamp used in microcontact printing with a ruler and one-inch mark for scale. (C) Schematic of protocol for Matrigel discs microcontact printing using PDMS stamp. (D) Protocol for BMP4-induced gastruloid differentiation.
Figure 1—figure supplement 2
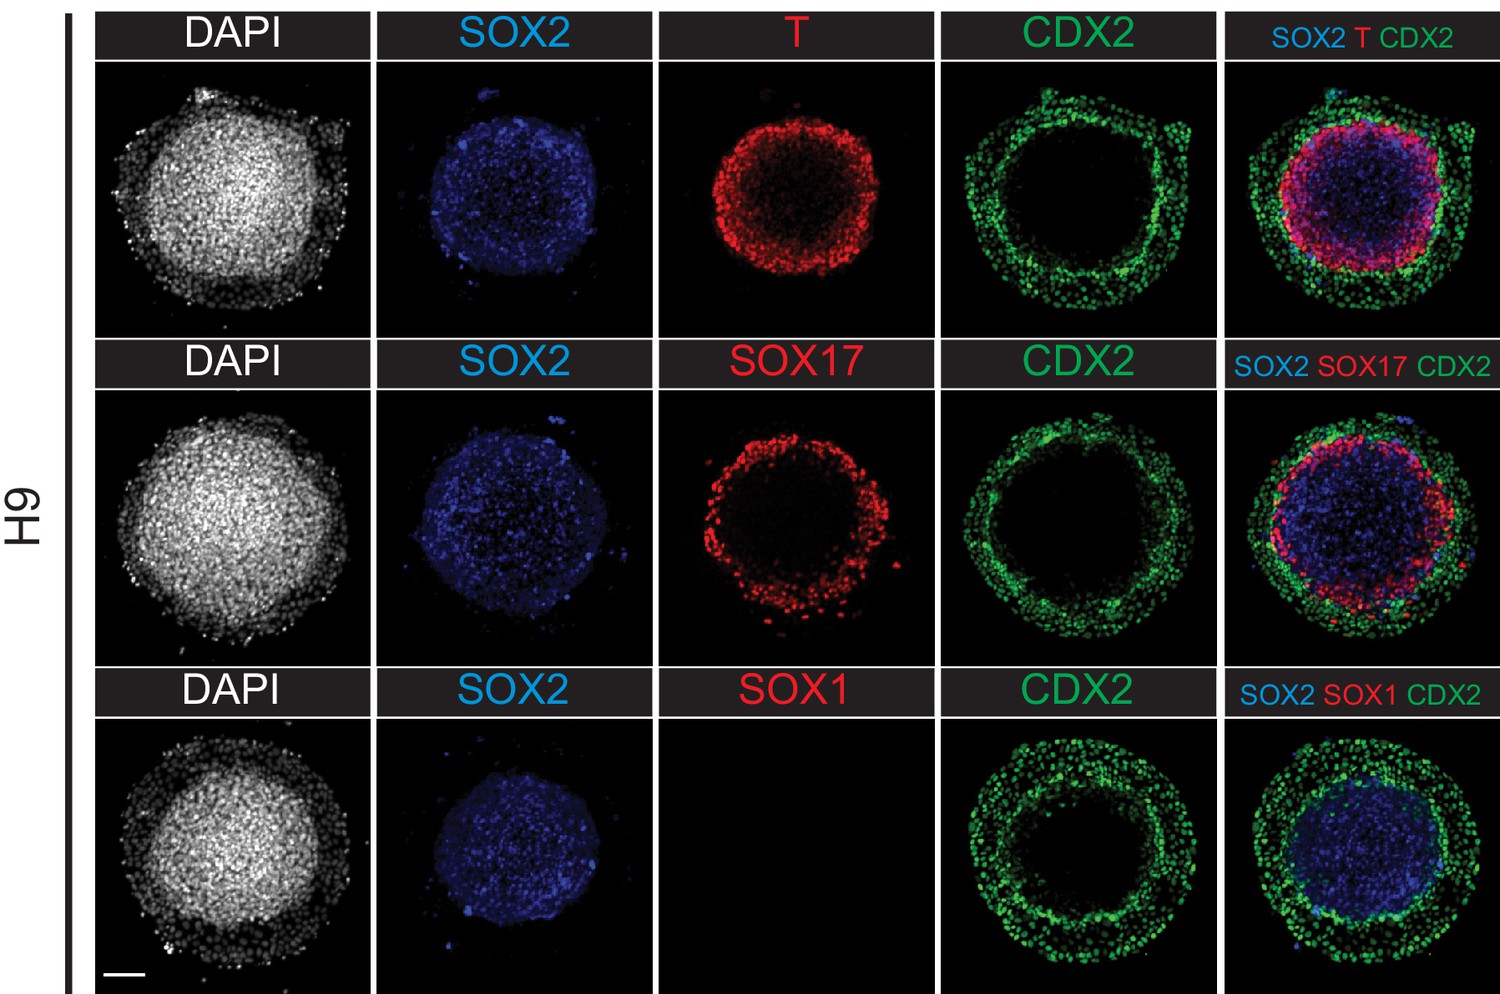
Immunofluorescence images of germ layer and TE markers in H9 hESC micropatterned gastruloid differentiation.
Scale bar is 100 µm.
Figure 2 with 2 supplements
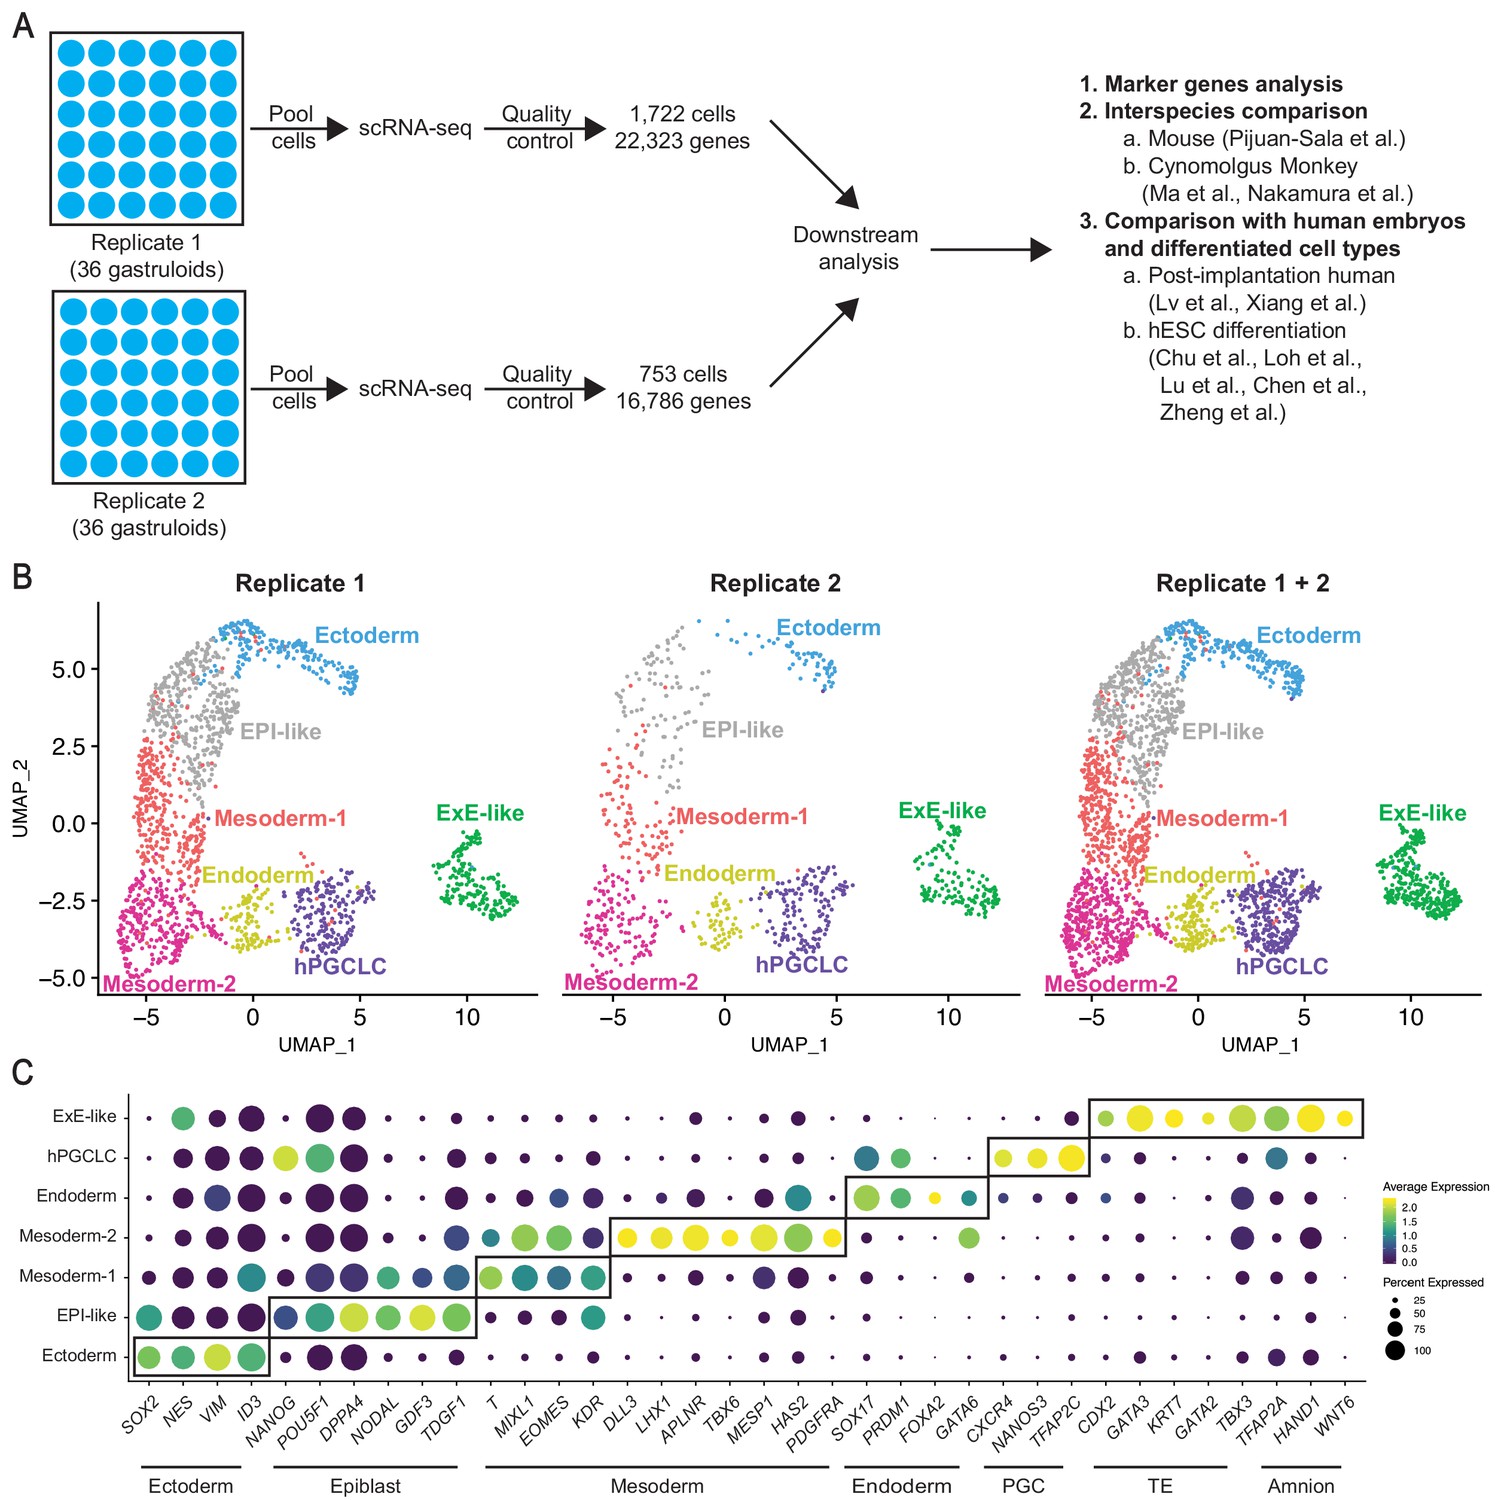
Single-cell RNA-seq profiling reveals cellular complexity of BMP4-induced gastruloids.
(A) Schematic showing scRNA-seq workflow for gastruloids from two biological replicates. (B) UMAP display of seven cell clusters detected by unsupervised clustering in gastruloids replicate 1 (left), replicate 2 (middle), and both replicates combined (right). (C) Dot plot showing expression of canonical markers of ectoderm, epiblast, mesoderm, endoderm, PGC, TE, and amnion in the seven gastruloid clusters (PGC = Primordial Germ Cell; TE = Trophectoderm).
Figure 2—figure supplement 1
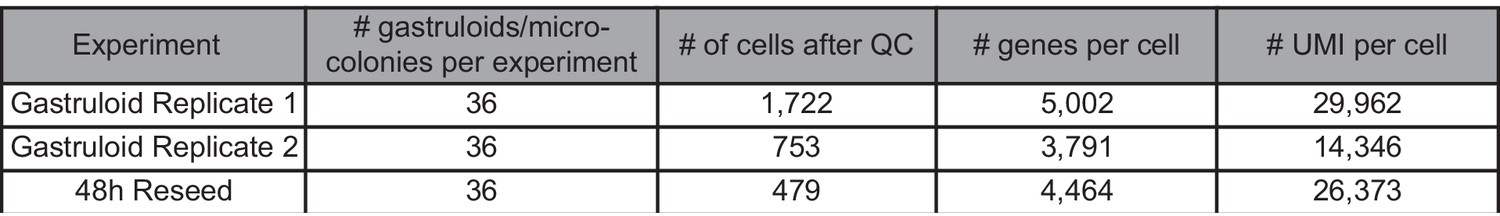
Selected parameters of scRNA-seq analysis.
Figure 2—figure supplement 2
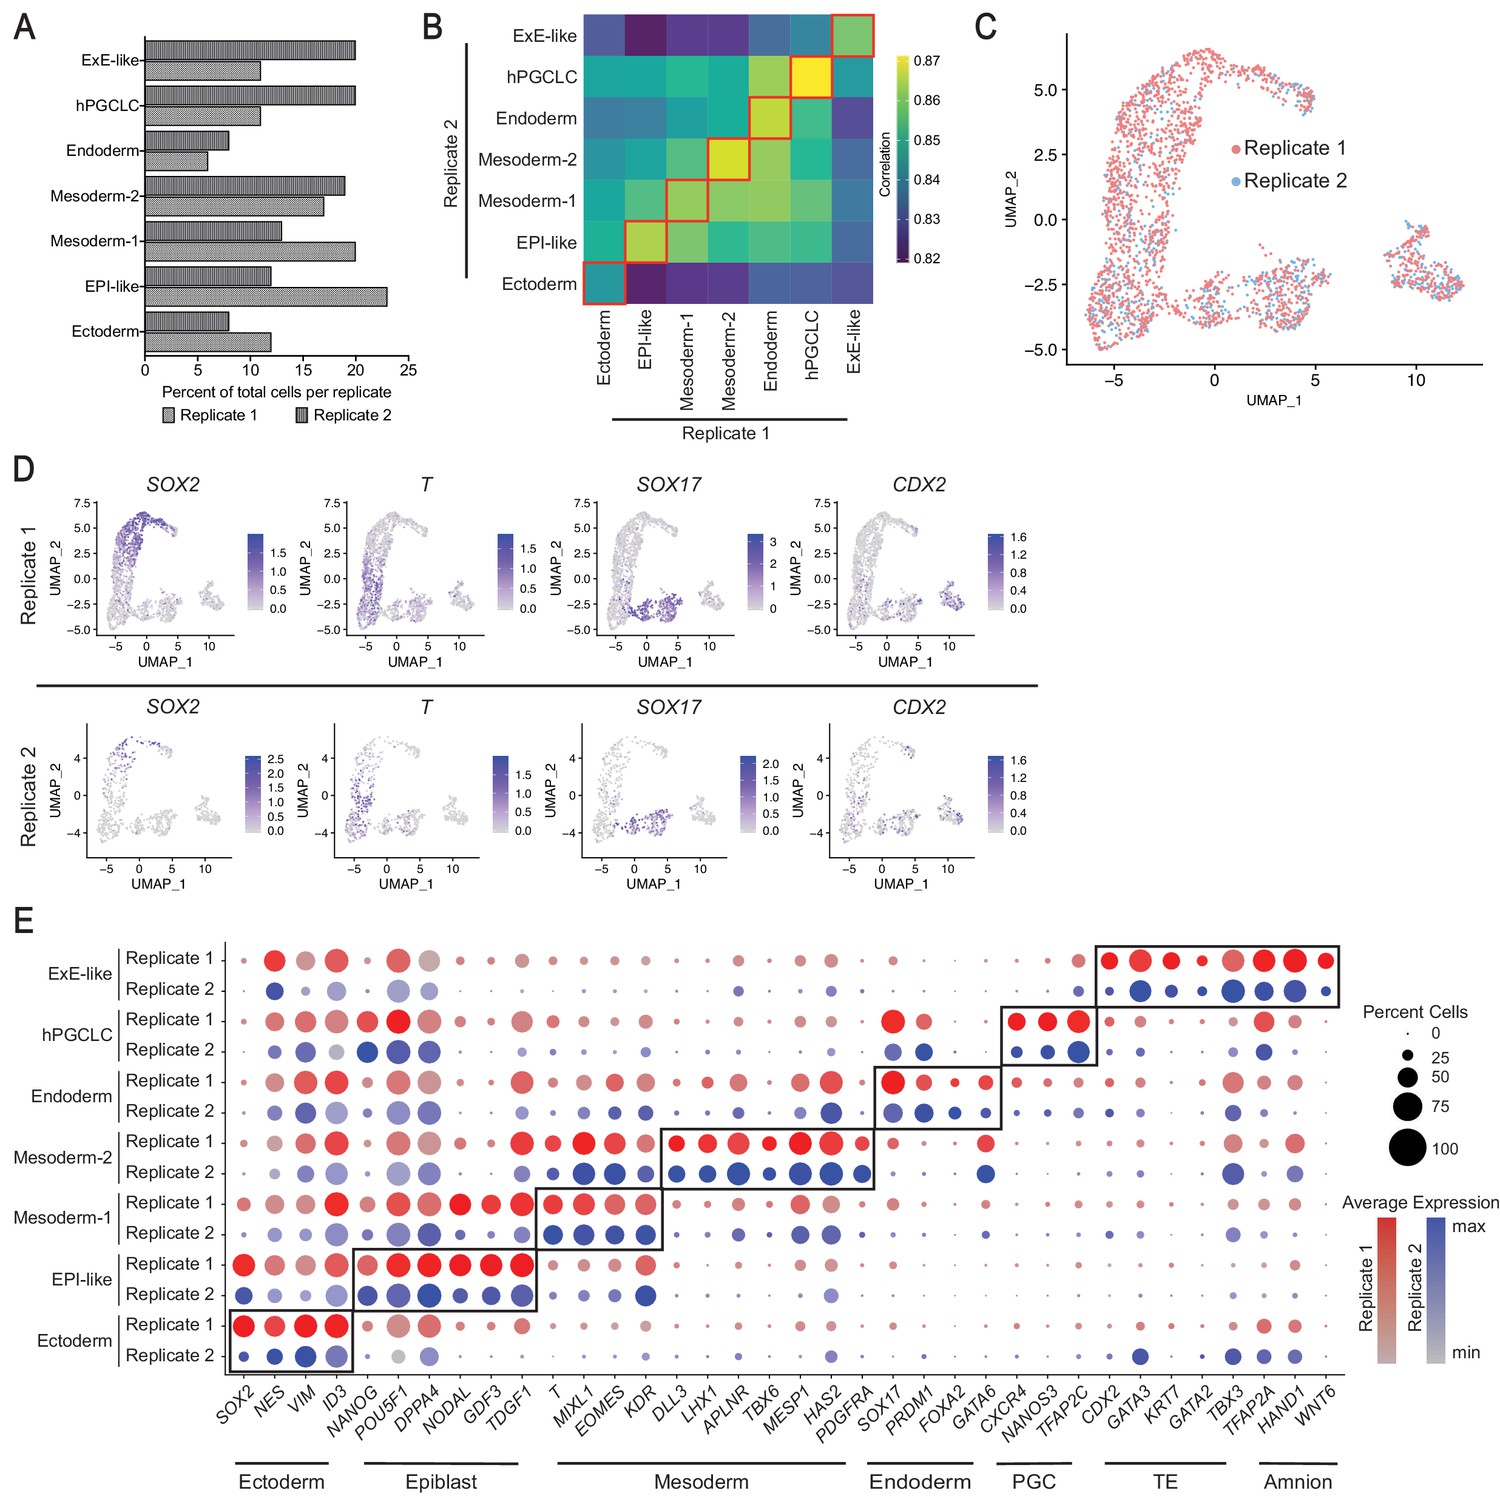
Comparison of gastruloid scRNA-seq datasets from two independent biological replicates.
(A) Bar plot indicating relative proportion of cells in each cluster of replicates 1 and 2. (B) Heatmap showing correlation of average expression of 23,271 total genes between scRNA-seq clusters from replicates 1 and 2. (C) UMAP showing overlap of cells from replicates 1 and 2. (D) UMAP presenting expression of four markers used in immunofluorescence staining in replicates 1 and 2. (E) Dot plot showing expression of canonical markers of ectoderm, epiblast, mesoderm, endoderm, PGC, TE, and amnion in the seven gastruloid clusters in replicates 1 and 2 (PGC = Primordial Germ Cell; TE = Trophectoderm).
Figure 3 with 4 supplements

Cross-species comparison with mouse and cyno monkey gastrulating embryo.
(A, B) UMAP displaying overlap of cells in gastruloids and mouse (A), and monkey (B) at indicated gastrulation stages. (C, D) Bar plots showing composition of predicted mouse (C) and monkey (D) cell stages in all gastruloids, replicate 1, and replicate 2. (E, F) Violin plots showing predicted score of mouse (E) and monkey (F) cell stages in gastruloid cells (ns = not significant; *, **, ***, **** indicates p<0.05, 0.01, 0.001, 0.0001, respectively, one-way ANOVA with Tukey’s multiple comparisons test; dash lines indicate 1 st, 2nd, and 3rd quartiles). (G, H) Gene expression correlation between gastruloids and mouse (G) and monkey (H) developmental stages using top 500 shared highly variable genes. (I, J) Dot plots showing predicted mouse (I) and monkey (J) cell types and stages in gastruloid clusters (Statistical significance of gastruloid cell types’ correspondences to monkey or mouse cell types is calculated by randomized permutation test; PS, primitive streak; postE/L-EPI, post-implantation early/late epiblast; E/L-Gast, early/late gastrulating cells; EXMC, ExE mesenchyme; VE/YE, visceral/yolk sac endoderm; E-PGC, early PGC; E/L-AM, early/late amnion; TE, trophectoderm).
Figure 3—figure supplement 1
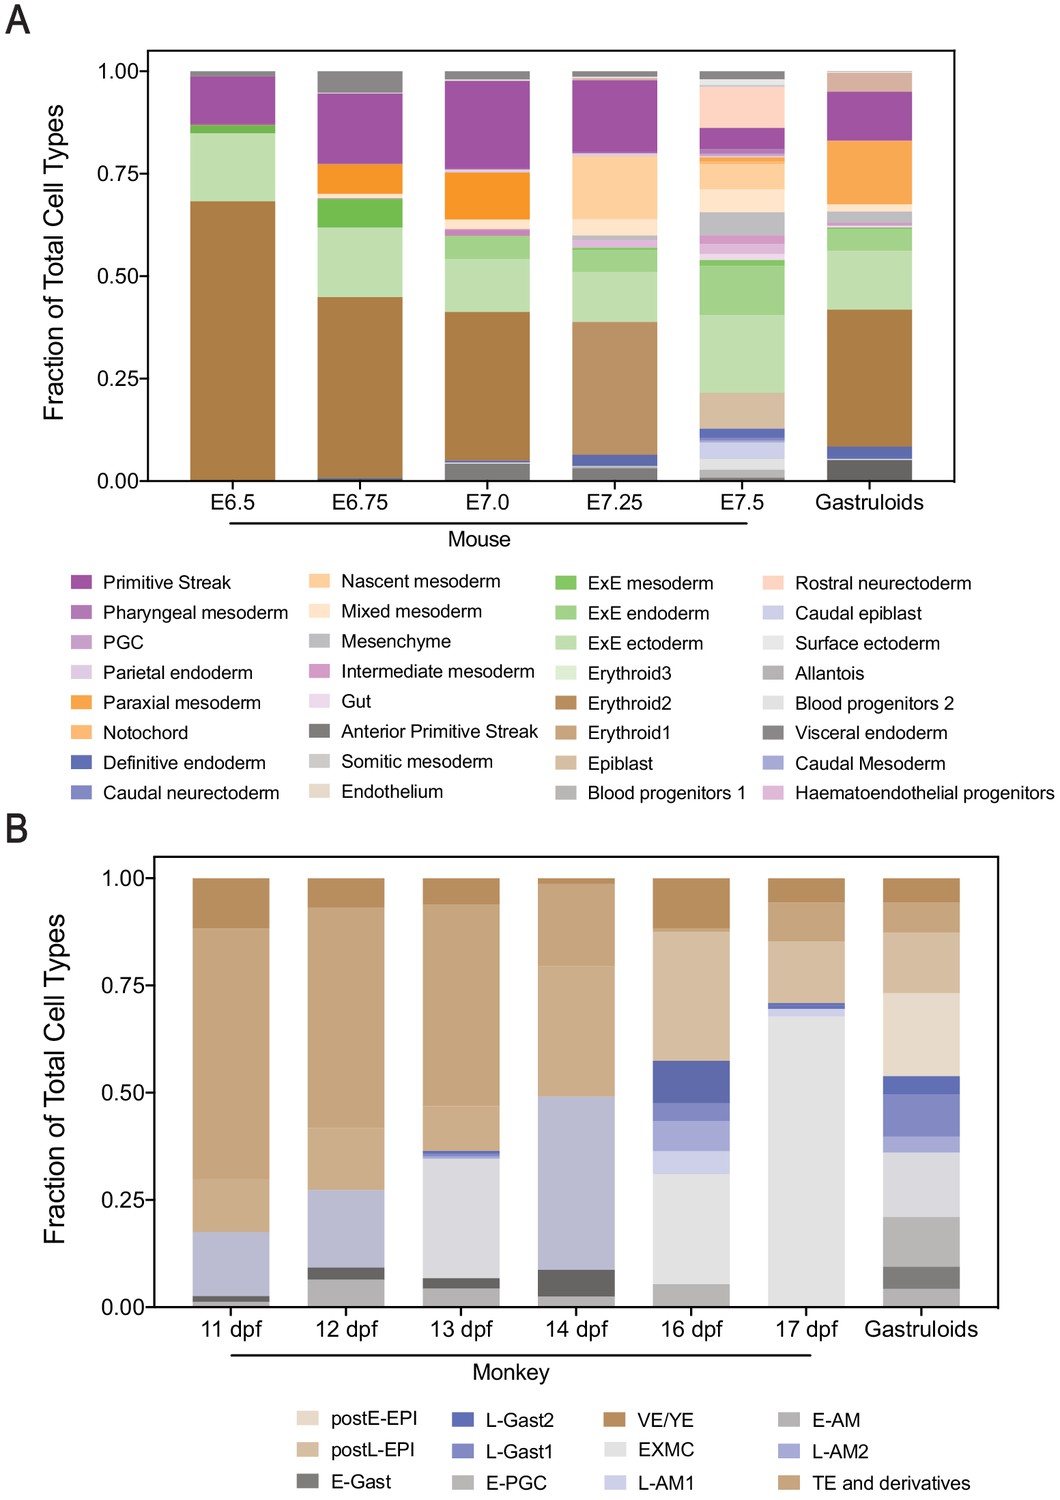
Gastruloids exhibit similar cell type composition profile to early-mid mouse and cynomolgus monkey gastrula stages.
(A, B) Bar plots showing cellular composition of mouse (A) and cynomolgus monkey (B) embryos at indicated stages, and gastruloids with predicted cell types (each color bar represents a cell type).
Figure 3—figure supplement 2

Species comparison shows high similarity between the two gastruloid replicates.
(A, B) Dot plots showing predicted mouse (A) and cynomolgus monkey (B) cell types and stages in each cluster of gastruloid replicate 1 and replicate 2.
Figure 3—figure supplement 3

Species comparison between mouse and cynomolgus monkey gastrulating embryos.
(A) Violin plot showing predicted score of mouse development stages in 16 dpf cynomolgus monkey cells (**** indicates p<0.0001, using one-way ANOVA with Tukey’s multiple comparisons test; dash lines indicate 1st, 2nd, and 3rd quartiles). (B) Correlation of average expression of top 500 shared highly variable genes between indicated mouse and cynomolgus monkey developmental stages. (C) Dot plot showing predicted mouse cell types and stages in cynomolgus monkey cell types (Statistical significance of monkey cell types’ correspondences to mouse cell types is calculated by randomized permutation test).
Figure 3—figure supplement 4
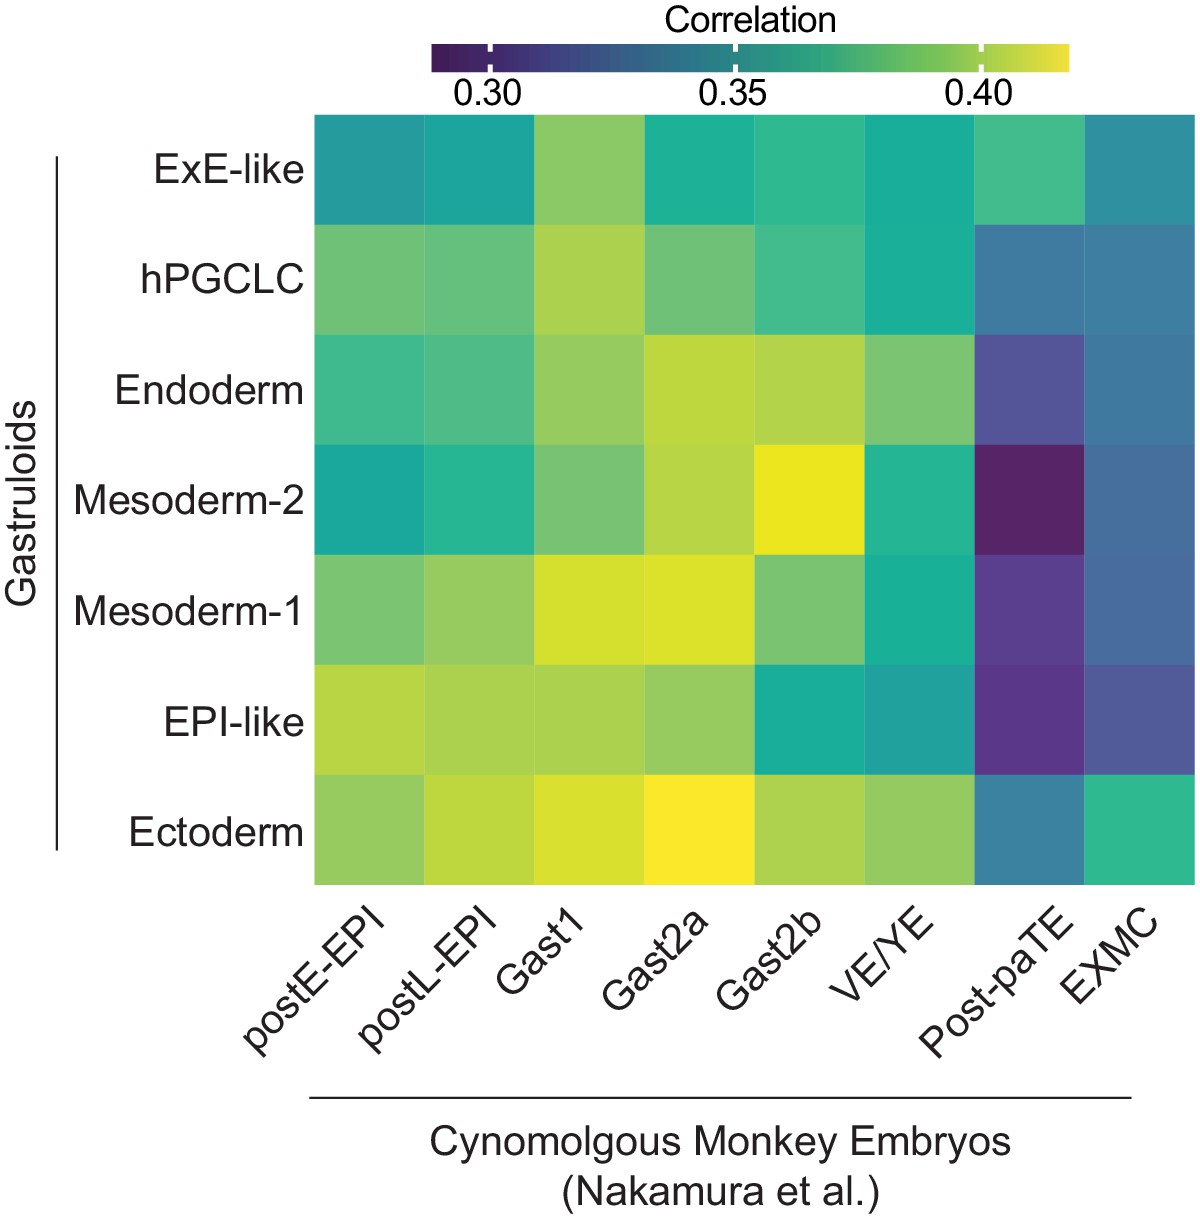
Heatmap of average gene expression correlation between gastruloids and cynomolgus monkey embryos from a separate study.
(Based on 492 shared highly variable genes between gastruloids and cynomolgus monkey dataset from Nakamura et al., 2016).
Figure 4 with 6 supplements
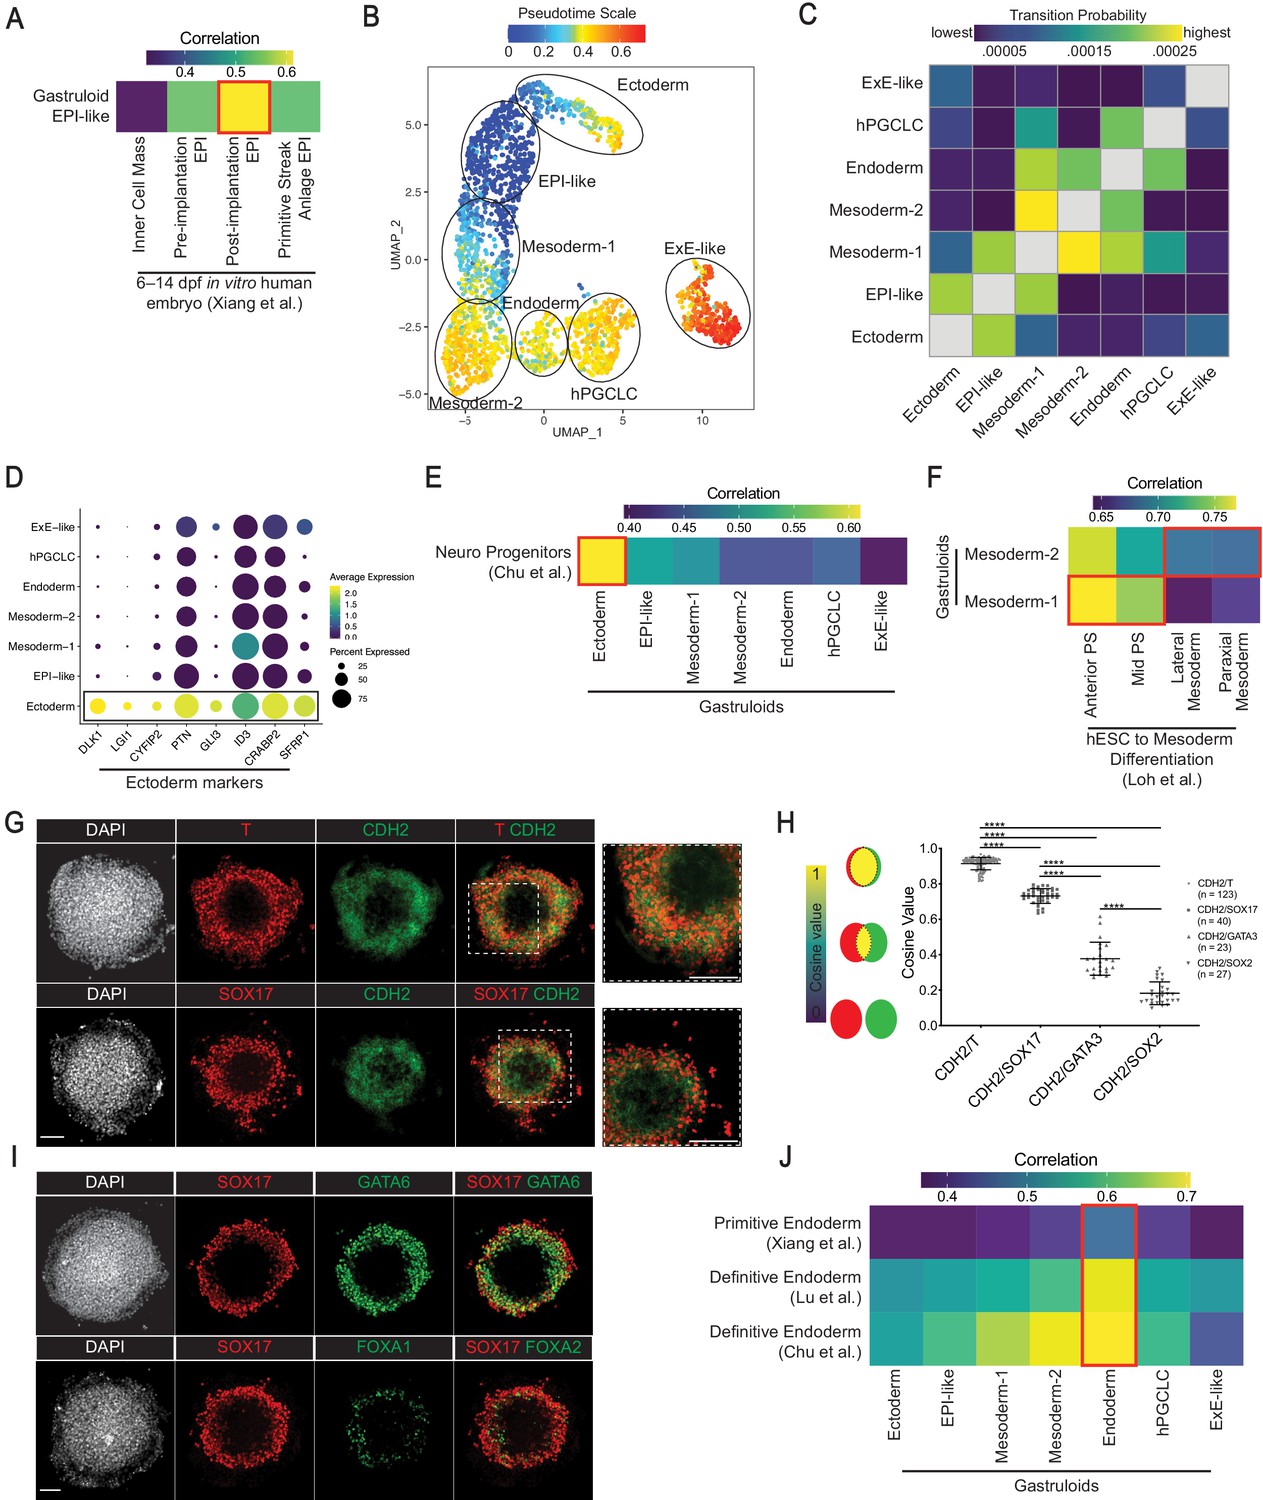
Characterization of gastruloid EPI-like, Ectoderm, Mesoderm, and Endoderm clusters.
(A) Average expression correlation of 434 shared highly variable genes between the gastruloid EPI-like cluster and epiblast-related cell types from in vitro cultured human embryos. (B) UMAP displaying pseudotime overlay in gastruloid clusters. (C) Heatmap illustrating probabilities of a gastruloid cluster transitioning into other clusters. (D) Dot plot showing expression of indicated neural and nonneural ectoderm markers. (E) Average expression correlation of 546 shared highly variable genes between gastruloid clusters and hESC-differentiated neuro progenitors. (F) Average expression correlation of 323 shared highly variable genes between gastruloid Mesoderm-1 and -2 clusters, and hESC-differentiated PS- and mesoderm-related cell types. (G) Immunofluorescence images of CDH2 and indicated markers in gastruloids. (H) Cosine similarity analysis of expression domains between CDH2 and indicated markers (each dot represents a pair of indicated markers in a gastruloid; number of gastruloids used for each pair of indicated makers shown right of the chart; ****p<0.0001, one-way ANOVA with Tukey’s multiple comparisons test; error bars represent standard deviation). (I) Immunofluorescence images of primitive endoderm marker GATA6 and definitive endoderm maker FOXA2 in gastruloids. (J) Average gene expression correlation between gastruloid clusters and hESC-differentiated definitive endoderm, and primitive endoderm from in vitro cultured human embryos (based on 434, 374, and 546 shared highly variable genes with Xiang et al., Lu et al., and Chu et al., respectively). Scale bar is 100 µm.
Figure 4—figure supplement 1
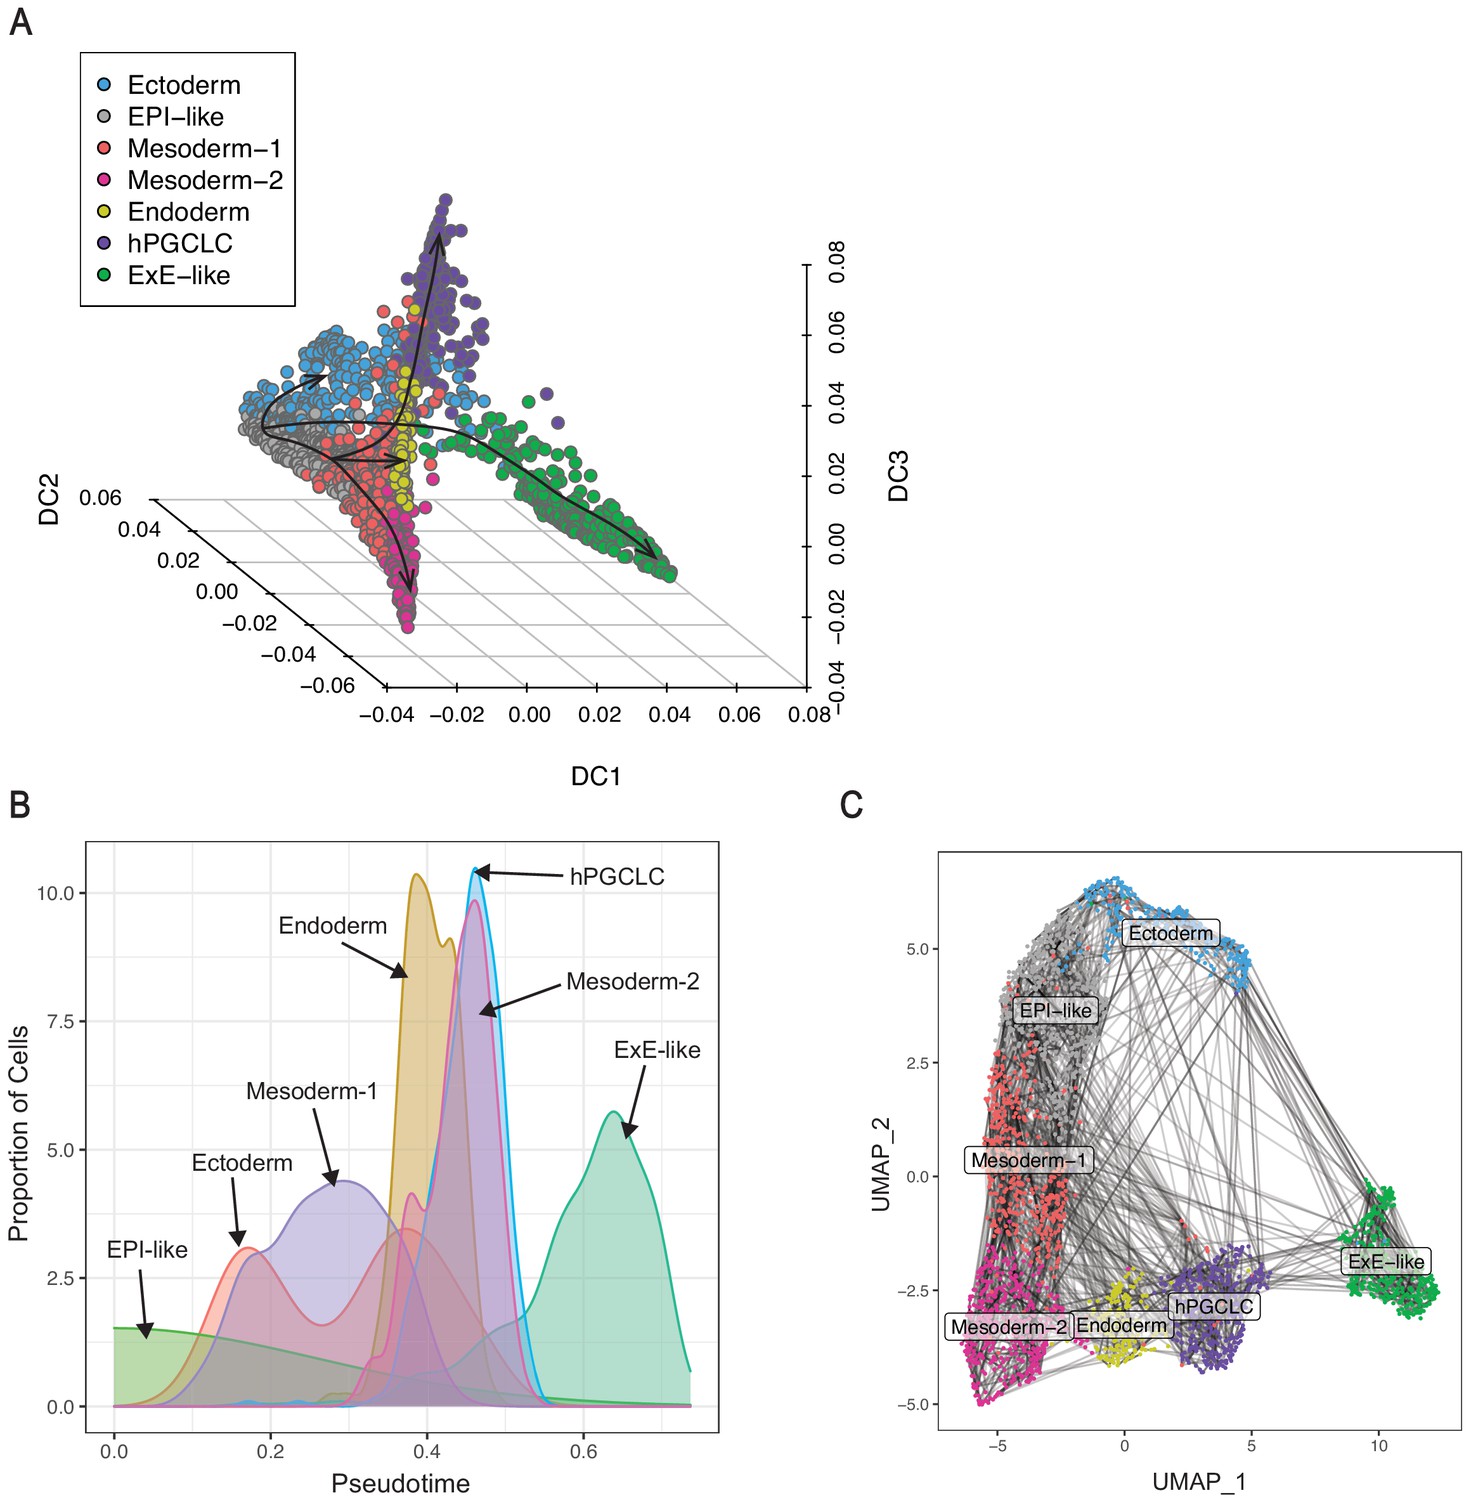
Pseudotime and transitional probability analyses in gastruloid clusters based on diffusion maps.
(A) 3D plot showing gastruloid clusters in the first three diffusion coordinates (arrow lines indicate plausible differentiation trajectories). (B) Chart illustrating proportion of cells from all gastruloid clusters along the pseudotime. (C) UMAP plot showing all gastruloid clusters overlaid with transition probabilities (each line indicates transition probability between pairs of cells; 10,000 highest cell-to-cell transition probabilities shown).
Figure 4—figure supplement 2
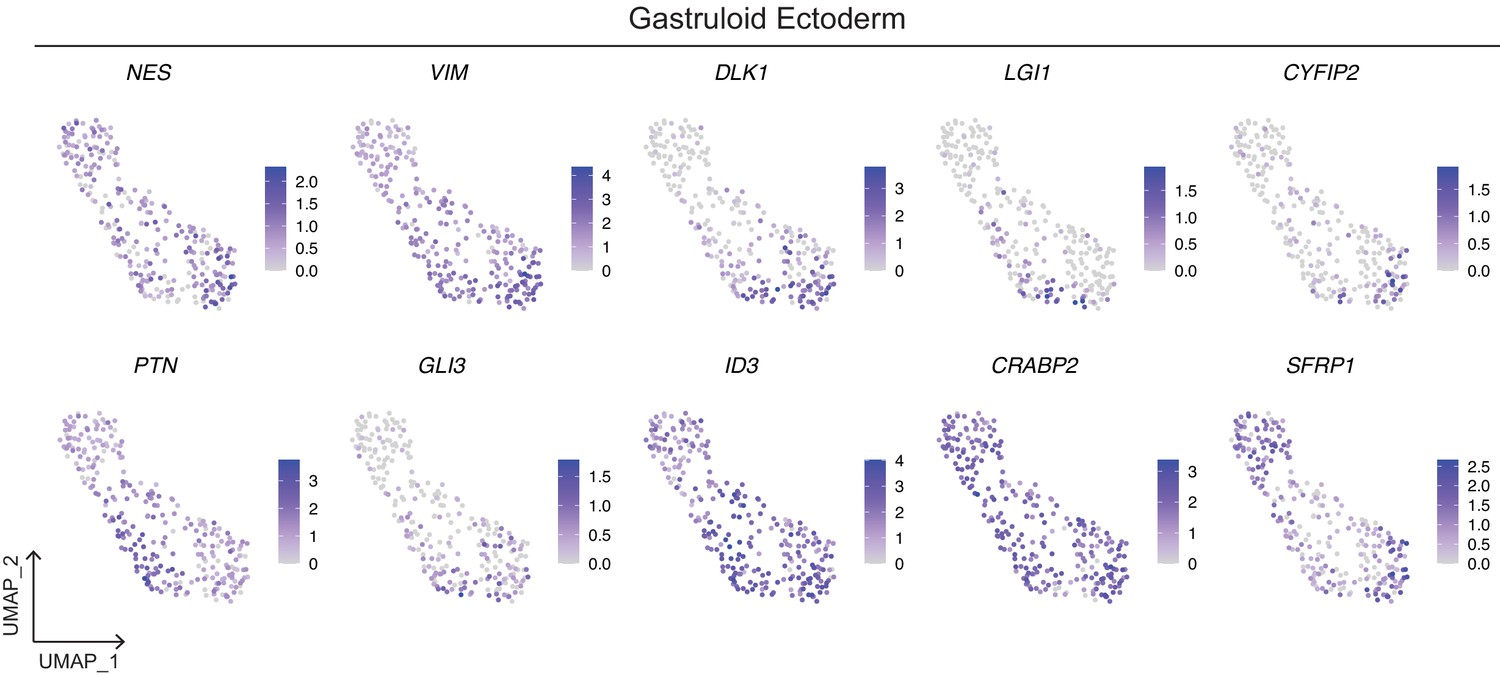
Expression of neural and surface ectoderm markers in the gastruloid Ectoderm cluster.
Figure 4—figure supplement 3
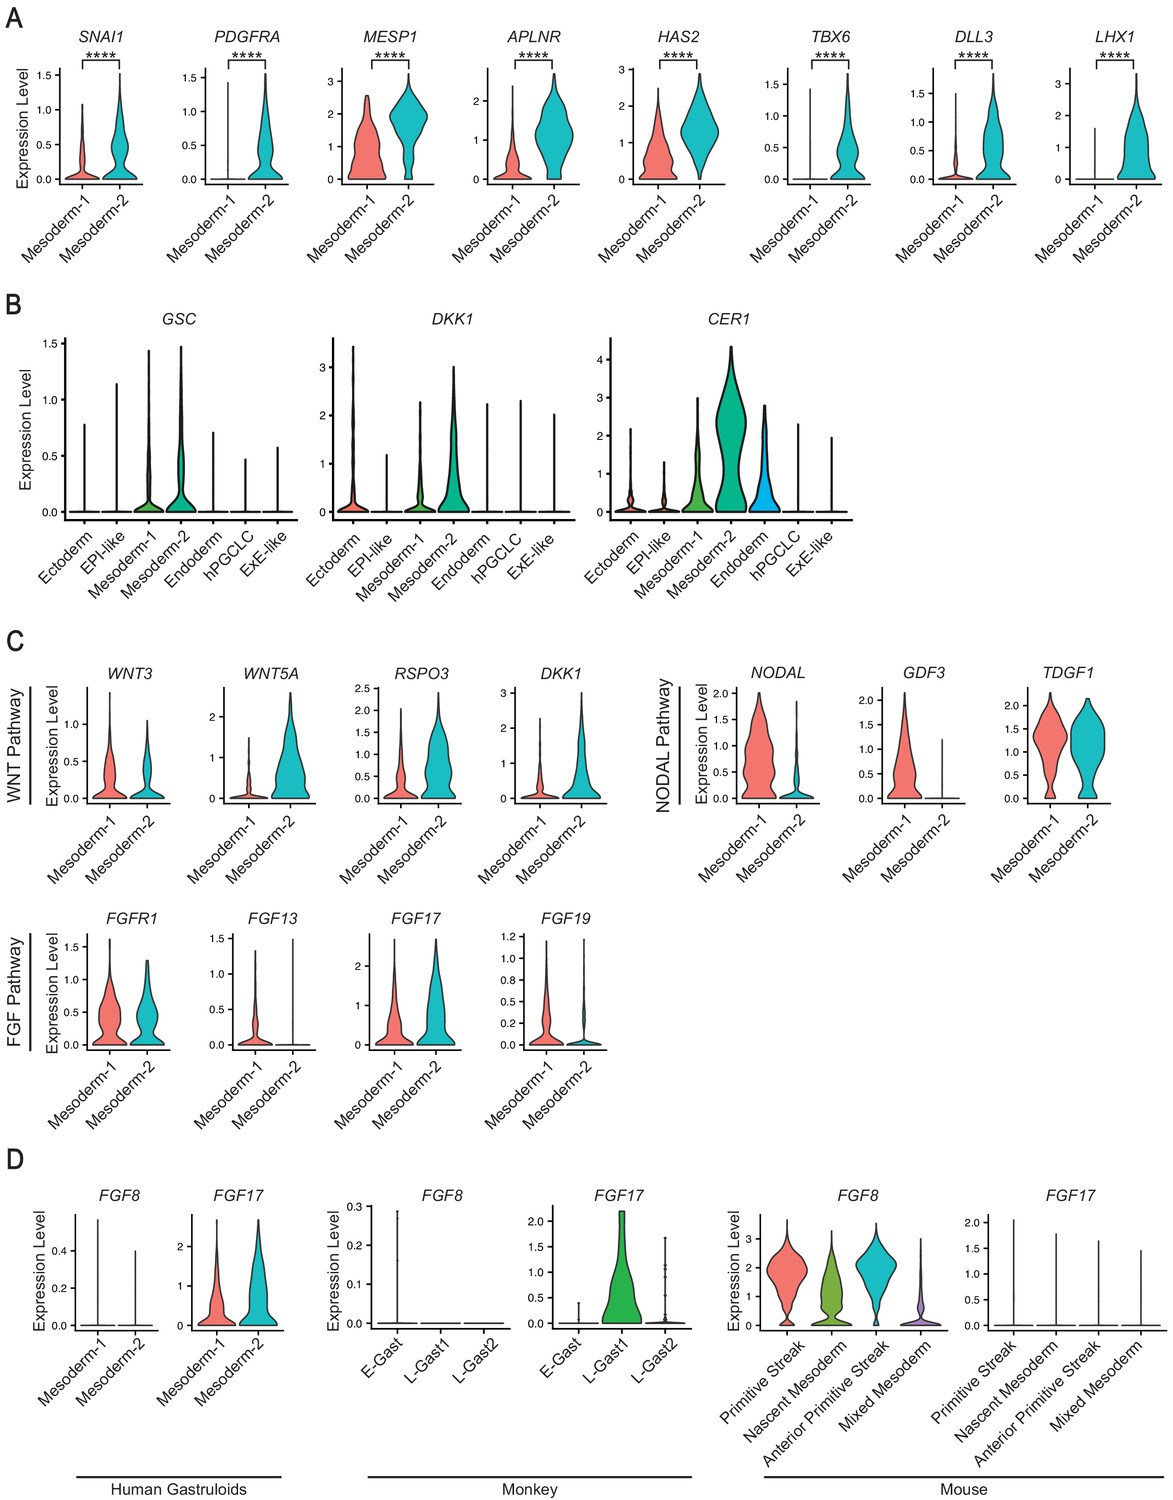
Expression of selected markers in gastruloid mesoderm clusters.
(A) Violin plot showing expression of indicated mesoderm markers in the gastruloid Mesoderm-1 and -2 clusters (**** indicates p<0.0001 using Mann-Whitney test). (B) Violin plot showing expression of indicated markers for organizer cells in gastruloids. (C) Violin plots showing expression of WNT, NODAL, and FGF pathway components in the gastruloid Mesoderm-1 and -2 clusters. (D) Violin plots showing expression of FGF8 and FGF17 in the gastruloid Mesoderm-1 and -2 clusters, monkey gastrulating cells, and mouse primitive streak and mesoderm cells (E/L-Gast = early/late gastrulating).
Figure 4—figure supplement 4
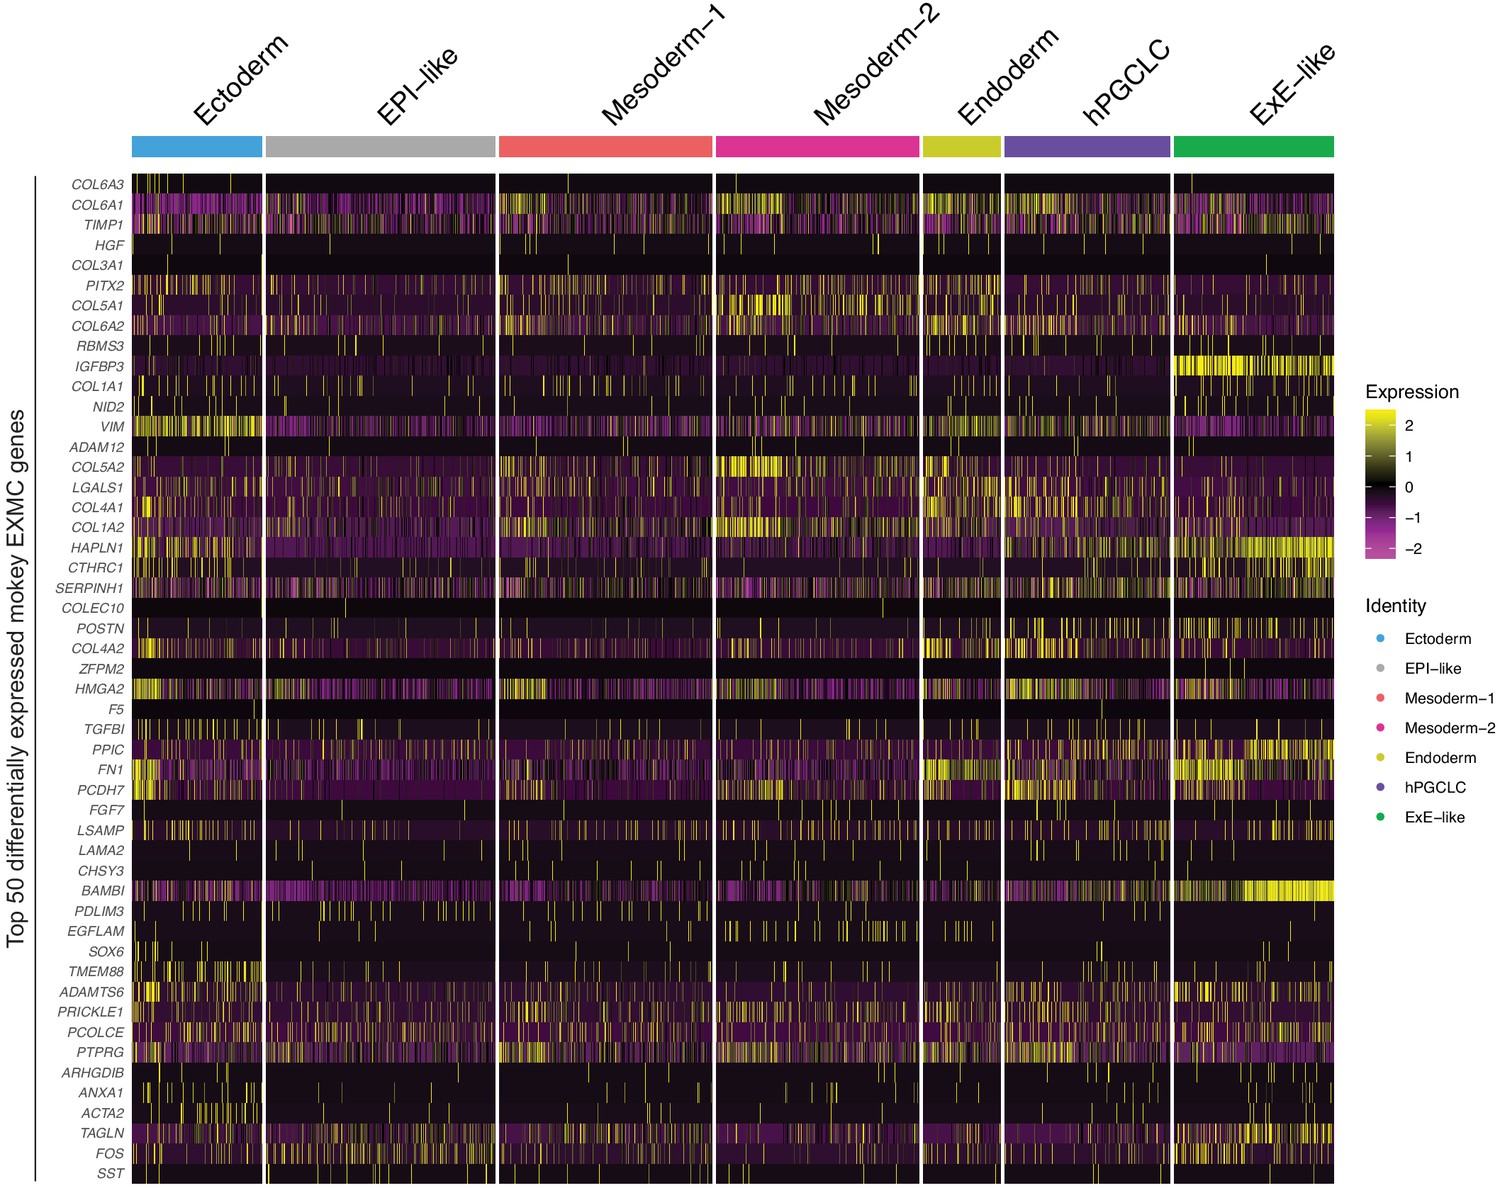
Expression of top 50 differentially expressed monkey EXMC markers in gastruloids.
Figure 4—figure supplement 5
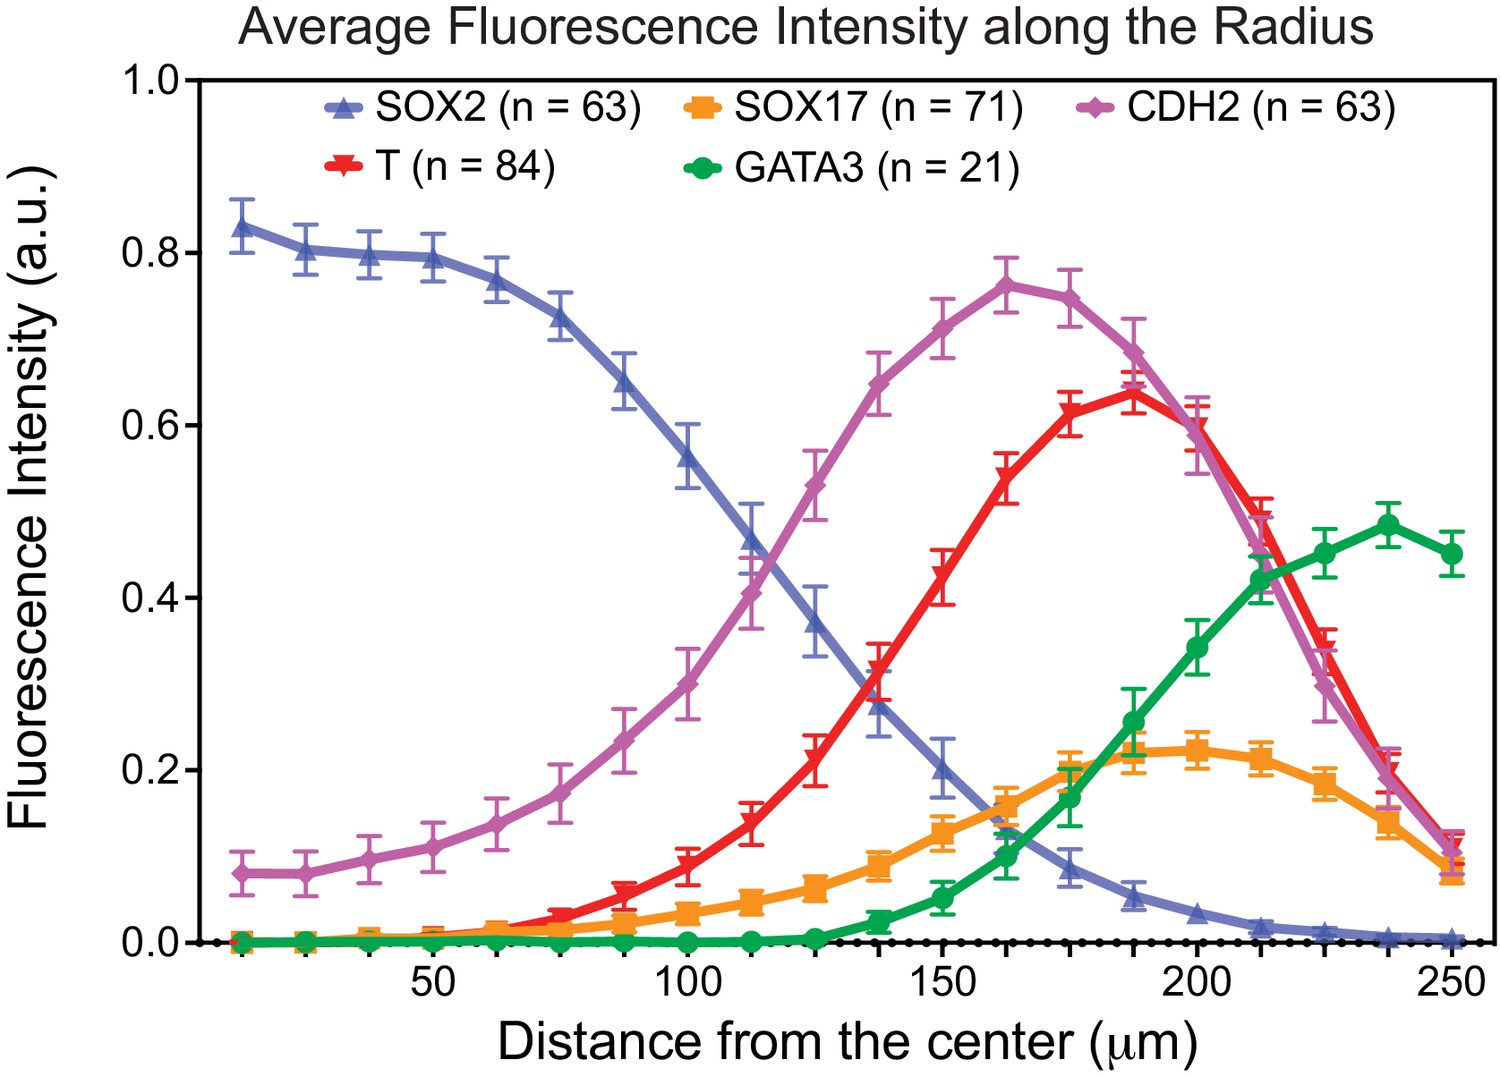
Overlap of CDH2 expression with T and SOX17 expression in gastruloids.
(N = 2, 5, 6, 1, five experiments; n = 63, 84, 71, 21, 63 gastruloids, respectively for SOX2, T, SOX17, GATA3, CDH2; fluorescence intensity of each marker is normalized against that of DAPI for each gastruloid along the radius and average normalized value of all gastruloids is shown; error bars represent standard error of the mean).
Figure 4—figure supplement 6
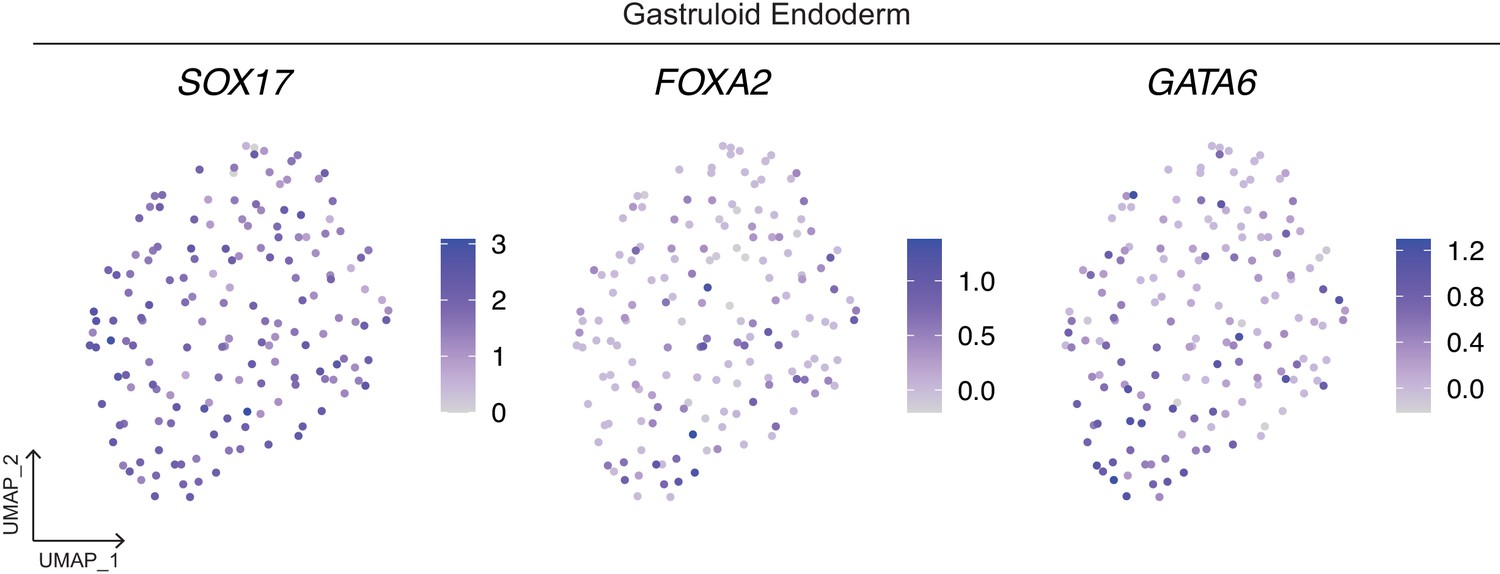
Expression of definitive endoderm marker FOXA2 and primitive endoderm marker GATA6 in the SOX17+ gastruloid Endoderm cluster.
Figure 5 with 1 supplement
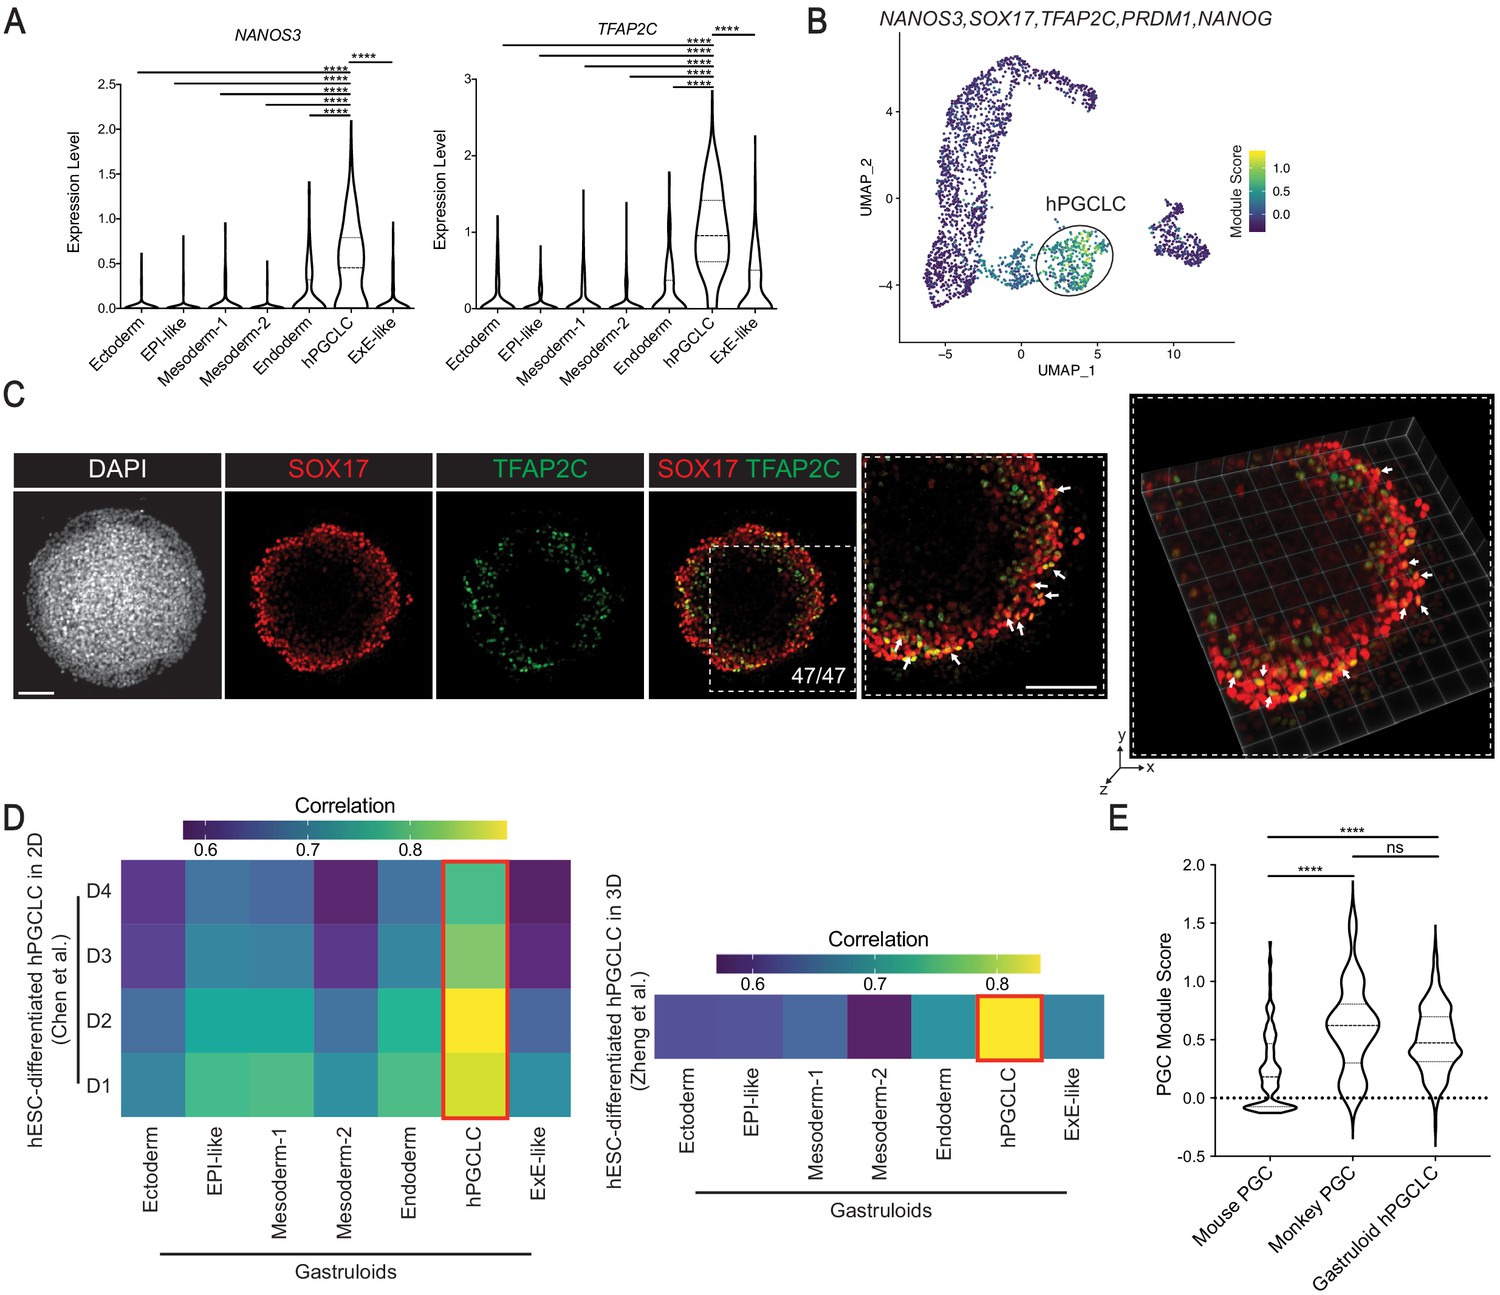
Characterization of gastruloid hPGCLCs.
(A) Violin plot showing expression of PGC markers NANOS3 and TFAP2C in gastruloid clusters (**** indicates p<0.0001; one-way ANOVA with Tukey’s multiple comparisons test; dash lines indicate 1st, 2nd, and 3rd quartiles). (B) UMAP showing module score of PGC signature NANOS3, SOX17, TFAP2C, PRDM1, and NANOG in gastruloid clusters. (C) Immunofluorescence images of indicated markers in 2D (left) and 3D (right) (arrows indicate selected TFAP2C+SOX17+ hPGCLCs). (D) Heatmap showing average gene expression correlation between gastruloid clusters and hESC-derived hPGCLC in 2D (left) and 3D (right) culture conditions (based on 1055 and 1129 shared highly variable genes with Chen et al. and Zheng et al., respectively). (E) Violin plot illustrating module scores of primate PGC signature NANOS3, SOX17, TFAP2C, PRDM1, and NANOG in mouse PGC, monkey PGC, and gastruloid hPGCLC (ns = not significant; ****p<0.0001, one-way ANOVA with Tukey’s multiple comparisons test; dash lines indicate 1st, 2nd, and 3rd quartiles). Scale bar is 100 µm.
Figure 5—figure supplement 1
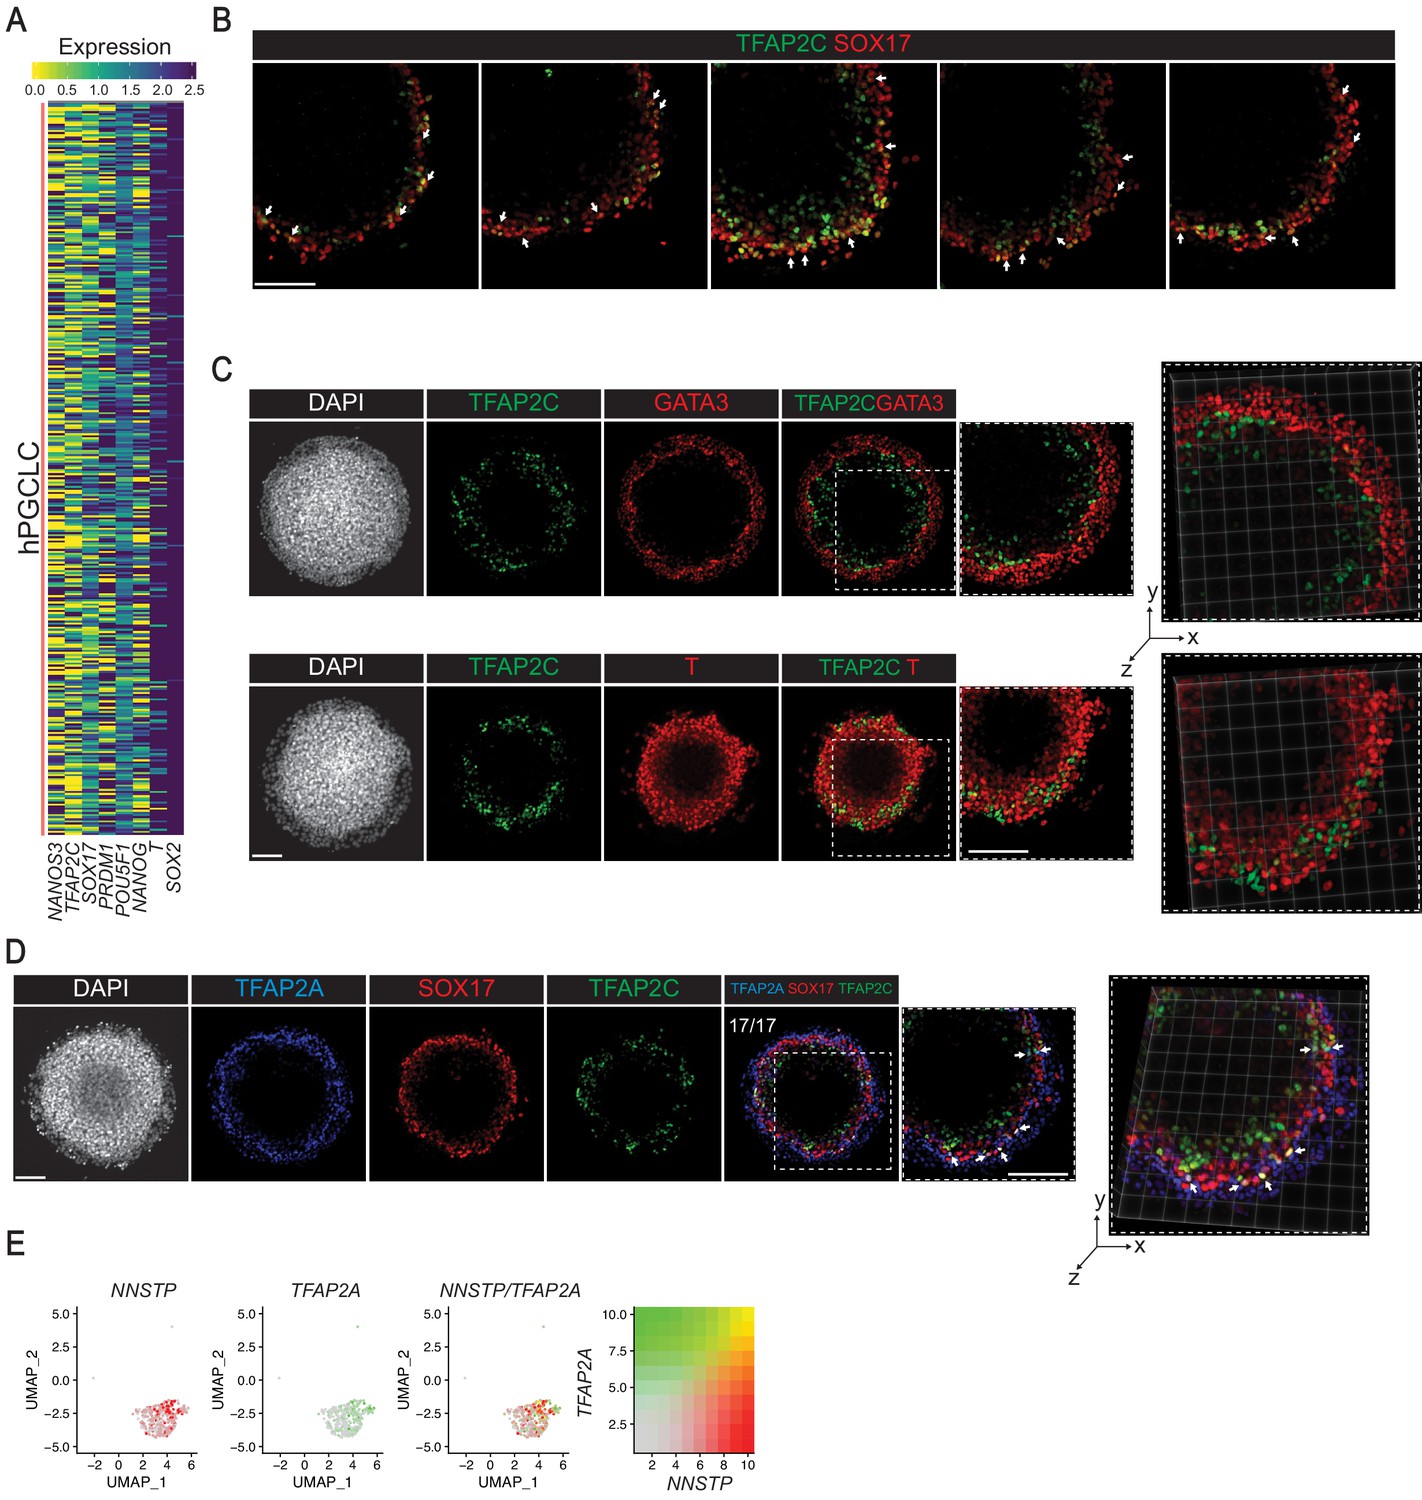
Expression of primate PGC markers in gastruloids.
(A) Heatmap showing the expression of monkey early PGC signature in the gastruloid hPGCLC cluster. (B) Additional replicates of immunofluorescence images showing indicated markers (arrows indicate selected TFAP2C+SOX17+ hPGCLCs). (C) Immunofluorescence images of PGC marker TFAP2C, mesoderm marker T, and ExE marker GATA3 (note very few or no cell co-expresses TFAP2C and T or GATA3). (D) Immunofluorescence images of amnion marker TFAP2A in SOX17+TFAP2C+ hPGCLC (arrows indicate selected TFAP2A+SOX17+TFAP2C+ cells). (E) UMAP showing co-expression of amnion marker TFAP2A in NNSTP (NANOS3+NANOG+SOX17+TFAP2C+PRDM1+) cells in the scRNA-seq of the hPGCLC cluster.
Figure 6
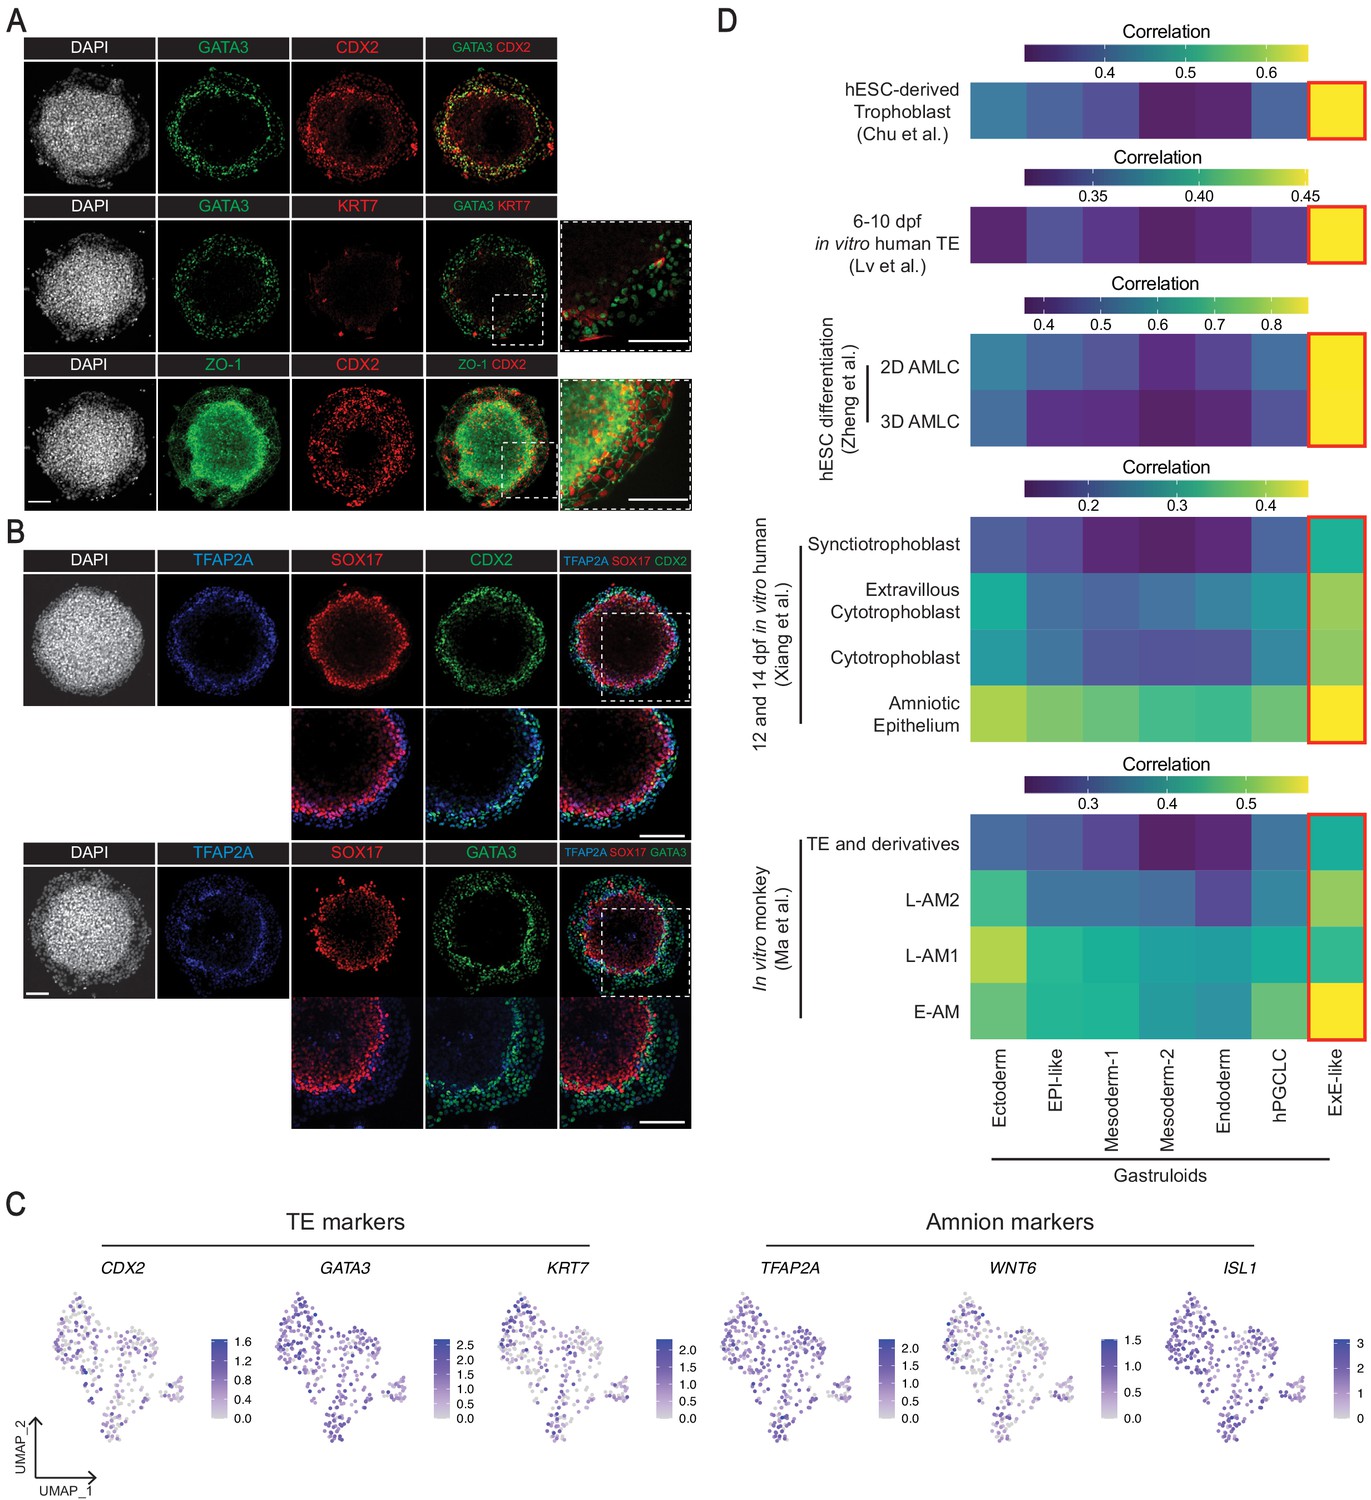
Characterization of the gastruloid ExE-like cluster.
(A, B) Immunofluorescence images of TE makers GATA3 and CDX2 (A), and amnion marker TFAP2A (B) in gastruloids. (C) UMAP showing expression of TE markers GATA3, CDX2, KRT7, and amnion markers TFAP2A, WNT6, ISL1 in the scRNA-seq of the ExE-like cluster. (D) Average gene expression correlation between gastruloid clusters and amnion or TE-related cell types from hESC differentiation, and in vitro cultured human and monkey embryos (based on 546, 524, 1,129, 434, and 371 shared highly variable genes with Chu et al., Lv et al., Zheng et al., Xiang et al., and Ma et al., respectively; AMLC = amnion-like cells; E/L-AM = early/late amnion). Scale bar is 100 µm.
Figure 7 with 2 supplements

BMP4-differentiated germ layer and ExE-like cells exhibit cell sorting behaviors.
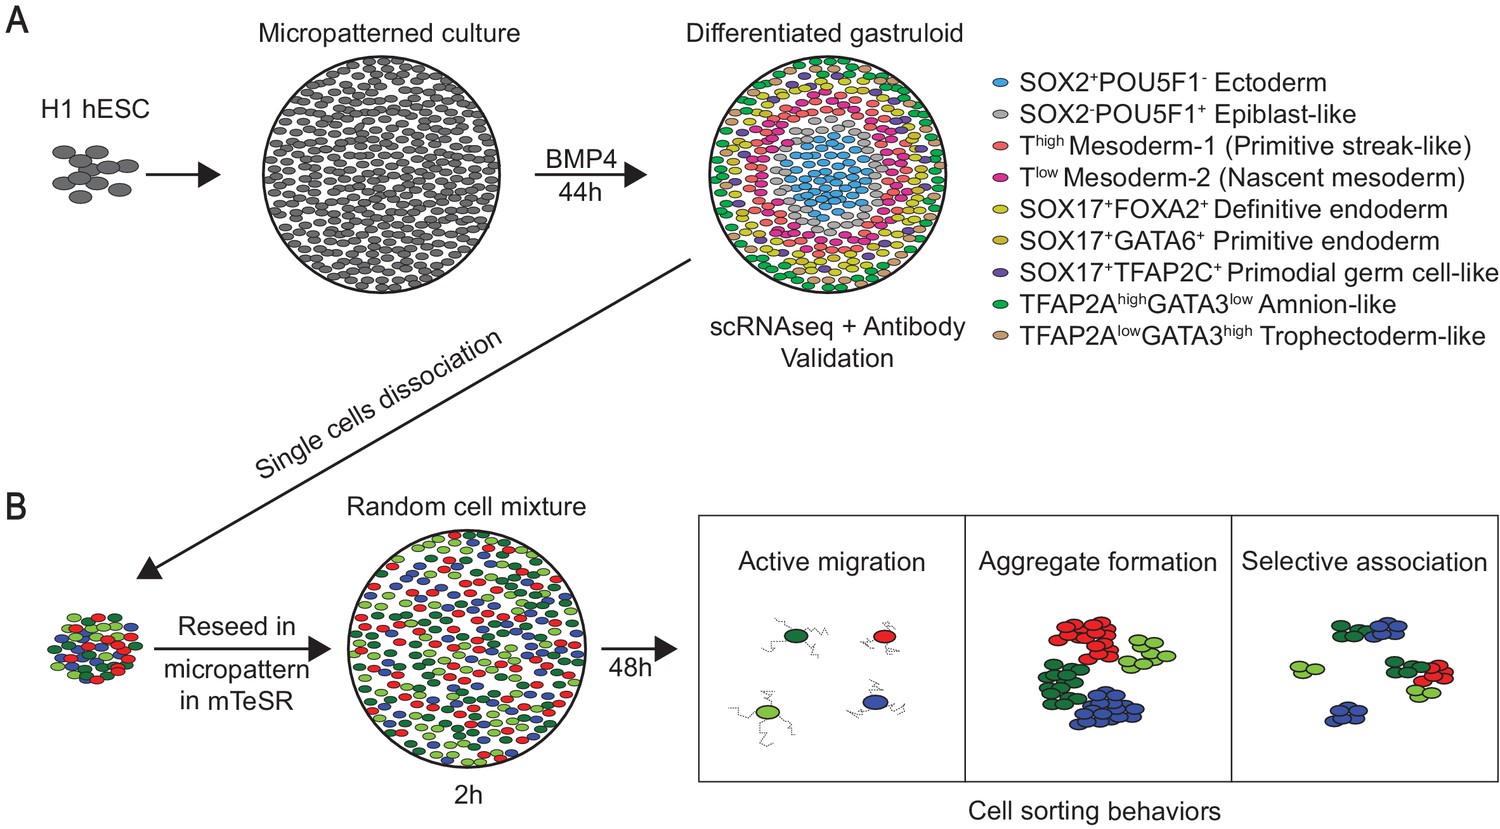
(A) Schema of protocol for assaying cell sorting behaviors from dissociated gastruloids. (B, C, D) Immunofluorescence images of indicated markers in reseeded gastruloid cells at indicated timepoints and indicated cell densities (dashed lines indicate cellular aggregates). (E) UMAP showing the seven original gastruloid clusters in 48-hr post-reseed cells. (F) UMAP displaying overlap of gastruloid and reseeded cells. (G) Dot plot showing predicted cell type scores in reseeded clusters using the seven gastruloid clusters as reference. Scale bar is 100 µm.
Figure 7—figure supplement 1
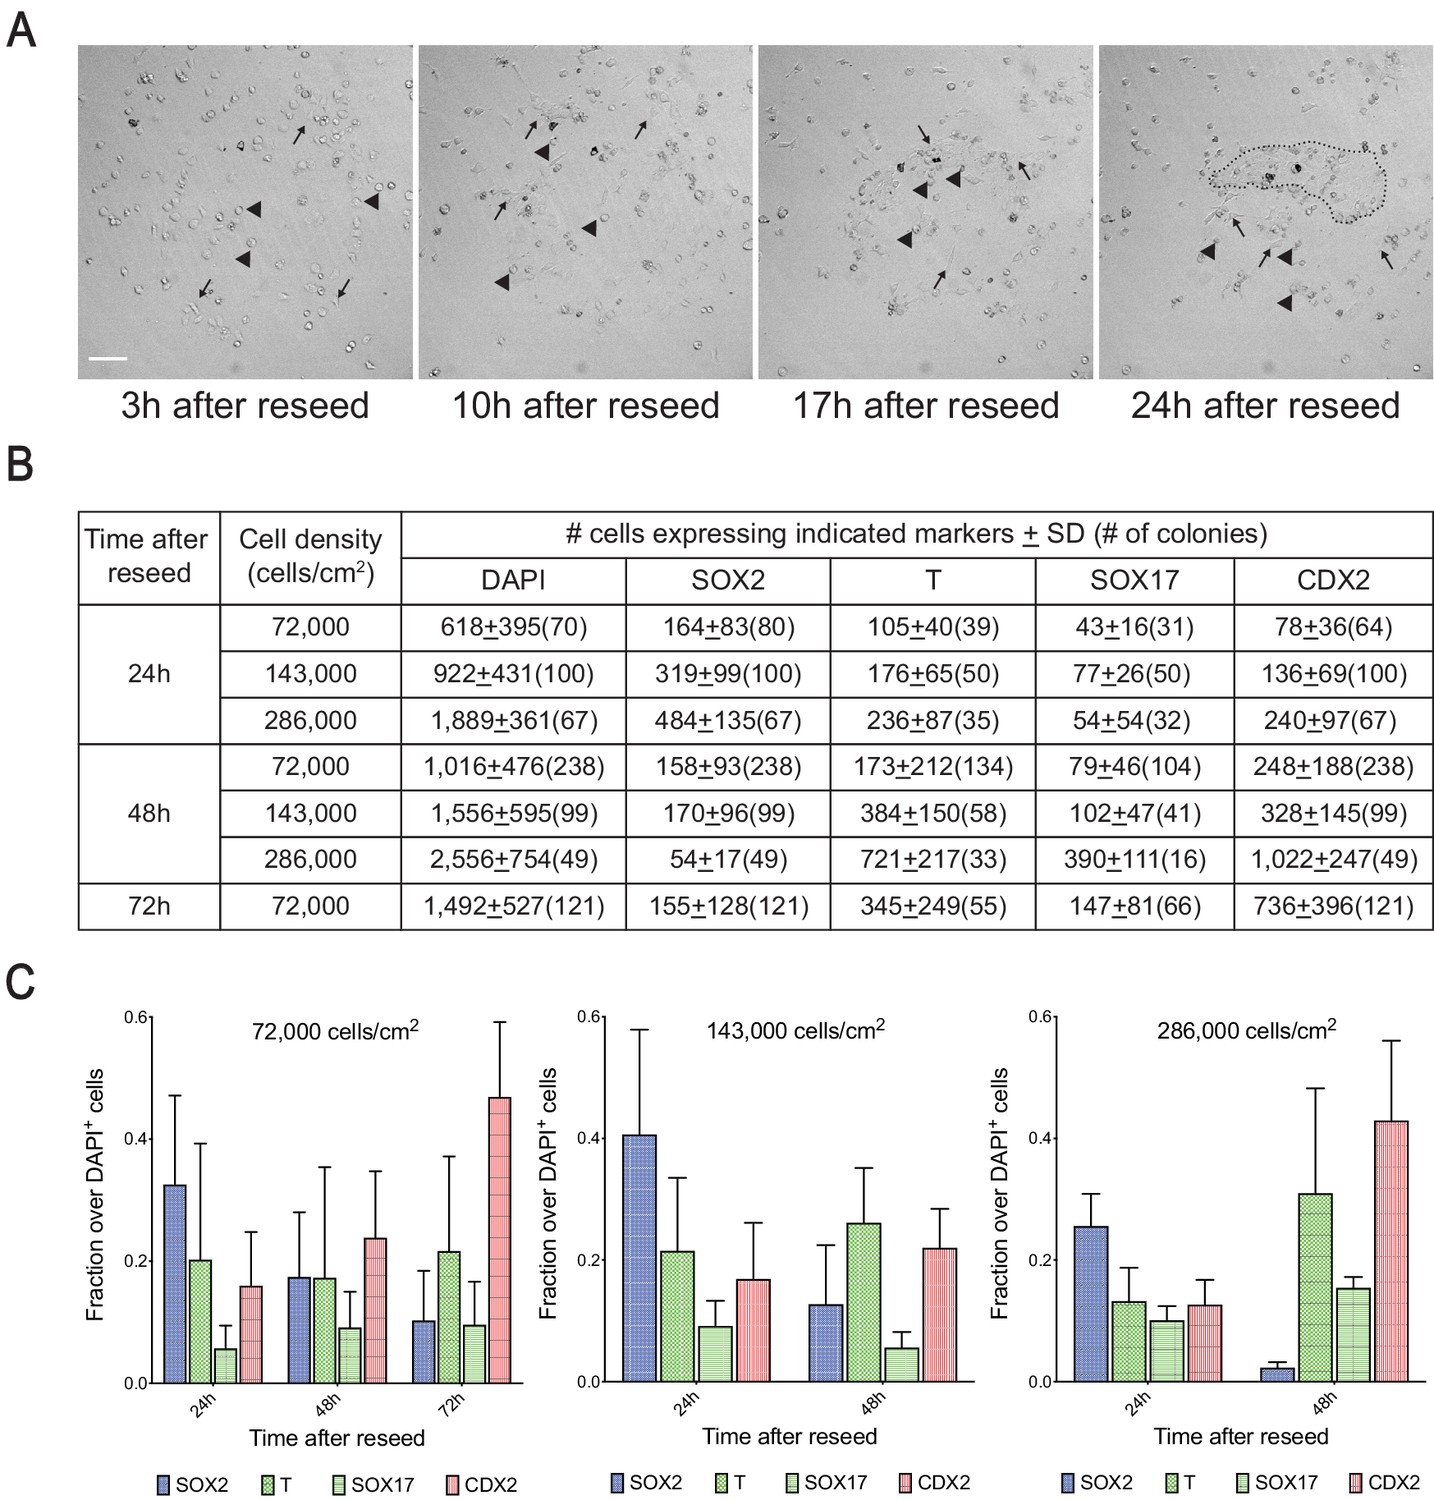
Visualization and quantification of reseeded cells.
(A) Still time-lapse images of dissociated gastruloid cells reseeded in micropattern after 3, 10, 17, and 24 hr (arrow indicates motile cells, arrowhead indicates non-motile cells, dotted line indicates cellular aggregates). (B, C) Average number (B) and fraction (C) of dissociated and reseeded gastruloid cells positive for indicated markers at indicated timepoints and cell densities (number of reseeded colonies analyzed for each cell density and time point for (B) and (C) shown in parenthesis under each marker in (B); SD indicates standard deviation in (B); fraction in (C) calculated from cell numbers in (B); error bars indicate SD).
Figure 7—figure supplement 2
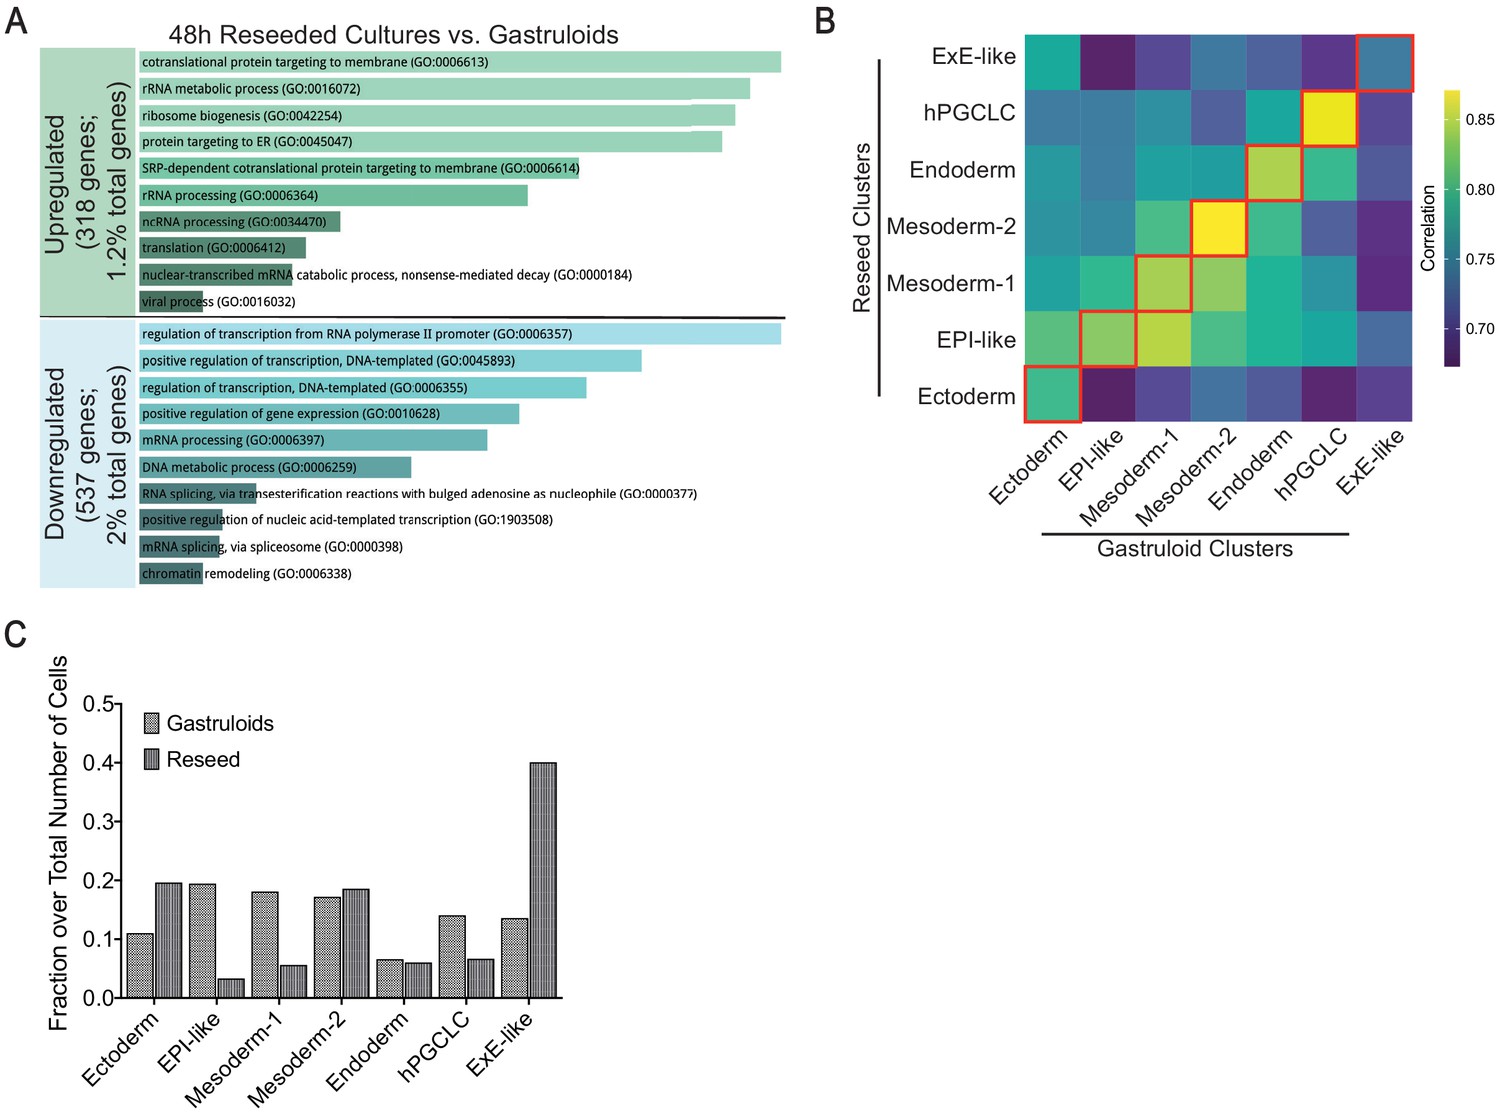
Reseeded cells retain transcriptional similarity to gastruloid cells.
(A) Gene Ontology analysis of downregulated and upregulated genes between reseeded cultures and gastruloids. (B) Heatmap illustrating gene expression correlation of 2000 shared highly variable genes between clusters of reseeded and gastruloid cells. (C) Cellular composition of each cluster in gastruloids and reseeded cell population.
Figure 8 with 5 supplements
Reseeded gastruloid cells exhibit selective cell sorting behaviors.
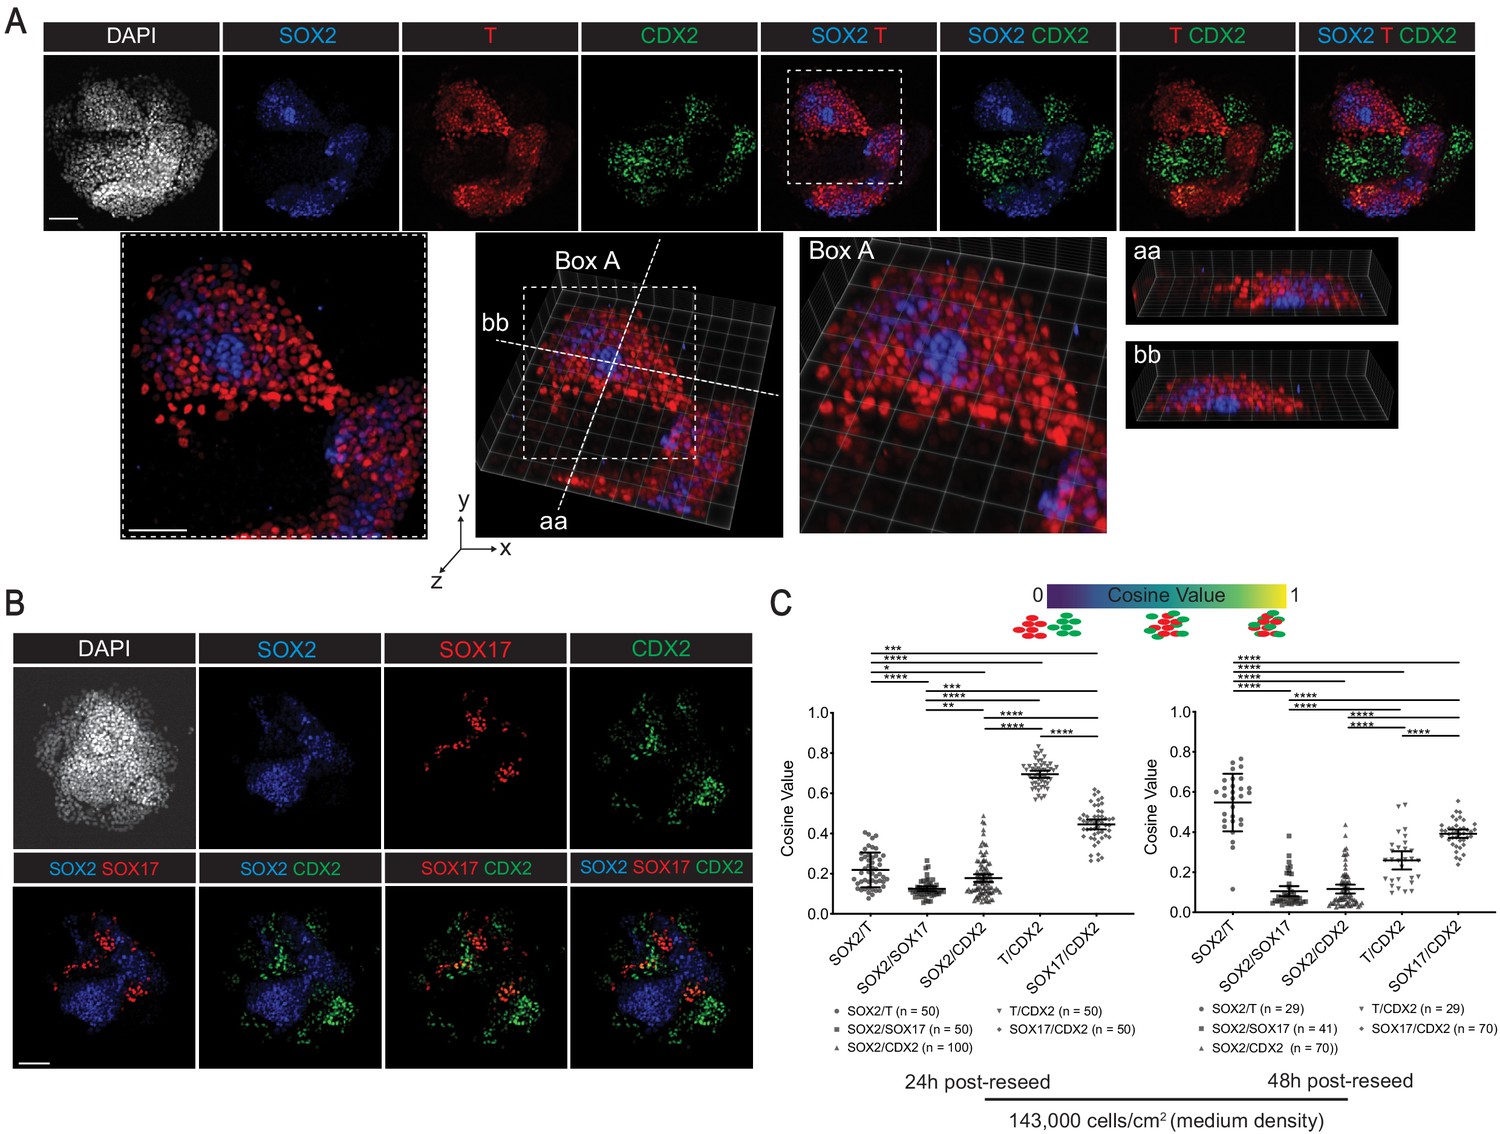
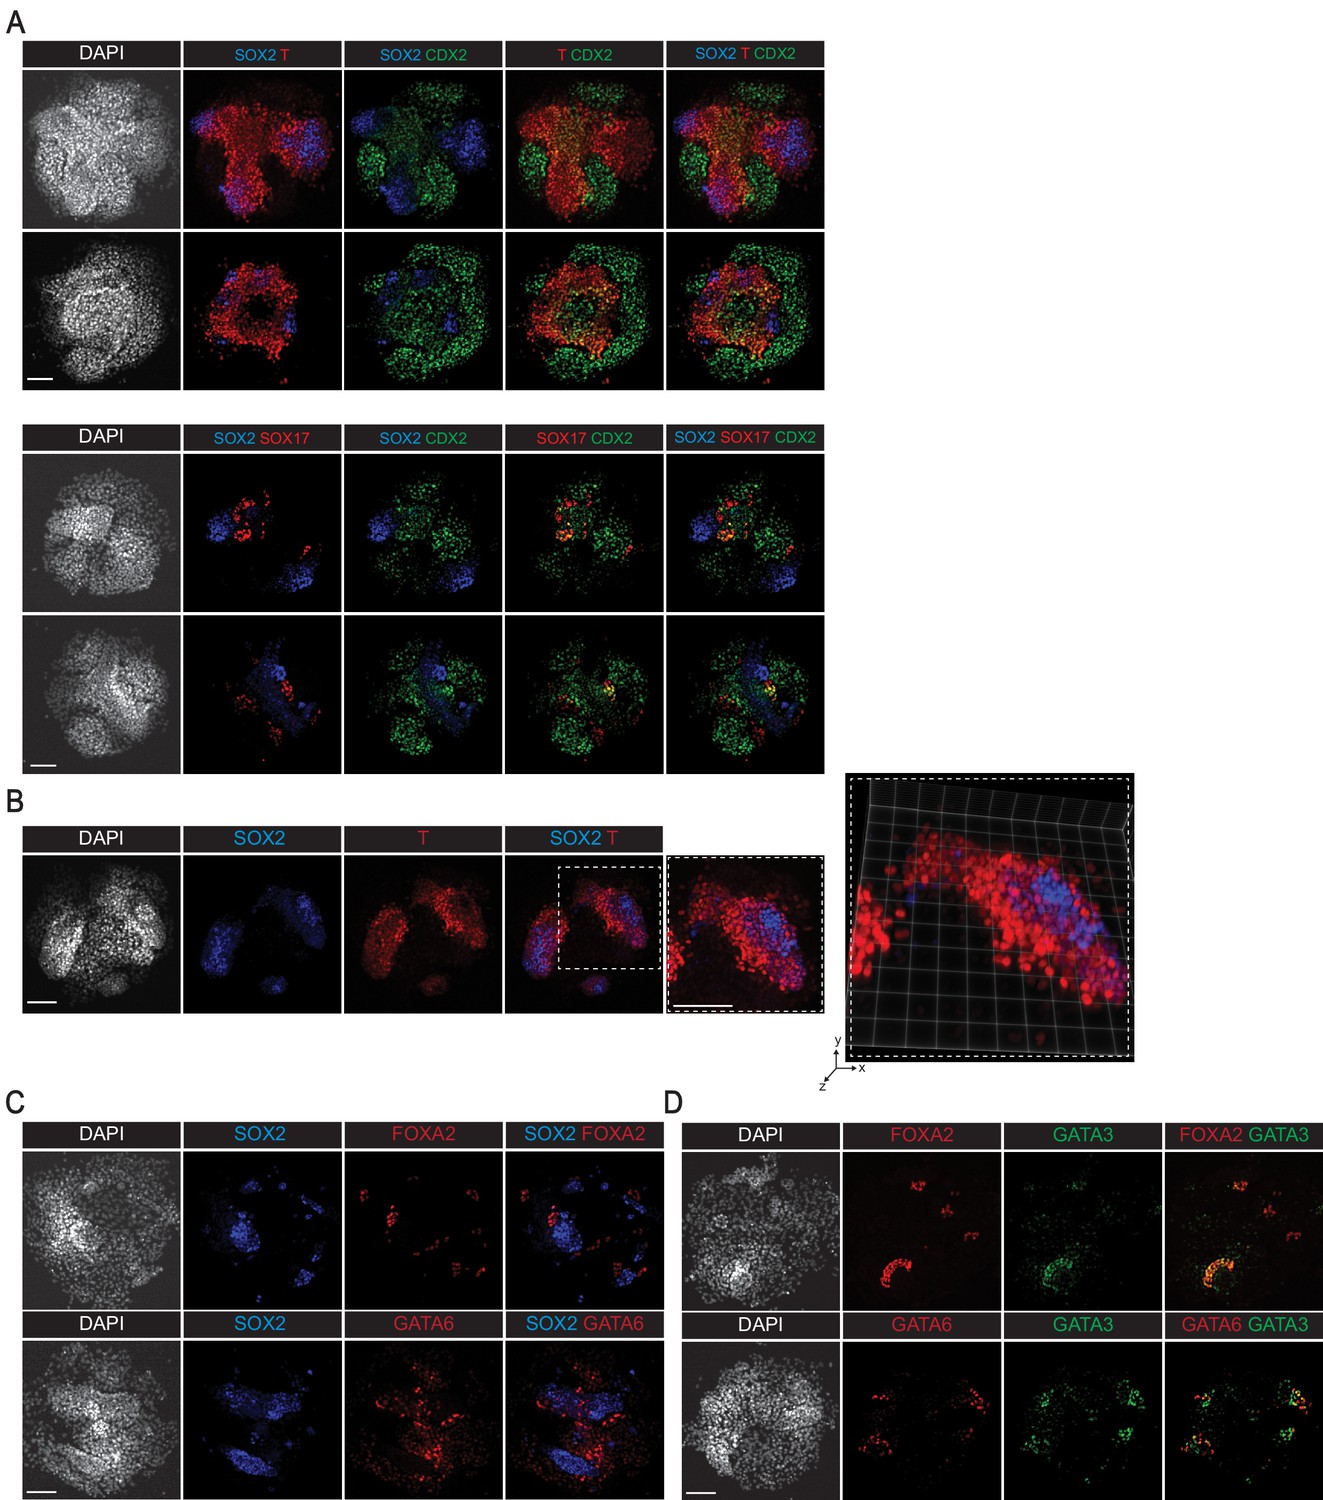
(A, B) Immunofluorescence images of indicated markers in 48 hr post-reseed cultures. (C) Cosine similarity analysis of expression domains between pairs of indicated markers (*, **, ***, **** indicates p<0.05, 0.01, 0.001, 0.0001, respectively, one-way ANOVA with Tukey’s multiple comparisons test; error bars represent standard deviation; each dot represents a pair of indicated markers in a reseeded colony; number of reseeded colonies used for each indicated pair of markers shown below the chart). Scale bar is 100 µm.
Figure 8—figure supplement 1
Immunofluorescence analyses of cell sorting behavior in reseeded cells.
(A) Additional replicates of immunofluorescence staining showing indicated markers of dissociated and reseeded gastruloid cells after 48 hr (note mixing between SOX2+ and T+ cells, but segregation between SOX2+ and SOX17+ cells). (B) 2D and 3D-perspective images showing mixing between SOX2+ and T+ cells in dissociated and reseeded gastruloid cells after 48 hr. (C, D) Immunofluorescence images showing relative sorting between SOX2+ ectoderm cells (C) or GATA3+ ExE-like cells (D) and FOXA2+ definitive endoderm or GATA6+ primitive endoderm cells. Scale bar is 100 µm.
Figure 8—figure supplement 2
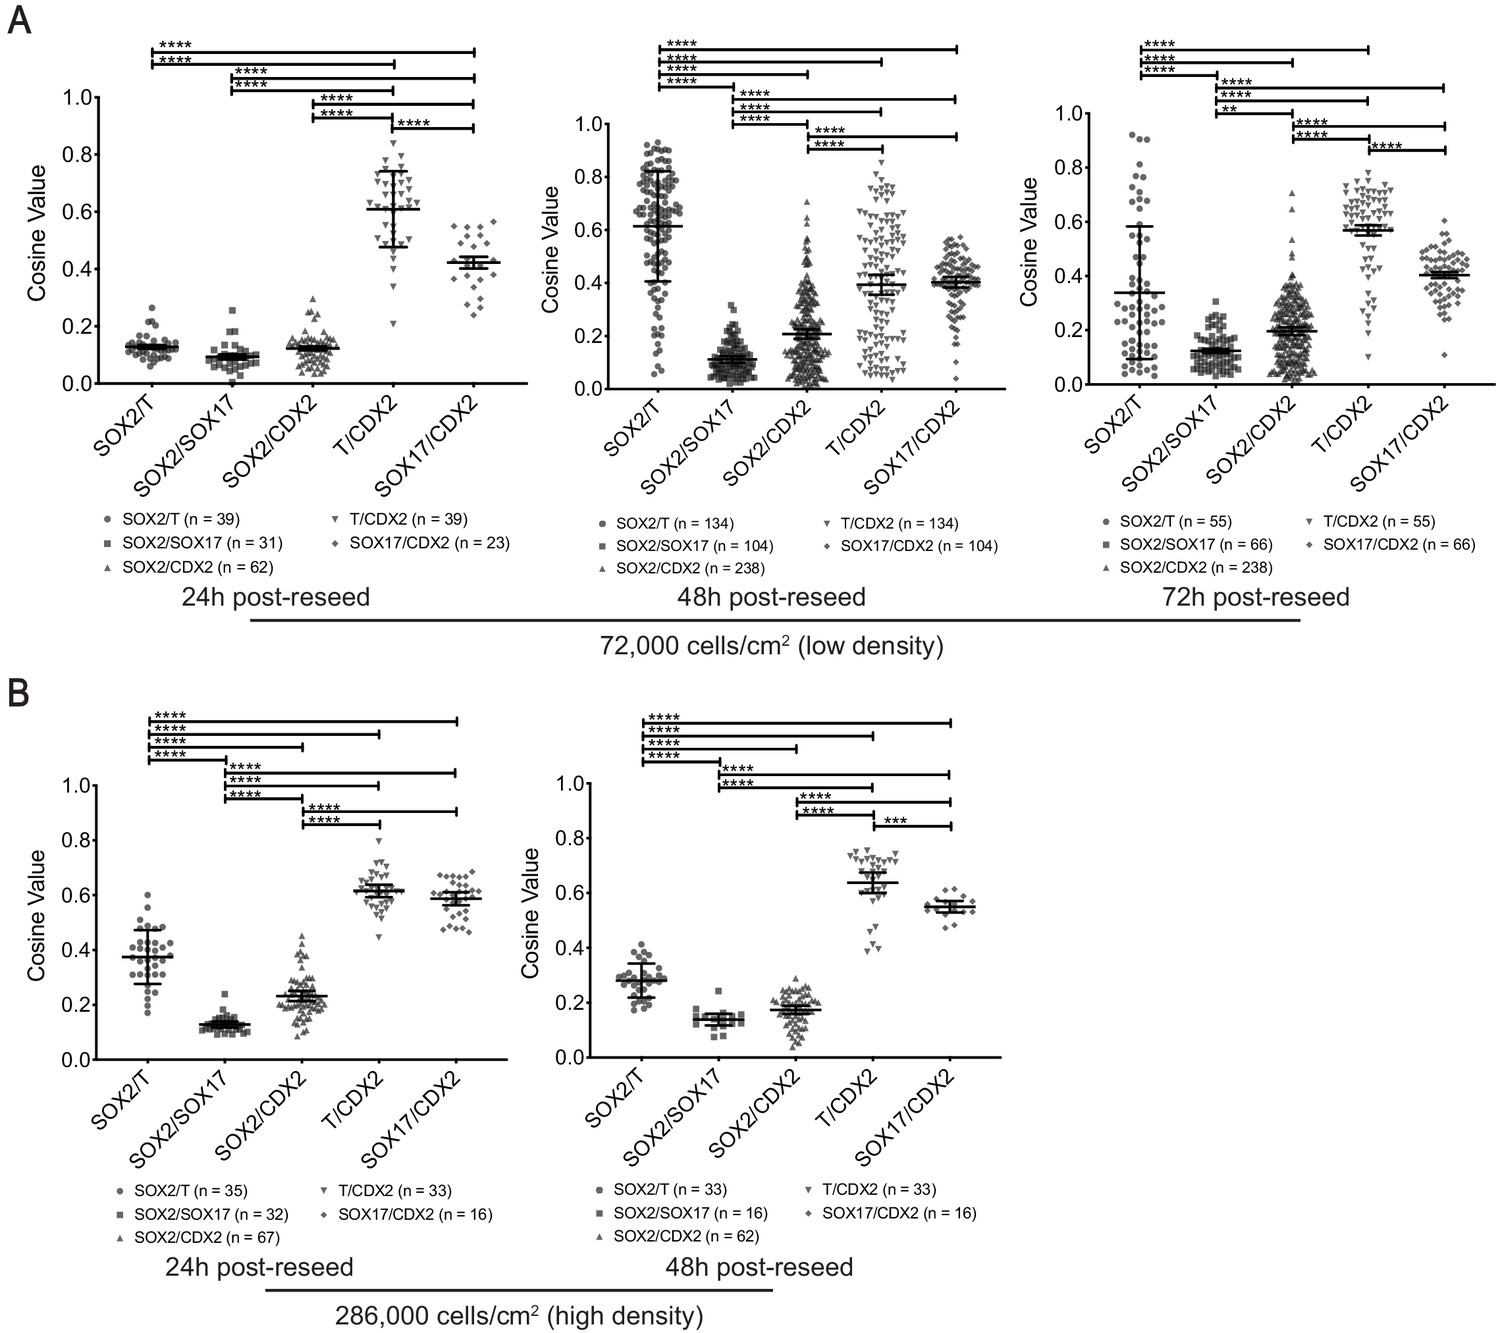
Cosine similarity or expression pattern overlap analysis between cell type markers in reseeded cells.
(A, B) Cosine value depicting overlap between expression domains of pairs of indicated markers at indicated timepoints and cell densities (*, **, ***, **** indicates p<0.05, 0.01, 0.001, 0.0001, respectively, using one-way ANOVA with Tukey’s multiple comparisons test; error bars represent standard deviation; each dot represents a pair of indicated markers in a reseeded colony; number of reseeded colonies used for each indicated pair of markers shown below the chart).
Figure 8—figure supplement 3
ScRNA-seq analysis of protein markers used in immunofluorescence studies of reseeded cells.
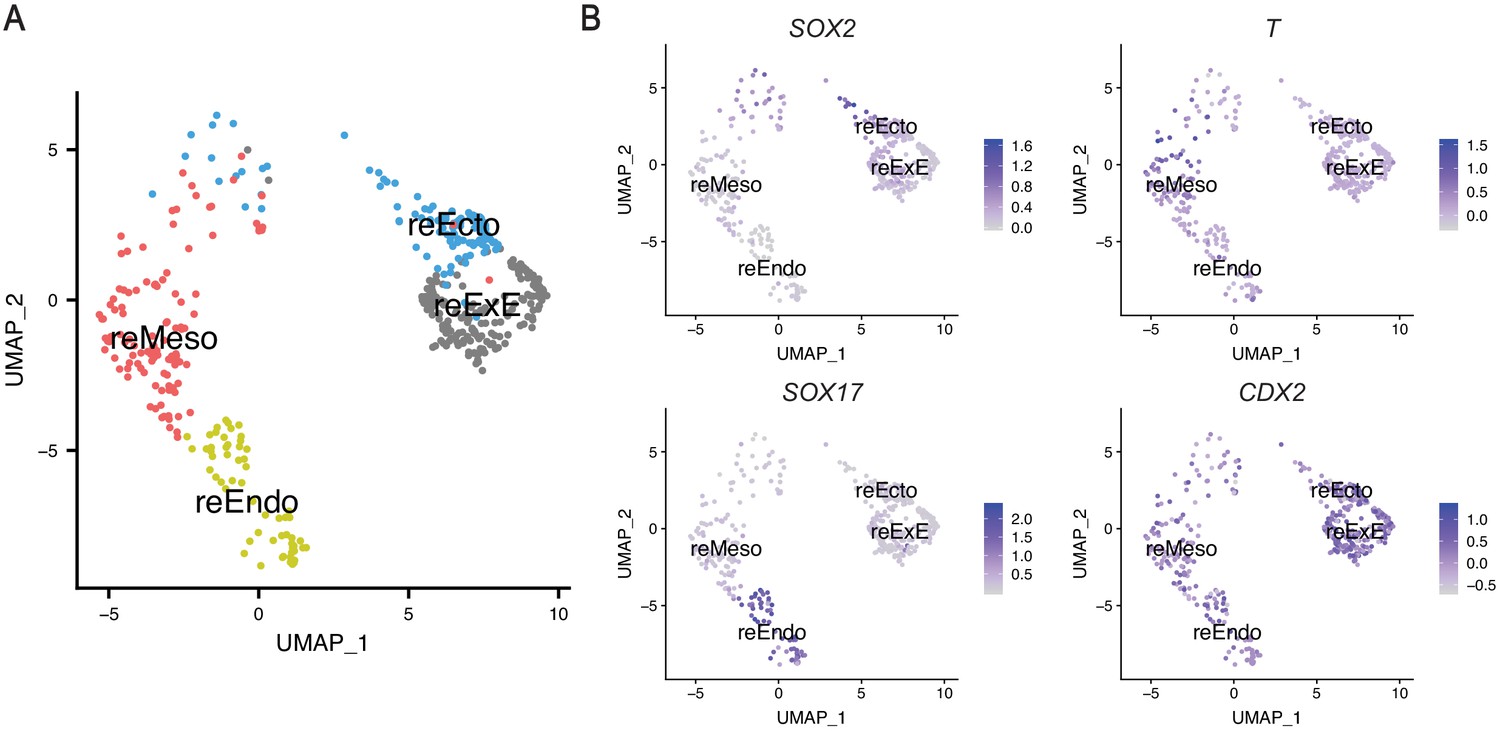
(A) UMAP display of reseeded culture from dissociated gastruloids showing combined clusters with strong expression of SOX2 (EPI-like and Ectoderm clusters into reEcto), T (Mesoderm-1 and -2 clusters into reMeso), SOX17 (Endoderm and hPGCLC clusters into reEndo), and CDX2 (ExE-like cluster into reExE). (B) UMAP depicting expression of genes encoding the protein markers used in immunofluorescence studies in reseed culture.
Figure 8—figure supplement 4
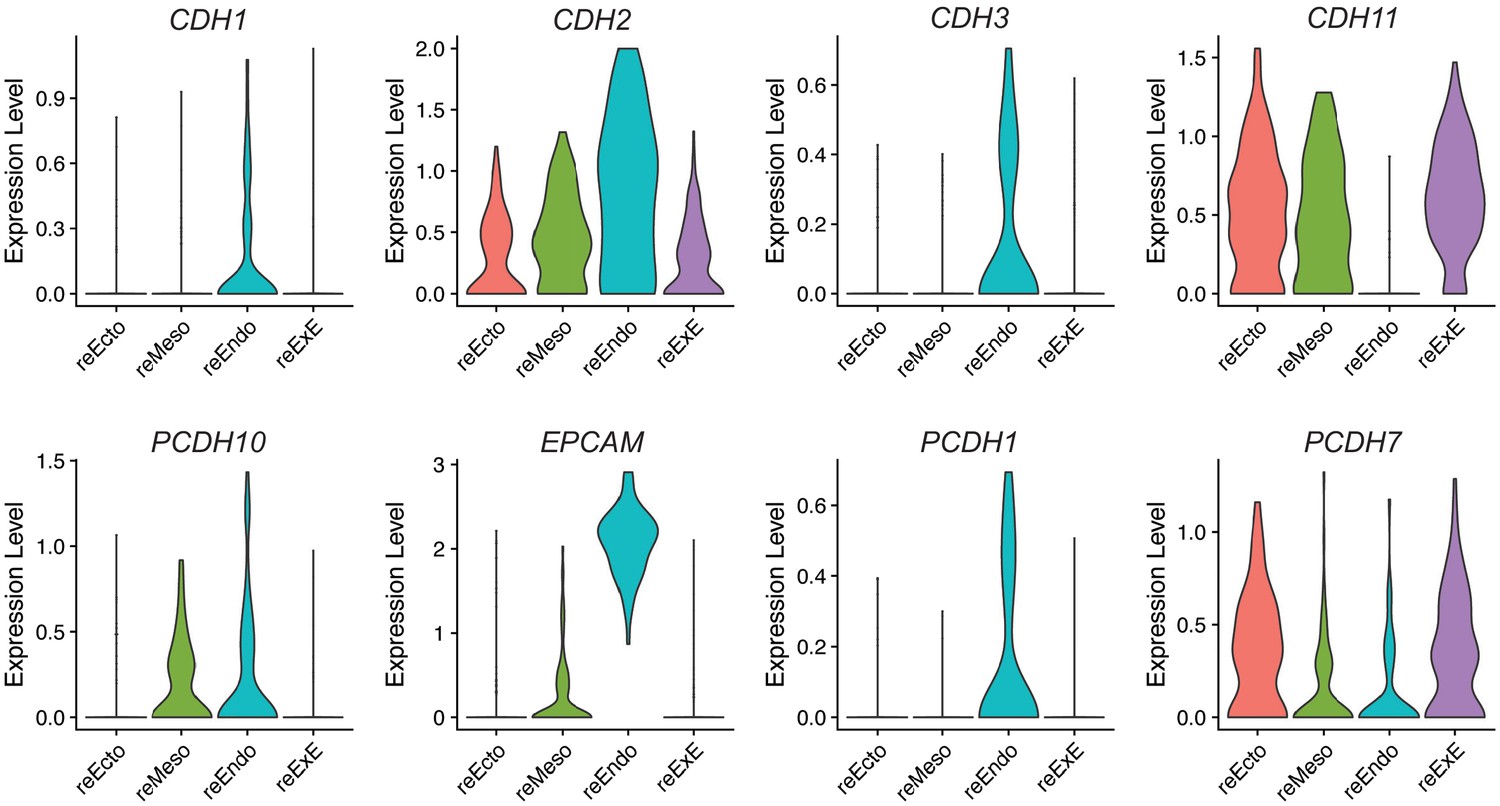
Differential expression of cell adhesion molecules in reseeded cells.
Figure 8—figure supplement 5
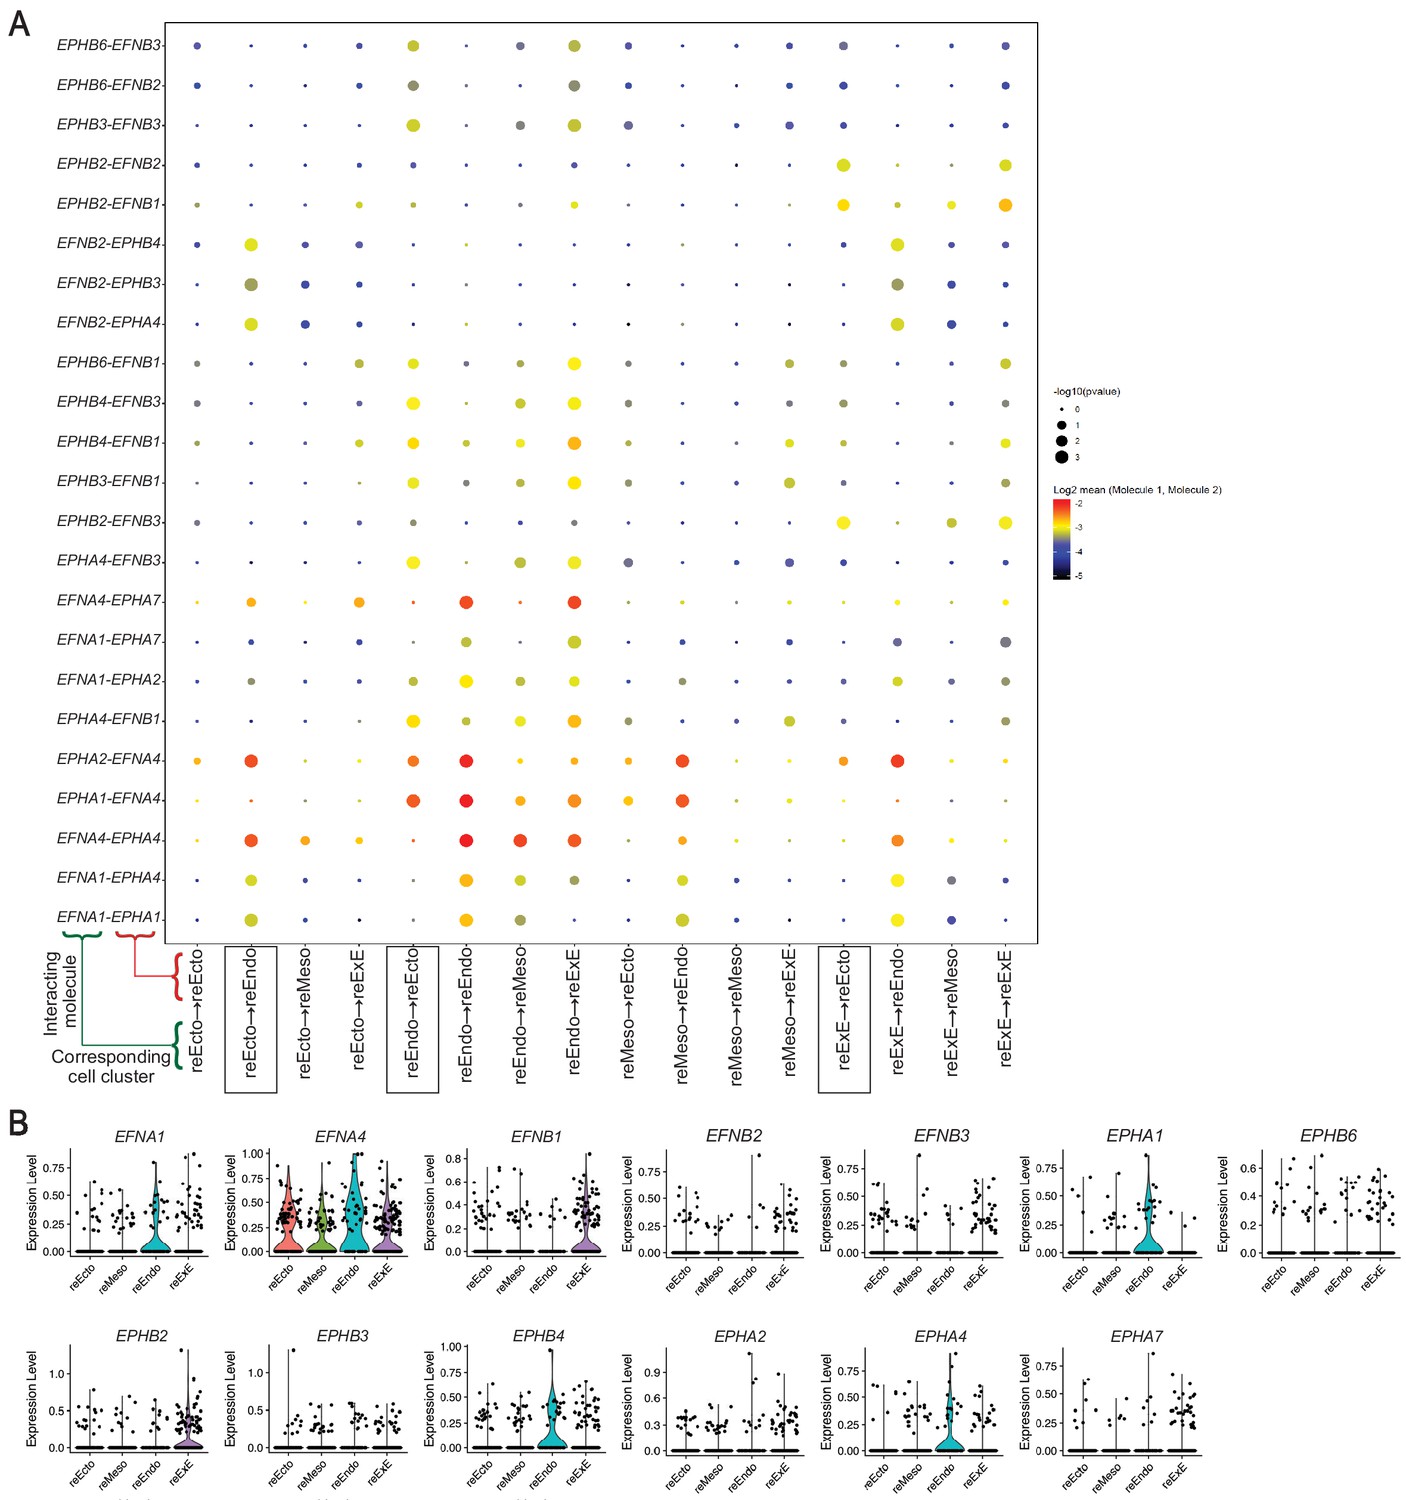
Ephrin-Eph interactions in reseeded cells.
(A) Dot plot showing predicted Ephrin-Eph interactions between indicated pairs of cell clusters. Arrows in x-axis labels indicate direction of signaling (signaling to receiving cluster). In each interacting pair in y-axis, first partner is expressed in the signaling cluster and second partner is expressed in the receiving cluster; p value indicates enrichment of predicted Ephrin-Eph interactions among all predicted receptor-ligand interactions (see Source Data File 7); mean indicates average expression of receptor and ligand in interacting cluster. (B) Violin plot illustrating expression of genes encoding Ephrins and Ephs from the interaction analysis.
Figure 9
BMP4-differentiated gastruloids generate primate-relevant gastrulation cell types that show cell sorting behaviors when dissociated and reseeded in single-cell mixture.
(A) Immunofluorescence and scRNA-seq analyses identify seven major cell types relevant during primate gastrulation. (B) Gastruloids dissociated into single cells and reseeded onto micropatterns show cell sorting behaviors.
Videos
Video 1
Dissociated and reseeded gastruloid cells show motility.
Time-lapse confocal series from 3 to 27 hr after reseeding of dissociated gastruloid cells in 500 µm ECM microdiscs.
Tables
Key resources table
| Reagent type (species) or resource | Designation | Source or reference | Identifiers | Additional information |
|---|---|---|---|---|
| Cell line (Human) | WA01 (H1) human embryonic stem cell | WiCell | RRID:CVCL_9771, hPSCReg ID: WAe001-A | |
| Cell line (Human) | WA09 (H9) human embryonic stem cell | WiCell | RRID:CVCL_9773, hPSCReg ID: WAe009-A | |
| Antibody | anti-SOX2 (Mouse monoclonal) | Cell Signaling Technology | Cat# 4900, RRID:AB_10560516 | (1:200) |
| Antibody | anti-SOX2 (Rabbit monoclonal) | Cell Signaling Technology | Cat# 3579, RRID:AB_2195767 | (1:200) |
| Antibody | anti-SOX1 (Goat polyclonal) | R and D Systems | Cat# AF3369, RRID:AB_2239879 | (10 μg/mL) |
| Antibody | anti-T (Goat polyclonal) | R and D Systems | Cat# AF2085, RRID:AB_2200235 | (2 μg/mL) |
| Antibody | anti-SOX17 (Goat polyclonal) | R and D Systems | Cat# AF1924, RRID:AB_355060 | (1 μg/mL) |
| Antibody | anti-CDX2 (Rabbit monoclonal) | Cell Signaling Technology | Cat# 12306, RRID:AB_2797879 | (1:100) |
| Antibody | anti-pSMAD1 (Rabbit monoclonal) | Cell Signaling Technology | Cat# 9516, RRID:AB_491015 | (1:200) |
| Antibody | anti-CDH1 (Rabbit monoclonal) | Cell Signaling Technology | Cat# 3195, RRID:AB_2291471 | (1:400) |
| Antibody | anti-CDH2 (Mouse monoclonal) | Cell Signaling Technology | Cat# 14215, RRID:AB_2798427 | (1:800) |
| antibody | anti-GATA3 (Rabbit monoclonal) | Cell Signaling Technology | Cat# 5852, RRID:AB_10835690 | (1:1600) |
| Antibody | anti-GATA3 (Mouse monoclonal) | R and D Systems | Cat# MAB6330, RRID:AB_10640512 | (1:500) |
| Antibody | anti-GATA6 (Rabbit monoclonal) | Cell Signaling Technology | Cat# 5851, RRID:AB_10705521 | (1:1600) |
| Antibody | anti-FOXA2 (Rabbit monoclonal) | Cell Signaling Technology | Cat# 8186, RRID:AB_10891055 | (1:800) |
| Antibody | anti-OCT3/4(POU5F1) (Mouse monoclonal) | Santa Cruz Biotechnology | Cat# sc-5279, RRID:AB_628051 | (1:200) |
| Antibody | anti-ZO-1 (Mouse monoclonal) | Thermo Fisher Scientific | Cat# 33–9100, RRID:AB_2533147 | (1:500) |
| Antibody | anti-KRT7 (Rabbit monoclonal) | Cell Signaling Technology | Cat# 4465, RRID:AB_11178382 | (1:200) |
| Antibody | anti-AP-2α (Rabbit monoclonal) | Santa Cruz Biotechnology | Cat# sc-12726, RRID:AB_667767 | (1:200) |
| Antibody | anti-AP-2γ (Rabbit polyclonal) | Cell Signaling Technology | Cat# 2320, RRID:AB_2202287 | (1:800) |
| Chemical compound, drug | Gentle Cell Dissociation Reagent | Stemcell Technologies | Cat # 07174 | |
| Chemical compound, drug | Accutase solution | Sigma Aldrich | Cat # A6964 | |
| Chemical compound, drug | RPMI 1640 Medium | Thermo Fisher Scientific | Cat # 11879020 | |
| Chemical compound, drug | ROCK Inhibitor (Y-27632) | Millipore Sigma | Cat # SCM075 | (10 μM) |
| Chemical compound, drug | Recombinant Human BMP-4 Protein | R and D Systems | Cat # 314 BP | (50 ng/mL) |
| Chemical compound, drug | mTeSR1 | Stemcell Technologies | Cat # 85857 | |
| Commercial assay, kit | Chromium Single Cell 3’ Library and Gel Bead Kit v2 | 10xGenomics | Cat # 120237 | |
| Commercial assay, kit | Chromium Single Cell 3’ Chip Kit v2 | 10xGenomics | Cat # 120236 | |
| Commercial assay, kit | Chromium i7 Multiplex Kit | 10xGenomics | Cat # 120262 | |
| Software, algorithm | Seurat 3.1 | Stuart et al., 2019 Butler et al., 2018 | Seurat, RRID:SCR_016341 | scRNA-seq analysis |
| Software, algorithm | CellPhoneDB | Efremova et al., 2020 | Receptor-ligand interaction analysis | |
| Software, algorithm | R Bioconductor destiny | Angerer et al., 2016 (https://bioconductor.org/packages/release/bioc/html/destiny.html) | Pseudotime and transition probabilities | |
| Software, algorithm | ImageJ/FIJI | ImageJ/FIJI | RRID:SCR_002285 | Image analysis |
| Software, algorithm | FIJI plugin – Concentric Circles | https://imagej.nih.gov/ij/plugins/concentric-circles.html | Image analysis | |
| Software, algorithm | FIJI plugin – ClearVolume | Royer et al., 2015 (https://imagej.net/ClearVolume) | Image analysis | |
| Software, algorithm | Prism 8 | Graphpad | RRID:SCR_002798 | Statistics and graphs |
| Other | DAPI | Millipore Sigma | Cat# D9542 | (0.4 μg/mL) |
| Other | Donkey anti-Mouse IgG (H+L) Highly Cross-Adsorbed Secondary Antibody, Alexa Fluor 488 | Thermo Fisher Scientific | Cat# A-21202, RRID:AB_141607 | (1:500) |
| Other | Donkey anti-Goat IgG (H+L) Cross-Adsorbed Secondary Antibody, Alexa Fluor 555 | Thermo Fisher Scientific | Cat# A-21432, RRID:AB_2535853 | (1:500) |
| Other | Donkey anti-Rabbit IgG (H+L) Highly Cross-Adsorbed Secondary Antibody, Alexa Fluor 647 | Thermo Fisher Scientific | Cat# A-31573, RRID:AB_2536183 | (1:500) |
Additional files
-
Source data 1
Metadata for gastruloid cells including cluster annotation, replicate number, and predicted mouse and monkey cell types and stages.
Average gene expression correlation values between replicates 1 and 2.
- https://cdn.elifesciences.org/articles/59445/elife-59445-data1-v2.xlsx
-
Source data 2
Differentially expressed genes of gastruloid clusters.
- https://cdn.elifesciences.org/articles/59445/elife-59445-data2-v2.xlsx
-
Source data 3
Shared highly variable genes (HVGs) between gastruloid and reference datasets used for average gene expression correlation, and correlation values.
- https://cdn.elifesciences.org/articles/59445/elife-59445-data3-v2.xlsx
-
Source data 4
Metadata for cyno monkey cells including monkey cell type and developmental stage, and predicted mouse cell type and developmental stage.
Shared HVGs between mouse and monkey dataset, and gene expression correlation values of developmental stages.
- https://cdn.elifesciences.org/articles/59445/elife-59445-data4-v2.xlsx
-
Source data 5
Metadata for reseed cells including cluster annotation, and prediction scores for gastruloid cell types.
- https://cdn.elifesciences.org/articles/59445/elife-59445-data5-v2.xlsx
-
Source data 6
Downregulated and upregulated genes, shared HVGs, and gene expression correlation values between reseed and gastruloids.
- https://cdn.elifesciences.org/articles/59445/elife-59445-data6-v2.xlsx
-
Source data 7
Predicted interactions between reseed clusters.
- https://cdn.elifesciences.org/articles/59445/elife-59445-data7-v2.xlsx
-
Transparent reporting form
- https://cdn.elifesciences.org/articles/59445/elife-59445-transrepform-v2.docx
Download links
A two-part list of links to download the article, or parts of the article, in various formats.
Downloads (link to download the article as PDF)
Open citations (links to open the citations from this article in various online reference manager services)
Cite this article (links to download the citations from this article in formats compatible with various reference manager tools)
High-resolution transcriptional and morphogenetic profiling of cells from micropatterned human ESC gastruloid cultures
eLife 9:e59445.
https://doi.org/10.7554/eLife.59445


