Adrenergic activation modulates the signal from the Reissner fiber to cerebrospinal fluid-contacting neurons during development
- Paris Brain Institute, ICM, Inserm U 1127, CNRS UMR 7225, Sorbonne Université, France
- Molecular Physiology and Adaptation (PhyMA - UMR 7221), Muséum National d’Histoire Naturelle, CNRS, France
Figures
Figure 1 with 1 supplement
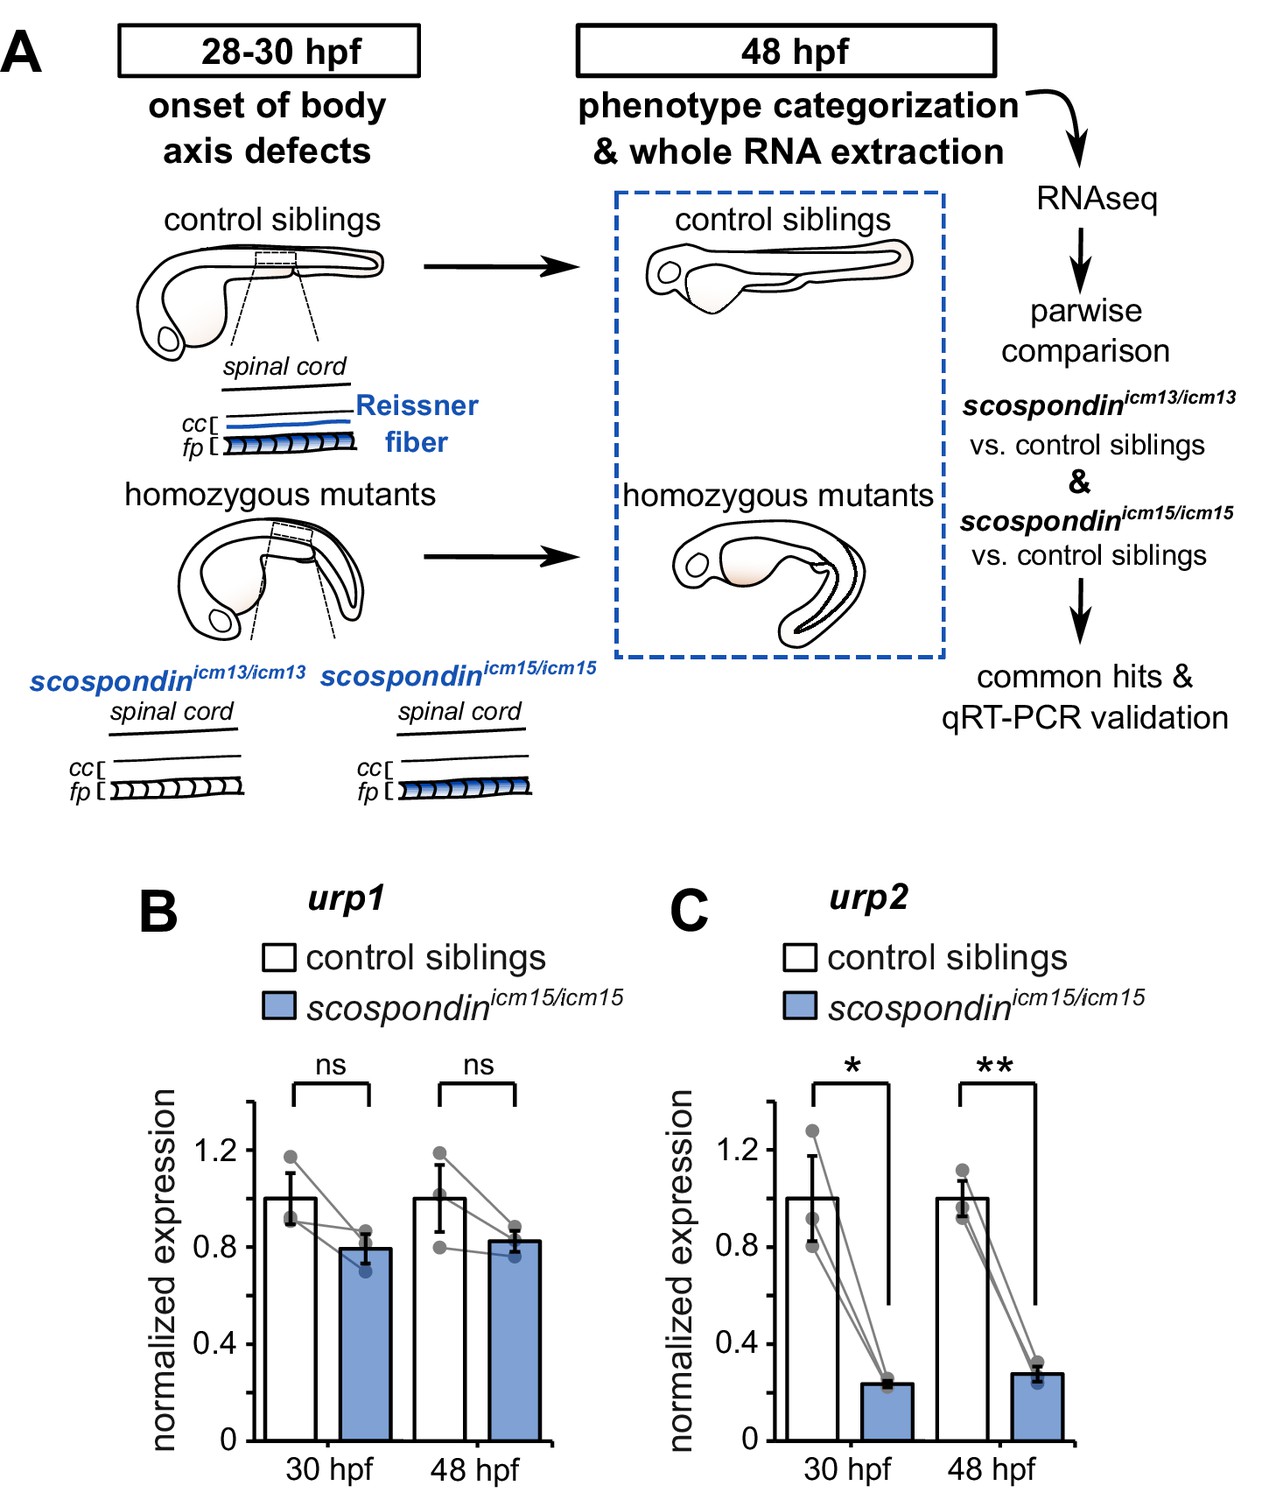
The Reissner fiber is required for urp2 but not urp1 gene expression.
(A) Schematic of the experimental design. Embryos obtained from scospondinicm15/+ or scospondinicm13/+ incrosses were raised until 48 hpf and categorized according to their external phenotype: straight body axis (control siblings, top) or curled-down body axis (homozygous mutants, bottom) prior to RNA extraction. RNA sequencing was performed on three independent replicates for each allele and allowed pairwise comparisons of transcriptomes to identify commonly regulated genes. qRT-PCR experiments were performed at 30 hpf to validate transcriptomic data at the onset of body axis defects induced by the loss of the Reissner fiber and at 48 hpf when the phenotype is fully developed (48 hpf). Null scospondinicm13/icm13 and hypomorphic scospondinicm15/icm15 mutant embryos share the same peculiar curled-down phenotype induced by the loss of the Reissner fiber in the central canal of spinal cord (cc). However, scospondinicm15/icm15 mutants retain SCO-spondin protein expression in secretory structures such as the floor plate (fp). (B, C) qRT-PCR analysis of mRNA levels of urp1 (B) and urp2 (C) in scospondinicm15/icm15 mutants (blue) compared to their control siblings (white) at 30 and 48 hpf. Data are represented as mean ± SEM. N = 3 independent biological replicates for each condition. Each point represents a single experimental replicate. ns p>0.05, *p<0.05, **p<0.01 (paired t-test). See also Figure 1—figure supplement 1 and Figure 1—source data 1 and 2.
-
Figure 1—source data 1
Data for Figure 1B–C.
- https://cdn.elifesciences.org/articles/59469/elife-59469-fig1-data1-v3.xlsx
-
Figure 1—source data 2
Up- and down-regulated transcripts in curled-down scospondin mutants compared to their control siblings.
After filtering for low expression, we kept a list of genes that were differentially expressed in null scospondinicm13/icm13 and hypomorphic scospondinicm15/icm15 mutant embryos at 48 hpf. The table shows the average fold changes in the two alleles and their mean. Genes are ranked based on their p-value that compare the reproducibility of the change inside and between the two alleles using a GLM framework. We adjusted the false discovery rate due to multiple comparisons using the Benjamini-Hochberg procedure (see Materials and methods for details). The raw RNA-seq data have been deposited in the ArrayExpress database at EMBL-EBI (www.ebi.ac.uk/arrayexpress) under accession number E-MTAB-9615.
- https://cdn.elifesciences.org/articles/59469/elife-59469-fig1-data2-v3.xlsx
Figure 1—figure supplement 1
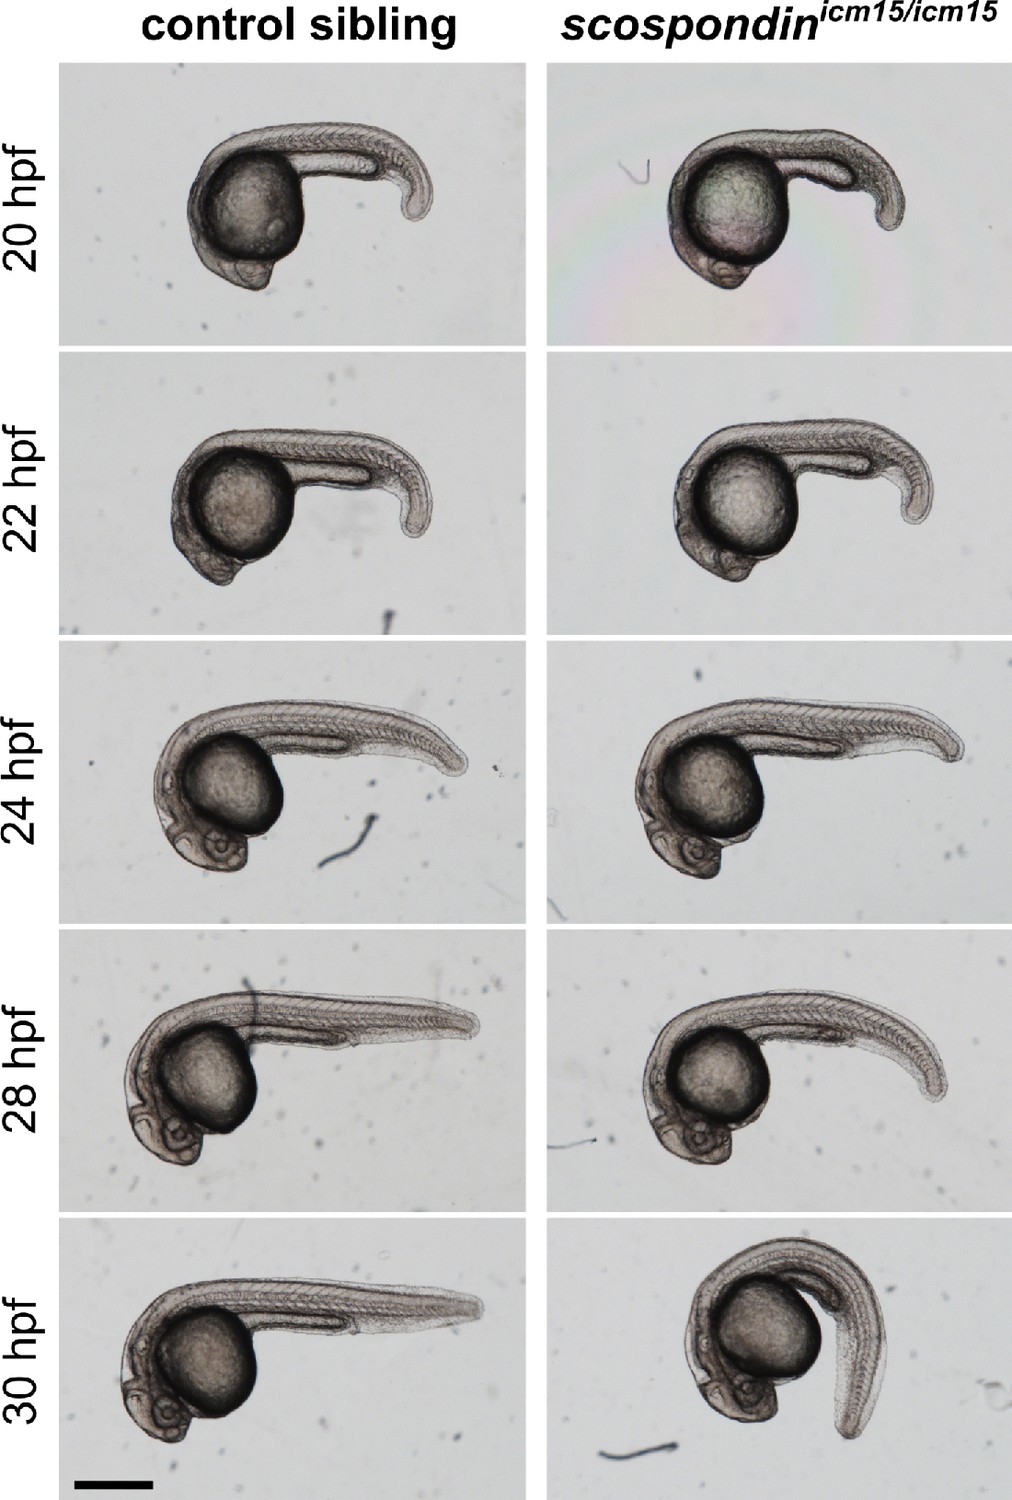
Time course of the evolution of body axis geometry from 20 to 30 hpf in scospondinicm15/icm15 mutants.
Representative images of the morphology of a control sibling (left) and a scospondinicm15/icm15 embryo (right) followed over time at 20, 22, 24, 28, and 30 hpf. Embryos were obtained from a mating of scospondinicm15/+ parents, staged at 20 hpf and maintained at 28.5°C. Body axis curvature in scospondinicm15/icm15 mutants becomes visible as early as 28 hpf and fully recognizable at 30 hpf. Scale bar: 0.5 mm.
Figure 2 with 2 supplements
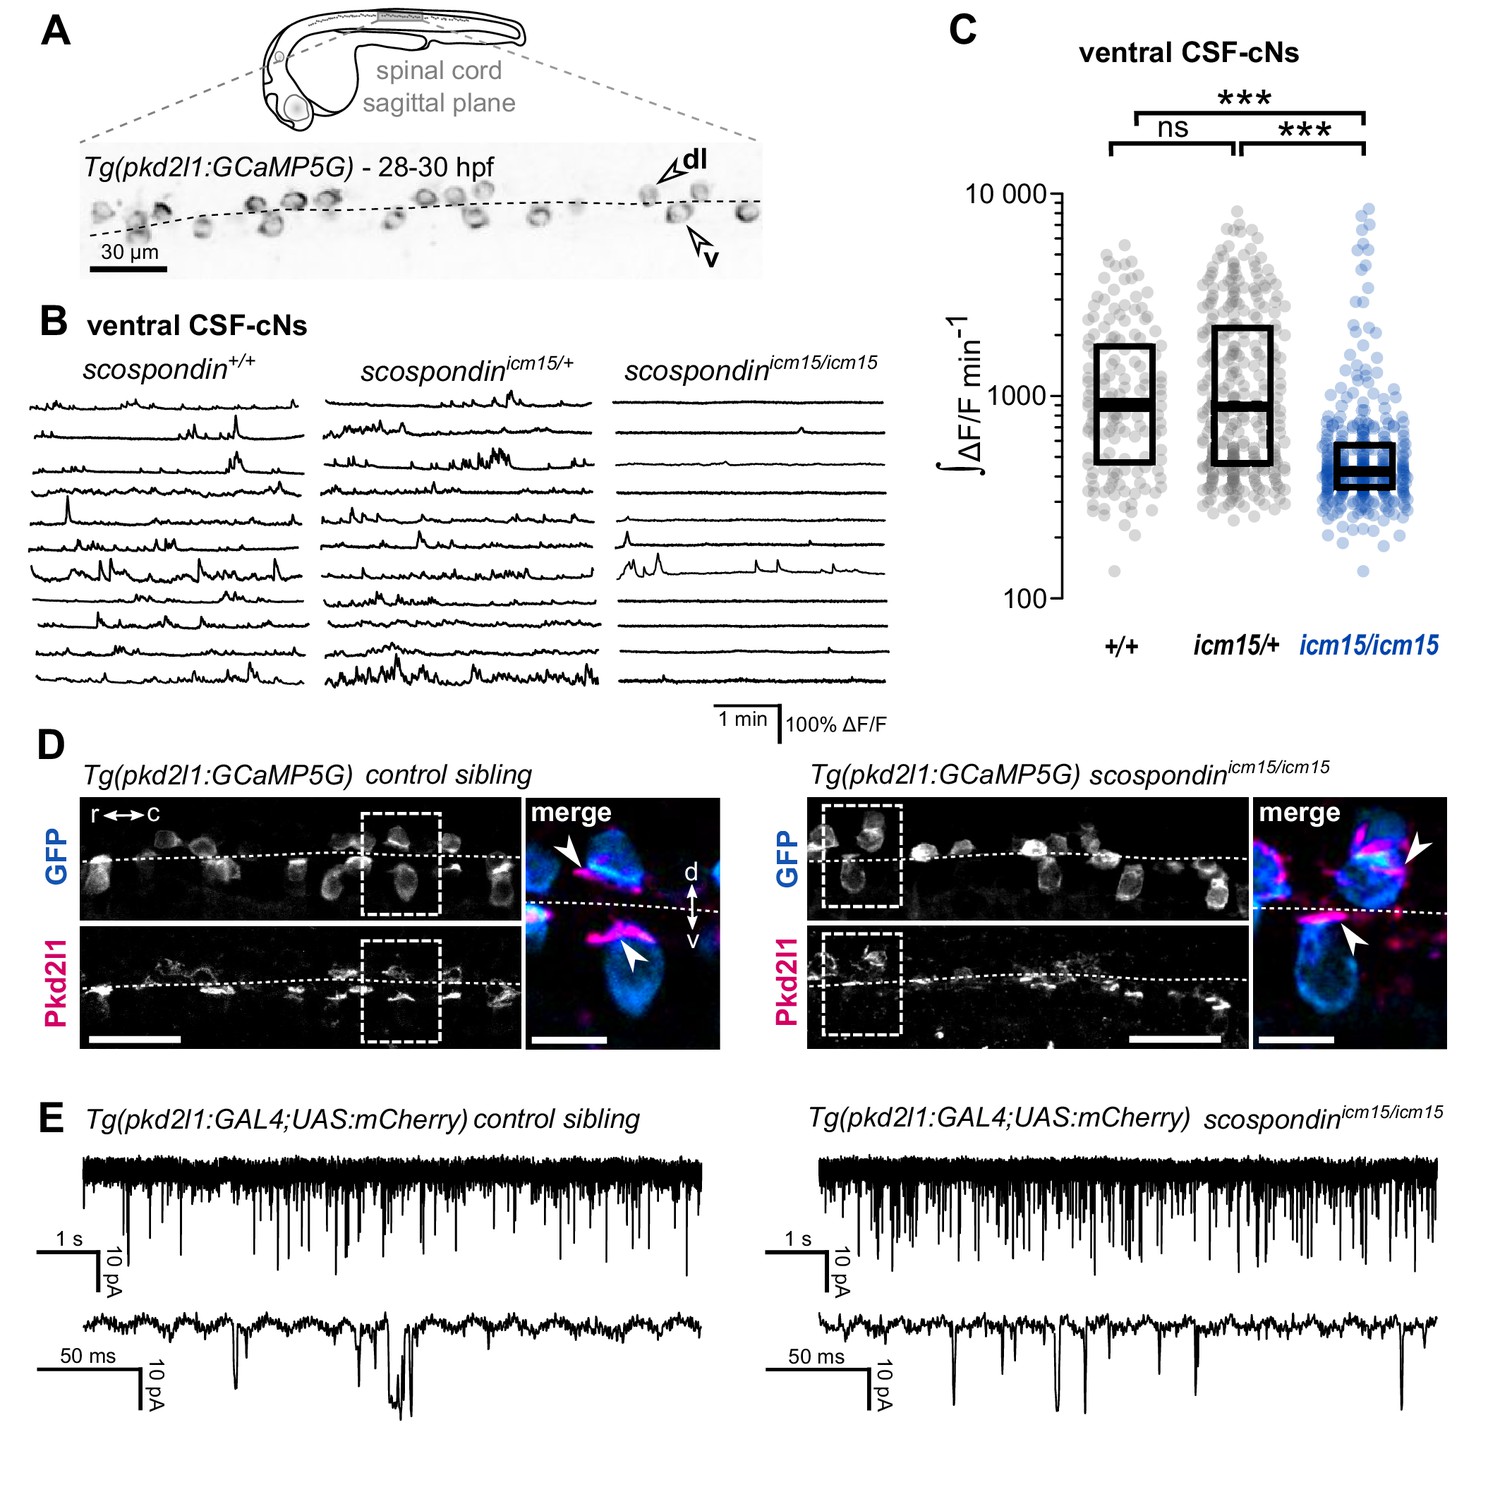
The Reissner fiber is required for the spontaneous calcium variations of ventral CSF-contacting neurons.
(A) 28–30 hpf embryos expressing the GCaMP5G calcium reporter in CSF-contacting neurons were imaged on the lateral side. Tg(pkd2l1:GCaMP5G) embryos label both dorso-lateral (dl, above the dotted line) and ventral (v, below the dotted line) CSF-contacting neurons (arrowheads). Scale bar: 30 µm. (B) Representative traces of calcium variations in individual ventral CSF-contacting neurons in wild-type (scospondin+/+), heterozygous (scospondinicm15/+) and scospondinicm15/icm15 mutants. Sample traces from individual cells with integral ΔF/F values ranging around the median distribution of the imaged population are represented for each genotype (n = 11 cells). (C) Quantification of the normalized integrated calcium variation over time of ventral CSF-contacting neurons in wild-type (+/+), heterozygous (icm15/+) and scospondinicm15/icm15 mutants (icm15/icm15, blue). Data were collected from five independent experiments and include 10 wild-type embryos (n = 146 cells), 20 heterozygous embryos (n = 287 cells) and 21 scospondinicm15/icm15 mutants (n = 307 cells). Each point represents a single cell. Bottom and top edges of the boxes indicate the 1st and 3rd quartiles. Bold lines represent the median value for each distribution. ns p>0.05, ***p<0.001 (Kolmogorov-Smirnov test). (D) Immunohistochemistry for Pkd2l1 (magenta) and GFP (blue) in Tg(pkd2l1:GCaMP5G) embryos at 30 hpf in the spinal cord of a control sibling (left) and scospondinicm15/icm15 mutant (right). Scale bar: 30 µm. Magnification of the area delineated by dotted line boxes is represented for each condition (r: rostral, c: caudal, d: dorsal, v: ventral). Scale bar: 10 µm. scospondinicm15/icm15 embryos show a similar localization of the Pkd2l1 protein at the developing apical extension (arrowheads) of the CSF-cNs (labeled by the GFP antibody, blue) compared to control siblings. (E) In vivo voltage-clamp recordings from CSF-contacting neurons in the Tg(pkd2l1:GAL4;UAS:mCherry) line at 30 hpf in control embryos (left) and scospondinicm15/icm15 mutants (right). Note the extensive number of events in both conditions (top traces). Bottom traces represent higher temporal magnifications and allow distinguishing single channel openings. See also Figure 2—figure supplement 1 and Figure 2—video 1.
-
Figure 2—source data 1
Data for Figure 2C and Figure 2—figure supplement 1B–C.
- https://cdn.elifesciences.org/articles/59469/elife-59469-fig2-data1-v3.xlsx
Figure 2—figure supplement 1
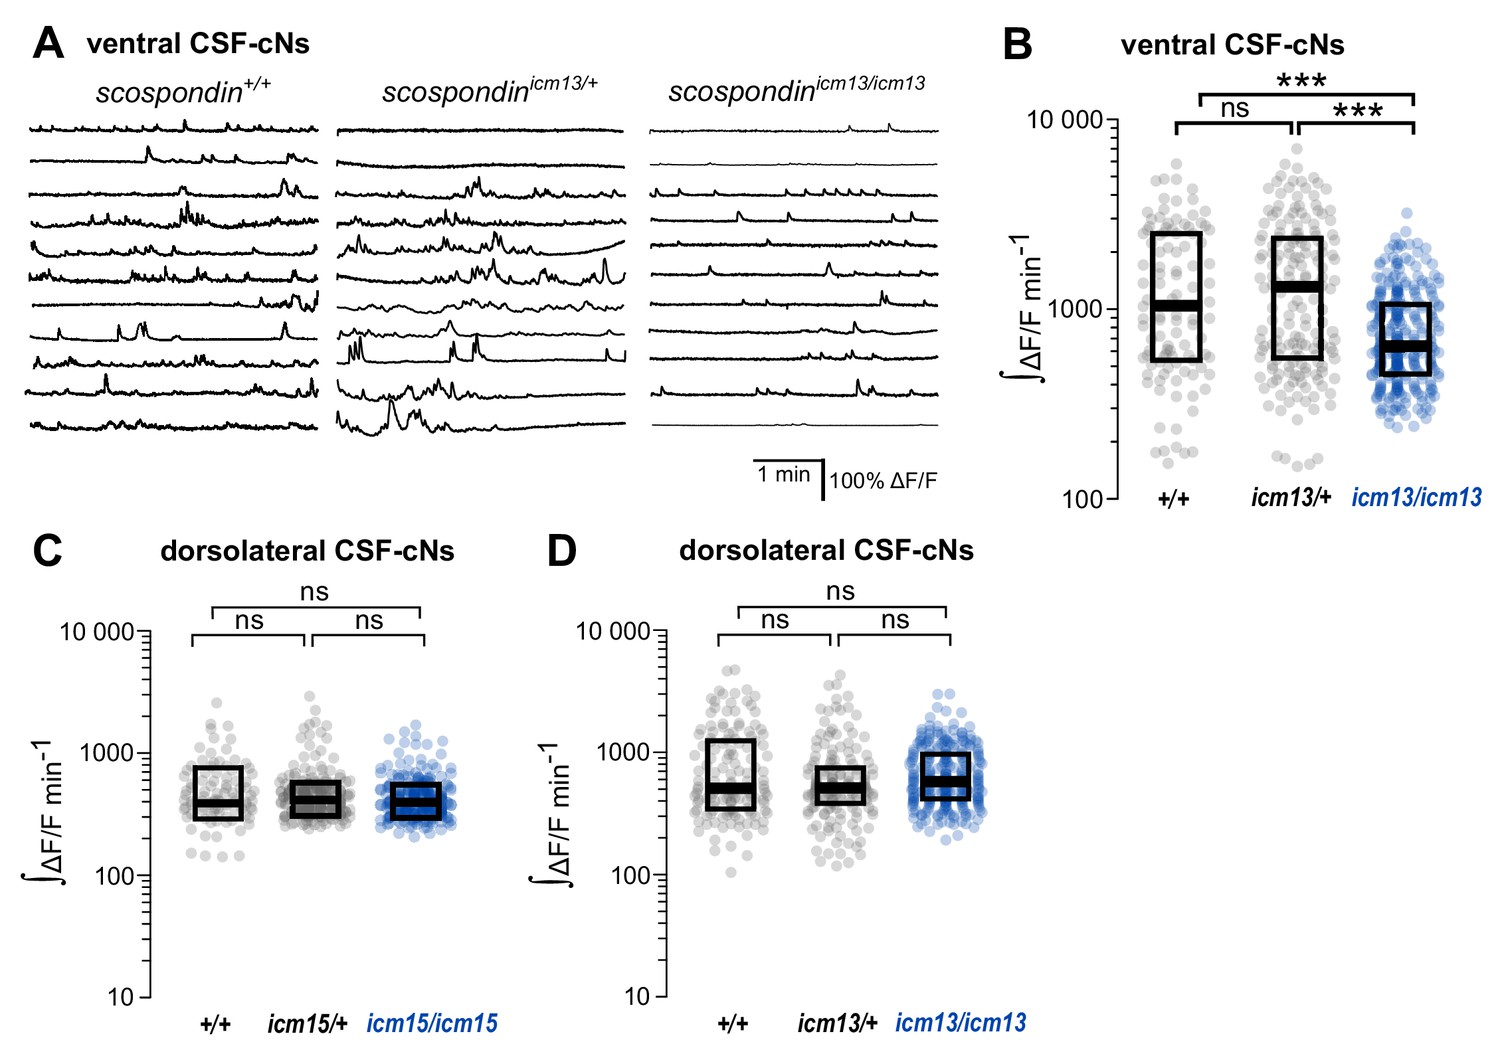
The spontaneous activity of dorso-lateral CSF-contacting neurons does not require the Reissner fiber in the embryo.
(A) Traces of calcium variations in ventral CSF-contacting neurons at 30 hpf in wild-type (scospondin+/+), heterozygous (scospondinicm13/+) and scospondinicm13/icm13 null mutants. Sample traces from individual cells with integral ΔF/F values ranging around the median distribution of the imaged population are represented for each genotype (n = 11). (B) Quantification of the normalized integrated calcium variation over time of ventral CSF-contacting neurons in wild-type (+/+), heterozygous (icm13/+) and scospondinicm13/icm13 mutants (icm13/icm13, blue). Data were collected from three independent experiments and include eight wild-type embryos (n = 107 cells), 13 heterozygous embryos (n = 176 cells) and 22 scospondinicm15/icm15 mutants (n = 277 cells). Each point represents a single cell. Bottom and top edges of the boxes indicate the 1st and 3rd quartiles. Bold lines represent the median value for each distribution. ns p>0.05, ***p<0.001 (Kolmogorov–Smirnov test). (C, D) Quantification of the normalized integrated calcium variations over time of dorsolateral CSF-contacting neurons in 30 hpf embryos obtained from scospondinicm15/+ incrosses (C) and scospondinicm13/+ incrosses (D) n = 95, 243, and 255 cells in wild-type, heterozygous and scospondinicm15/icm15 embryos, respectively (C); n = 141, 176, and 168 cells in wild-type, heterozygous, and scospondinicm13/icm13 embryos, respectively (D). ns p>0.05 (Kolmogorov-Smirnov test).
Figure 2—video 1
Intracellular calcium transients of ventral CSF-contacting neurons are reduced in scospondin mutants.
Sagittal views of the spinal cord of Tg(pkd2l1:GCaMP5G) embryos at 30 hpf. scospondin+/+ (top), scospondinicm15/+ (middle) and scospondinicm15/icm15 siblings (bottom) are represented. In wild-type and heterozygous embryos, ventral CSF-contacting neurons are more active that dorso-lateral ones. Note the sharp decrease in calcium variations of ventral CSF contacting neurons in the homozygous mutant embryo compared to wild-type and heterozygous counterparts. Data were collected at 4 Hz and displayed at 80 Hz. Scale bar: 30 µm.
Figure 3 with 1 supplement
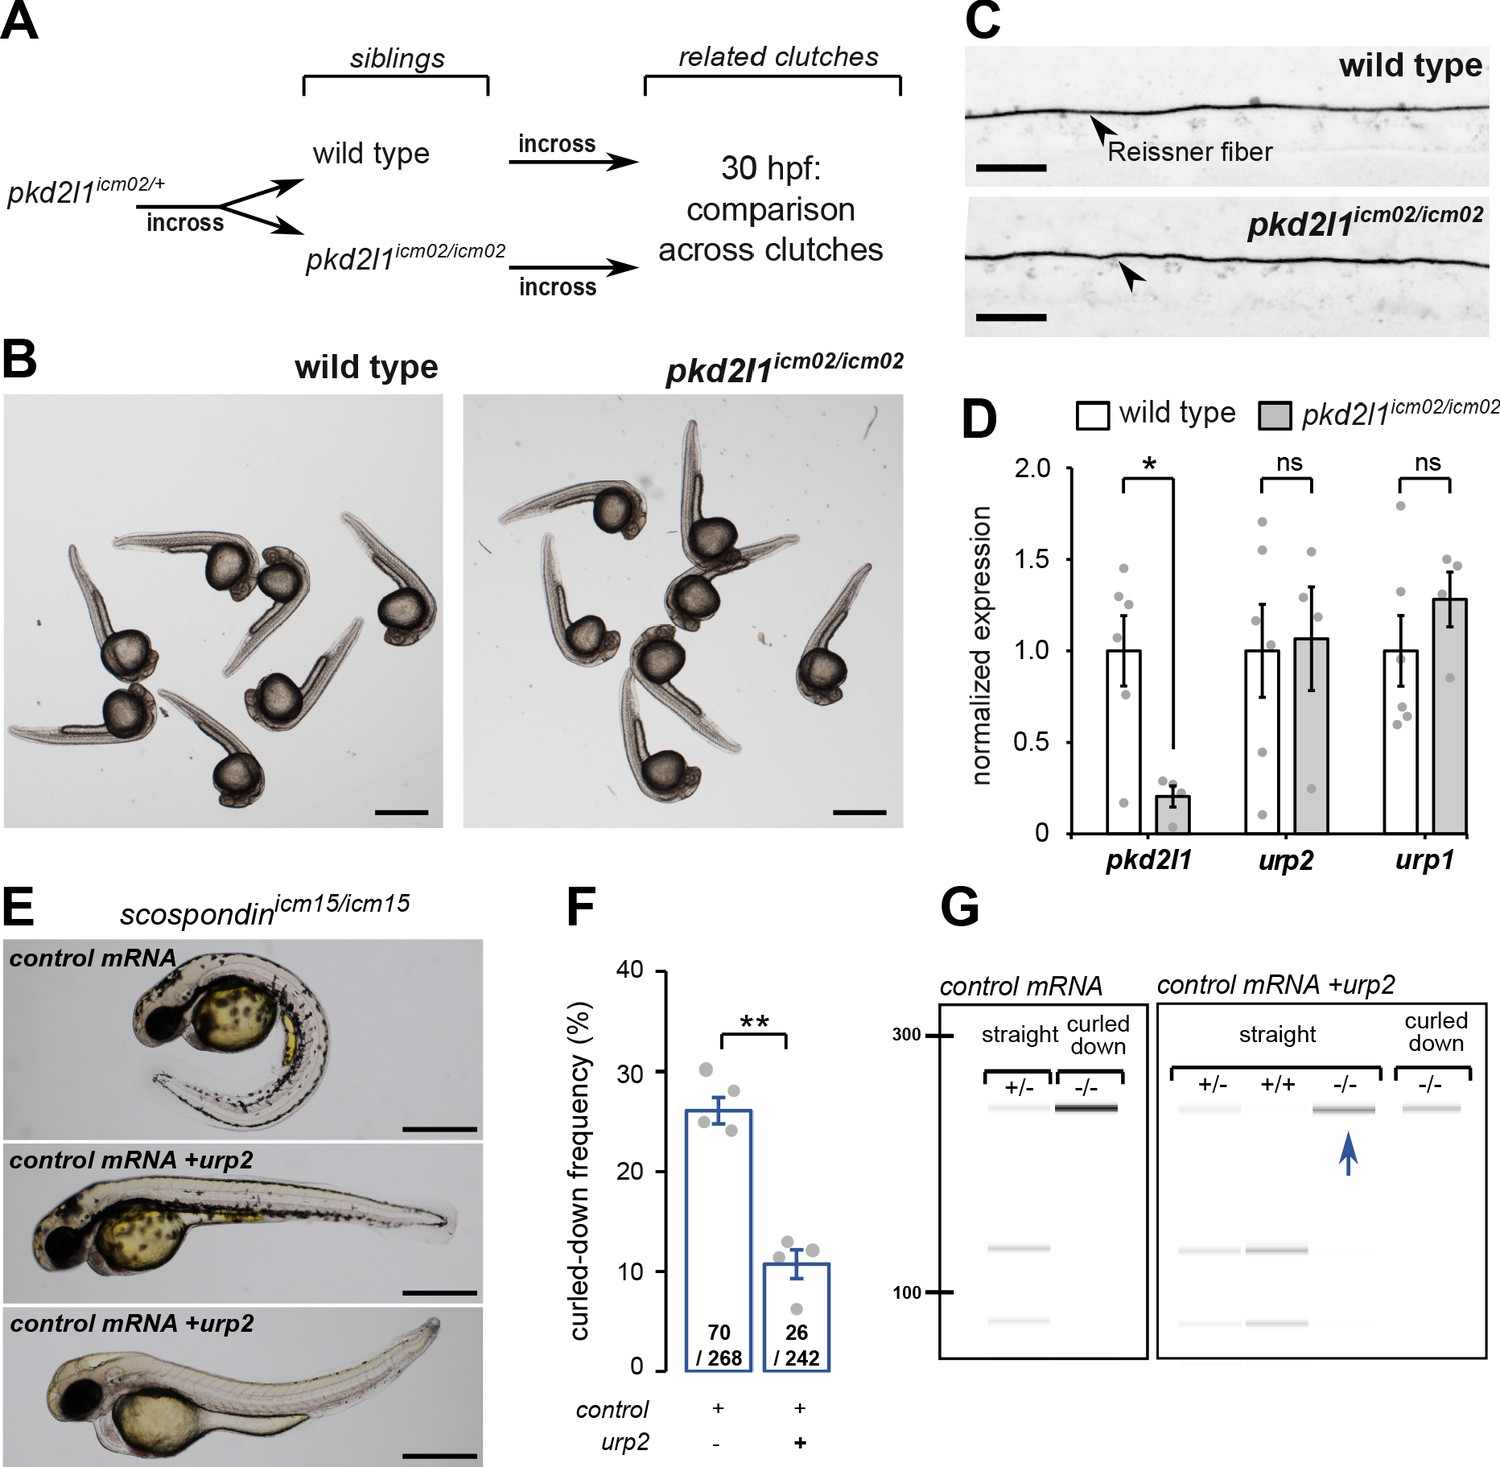
urp2 expression is Pkd2l1-independent and is important for the Reissner fiber-dependent straightening of the embryonic posterior axis.
(A) Adult wild-type and pkd2l1icm02/icm02 siblings were incrossed to generate related clutches that were analyzed at 30 hpf. (B) Representative pictures of wild-type (left) and pkd2l1icm02/icm02 embryos (right) at 30 hpf. Note that mutant embryos develop a straight posterior axis. Scale bar: 0.5 mm. (C) Representative immunohistochemistry for the Reissner fiber imaged from the spinal cord of a wild-type (top, one representative embryo out of 20) and a pkd2l1icm02/icm02 embryo (bottom, one representative embryo out of 20). Note that the Reissner fiber forms properly in the mutant. Scale bars: 10 µm. (D) qRT-PCR analysis of mRNA levels of pkd2l1, urp2, and urp1 in wild-type (white) and pkd2l1icm02/icm02 embryos (grey). Data are represented as mean ± SEM. N = 6 independent replicates for wild-type and four for pkd2l1icm02/icm02. Each point represents a single experimental replicate. ns p>0.05, *p<0.05 (unpaired t-test). (E) Representative pictures of scospondinicm15/icm15 mutant embryos at 48 hpf after one cell stage injections of a control mRNA alone or of a mix containing a control mRNA and urp2 mRNA (middle and bottom). Note that upon control injections, scospondinicm15/icm15 mutants display at typical curled-down phenotype, while urp2 overexpression can lead to straightened (middle) or slightly curled-up posterior axis (bottom). Scale bar: 0.5 mm. (F) Quantification at 48 hpf of curled-down frequency in embryos obtained from scospondinicm15/+ incrosses upon control mRNA injections (n = 70 curled-down animals out of 268) or urp2 mRNA overexpression (26 curled-down embryos out of 242). Data were collected from four independent clutches and represented as mean ± SEM. **p<0.01 (paired t-test). (G) Injected embryos were genotyped at 48 hpf based on the loss of a restriction site in the scospondin mutant allele leading to a band resistant to digestion (-/-). While mutant animals are exclusively curled-down in control conditions, urp2 mRNA overexpression leads to the detection of mutant animals displaying a straight body axis (blue arrow). See also Figure 3—figure supplement 1.
-
Figure 3—source data 1
Data for Figure 3D.
- https://cdn.elifesciences.org/articles/59469/elife-59469-fig3-data1-v3.xlsx
Figure 3—figure supplement 1
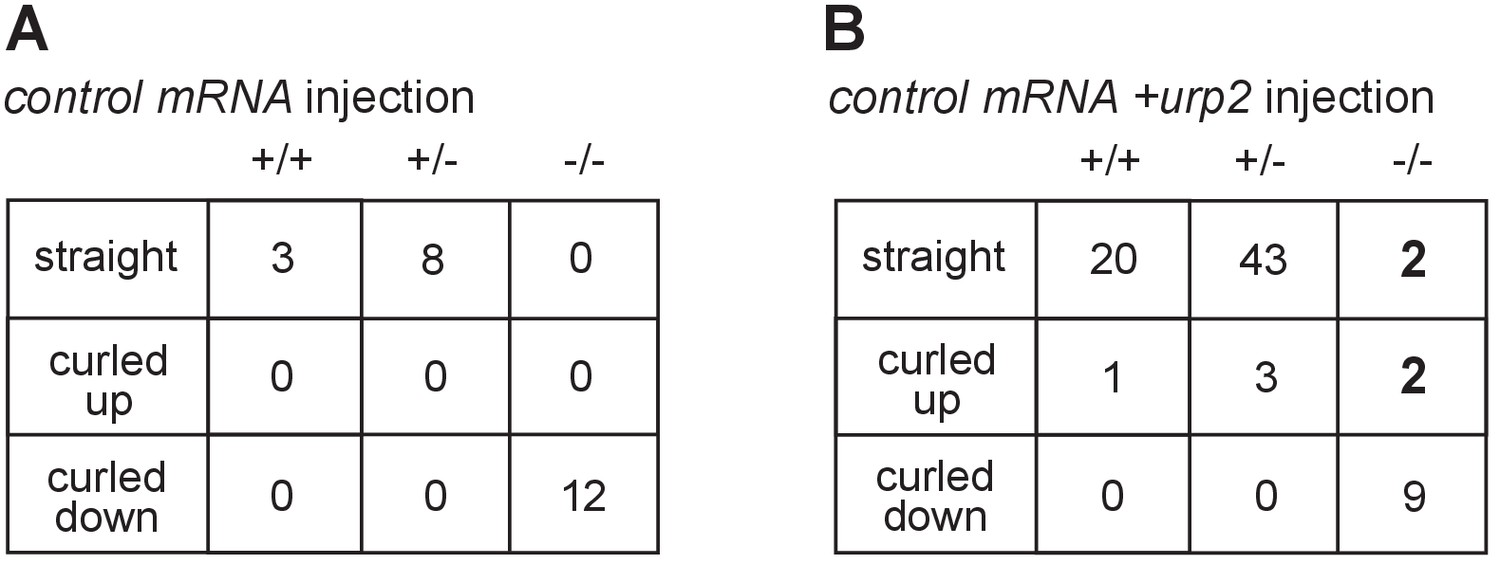
urp2 overexpression recues body axis curvature defects in scospondin mutants.
Summary of straight, curled-up and curled-down phenotypes detected in wild-type (+/+), scospondinicm15/+ (+/-) and scospondinicm15/icm15 mutant embryos (-/-) at 48 hpf after one cell stage injection of control mRNA (A) or control +urp2 mRNA (B). Note that two mutant (-/-) embryos were detected as straight and two as curled-up upon urp2 overexpression. Data were collected over three independent clutches.
Figure 4
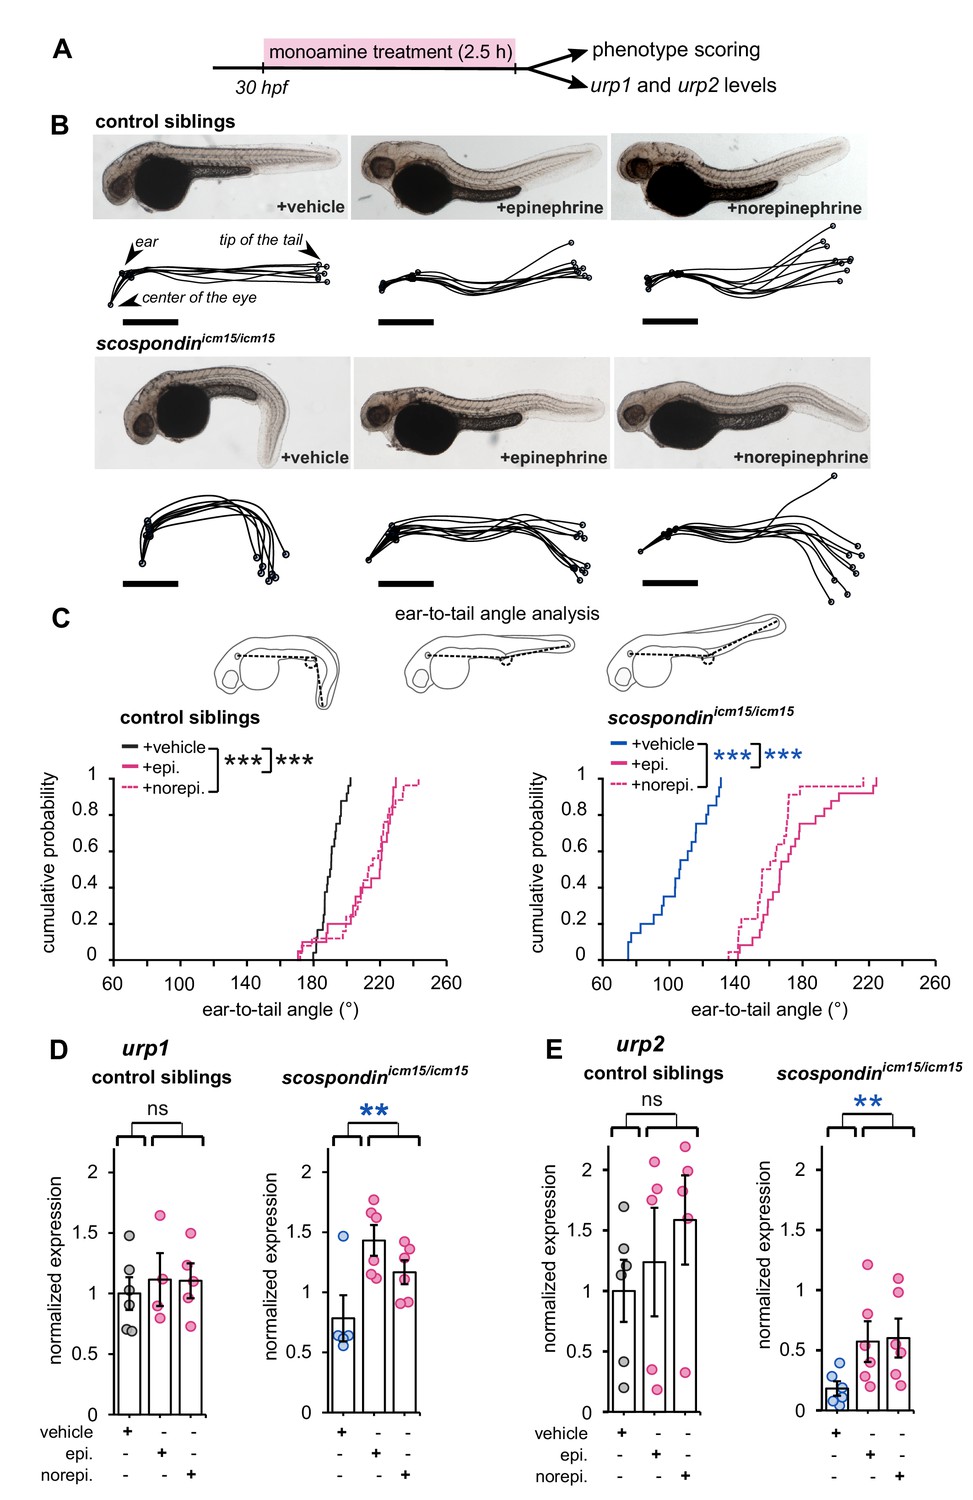
Epinephrine and norepinephrine compensate the loss of the Reissner fiber for body axis straightening and increase urp expression.
(A) Curled-down scospondinicm15/icm15 mutants and their control siblings were sorted at 30 hpf according to the geometry of their posterior axis and then exposed to a E3 solution (vehicle), epinephrine or norepinephrine for 2.5 hr prior to phenotype scoring and RNA extraction. (B) Representative pictures of control siblings (top) and scospondinicm15/icm15 mutants (bottom) after vehicle (left), epinephrine (middle) or norepinephrine (right) treatments. For each condition, the global morphologies of treated embryos are represented by superimposed traces linking the center of the eye, the ear and the tip of the tail in one representative clutch. Scale bar: 0.5 mm. (C) Quantification of the angle formed between the ear, the caudal limit of the yolk extension and the tip of the tail (as shown on the schematics, top) in control siblings (bottom left) and scospondinicm15/icm15 mutants (bottom right). Data were collected from three independent experiments and include 24, 20, 25 control siblings treated with a vehicle solution, epinephrine, norepinephrine respectively (black, solid pink, and dotted pink line respectively) and 20, 24, 22 scospondinicm15/icm15 embryos treated with a vehicle solution, epinephrine, norepinephrine respectively (blue, solid pink, and dotted pink line respectively) ***p<0.001 (Kolmogorov-Smirnov test). (D, E) qRT-PCR analysis of the mRNA level of urp1 (D) and urp2 (E) in control siblings (left) and scospondinicm15/icm15 embryos (right). Data are represented as mean ± SEM. n = 4 to 6 independent replicates for each condition. Each point represents a single experimental replicate. ns p>0.05, **p<0.01 (GLM test).
-
Figure 4—source data 1
Data for Figure 4C–E.
- https://cdn.elifesciences.org/articles/59469/elife-59469-fig4-data1-v3.xlsx
Figure 5 with 2 supplements
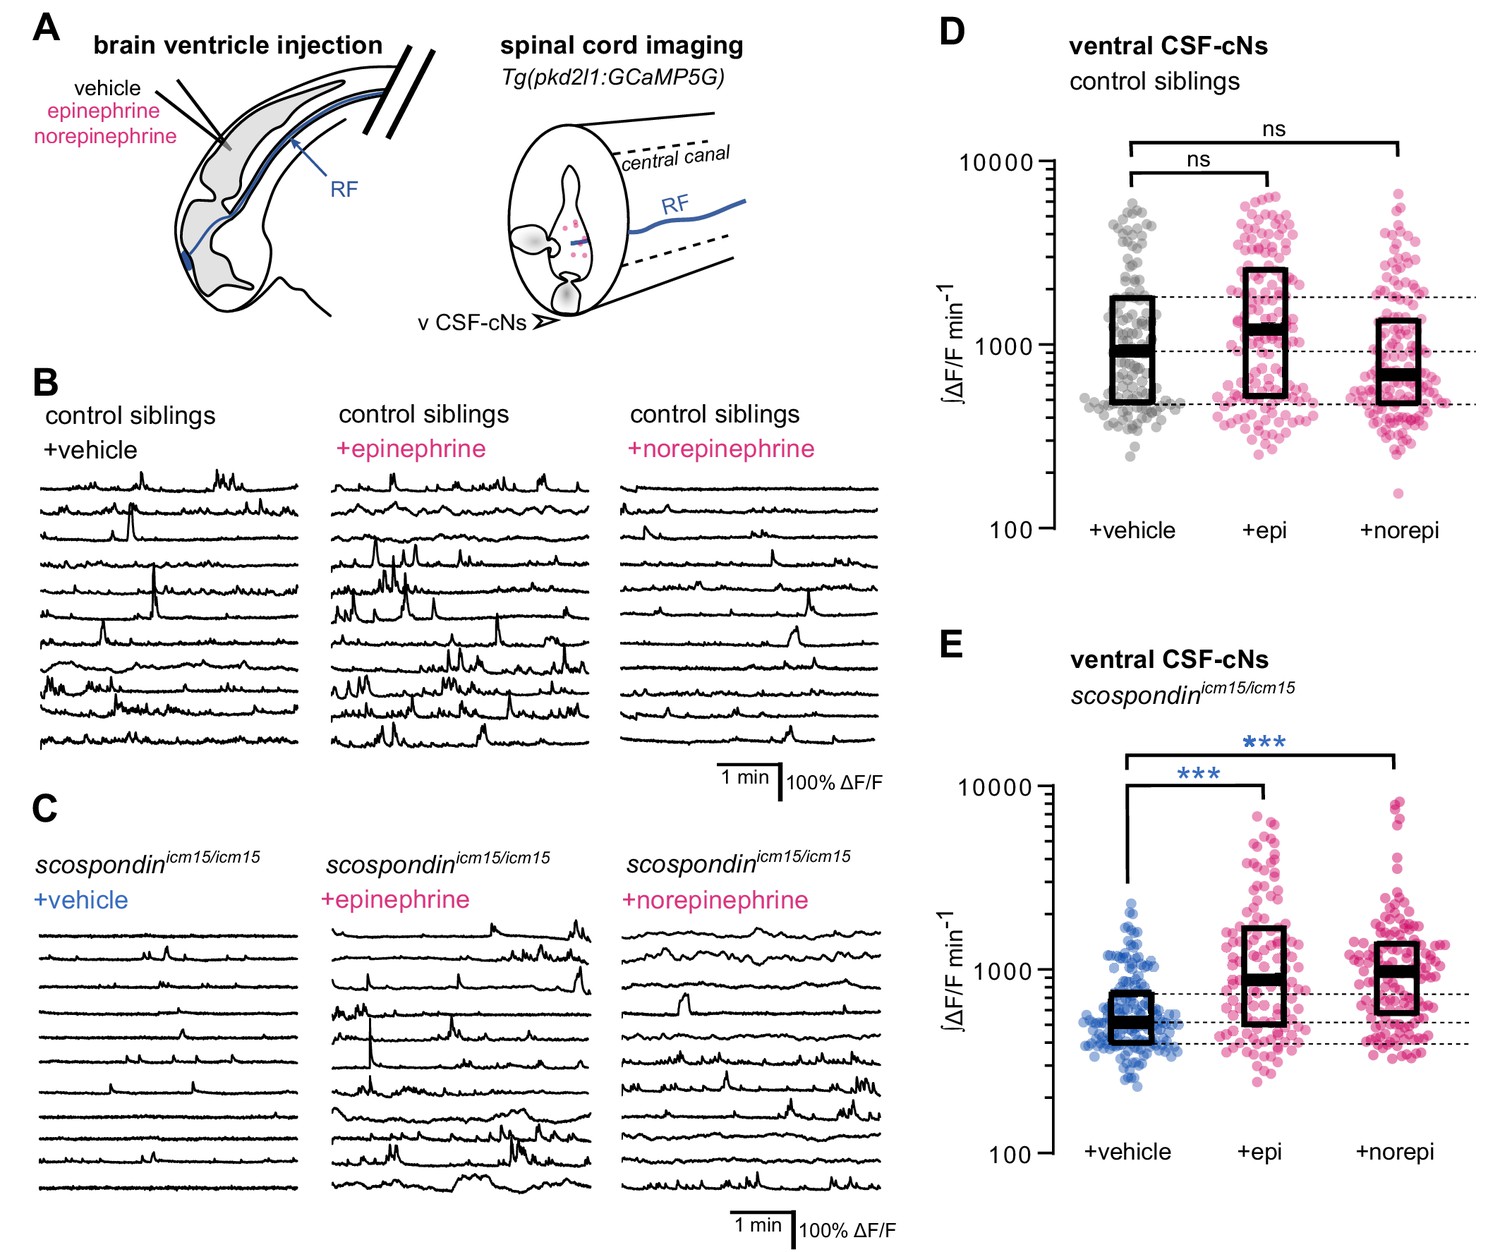
Local monoamine delivery restores calcium variations of ventral CSF-contacting neurons in scospondin mutants.
(A) Tg(pkd2l1:GCaMP5G) embryos we used to perform hindbrain ventricle injections at 30 hpf of artificial CSF (vehicle), epinephrine or norepinephrine (left). Intracellular calcium variations in ventral CSF-contacting neurons (v CSF-cNs, arrowhead) were recorded in the spinal cord 30 min after the injection to allow monoamines (pink dots) diffusing down the central can where bathes the Reissner fiber (RF) in control embryos. (B, C) Representative traces of calcium variations of individual ventral CSF-contacting neurons in control siblings (B) and scospondinicm15/icm15 mutants (C) after vehicle (left), epinephrine (middle) and norepinephrine injections (right). Sample traces from individual cells with integral ΔF/F values ranging around the median distribution of the imaged population are represented for each condition (n = 11). (D, E) Quantification of the normalized integrated intracellular calcium variation over time of ventral CSF-contacting neurons in control siblings (D) and scospondinicm15/icm15 mutants (E). Data were collected from three independent experiments and include 9, 11, and 12 control embryos recorded after vehicle, epinephrine and norepinephrine injections respectively (n = 131, 150, and 164 cells respectively) and 11, 10, and 10 scospondinicm15/icm15 mutants after vehicle, epinephrine and norepinephrine injections respectively (n = 168, 124, and 150 cells respectively). Each point represents a single cell. Bottom and top edges of the boxes indicate the 1st and 3rd quartiles. Dotted lines represent the distribution range around the 1st and 3rd quartiles of control embryos injected with a vehicle solution. Bold lines represent the median value for each distribution. ns p>0.05, ***p<0.001 (Kolmogorov-Smirnov test). See also Figure 5—figure supplement 1 and Figure 5-video 1.
-
Figure 5—source data 1
Data for Figure 5D–E.
- https://cdn.elifesciences.org/articles/59469/elife-59469-fig5-data1-v3.xlsx
Figure 5—figure supplement 1
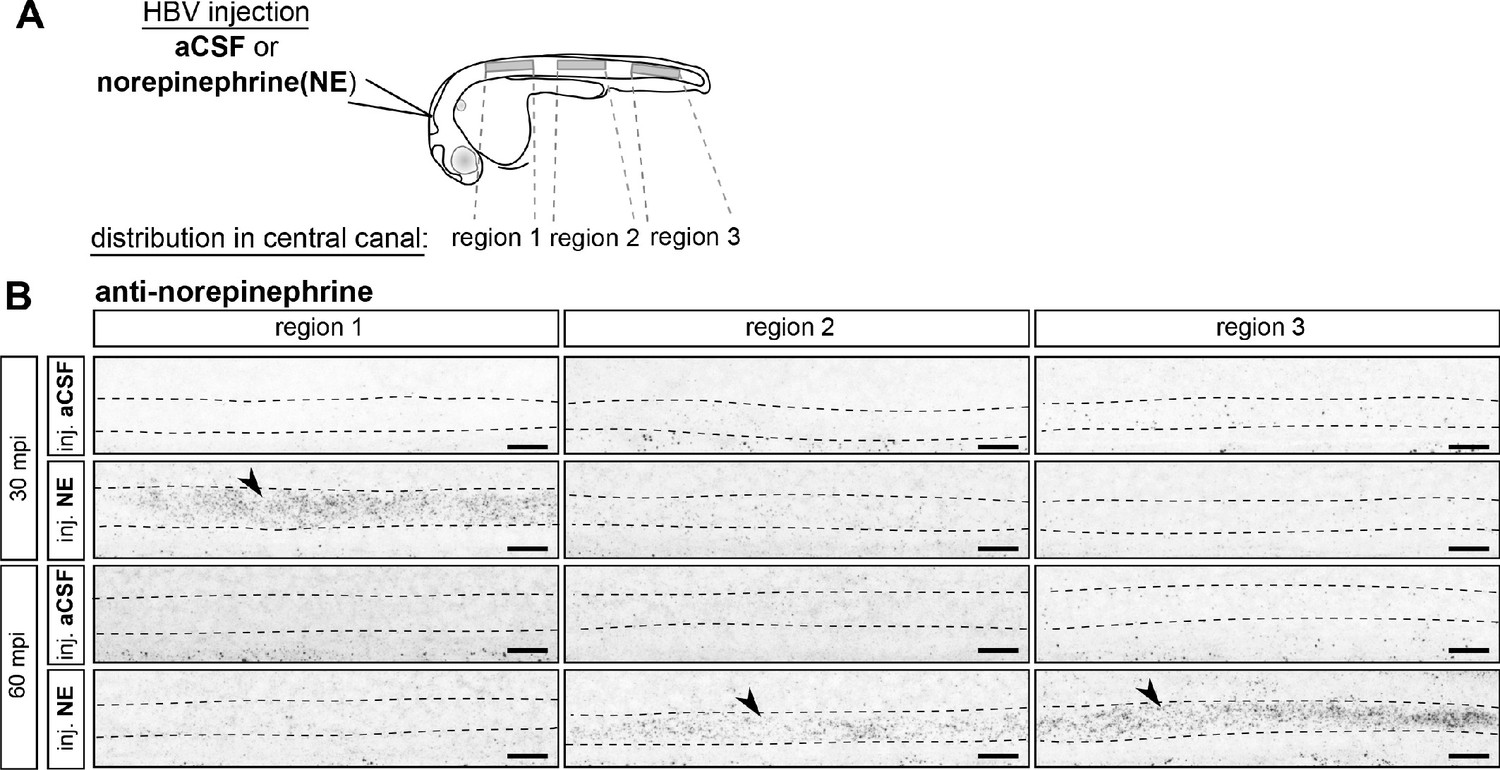
Exogenous norepinephrine injected in brain ventricles is transported to the spinal cord and saturates the central canal 60 min post-injection.
(A) 30 hpf embryos were mounted laterally and injected in the hindbrain ventricle (HBV) with either aCSF or 3 mM norepinephrine (NE). Embryos from each group were fixed 30 and 60 min post-injection (mpi) and processed for an immunostaining against norepinephrine. Three regions in the spinal cord were imaged for each experimental condition (boxed regions): above the yolk (rostral, region 1), above the yolk extension (middle, region 2) and after the anal region (caudal, region 3). (B) Representative maximal z-projections of norepinephrine-positive signals detected after either the injection of aCSF (inj. aCSF) or exogenous norepinephrine (inj. NE), 30 and 60 min post-injection (mpi). The same imaging parameters and image processing parameters were applied to all experimental groups to avoid saturation for the most intense signals. Sagittal views of the three regions of the spinal cord shown in (A) are represented for a single representative embryo (n = 7 embryos 30 min post-aCSF injection; n = 7 embryos 30 min post-norepinephrine injection; n = 6 embryos 60 min post-aCSF injection; n = 8 embryos 60 min post-norepinephrine injection). Note that norepinephrine injected in the HBV saturates the central canal of the spinal cord (delineated by dotted lines) in the rostral most region 30 min post-injection, and the caudal most region 60 min post-injection (arrowheads). Embryos are oriented dorsal to the top and rostral to the left. Scale bars: 10 µm.
Figure 5—video 1
Epinephrine and norepinephrine restore intracellular calcium transients of ventral CSF-contacting neurons in scospondin mutants.
Sagittal views of the spinal cord of Tg(pkd2l1:GCaMP5G) embryos at 30 hpf in a straight control sibling (top) and curled-down scospondinicm15/icm15 mutants after vehicle, epinephrine or norepinephrine injections in the hindbrain ventricle. Note that calcium transients are restored in a subset of ventral CSF-contacting neurons of scospondinicm15/icm15 embryos that received epinephrine and norepinephrine injections compared to mutants that received a vehicle injection. Data were collected at 4 Hz and displayed at 80 Hz. Scale bar: 30 µm.
Figure 6 with 1 supplement
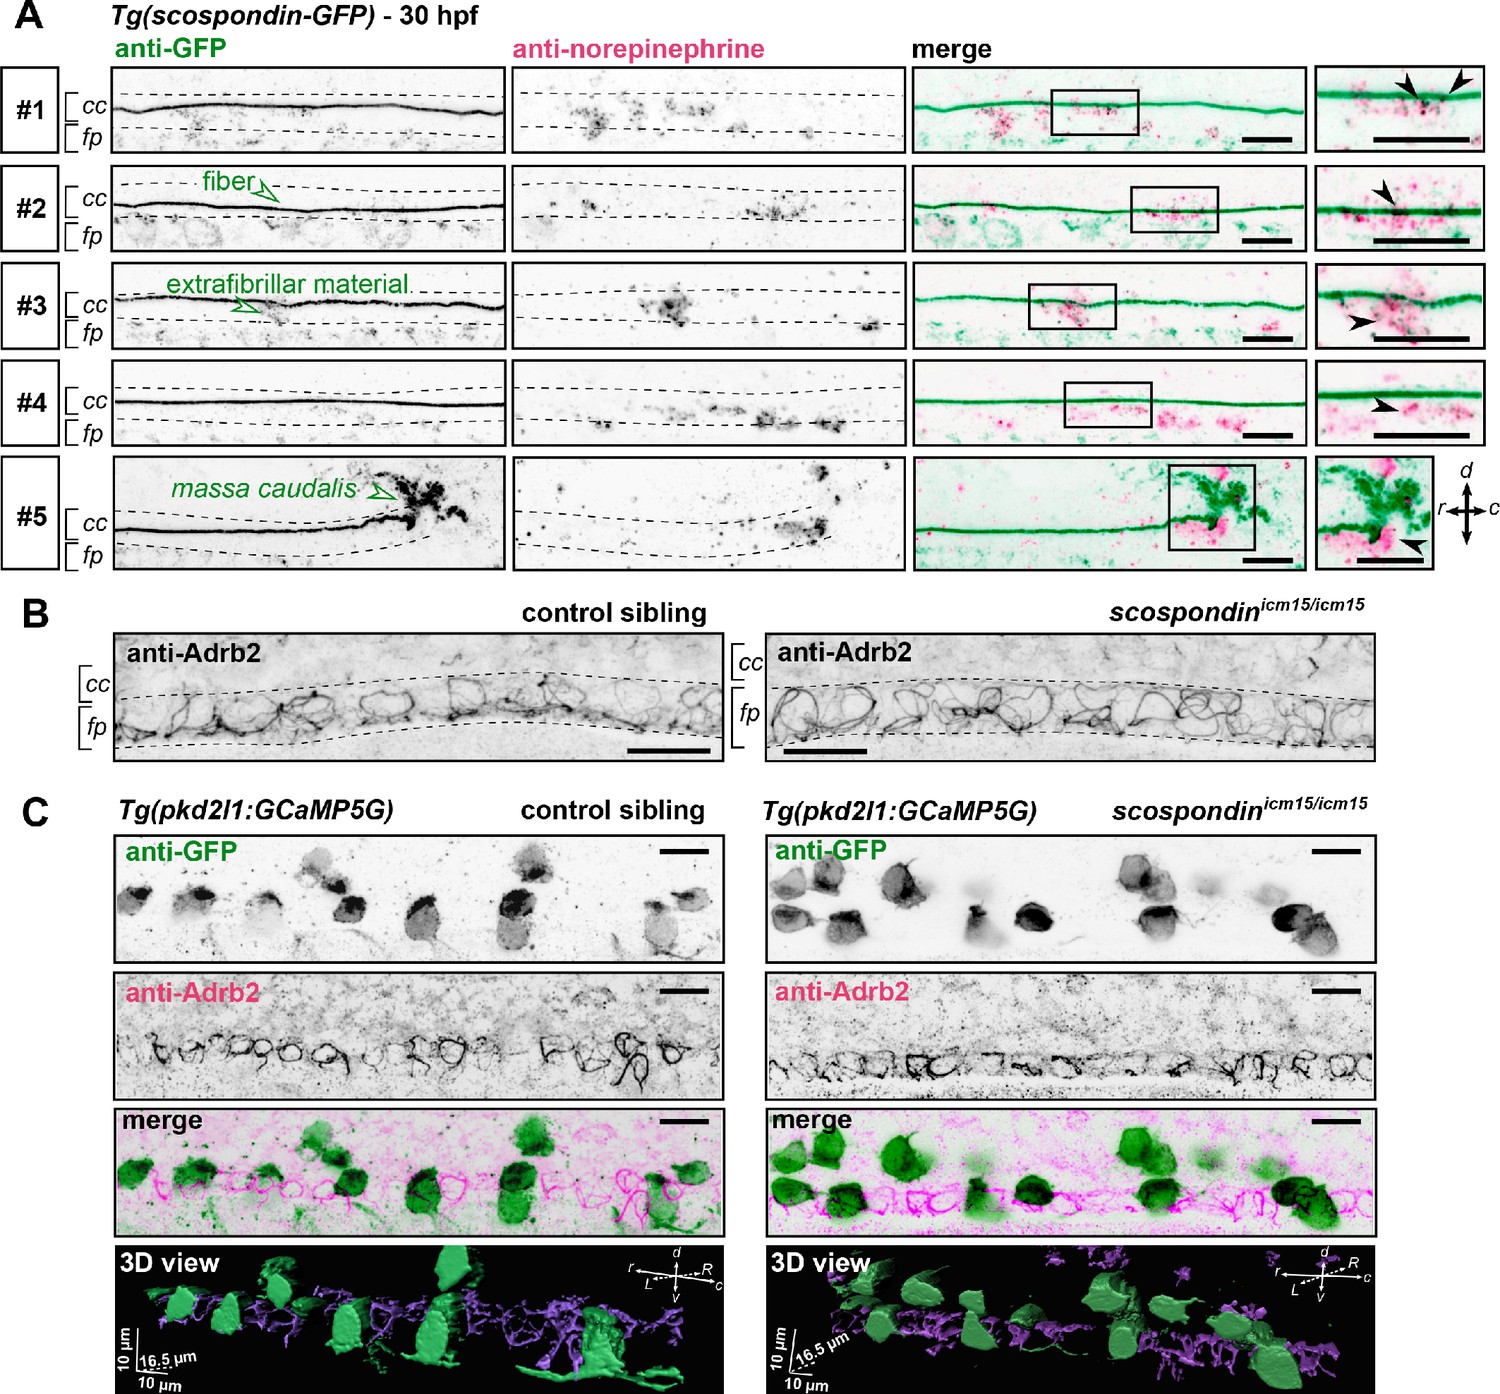
The adrenergic receptor Adrb2 is expressed in cells ventral to the central canal in which norepinephrine can be detected.
(A) Double immunodetection of GFP (left) and endogenous norepinephrine (middle) in the spinal cord of scospondinut24Tg embryos at 30 hpf imaged laterally. Merged signals and close up of boxed regions are represented on the right. 5 representative examples (#1 to #5) out of 26 embryos are shown (no signal was detected in 6 embryos out of 26 in total, n = 2 independent experiments). In the central canal, norepinephrine positive signals can be detected as colocalized with the Reissner fiber itself (black arrowheads; embryos #1, 2, 3), with extrafibrillar material in the central canal (black arrowheads; embryos #4 and #5), and closely apposed to the massa caudalis located after the caudal limit of the central canal (black arrowhead; embryo #6). Scale bars: 10 µm. r: rostral; c: caudal; d: dorsal; v: ventral; cc: central canal; fp: floor plate. (B) Immunohistochemistry for the adrenergic receptor Adrb2 in a 30 hpf control sibling (left, representative example out of 8 embryos) and a scospondinicm15/icm15 embryo (right, representative example out of 9 embryos). Adrb2 is distributed along the midline of the ventral most region of the neural tube (corresponding to the floor plate, fp) at the interface with the central canal (cc). Embryos are oriented rostral to the left and dorsal to the top. Scale bars: 10 µm. (C) Sagittal views of double immunostainings against GFP and Adrb2 in the spinal cord of Tg(pkd2l1:GCaMP5G) embryos at 30 hpf. Maximal z-projections are shown for a control sibling (left; one embryo out of 12) and a scospondinicm15/icm15 mutant (right; one embryo out of 8). Merged signals show that GFP-positive and Adrb2 positive signals cover different domains in the ventral most region of the neural tube. 3D reconstructions of the same field of views (bottom panel: GFP: green; Adrb2: purple) further illustrate that Adrb2 is enriched in a distinct cell population that is medial to ventral CSF-contacting neurons. Scale bars: 10 µm. L: left; R: right; See also Figure 6—video 1.
Figure 6—video 1
Adrb2 is expressed in the midline of the ventral most region of the neural tube that is different from that of CSF-contacting neurons.
Z-stack of a Tg(pkd2l1:GCaMP5G) control sibling (top) and a Tg(pkd2l1:GCaMP5G); scospondinicm15/icm15 mutant (bottom) at 30 hpf immunostained against GFP (green) and Adrb2 (magenta). In both cases, Adrb2-positive domains are inserted between two rows of GFP-positive ventral CSF-contacting neurons (both domains are not colocalized). The video represents a 20.5 µm deep slice (0.5 µm z-step) for both embryos. Scale bar: 10 µm.
Tables
Key resources table
| Reagent type (species) or resource | Designation | Source or reference | Identifiers | Additional information |
|---|---|---|---|---|
| Genetic reagent (D. rerio) | scospondinicm13 | Cantaut-Belarif et al., 2018 | ZFIN : ZDB-ALT-181113–3 | |
| Genetic reagent (D. rerio) | scospondinicm15 | Cantaut-Belarif et al., 2018 | ZFIN: ZDB-ALT- 181113–4 | |
| Genetic reagent (D. rerio) | pkd2l1icm02 | Böhm et al., 2016 | ZFIN : ZDB-ALT-160119–6 | |
| Genetic reagent (D. rerio) | Tg(pkd2l1:GCaMP5G)icm07Tg | Böhm et al., 2016 | ZFIN: ZDB-ALT-160119–4 | |
| Genetic reagent (D. rerio) | Tg(pkd2l1:GAL4)icm10Tg | Fidelin et al., 2015 | ZFIN: ZBD-ALT-150324–1 | |
| Genetic reagent (D. rerio) | Tg(UAS:mCherry) | Robles et al., 2014 | ZFIN: ZBD-ALT-130702–1 | |
| Genetic reagent (D. rerio) | scospondinut24Tg | Troutwine et al., 2020 | R. S. Gray lab | |
| Recombinant DNA reagent | pCS2-urp2 plasmid | G. Pézeron, this work | Used for RNA synthesis | |
| Recombinant DNA reagent | pCS2-Ras-eGFP plasmid | Ségalen et al., 2010 | Used for RNA synthesis | |
| Sequence-based reagent | URP2_BamHI_F gcgcgcGGATCC gtatctgtagaatctgctttgctgc | This work | forward oligonucleotide used for urp2 cloning | |
| Sequence-based reagent | URP2_XbaI_R gcgcgcTCTAGA ggcagagggtcagtcgtgttat | This work | reverse oligonucleotide used for urp2 cloning | |
| Sequence-based reagent | urp2 forward: CCACCGGATCACCATCATTACC | This work | qPCR oligonucleotide | |
| Sequence-based reagent | urp2 reverse: GATGCCACCGCTGTCTATAGTG | This work | qPCR oligonucleotide | |
| Sequence-based reagent | urp1 forward: TGCGCTGCCTCTGTATTCAG | This work | qPCR oligonucleotide | |
| Sequence-based reagent | urp1 reverse: CTTTGTCCGTCTTCAACCTCTG | This work | qPCR oligonucleotide | |
| Sequence-based reagent | pkd2l1 forward: GCGAACTATGCCCAATGAGG | This work | qPCR oligonucleotide | |
| Sequence-based reagent | pkd2l1 reverse: TCTCAAAGCTGTTCCCCACA | This work | qPCR oligonucleotide | |
| Sequence-based reagent | lsm12b forward: GAGACTCCTCCTCCTCTAGCAT | This work | qPCR oligonucleotide | |
| Sequence-based reagent | lsm12b reverse: GATTGCATAGGCTTGGGACAAC | This work | qPCR oligonucleotide | |
| Antibody | Anti-Reissner fiber, rabbit, polyclonal | Didier et al., 1995 | Courtesy of S. Gobron | Dilution 1:200 |
| Antibody | Anti-GFP, chicken, polyclonal | Abcam, Cat# ab13970 | RRID:AB_300798 | Dilution 1:500 |
| Antibody | Anti-Pkd2l1, rabbit, polyclonal | Sternberg et al., 2018 | Dilution 1:200 | |
| Antibody | Anti-norepinephrine, rabbit, polyclonal | Millipore, Cat# AB120 | RRID:AB_90481 | Dilution 1:100 |
| Antibody | Anti-Adrb2, rabbit, polyclonal | ThermoFischer Scientific, Cat# PA5-80323 | RRID:AB_2787652 | Dilution 1:200 |
| Antibody | Alexa Fluor-488 goat anti chicken IgG (H+L) | Molecular Probes, Cat# A-11039 | RRID:AB_142924 | Dilution 1:500 |
| Antibody | Alexa Fluor-568 goat anti-rabbit IgG (H+L) | Molecular Probes, Cat# A-11036 | RRID:AB_10563566 | Dilution 1:500 |
| Antibody | Alexa Fluor-488 donkey anti rabbit IgG (H+L) | Molecular Probes, Cat# A-21206 | RRID:AB_2535792 | Dilution 1:500 |
| Chemical compound, drug | DL-Norepinephrine hydrochloride | Sigma | Cat# A7256 | Dilution to 3 mM |
| Chemical compound, drug | +- Epinephrine hydrochloride | Sigma | Cat# E4642 | Dilution to 3 mM |
| Chemical compound, drug | MS 222 | Sigma | Cat# E10521 | Dilution to 0.2% w/v |
| Chemical compound, drug | alpha-bungarotoxin | Tocris | Cat# 2133 | Dilution to 500 µM |
| Software, algorithm | MATLAB | MathWorks | RRID:SCR_001622 | |
| Software, algorithm | Prism | GraphPad | RRID:SCR_002798 | |
| Software, algorithm | Fiji | Schindelin et al., 2012 | RRID:SCR_002285 | |
| Software, algorithm | Imaris | Oxford Instruments | RRID:SCR_007370 |
Additional files
Download links
A two-part list of links to download the article, or parts of the article, in various formats.
Downloads (link to download the article as PDF)
Open citations (links to open the citations from this article in various online reference manager services)
Cite this article (links to download the citations from this article in formats compatible with various reference manager tools)
Adrenergic activation modulates the signal from the Reissner fiber to cerebrospinal fluid-contacting neurons during development
eLife 9:e59469.
https://doi.org/10.7554/eLife.59469


