Robustness of the microtubule network self-organization in epithelia
- Center for Computational Biology, Flatiron Institute, United States
- Department of Biomedical Science, The University of Sheffield, United Kingdom
- Maxwell Institute for Mathematical Sciences, School of Mathematics, Edinburgh University, United Kingdom
Figures
Figure 1
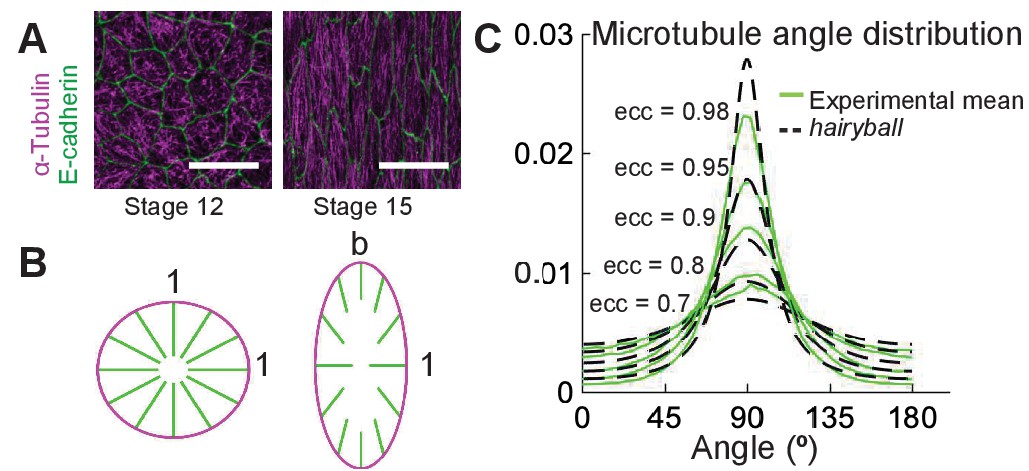
A conceptual geometric model of microtubule self-organization.
(A) Drosophila epidermal cells elongate between stages 12 and 15 of embryonic development, during which the microtubules become more aligned. The scale bar is 10 µm. (B) Stretching a circular cell of radius 1 by a factor deforms the initially uniform microtubule angle distribution into the hairyball distribution, Equation 1. (C) The experimental microtubule angle distribution (green) from stage 12–15 Drosophila epidermal cells and the hairyball (dashed black) are in good agreement up to eccentricity 0.95 . For each eccentricity, the displayed experimental distribution is the mean distribution averaged across cells with the set eccentricity (±0.025 for and ±0.005 for ), and is produced as described in the Materials and methods. The number of cells per eccentricity ranged from 348 to 2748.
Figure 2
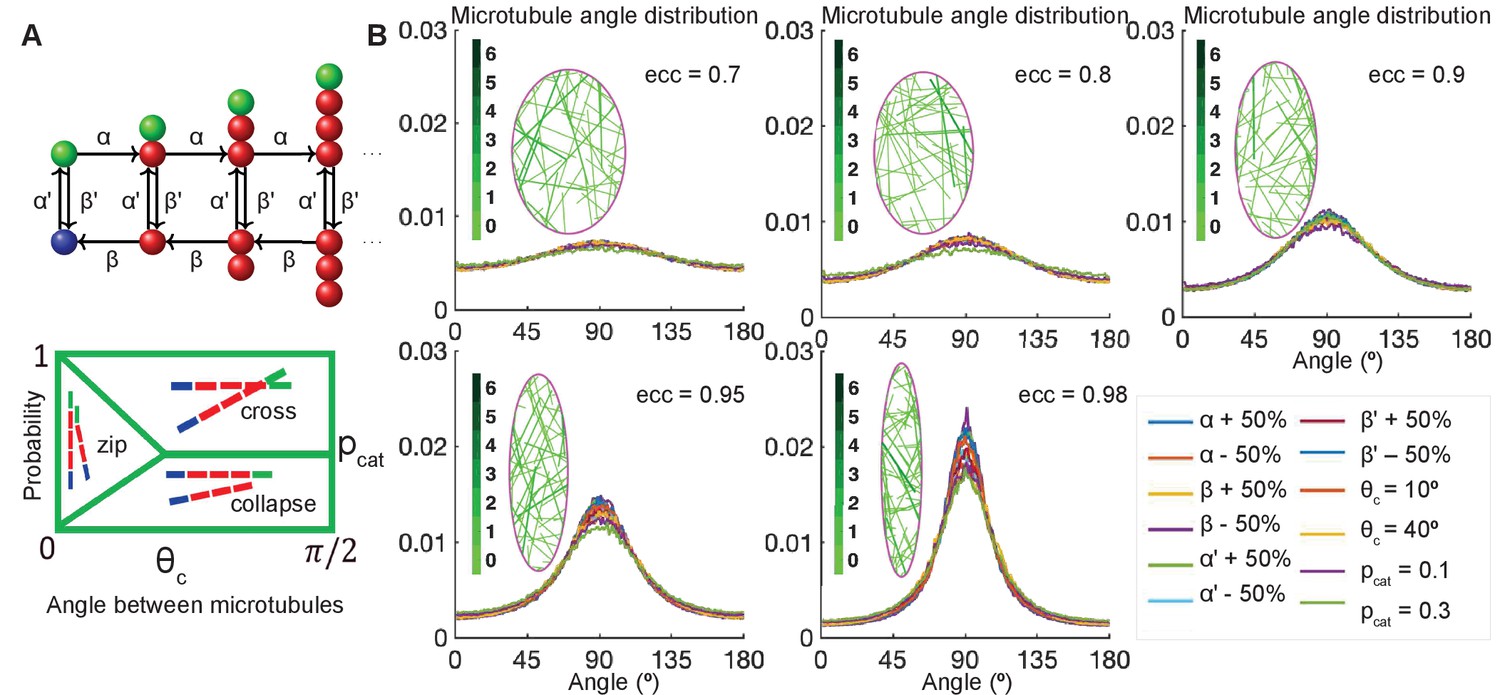
Stochastic simulations demonstrate robustness of microtubule self-organization.
(A, top) Markov chain: each microtubule grows from the minus-end (blue) at the rescue rate , polymerizes at the rate if it is stable with a T. GTP cap (green), undergoes catastrophe losing the T.GTP cap at the rate , depolymerizes at the rate β, and regains the T.GTP cap with the rescue rate . (A, bottom) Parameterization of the effect of crosslinking proteins on microtubule-microtubule interactions, where the probability of an interaction scenario depends on the angle between microtubules. Here is the critical angle of zipping, and is the probability of catastrophe. (B) Sensitivity analysis of the microtubule angle distribution. Left: Snapshots of zipping simulations in cells (magenta) of different eccentricities; for the base-level parameters , and . Interacting microtubules form bundles, the colorbar indicates the number of microtubules in a bundle. Right: The microtubule angle distributions do not vary significantly in a wide parameter range, suggesting robustness of the microtubule self-organization. The distributions are shown for the variations of as compared to , variable critical zipping angle and probability of catastrophe .
Figure 3
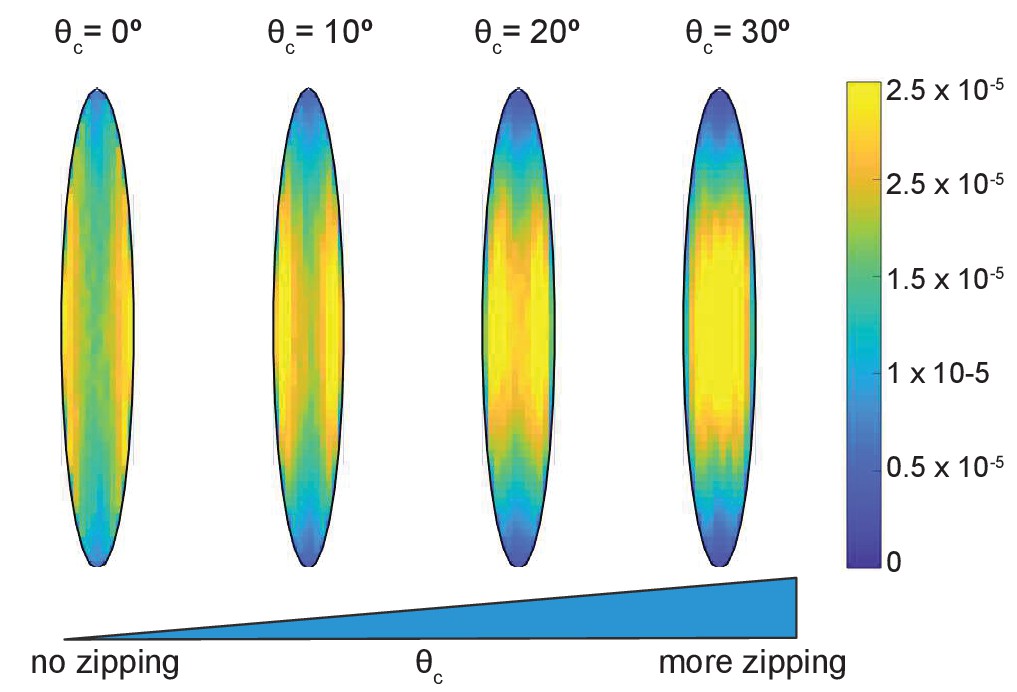
Time-averaged microtubule density depends on the strength of zipping.
The cell eccentricity was ; the other parameters were kept at their base-level values.
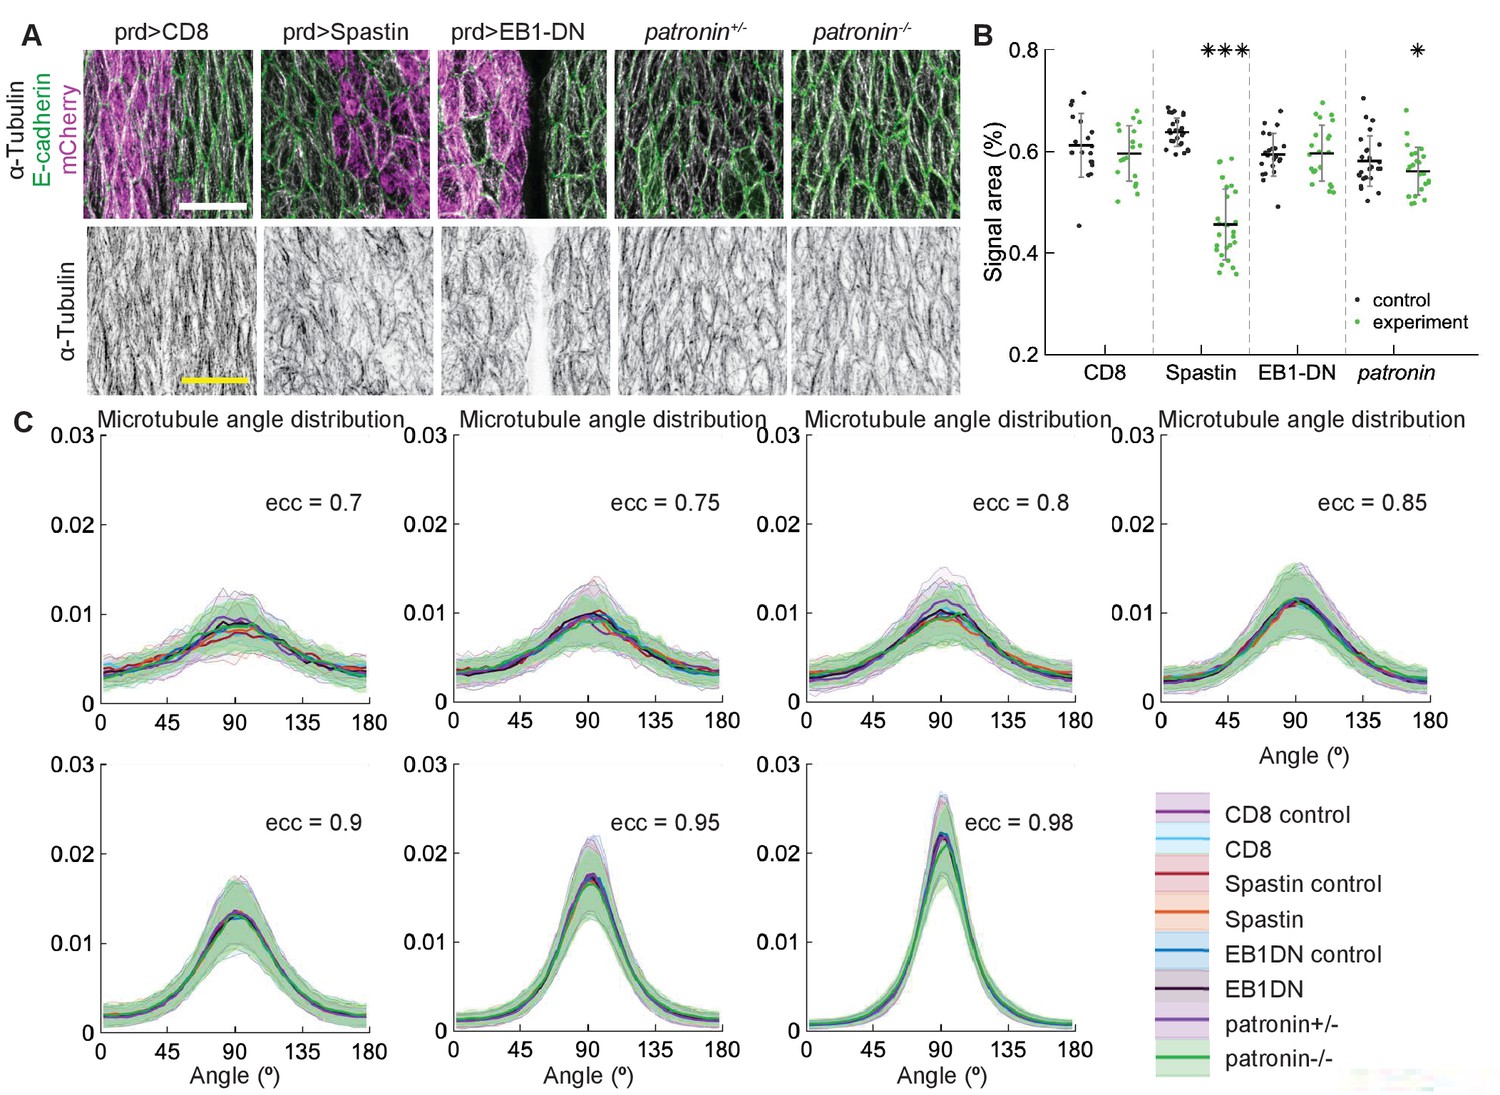
Figure 4
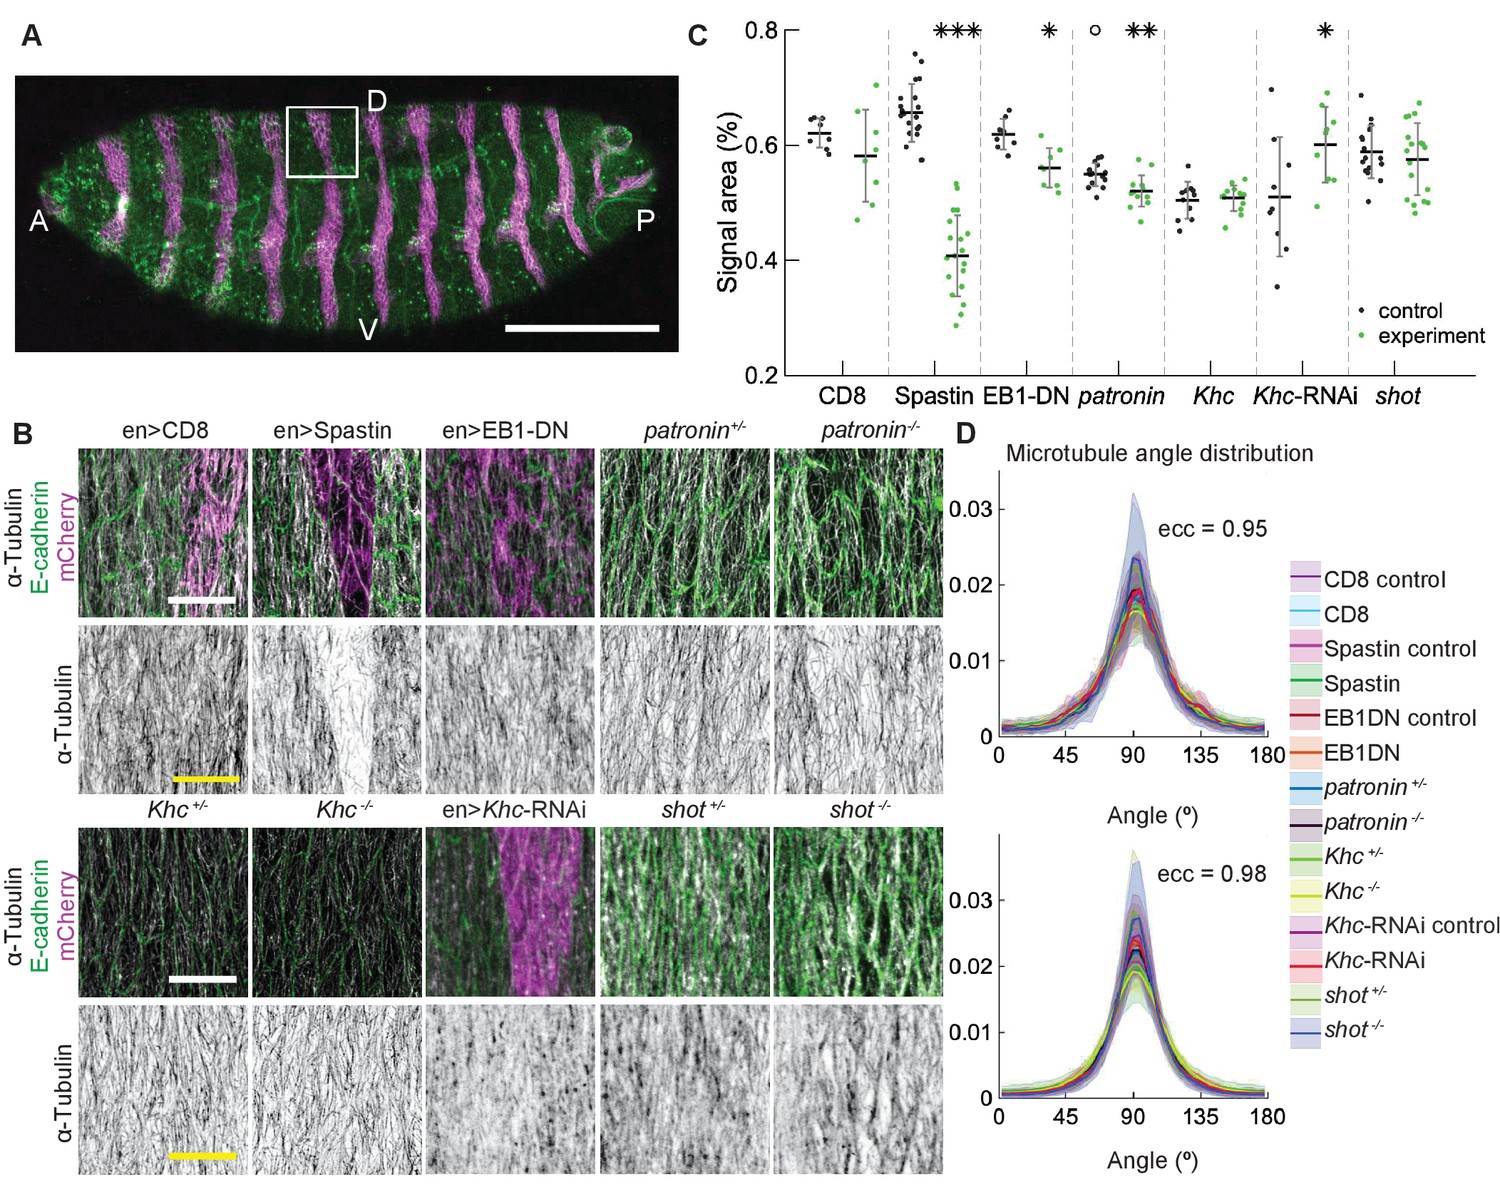
Changes to microtubule dynamics and stability do not affect their alignment in the Drosophila embryonic epidermis in vivo.
(A) An overview image of a Drosophila embryo at stage 15 of embryonic development with cell outlines visualized with E-cadherin (green), and engrailed-expressing stripes are visualized by direct fluorescence of mCherry (magenta). The white square demonstrates the area used for analysis on microtubule organization as shown in (B). Anterior (A), posterior (P), dorsal (D), and ventral (V) sides of embryos are labeled. Scale bar - 100 µm. (B) Apical view of epidermis from control embryos and with altered microtubules. Top, left-to-right: embryos with CD8-Cherry (control), Spastin (Spas), and EB1-DN expressed using engrailed::Gal4, heterozygous Patronin +/-, and homozygous Patronin -/- embryos. Bottom, left-to-right: heterozygous Khc +/- and homozygous Khc -/- embryos, embryos expressing Khc-RNAi, and heterozygous shot +/- and homozygous shot -/- embryos. Cells expressing CD8-Cherry and EB1-DN are visualized by direct fluorescence of mCherry fused to respective proteins, whereas cells expressing Spastin and Khc-RNAi are visualized by coexpression of CD8-Cherry (magenta). Cell outlines were visualized by immunostaining against E-cadherin or native fluorescence of E-cadherin-GFP for Khc-RNAi (green, top row), and microtubules by immunostaining against α-Tubulin (white, top row; black, bottom row). Scale bar - 10 µm. (C) Quantification of microtubule density in each genotype. Internal controls (cells not expressing engrailed::Gal4) were used for CD8-Cherry, Spastin, EB1-DN, and Khc-RNAi. For Patronin, Khc and shot, heterozygous and homozygous embryos were compared. *** - , ** - , * - in comparison to respective control; ° - in comparison to CD8-Cherry control. (D) The microtubule angle distributions for each eccentricity (±0.025 for and ±0.005 for ) do not differ between all genotypes and relative to controls. The distributions – mean (solid line) with standard deviation (shading) – are produced by binning cells in each genotype by eccentricity with the number of binned cells from 32 to 833.
Figure 5
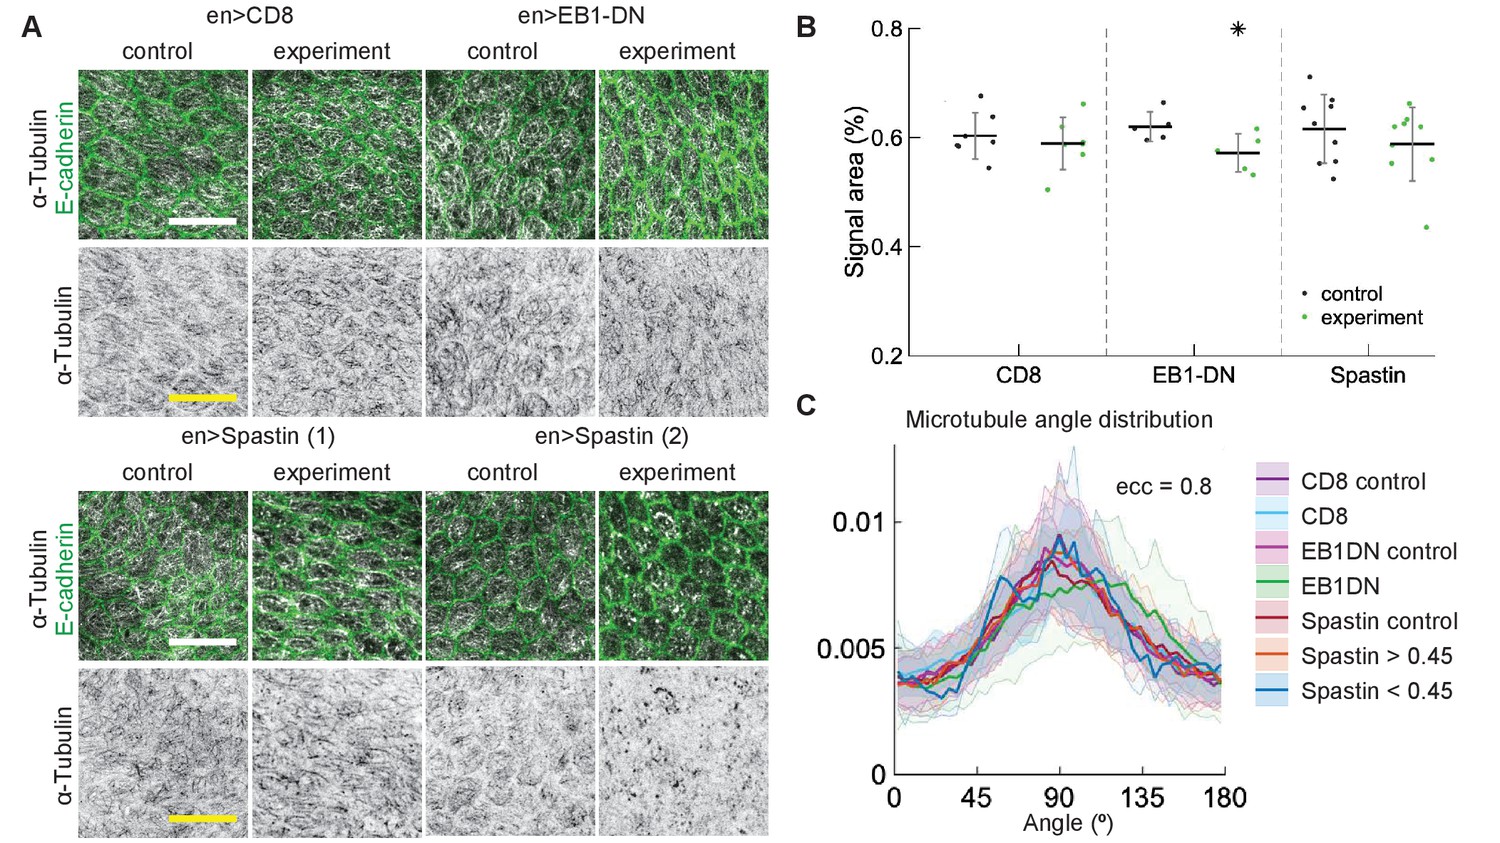
Changes to microtubule dynamics and stability do not affect their alignment in Drosophila pupal wings in vivo.
(A) Apical view of epithelial cells from pupal wings in control anterior and experimental posterior compartments. Top: pupal wings expressing CD8-Cherry (control) and EB1-DN; bottom: examples of wings expressing Spastin, which leads to a variable phenotype ranging from severed (left) to appearing non-severed (right) microtubules. In all cases, engrailed::Gal4 was used. Cells expressing CD8-Cherry and EB1-DN are visualized by direct fluorescence of mCherry directly fused to respective proteins, whereas cells expressing Spastin are visualized by coexpression of CD8-Cherry (not shown). Cell outlines were visualized by native fluorescence of E-cad-GFP (green, top rows), and microtubules by immunostaining against α-Tubulin (white, top rows; black, bottom rows). Scale bar - 10 µm. (B) Quantification of microtubule density in each genotype. Internal controls (cells not expressing engrailed::Gal4) were used for comparison. * - . (C) The microtubule angle distributions for do not differ between all genotypes and relative to controls. The distributions – mean (solid line) with standard deviation (shading) – are produced by binning cells in each genotype by eccentricity. Distributions in cells with α-Tubulin signal areas less and greater than 0.45 are shown separately for Spastin. The number of binned cells ranged from 7 to 48.
Figure 6
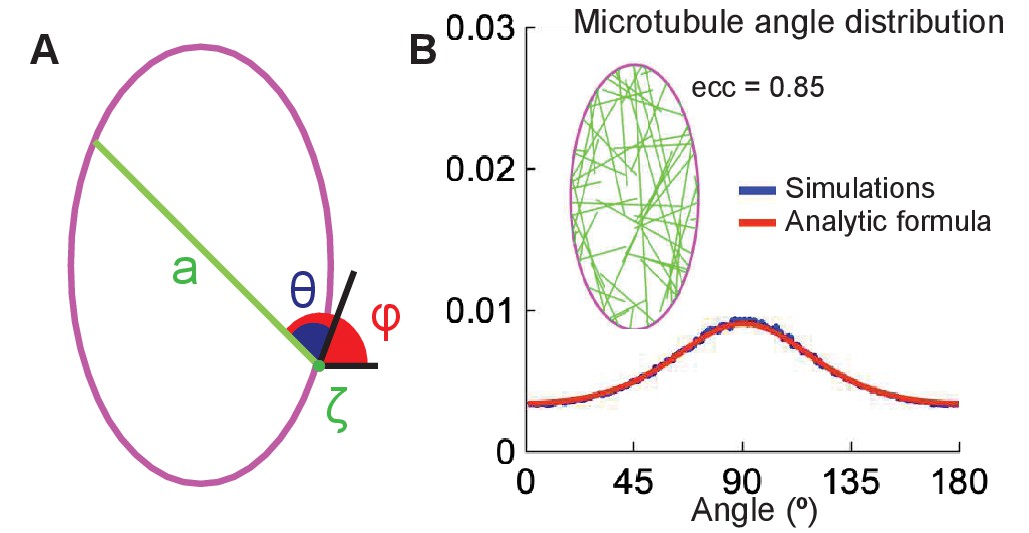
The analytical model of microtubule self-organization.
(A) Analytical model setup: cell shape is parameterized by the arclength, , along the cell boundary (magenta). At the minus-end, , a straight microtubule (green) grows at an angle (or ) with respect to the cell boundary (or horizontal); its maximum length is the cross-section, , of the cell. (B) Left: snapshot of the simulations with non-interacting microtubules for cells of eccentricity 0.85. Right: the agreement between the microtubule angle distributions given by Equation 9 (red) and the stochastic simulations (blue).
Figure 7
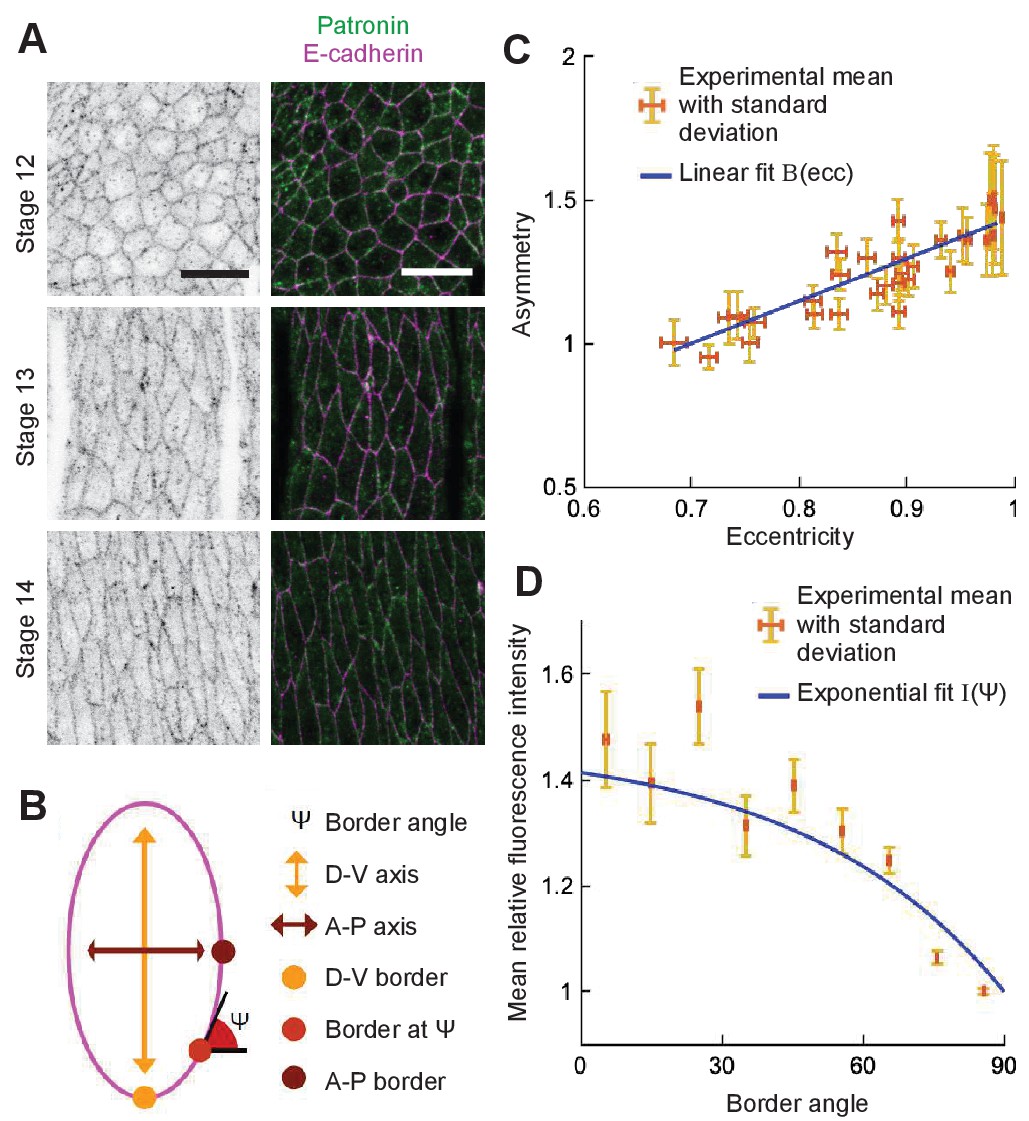
Localization of Patronin-YFP in the Drosophila embryonic epidermis.
(A) Apical view of embryonic epidermis at stage 12 (top), 13 (middle), and 15 (bottom), visualized with Patronin-YFP (gray, left; green, right), and E-cadherin immuno-staining (magenta, right). Scale bar - 10 μm. (B) Schematic of a cell. (C) Asymmetry of Patronin-YFP localization increases linearly with eccentricity. Each dot represents the average values of Patronin-YFP asymmetry and cell eccentricity in a single embryo. Error bars are SD. Solid line visualizes the linear fit of the form , . (D) Mean relative amounts of Patronin-YFP as a function of the border angle in stage 15 (eccentricity 0.98) Drosophila embryonic epidermis, normalized by its value at the vertical long sides (0-10°). Borders were binned at 10° intervals relative to the embryonic anterior-posterior axis, and intensity was averaged for each bin (mean ± SD). The solid line represents the exponential fit for the intensity as , .
Figure 8

Agreement between the analytical and experimental microtubule self-organization on averaged cell-shape.
(A) Experimental cell shapes for eccentricities 0.7—0.98. The experimental cell boundary data points (light green points), its standard deviation (darker green envelope) around the radial mean (dark green line). The ellipse (dashed magenta) closely approximates the experimental mean shape. The graphs show the corresponding microtubule angle distributions. (B) The analytical distribution with asymmetric minus-ends (red) has better agreement with the experimental mean (dark green line) (± SD is the light-green envelope), comparing to the uniform minus-end density (blue); the hairyball has good agreement up to eccentricity 0.95 with the experimental mean.
Appendix 1—figure 1
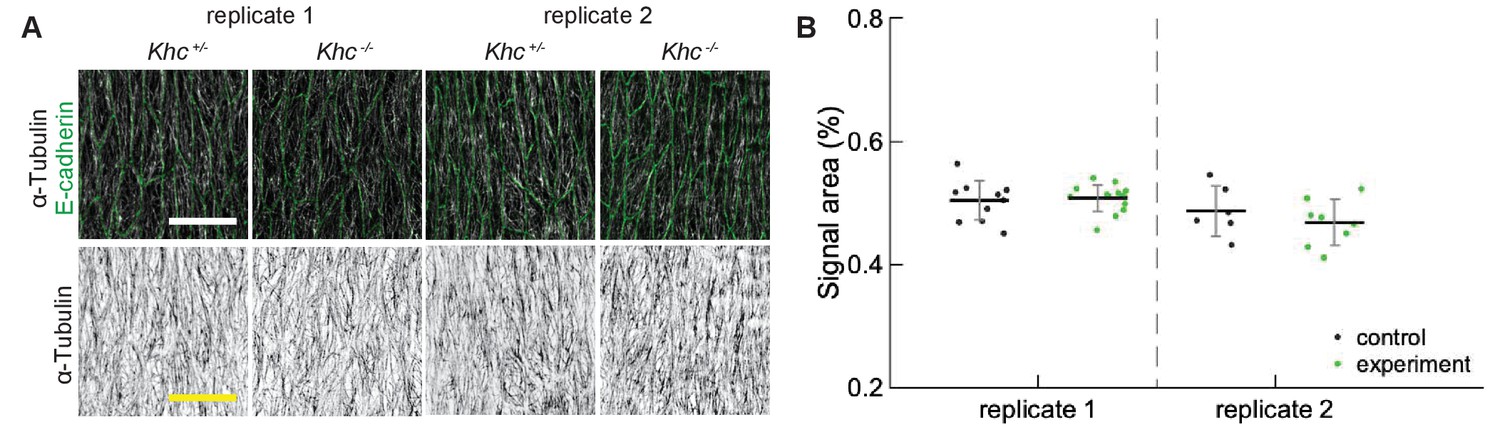
Reproducibility of α-Tubulin signal area.
(A) Apical view of epidermis from heterozygous Khc -/+ and homozygous Khc -/- embryos from two independently repeated experiments (replicates 1 and 2). Cell outlines were visualized by immunostaining against E-cadherin (green, top row), and microtubules by immunostaining against α-Tubulin (white, top row; black, bottom row). Scale bar - 10 µm. (B) Quantification of microtubule density in each genotype.
Appendix 1—figure 2
Changes to microtubule dynamics and stability do not affect their alignment.
(A) Apical view of epidermis from control embryos and with altered microtubules. Left-to-right: embryos with CD8-Cherry (control), Spastin (Spas), and EB1-DN expressed using paired::Gal4, heterozygous Patronin -/+, and homozygous Patronin -/- embryos. Cells expressing CD8-Cherry and EB1-DN are visualized by direct fluorescence of mCherry directly fused to respective proteins, whereas cells expressing Spastin are visualized by coexpression of CD8-Cherry (magenta, top row). Cell outlines were visualized by immunostaining against E-cadherin (green, top row), and microtubules by immunostaining against α-Tubulin (white, top row; black, bottom row). Embryos were imaged across all developmental stages between stages 12 and 15. Scale bar - 10 µm. The area with no microtubules in the example of EB1-DN expression corresponds to a segmental groove, where the cells are out of imaging focus. (B) Quantification of microtubule density in each genotype. Internal controls (cells not expressing paired::Gal4) were used for CD8-Cherry, Spastin, and EB1-DN overexpression. For Patronin, heterozygous and homozygous embryos were compared. *** - , * - in comparison to respective control. (C) The microtubule angle distributions for each eccentricity (±0.025) do not significantly differ between all genotypes and relative to controls. The distributions are shown as mean (solid line) with standard deviation (shading). For each eccentricity, the displayed experimental distribution is the mean distribution averaged across cells with the set eccentricity (±0.0025 for and ±0.005 for ). The number of cells per eccentricity per genotype ranged from 24 to 515.
Tables
Key resources table
| Reagent type (species) or resource | Designation | Source or reference | Identifiers | Additional information |
|---|---|---|---|---|
| Genetic reagent (Drosophila melanogaster) | paired::Gal4 | Bloomington Drosophila Stock Center | RRID:BDSC_1947 | |
| Genetic reagent (Drosophila melanogaster) | engrailed::Gal4 | Bloomington Drosophila Stock Center | RRID:BDSC_30564 | |
| Genetic reagent (Drosophila melanogaster) | UAS::CD8-Cherry | Bloomington Drosophila Stock Center | RRID:BDSC_27392 | |
| Genetic reagent (Drosophila melanogaster) | UAS::Khc-RNAi | Bloomington Drosophila Stock Center | RRID:BDSC_35770 | |
| Genetic reagent (Drosophila melanogaster) | Khc8 | Bloomington Drosophila Stock Center | RRID:BDSC_1607 | |
| Genetic reagent (Drosophila melanogaster) | shot3 | Bloomington Drosophila Stock Center | RRID:BDSC_5141 | Dr Katja Röper |
| Genetic reagent (Drosophila melanogaster) | patronin05252 | PMID:2740359 | Prof Daniel St Johnston | |
| Genetic reagent (Drosophila melanogaster) | Patronin-YFP | PMID:2740359 | Prof Daniel St Johnston | |
| Genetic reagent (Drosophila melanogaster) | UAS::EB1-GFP | PMID:23751496 | ||
| Genetic reagent (Drosophila melanogaster) | Ubi-p63E::E-cad-GFP | Kyoto Stock Center (DGGR) | RRID:DGGR_109007 | |
| Antibody | Monoclonal mouse anti-α-Tubulin | Sigma-Aldrich | Cat# sc-32293, RRID:AB_628412 | 1:1000 |
| Antibody | Monoclonal rat anti-E-cadherin | Developmental Studies Hybridoma Bank | Cat# DCAD2, RRID:AB_528120 | 1:200 |
| Antibody | Alexa Fluor 488 AffiniPure Donkey Anti-Rat IgG (H+L) | Jackson ImmunoResearch | Cat# 712-545-153 | 1:300 |
| Antibody | Alexa Fluor 594 AffiniPure Donkey Anti-Mouse IgG (H+L) | Jackson ImmunoResearch | Cat# 715-585-151 | 1:300 |
| Antibody | Alexa Fluor 647 AffiniPure Donkey Anti-Mouse IgG (H+L) | Jackson ImmunoResearch | Cat# 715-605-151 | 1:300 |
| Software, algorithm | Tissue Analyser | PMID:20813263 | ||
| Software, algorithm | Microtubule organisation analysis | PMID:27779189 |
Additional files
Download links
A two-part list of links to download the article, or parts of the article, in various formats.
Downloads (link to download the article as PDF)
Open citations (links to open the citations from this article in various online reference manager services)
Cite this article (links to download the citations from this article in formats compatible with various reference manager tools)
Robustness of the microtubule network self-organization in epithelia
eLife 10:e59529.
https://doi.org/10.7554/eLife.59529


