Patient-specific genomics and cross-species functional analysis implicate LRP2 in hypoplastic left heart syndrome
- Cardiovascular Genetics Research Laboratory, United States
- Development, Aging and Regeneration, Sanford Burnham Prebys Medical Discovery Institute, United States
- Division of Biomedical Statistics and Informatics, Mayo Clinic, United States
- Department of Cardiovascular Medicine, Mayo Clinic, United States
- Department of Molecular and Pharmacology and Experimental Therapeutics, Mayo Clinic, United States
- Center for Regenerative Medicine, Mayo Clinic, United States
- Division of Pediatric Cardiology, Department of Pediatric and Adolescent Medicine, Mayo Clinic, United States
- University of California San Diego, Rady’s Hospital, United States
- Division of General Internal Medicine, Mayo Clinic, United States
Figures
Figure 1 with 2 supplements
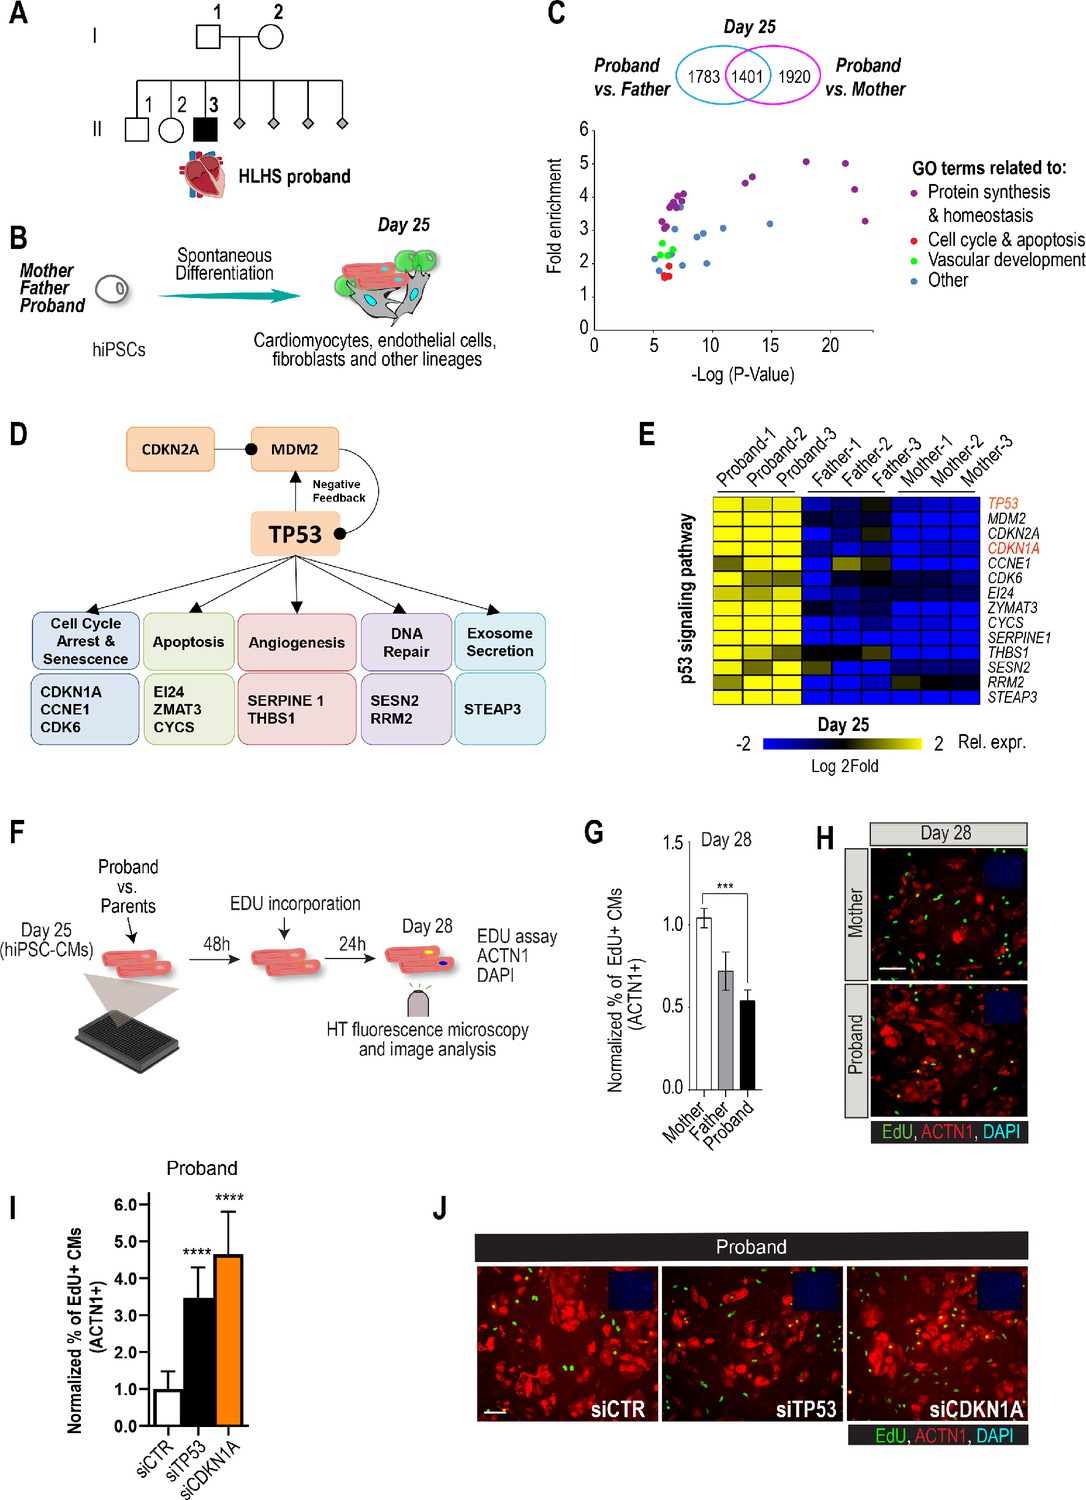
Family-based iPSC characterization for HLHS.
(A) Pedigree of family 5H: proband with HLHS (black symbol), relatives without CHD (white symbols), miscarriages (gray diamonds). (B) Schematic for family-based iPSC production and characterization. (C) Whole-genome RNA sequencing identified 1401 concordantly DETs between proband and parents. (D) KEGG pathway analysis shows enrichment of DETs in TP53 pathway. (E) Heatmap of p53 signaling pathway-associated genes in probands vs parents. (F) Schematic describing EdU-incorporation assay in hiPSC-CMs. 5000 cells/well were plated in 384 well plates. After 48 hr EdU was added to the media and left incorporate for 24 hr. Cells were then fixed and stained (G) Graph representing quantification of EdU+ cardiomyocytes in HLHS 5H family-derived iPSC-CMs. ***p<0.001 one-way ANOVA. (H) Representative images of iPSC-CMs derived from mother (Top) and proband (Bottom), stained for EdU, ACTN1 and DAPI. Scale bar: 50 µm. (I) Quantification of EdU-incorporation assay in 5H proband iPSC-CM upon KD of TP53 or CDKN1A. ****p<0.0001, one-way ANOVA. (J) Representative images of 5H proband iPSC-CM stained for EdU and ACTN1 upon KD of TP53 or CDKN1A at day 28. Scale bar: 50 µm.
Figure 1—figure supplement 1

Cell cycle activity is altered in HLHS patient-derived iPSCs and CMs.
(A) Heatmap of negative regulation of cell proliferation-associated genes from RNA-seq experiments in proband vs parents. (B) Heatmap of cell cycle arrest-associated genes. (C) Heatmap of positive regulation of apoptosis-associated genes.
Figure 1—figure supplement 2

Cell cycle activity is altered in HLHS patient-derived iPSCs and CMs.
(A) Quantification of percentage of EdU+ cells in 75H and 151H iPSCs. Proband iPSCs show reduced EdU incorporation compared to the parents. **p<0.01, ****p<0.0001 in 75H family. ##p<0.01 in the151H family. One-way ANOVA. (B) Representative images of 75H family iPSCs labeled for EdU and DAPI. Of note, the yield of patient-derived iPSC was relatively low. Scale bar: 50 µm.
Figure 2 with 4 supplements
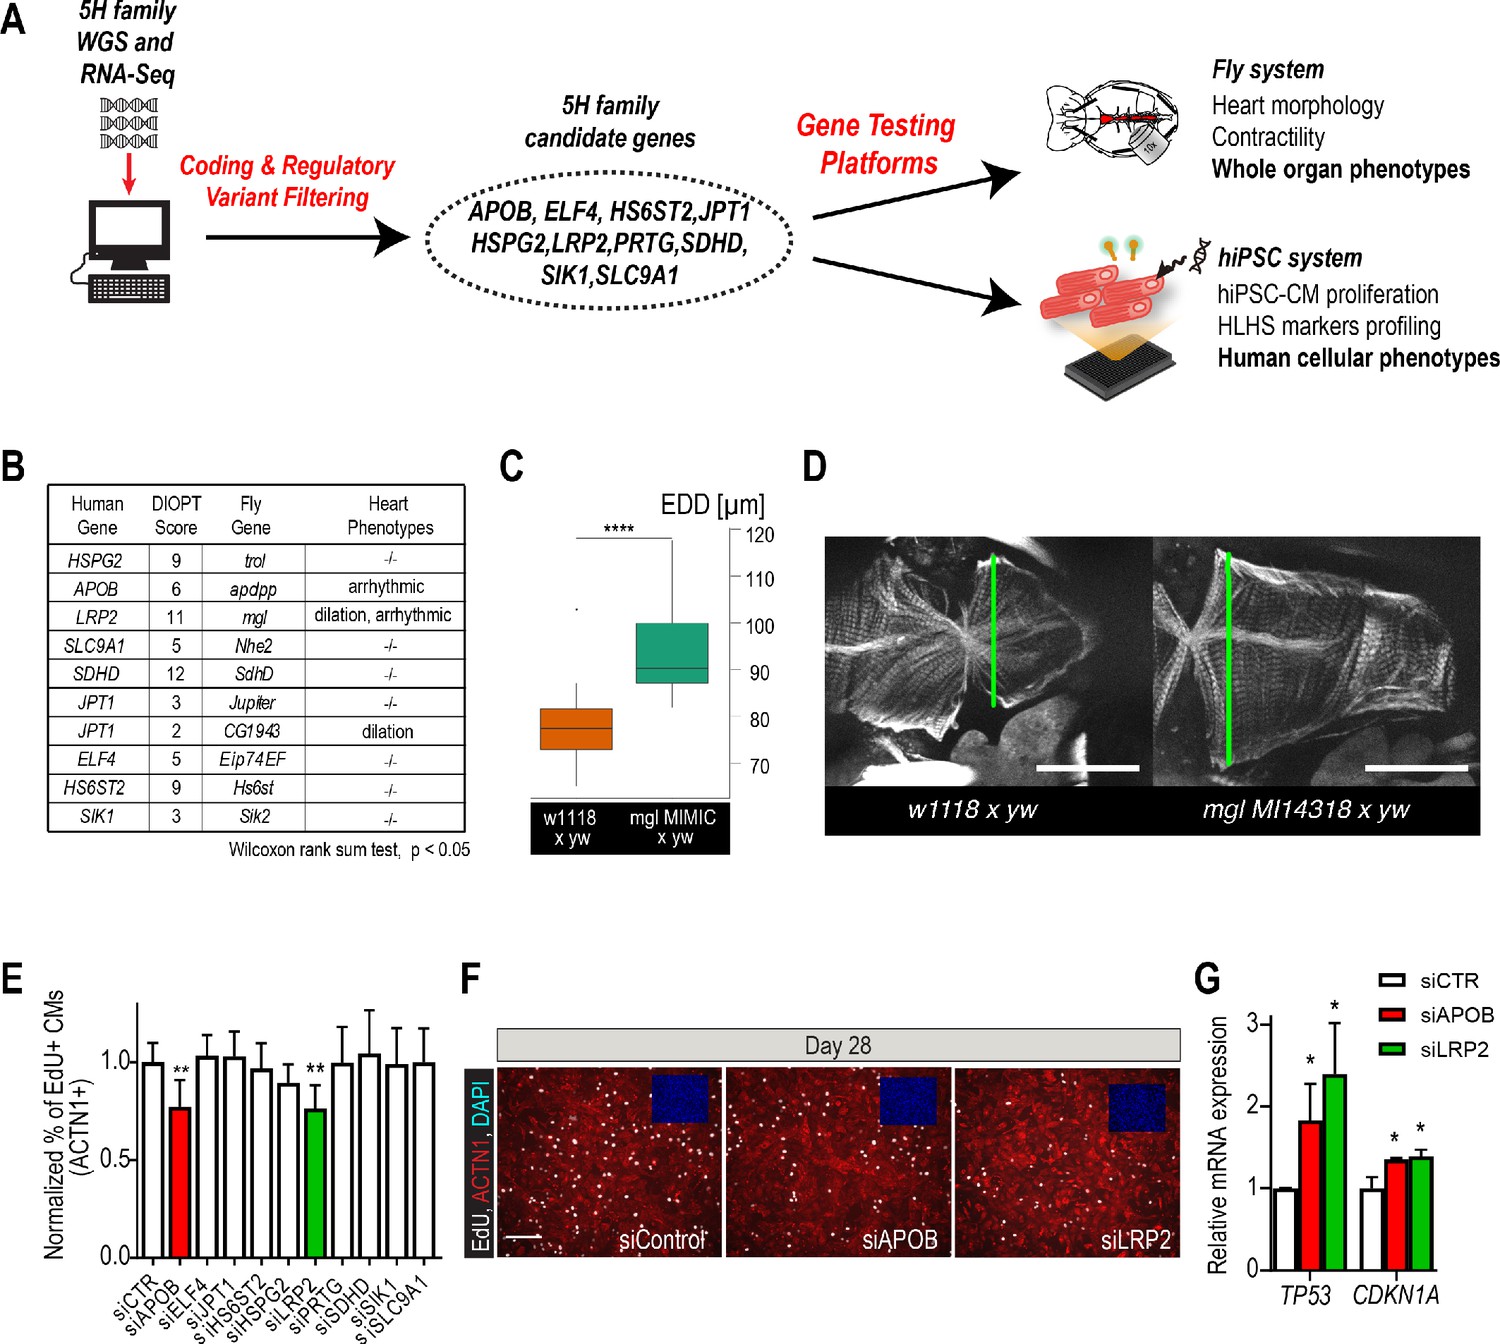
Whole-genome and RNA sequencing identify HLHS candidate genes.
(A) An iterative, family-based variant filtering approach based on rarity, functional impact, and mode of inheritance and RNA sequencing data were used to filter for transcriptional differences yielding 10 candidate genes. Candidate genes were further tested in hiPSC-CM and in vivo model. (B) Human candidate genes and corresponding Drosophila ortholog as determined by DIOPT score (*confidence score: number of databases reporting orthology). Listed are heart phenotypes upon gene candidate KD. (C,D) Example of fly hearts heterozygous for LRP2/mgl show increased end-diastolic diameters (EDD, measured at green line in D). Wilcoxon rank sum test: ***p<0.001. (E) Graph representing EdU-incorporation assay results of candidate gene KD in hiPSC-CM. KD of APOB (red bar) or LRP2 (green bar) reduced EdU incorporation. **p<0.01 one-way ANOVA. (F) Representative images of hiPSC-CMs stained for EdU, ACTN1 and DAPI. Scale bar: 50 µm. (G) qPCR results of TP53 and CDKN1A in hiPSC-CM upon KD of APOB or LRP2. *p<0.05 one-way ANOVA.
Figure 2—figure supplement 1
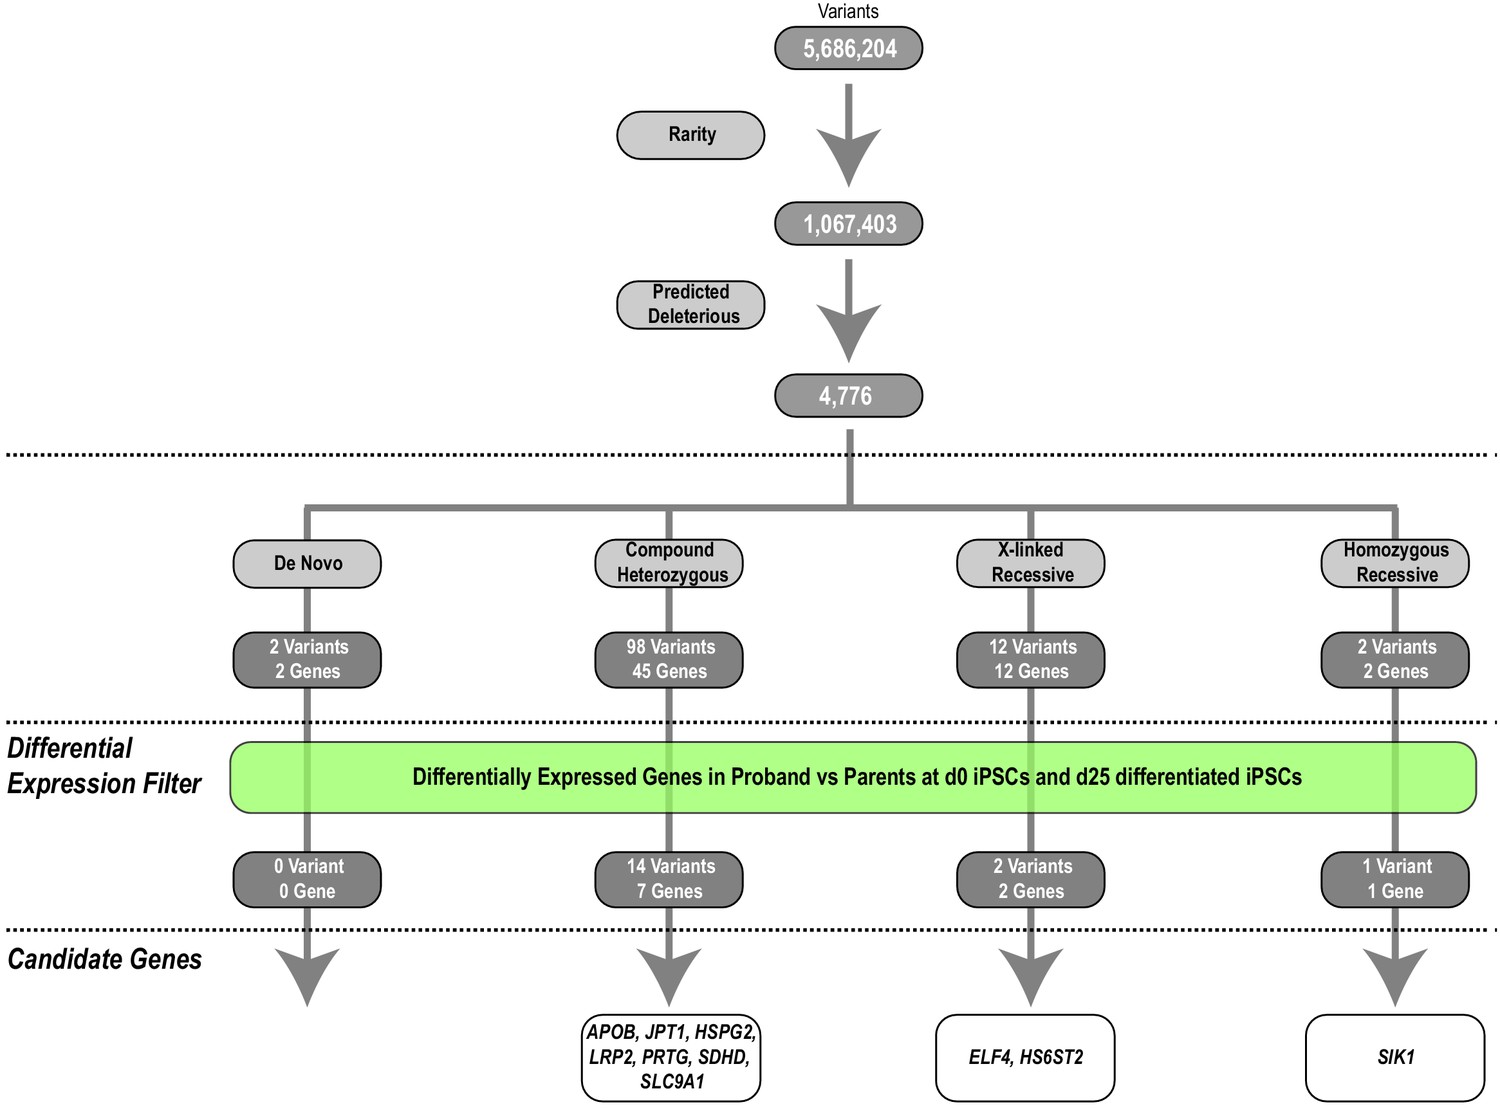
Identification of HLHS candidate genes from whole-genome and RNA sequencing.
An iterative, family-based variant filtering approach based on rarity, functional impact, and mode of inheritance yielded 61 candidate genes. RNA sequencing data from d0 iPSC and d25 differentiated iPSC were used to filter for transcriptional differences yielding ten candidate genes.
Figure 2—figure supplement 2
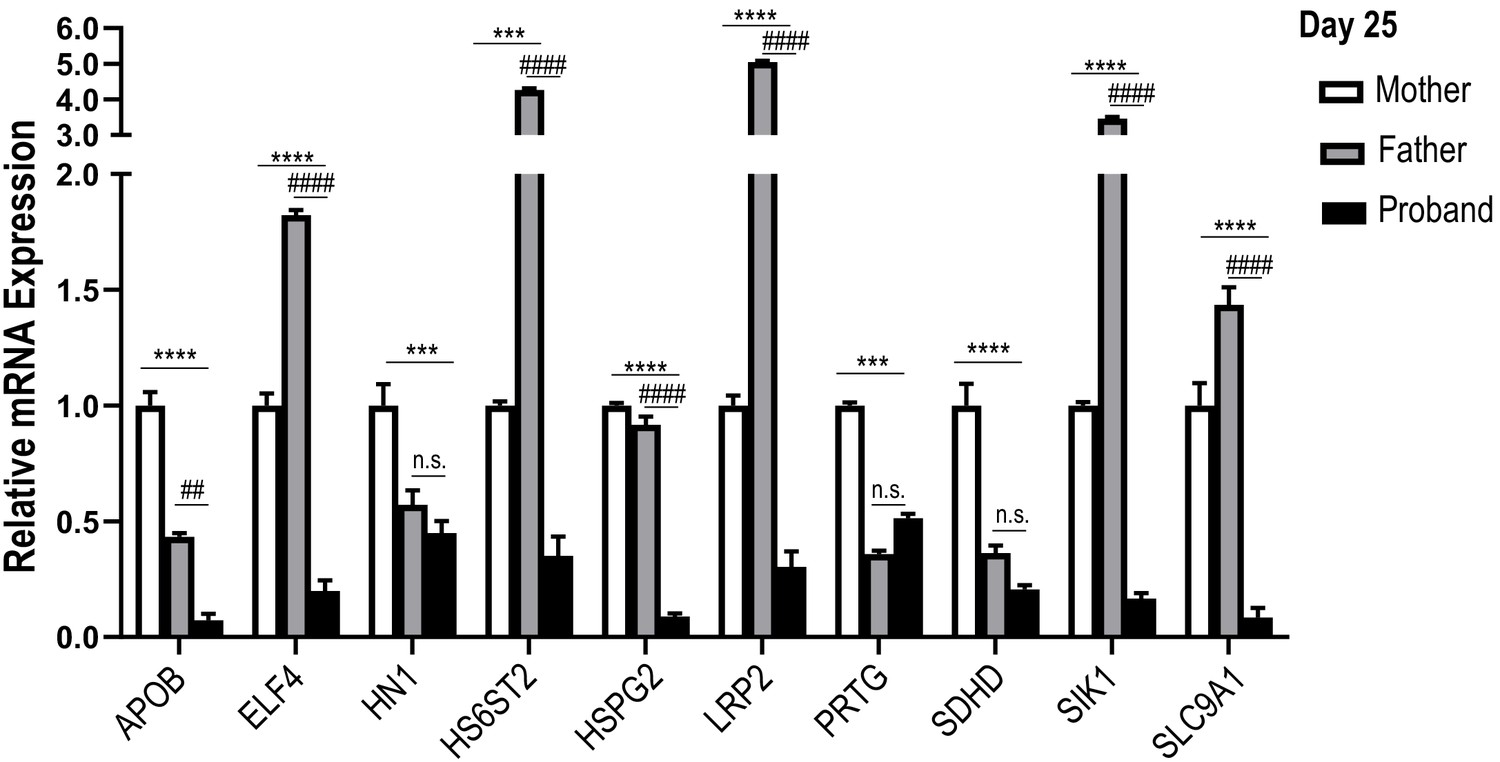
Cell cycle activity is altered in HLHS patient-derived iPSCs and CMs.
qPCR of the 10 candidate genes in the ‘5H-family’ iPSC-CMs at day 25 of differentiation. Proband cells show downregulation of all 10 candidate genes compared to the mother’s cells (*) and 7/10 compared to the father’s cells (#). Data are normalized to the cells derived from the mother. ***p<0.001; ****p<0.0001; ##p<0.01; ####p<0.0001; n.s.: not significant. One-way ANOVA.
Figure 2—figure supplement 3
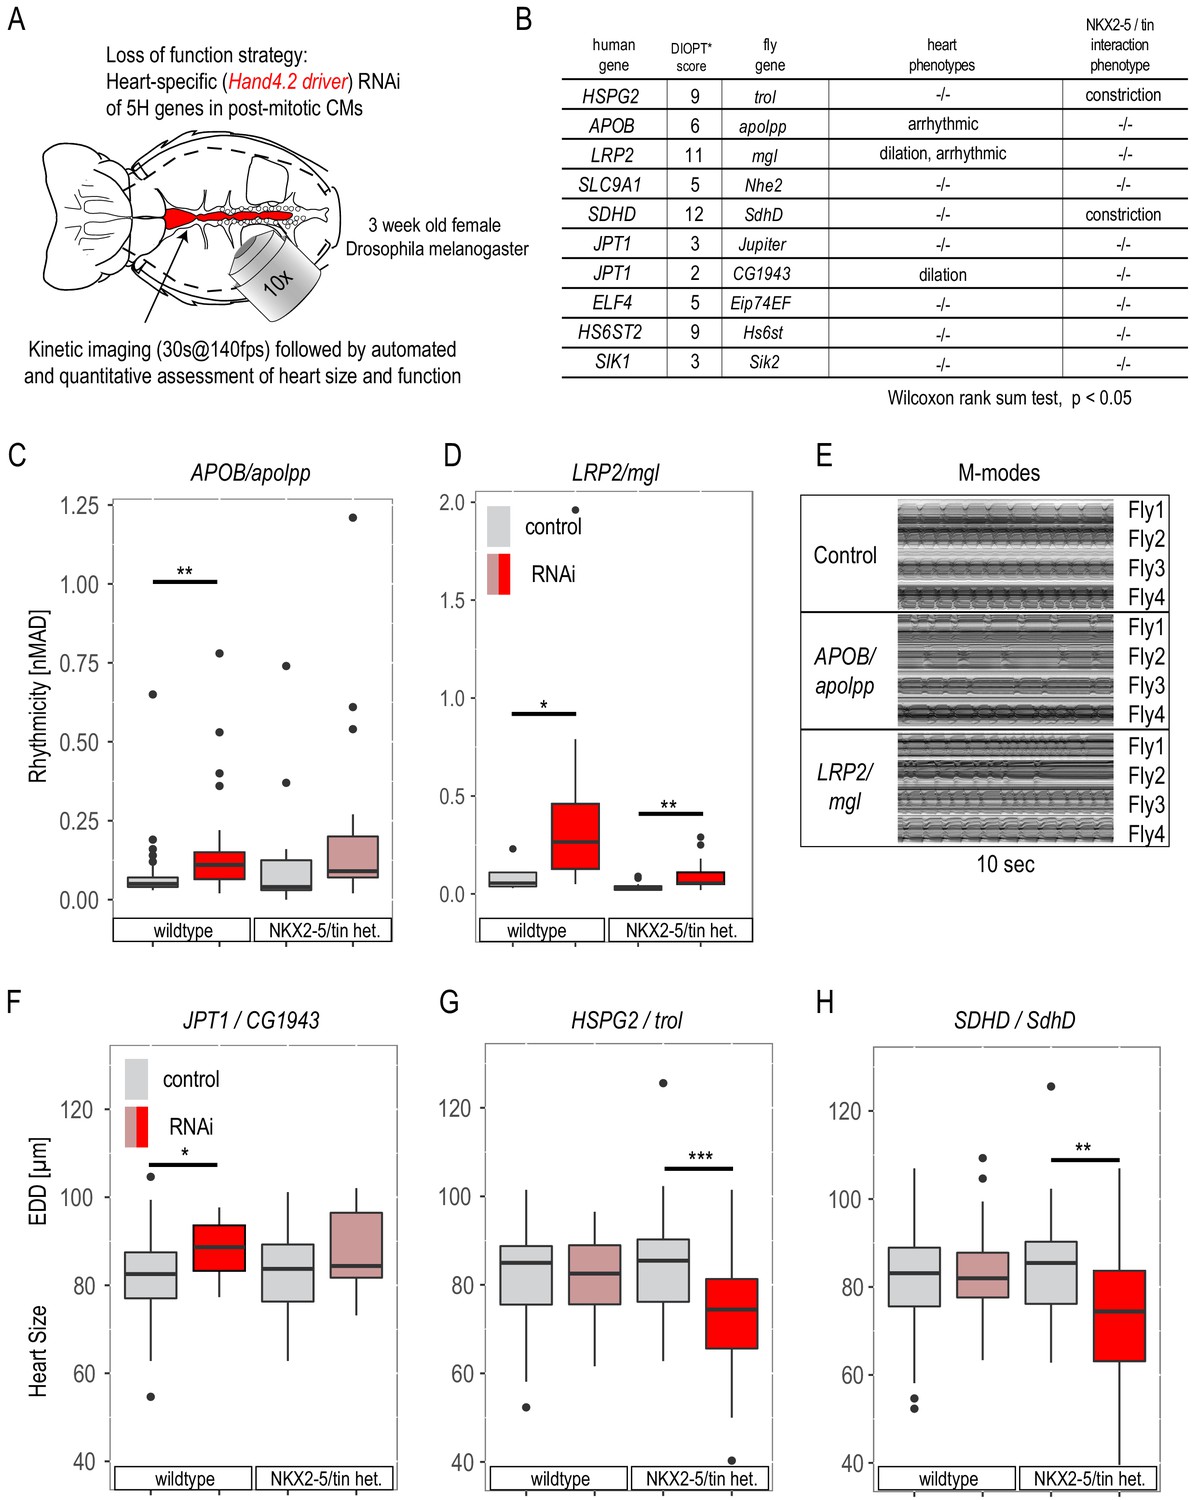
Phenotypic assessment of HLHS candidate genes in Drosophila adult hearts.
(A) Schematic of the Drosophila adult heart assay. (B) Human candidate genes and corresponding Drosophila ortholog as determined by DIOPT score (*confidence score: number of databases reporting orthology). Listed are heart phenotypes upon knockdown (KD) in wild-type or NKX2-5/tin+/-heterozygous background. (C–E) RNAi-induced arrhythmicity and M-modes observed with LRP2/mgl and APOB/apolpp KD. (F–H) Heart size (EDD: end-diastolic diameter) alterations upon RNAi-KD of JPT1, HSPG2 and SDHD (also in NKX2-5/tin heterozygous background). Wilcoxon rank sum test: *p<0.05, **p<0.01, **p<0.001.
Figure 2—figure supplement 4
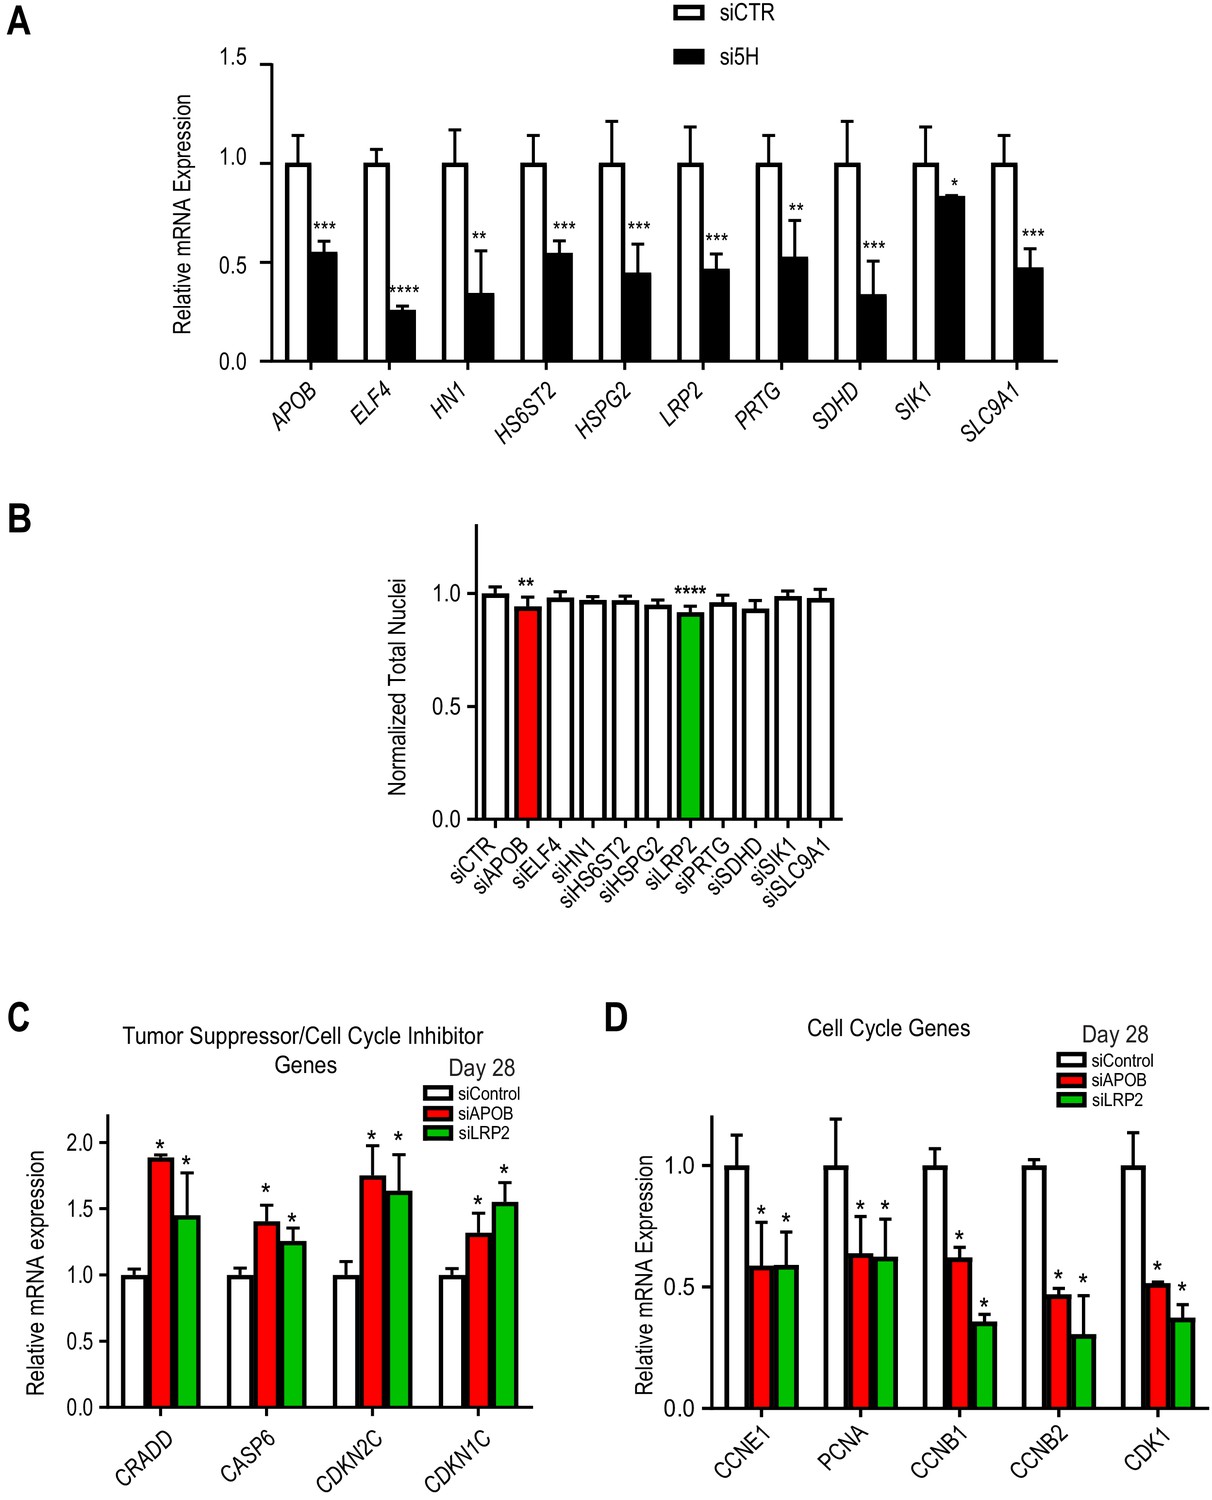
LRP2 and APOB KD reduces total nuclei and affect cell cycle in hiPSC-CMs.
(A) qPCR showing KD efficiency for the 10 candidate genes in day 28 hiPSC-CM. For all the 10 genes tested, siRNAs KD efficiency is about 50%. *p<0.05, **p<0.01, ***p<0.001, ****p<0.0001, Student’s t-test. (B) Quantification of total nuclei in day 28 hiPSC-CMs transfected with siRNAs directed to ten candidate HLHS genes. LRP2 and APOB KD reduce total cells number. (C) qPCR of tumor suppressors/cell cycle inhibitor genes in day 28 hiPSC-CMs upon KD of LRP2 or APOB. Tumor suppressors/cell cycle inhibitors are upregulated upon LRP2/APOB KD compared to control. *p<0.05, Student’s t-test. (D) qPCR of cell cycle genes in day 28 hiPSC-CMs upon KD of APOB or LRP2. Cell cycle genes are downregulated upon LRP2/APOB KD. *p<0.05, Student’s t-test.
Figure 3 with 1 supplement
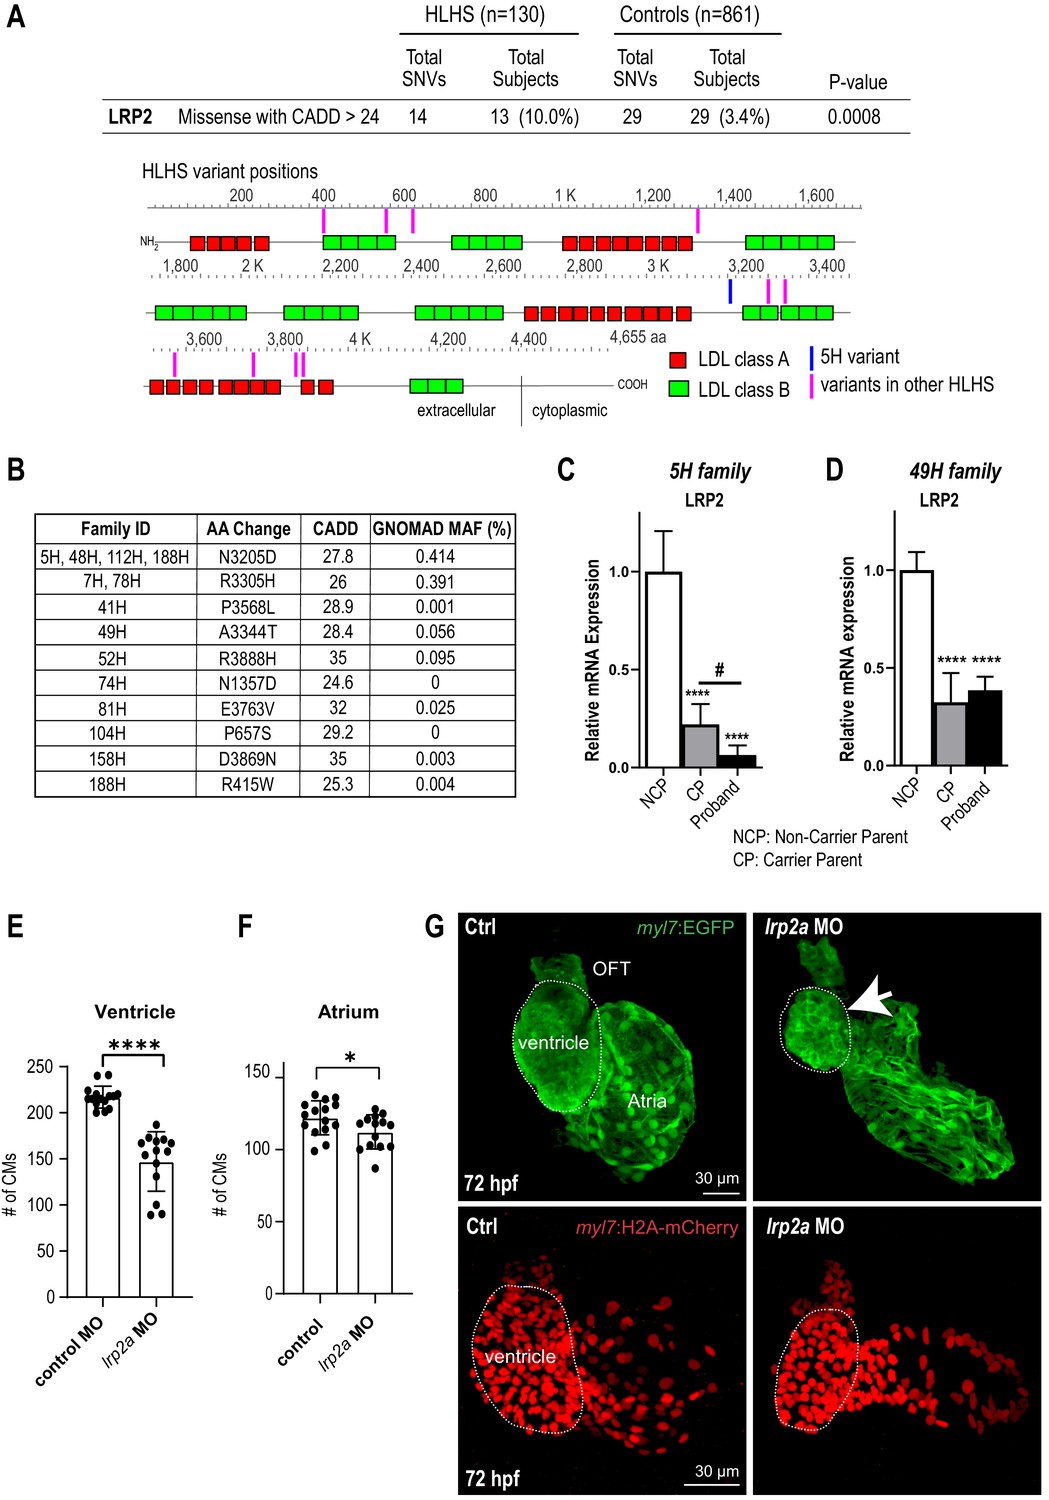
Identification of LRP2 as potential HLHS candidate gene.
(A) Cohort-wide analysis of LRP2 variants shows significant enrichment for SNVs in HLHS patients compared to control populations. Variants (blue/magenta) are found throughout LRP2 protein. (B) Table listing the HLHS families carrying LRP2 variants. (C,D) qPCR of LRP2 in 5H family (C) and in 49H family (D) showing LRP2 downregulation in carrier parent and proband compared to the non-carrier parent. ****p<0.0001 one-way ANOVA #p<0.05 one-way ANOVA. (E) Cardiomyocyte count in zebrafish morphants at 72 hpf were significantly reduced in the ventricle. (F) Atrial cardiomyocyte number was also reduced in morphants but to a lesser extent than in ventricles. *p<0.05; ****p<0.0001 unpaired two-tail Student t-test. (G, top panel) embryonic fish hearts were visualized by EGFP expression in the myl7:EGFP transgenic background (green) at 72 hpf. lrp2a morphant hearts were dysmorphic and much smaller (arrow) compared to controls. (G, lower panel) myl7:H2A-mCherry transgenic background identifies cardiomyocyte nuclei used for quantifying cardiomyocytes during development in E and F. Dotted traces outline the ventricles in G. Scale bars: 30 μm.
Figure 3—figure supplement 1

lrp2a KD and CRISPR causes reduced contractility and bradycardia in zebrafish larva.
(A) Uninjected zebrafish larva, (B) lrp2a morpholinos (MO) (1 pl of 2 ng/µl) injected larva and (C) lrp2a CRISPR genome edited F0 larva all exhibit relatively normal body morphology at 72 hpf, note the pericardial edema evident in morphant and F0 mutant (arrows). Scale bar: 200 µm. (D) End-diastolic surface area and (E) End Systolic surface area in atria and ventricles determined from high-speed movies of beating hearts at 72 hpf. (F) Contractility, measured as fractional area change, was significantly reduced in ventricles from both morphants and mutants. (G) Heart period was significantly lengthened in morphants and mutant larvae. (D–G) Two doses of lrp2a MO were injected (1 pl of 1 ng/µl or 2 ng/µl). For CRISPR/Cas9 and guide RNA concentration, please see detailed information in the Materials and Methods section. One-way ANOVA, Dunnett’s multiple comparisons post hoc test.
Figure 4
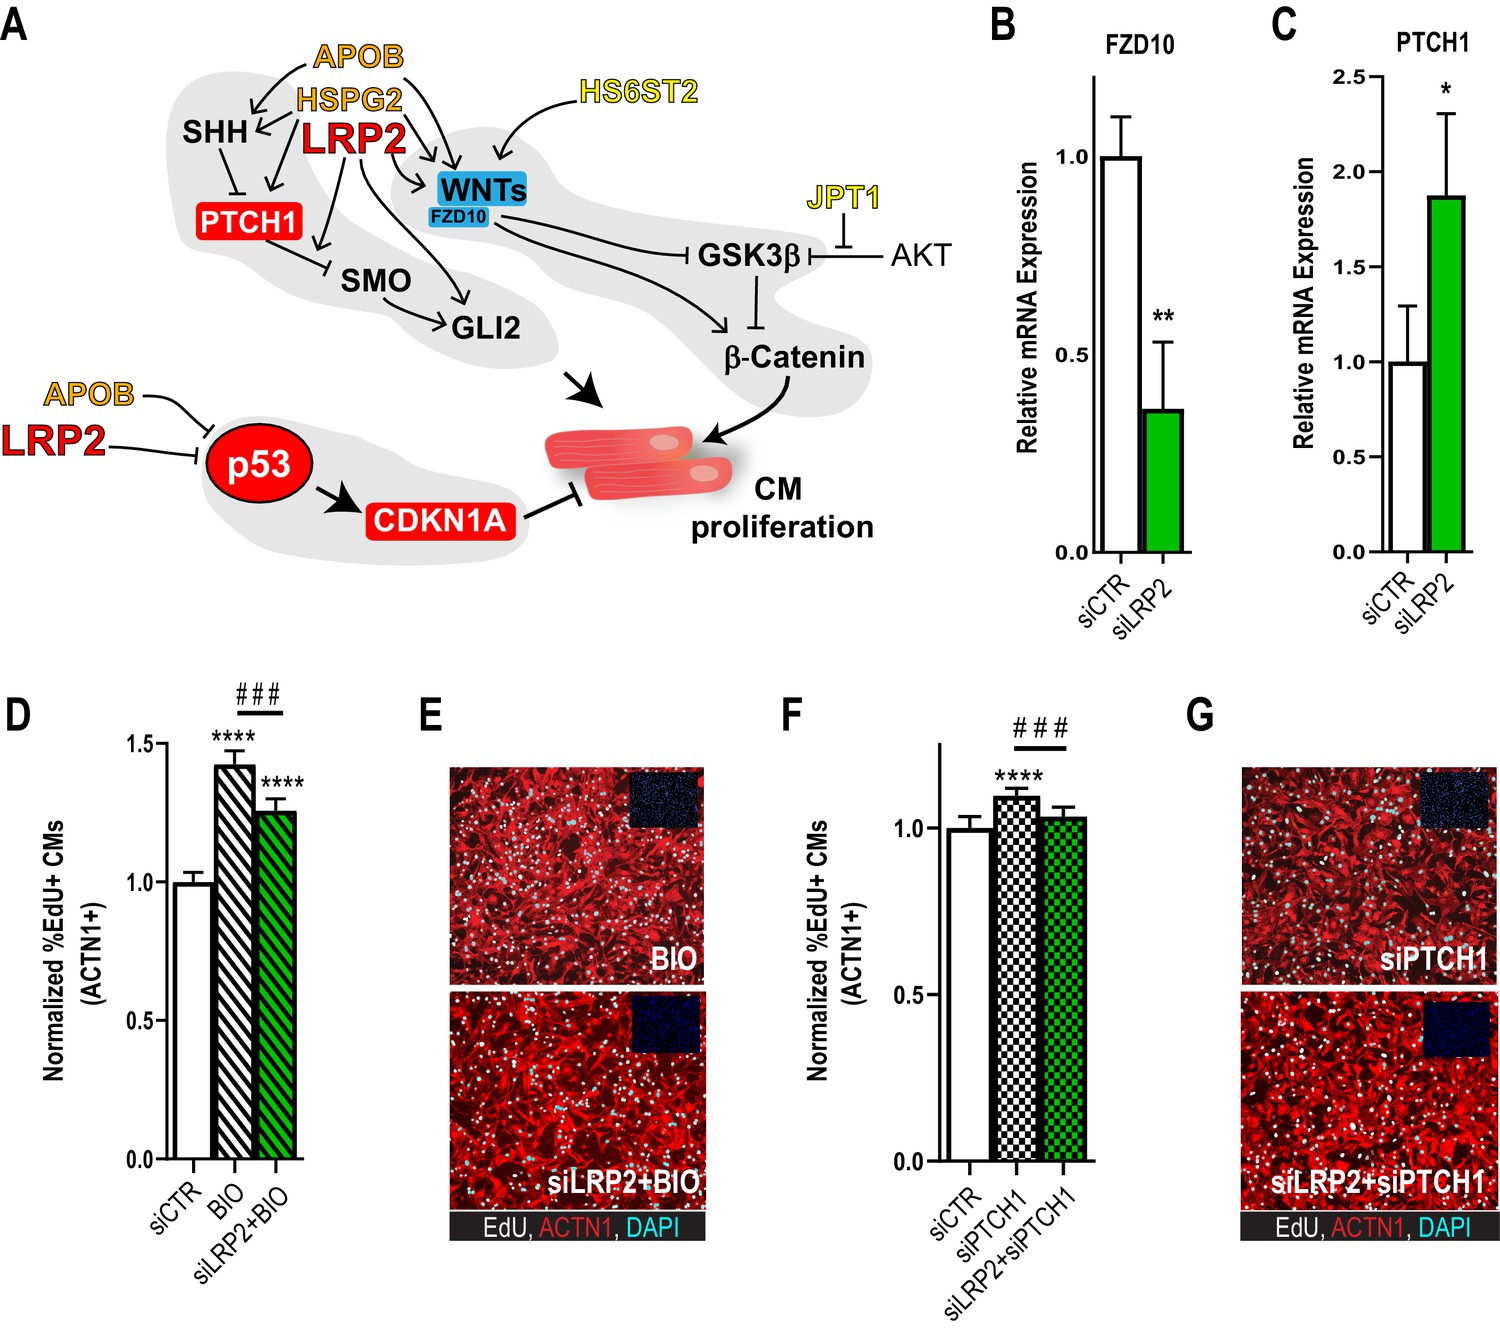
Potential role for SHH, WNT and LRP2 in HLHS.
(A) A gene network integrating family-centric HLHS candidate genes with heart development. ORANGE – genes with cardiac phenotypes in iPSC/Drosophila assays. YELLOW – other candidate genes with Drosophila phenotypes. RED – Genes up-regulated in proband iPSC-CMs vs. parents. BLUE – Genes downregulated downregulated in proband iPSCs vs. parents. (B,C) qPCR for FZD10, a WNT-pathway-associated gene, (B) and for PTCH1, a SHH pathway-associated gene (C) upon LRP2 KD in hiPSC-CM. **p<0.01, *p<0.05 Student’s t-test. (D) Quantification of EdU- incorporation assay in hiPSC-CM upon LRP2 KD in combination with BIO, a WNT inhibitor. ***or ###p<0.001, ****p<0.0001, one-way ANOVA. (E) Representative images of hiPSC-CM stained for EdU and ACTN1. Scale bars: 50 µm. (F) Quantification of EdU-incorporation assay in hiPSC-CM upon LRP2 KD in combination with PTCH1 KD, a SHH-associated gene. ***p<0.001, ****p<0.0001, one-way ANOVA. (G) Representative images of hiPSC-CM stained for EdU and ACTN1. Scale bars: 50 µm.
Videos
Video 1
Dissected adult fly heart showing rhythmic beating pattern.
Video 2
APOB-RNAi causes arrhythmia in dissected adult fly hearts.
Video 3
LRP2-RNAi causes arrhythmia in dissected adult fly hearts.
Tables
Table 1
Recessive Variants Identified in 10 Candidate Genes.
| Gene | Mode of inheritance | Functional impact | Transcript variant | Protein variant | Inheritance | Genotype in brother (II.1) | Genotype in sister (II.2) | gnomAD* MAF (%) | dbSNP ID |
|---|---|---|---|---|---|---|---|---|---|
| HSPG2 | Cmpd Het | missense | c.2074G > A; c.2077G > A | p.V692M; p.V693M | Maternal | WT | WT | 0.288 | 143669458 |
| missense | c.326G > A | p.R109Q | Paternal | Het | Het | 0 | 773796176 | ||
| promoter | c.-227C > A | Paternal | WT | WT | 1.392 | 566166086 | |||
| SLC9A1 | Cmpd Het | promoter | c.-906T > C | Paternal | Het | Het | 1.227 | 114101904 | |
| promoter | c.-947T > G | Maternal | WT | WT | 27.175 | 11588974 | |||
| promoter | c.-1085A > G | Paternal | Het | Het | 0.841 | 116299278 | |||
| ENCODE TFBS | c.-1138C > T | Paternal | Het | Het | 0.93 | 75089536 | |||
| promoter | c.-1311G > A | Paternal | Het | Het | 0.93 | 77414471 | |||
| APOB | Cmpd Het | missense | c.13441G > A | p.A4481T | Maternal | WT | Het | 2.475 | 1801695 |
| missense | c.751G > A | p.A251T | Paternal | Het | WT | 0.071 | 61741625 | ||
| LRP2 | Cmpd Het | missense | c.9613A > G | p.N3205D | Maternal | WT | WT | 0.407 | 35734447 |
| missense | c.170C > T | p.A57V | Paternal | WT | WT | 0.032 | 115350461 | ||
| SDHD | Cmpd Het | promoter | c.-815G > C; c.129+547C > G | Maternal | Het | WT | 0.573 | 117661257 | |
| ENCODE TFBS | c.-205G > A; c.66C > T | p.A22A | Paternal | WT | WT | 0.241 | 61734353 | ||
| missense | c.34G > A; c.-173C > T | p.G12S | Maternal | Het | WT | 0.729 | 34677591 | ||
| PRTG | Cmpd Het | microRNA Binding Site | c.*3501T > G | Paternal | Het | WT | 0.739 | 77181316 | |
| microRNA Binding Site | c.*2678A > G | Maternal | WT | Het | 0.019 | 756136447 | |||
| HN1 | Cmpd Het | ENCODE TFBS | c.56+617C > T; c.-903C > T; c.-178+617C > T; c.-590C > T | Maternal | Het | WT | 3.764 | 117213586 | |
| promoter | c.-1748A > C; c.-719A > C; c.-486A > C | Paternal | WT | Het | 0.816 | 73995795 | |||
| SIK1 | Hom Rec | missense | c.2087C > T | p.P696L | Maternal and Paternal | WT | Het | 1256991707 | |
| ELF4 | X-Linked | missense | c.1144G > A | p.V382I | Maternal | WT | Het | 0.025 | 148953158 |
| HS6ST2 | X-Linked | missense | c.948–40041G > A; c.1046G > A | p.R349Q | Maternal | WT | Het | 0.146 | 201239951 |
-
Cmpd Het, compound heterozygous; Het, heterozygous; Hom Rec, homozygous recessive; MAF, minor allele frequency; WT, wild- type.
*At study initiation the ESP database was used to set the 3% allele frequency filter. Updated frequencies are shown based on the newer gnomAD database curation which would now eliminate SLC9A1 and HN1 as candidate genes.
Key resources table
| Reagent type (species) or resource | Designation | Source or reference | Identifiers | Additional information |
|---|---|---|---|---|
| Genetic reagent (D. melanogaster) | Hand4.2-Gal4 | NA | PMID:16467358 | NA |
| Genetic reagent (D. melanogaster) | UAS-trolRNAi | Vienna Drosophila Resource Center (VDRC) | FBst0454629 | v22642 |
| Genetic reagent (D. melanogaster) | UAS-CG1943RNAi | Vienna Drosophila Resource Center (VDRC) | FBst0453803 | v20758 |
| Genetic reagent (D. melanogaster) | UAS-apolppRNAi | Vienna Drosophila Resource Center (VDRC) | FBst0470481 | v6878 |
| Genetic reagent (D. melanogaster) | UAS-Hs6stRNAi | Vienna Drosophila Resource Center (VDRC) | FBst0464695 | v42658 |
| Genetic reagent (D. melanogaster) | UAS-mglRNAi | Vienna Drosophila Resource Center (VDRC) | FBst0461660 | v36389 |
| Genetic reagent (D. melanogaster) | UAS-SdhdRNAi | Vienna Drosophila Resource Center (VDRC) | FBst0456581 | v26776 |
| Genetic reagent (D. melanogaster) | UAS-Nhe2RNAi | Vienna Drosophila Resource Center (VDRC) | FBst0477879 | v106053 |
| Genetic reagent (D. melanogaster) | UAS-JupiterRNAi | Vienna Drosophila Resource Center (VDRC) | FBst0455704 | v25044 |
| Genetic reagent (D. melanogaster) | UAS-Eip74EFRNAi | Vienna Drosophila Resource Center (VDRC) | FBst0477129 | v105301 |
| Genetic reagent (D. melanogaster) | UAS-Sik2RNAi | Vienna Drosophila Resource Center (VDRC) | FBst0456442 | v26496 |
| Genetic reagent (D. melanogaster) | mglMI14318 | Bloomington Drosophila Stock Center (BDSC) | FBal0302551 | BL-59689 |
| Genetic reagent (D. melanogaster) | tin346 | NA | FBal0035787 | NA |
| Strain, strain background (D. rerio) | Oregon AB wild-type | A commonly used wild-type strain | ||
| Strain, strain background (D. rerio) | Tg(myl7:EGFP)twu277 | Tsai Lab, National Taiwan University | PMID:12950077 | A transgenic line of zebrafish labeled with heart-specific EGFP fluorescence. |
| Strain, strain background (D. rerio) | Tg(myl7:H2A-mCherry)sd12 | Yelon Lab, University of California, San Diego | PMID:24075907 | A transgenic line of zebrafish specifically expressing mCherry in cardiomyocyte nuclei |
| Antibody | mouse monoclonal anti-ACTN1 | Sigma | A7811 | 1:800 |
| Antibody | donkey polyclonal anti-mouse Alexa fluor 568 | Invitrogen | A10037 | 1:1000 |
| Antibody | chicken polyclonal anti-GFP | Aves Labs | GFP-1020 | 1:300 |
| Antibody | rabbit polyclonal abit-mCherry | Rockland | 600–401 P16S | 1:200 |
| Antibody | donkey polyclonal anti-chicken AlexaFluor 488 | Jackson ImmunoResearch | 703-545-155 | 1:200 |
| Antibody | donkey polyclonal anti-rabbit AlexaFluor 568 | Invitrogen | A10042 | 1:200 |
| Other | DAPI (iPSC) 500 mg/mL | Sigma | D9542 | 1:1000 |
| Other | DAPI (Zebrafish) 500 mg/mL | Invitrogen | D1306 | 1:200 |
| Sequence-based reagent | LRP2 siRNA | Entrez Gene ID: 4036 | Dharmacon | On-Target plus, SmartPool |
| Sequence-based reagent | APOB siRNA | Entrez Gene ID: 338 | Dharmacon | On-Target plus, SmartPool |
| Sequence-based reagent | PTCH1 siRNA | Entrez Gene ID: 5727 | Dharmacon | On-Target plus, SmartPool |
| Sequence-based reagent | TP53 siRNA | Entrez Gene ID: 7157 | Dharmacon | On-Target plus, SmartPool |
| Sequence-based reagent | CDKN1A siRNA | Entrez Gene ID: 1026 | Dharmacon | On-Target plus, SmartPool |
| Sequence-based reagent | ELF4 siRNA | Entrez Gene ID: 2000 | Dharmacon | On-Target plus, SmartPool |
| Sequence-based reagent | JPT1 siRNA | Entrez Gene ID: 51155 | Dharmacon | On-Target plus, SmartPool |
| Sequence-based reagent | HS6ST2 siRNA | Entrez Gene ID: 90161 | Dharmacon | On-Target plus, SmartPool |
| Sequence-based reagent | HSPG2 siRNA | Entrez Gene ID: 3339 | Dharmacon | On-Target plus, SmartPool |
| Sequence-based reagent | PRTG siRNA | Entrez Gene ID: 283659 | Dharmacon | On-Target plus, SmartPool |
| Sequence-based reagent | SDHD siRNA | Entrez Gene ID: 6392 | Dharmacon | On-Target plus, SmartPool |
| Sequence-based reagent | SIK1 siRNA | Entrez Gene ID: 150094 | Dharmacon | On-Target plus, SmartPool |
| Sequence-based reagent | SLC9A1 siRNA | Entrez Gene ID: 6548 | Dharmacon | On-Target plus, SmartPool |
| Sequence-based reagent | CDH | Hs00170423_m1 | IDT Integrated DNA technologies, Coralville, IA | characterization of the pluripotent state |
| Sequence-based reagent | DNMT3 | Hs01003405_m1 | IDT Integrated DNA technologies, Coralville, IA | characterization of the pluripotent state |
| Sequence-based reagent | DPPA2 | Hs00414521_g1 | IDT Integrated DNA technologies, Coralville, IA | characterization of the pluripotent state |
| Sequence-based reagent | DPPA5 | Hs00988349_g1 | IDT Integrated DNA technologies, Coralville, IA | characterization of the pluripotent state |
| Sequence-based reagent | ERAS | Hs.PT.45.4849266.g | IDT Integrated DNA technologies, Coralville, IA | characterization of the pluripotent state |
| Sequence-based reagent | GDF3 | Hs00220998_m1 | IDT Integrated DNA technologies, Coralville, IA | characterization of the pluripotent state |
| Sequence-based reagent | OCT-4 | Hs.PT.45.14904310.g | IDT Integrated DNA technologies, Coralville, IA | characterization of the pluripotent state |
| Sequence-based reagent | REXO1 | Hs.PT.45.923095.g | IDT Integrated DNA technologies, Coralville, IA | characterization of the pluripotent state |
| Sequence-based reagent | SALL4 | Hs00360675_m1 | IDT Integrated DNA technologies, Coralville, IA | characterization of the pluripotent state |
| Sequence-based reagent | TDG1 | Hs02339499_g1 | IDT Integrated DNA technologies, Coralville, IA | characterization of the pluripotent state |
| Sequence-based reagent | TERT | Hs99999022_m1 | IDT Integrated DNA technologies, Coralville, IA | characterization of the pluripotent state |
| Sequence-based reagent | APOB | Hs.PT.56a.1973344 | IDT Integrated DNA technologies, Coralville, IA | characterization of the pluripotent state |
| Sequence-based reagent | DHCR24 | Hs.PT.56a.4561516 | IDT Integrated DNA technologies, Coralville, IA | expression during guided cardiac differentiation |
| Sequence-based reagent | ELF4 | Hs.PT.56a.25941471 | IDT Integrated DNA technologies, Coralville, IA | expression during guided cardiac differentiation |
| Sequence-based reagent | HN1 | Hs.PT.58.40922463.g | IDT Integrated DNA technologies, Coralville, IA | expression during guided cardiac differentiation |
| Sequence-based reagent | HSPG2 | Hs.PT.56a.18698732 | IDT Integrated DNA technologies, Coralville, IA | expression during guided cardiac differentiation |
| Sequence-based reagent | HS6ST2 | Hs.PT.56a.1354985 | IDT Integrated DNA technologies, Coralville, IA | expression during guided cardiac differentiation |
| Sequence-based reagent | LRP2 | Hs.PT.56a.1584067 | IDT Integrated DNA technologies, Coralville, IA | expression during guided cardiac differentiation |
| Sequence-based reagent | MYLK | Hs.PT.56a.39795491 | IDT Integrated DNA technologies, Coralville, IA | expression during guided cardiac differentiation |
| Sequence-based reagent | PCDH11X | Hs.PT.56a.26531358 | IDT Integrated DNA technologies, Coralville, IA | expression during guided cardiac differentiation |
| Sequence-based reagent | PRTG | custom design | IDT Integrated DNA technologies, Coralville, IA | expression during guided cardiac differentiation |
| Sequence-based reagent | SIK1 | Hs.PT.58.2995158 | IDT Integrated DNA technologies, Coralville, IA | expression during guided cardiac differentiation |
| Sequence-based reagent | SLC9A1 | Hs.PT.58.15072523 | IDT Integrated DNA technologies, Coralville, IA | expression during guided cardiac differentiation |
| Sequence-based reagent | SDHD | Hs.PT.58.40267655.g | IDT Integrated DNA technologies, Coralville, IA | expression during guided cardiac differentiation |
| Sequence-based reagent | GAPDH | Hs.PT.45.8326 | IDT Integrated DNA technologies, Coralville, IA | expression during guided cardiac differentiation |
| Commercial assay or kit | EdU | Click-it Plus EdU Imaging Kit | Life Technologies | |
| Chemical compound, drug | BIO (GSK-3 Inhibitor) | Sigma | B1686 | |
| Software, algorithm | Prism v7 and v8 | GraphPad Software |
Additional files
-
Supplementary file 1
Differentially expressed genes between proband and parental 25 day old iPSC-derived cardiomyocytes.
- https://cdn.elifesciences.org/articles/59554/elife-59554-supp1-v2.xlsx
-
Supplementary file 2
Gene function enrichment analysis for differentially expressed transcripts at day 25.
- https://cdn.elifesciences.org/articles/59554/elife-59554-supp2-v2.xlsx
-
Supplementary file 3
Recessive and dominant genotypes identified in index case.
- https://cdn.elifesciences.org/articles/59554/elife-59554-supp3-v2.xlsx
-
Supplementary file 4
Differentially expressed genes between proband and parental 0 day old iPSCs.
- https://cdn.elifesciences.org/articles/59554/elife-59554-supp4-v2.xlsx
-
Supplementary file 5
Interactome of prioritized HLHS candidate genes.
- https://cdn.elifesciences.org/articles/59554/elife-59554-supp5-v2.xlsx
-
Supplementary file 6
SKAT-O Analysis of 2 prioritized candidate genes in cases and controls.
- https://cdn.elifesciences.org/articles/59554/elife-59554-supp6-v2.xlsx
-
Supplementary file 7
Rare, predicted-damaging LRP2 missense variants in cases and controls (CADD>24).
- https://cdn.elifesciences.org/articles/59554/elife-59554-supp7-v2.xlsx
-
Supplementary file 8
Case-Control Association Analysis of Rare Variants in LRP2.
- https://cdn.elifesciences.org/articles/59554/elife-59554-supp8-v2.pdf
-
Supplementary file 9
ENCODE Datasets.
- https://cdn.elifesciences.org/articles/59554/elife-59554-supp9-v2.xlsx
-
Transparent reporting form
- https://cdn.elifesciences.org/articles/59554/elife-59554-transrepform-v2.pdf
Download links
A two-part list of links to download the article, or parts of the article, in various formats.
Downloads (link to download the article as PDF)
Open citations (links to open the citations from this article in various online reference manager services)
Cite this article (links to download the citations from this article in formats compatible with various reference manager tools)
Patient-specific genomics and cross-species functional analysis implicate LRP2 in hypoplastic left heart syndrome
eLife 9:e59554.
https://doi.org/10.7554/eLife.59554


