Odd-paired is a pioneer-like factor that coordinates with Zelda to control gene expression in embryos
- California Institute of Technology, Division of Biology and Biological Engineering, United States
- Stony Brook University, Department of Biochemistry and Cell Biology and Center for Developmental Genetics, United States
Figures
Figure 1 with 2 supplements

Opa is required to support activation of reporter expression at late nc14, just preceding gastrulation.
In this and all other subsequent figures lateral views of embryos are shown with anterior to the left and dorsal up, unless otherwise noted. (A,C) Stills from movies (n = 3 for each) of the two indicated sog_Distal MS2-yellow reporter variants sog_Distal (A) or sogD_ΔOpa (C) in which five predicted Opa-binding sites were mutated as shown (H) and transcription detected in vivo via MS2-MCP-GFP imaging (Koromila and Stathopoulos, 2019) at three representative timepoints: nc13, nc14B, and nc14C. Blue dots indicate presence of GFP+ signal, representing nascent transcripts labeled by the MS2-MCP system; thresholding was applied and remaining signals identified by the Imaris Bitplane software, for visualization purposes only. Nuclei were labeled by Nup-RFP (Lucas et al., 2013). Scale bar represents 50 μm. (B) Plots of number of active nuclei, defined by counting dots (x-axis) versus relative DV axis embryo-width (EW) position (y-axis), analyzed from representative stills from movies of three embryos at nc14C. (D, E) Anti-Opa (D) and anti-Zld (E) antibody staining of early wild-type embryos at the indicated stages. (F) Integrative Genomics Viewer (IGV) genome browser track of the sog locus showing Zld and Opa ChIP-seq data for embryos at two timepoints: nc13-14 and nc14 late for Zld (GSM763061 and GSM763061, respectively; Harrison et al., 2011) and 3 hr and 4 hr for Opa. Zld nc13-14, Zld nc14 late and Opa 3 hr ChIP-seq samples are of overlapping timepoints, whereas Opa 4 hr ChIP-seq sample is later. Gray shading marks the region of sog_Distal enhancer location. (G) JASPAR consensus binding site for Opa based on mammalian Zic proteins identified by bacterial one-hybrid (Sen et al., 2010; Noyes et al., 2008). (H) Location of 5 sequences within the 650 bp sog_Distal enhancer region that match the Jaspar Opa consensus binding site allowing 1 bp mismatch. Mutated Opa sites introduced to eliminate binding are shown in blue, creating sogD_ΔOpa (C; see Materials and methods). Bases in bold (7 bp) indicate matches to the Opa de novo motifs identified by ChIP-seq analysis (see J). For sake of comparison to consensus sequence, reverse complement sequence is shown for a subset. (I) Consensus binding site for Mus musculus Zic3/Opa homolog identified using ChIP-seq (Lim et al., 2010). (J,K) Sequence logo representations of the most significant and abundant motifs, likely consensus binding sites, identified by HOMER de novo motif analysis in the Opa 3 hr and Opa 4 hr (J), or Zld nc13-14 and Zld nc14 late (K) ChIP-seq datasets defined (Central motif enrichment p-values 1e-566, 1e-354, 1e-3283, and 1e-2173, respectively). Grey-shaded box indicates the shared region between Opa motifs.
Figure 1—figure supplement 1
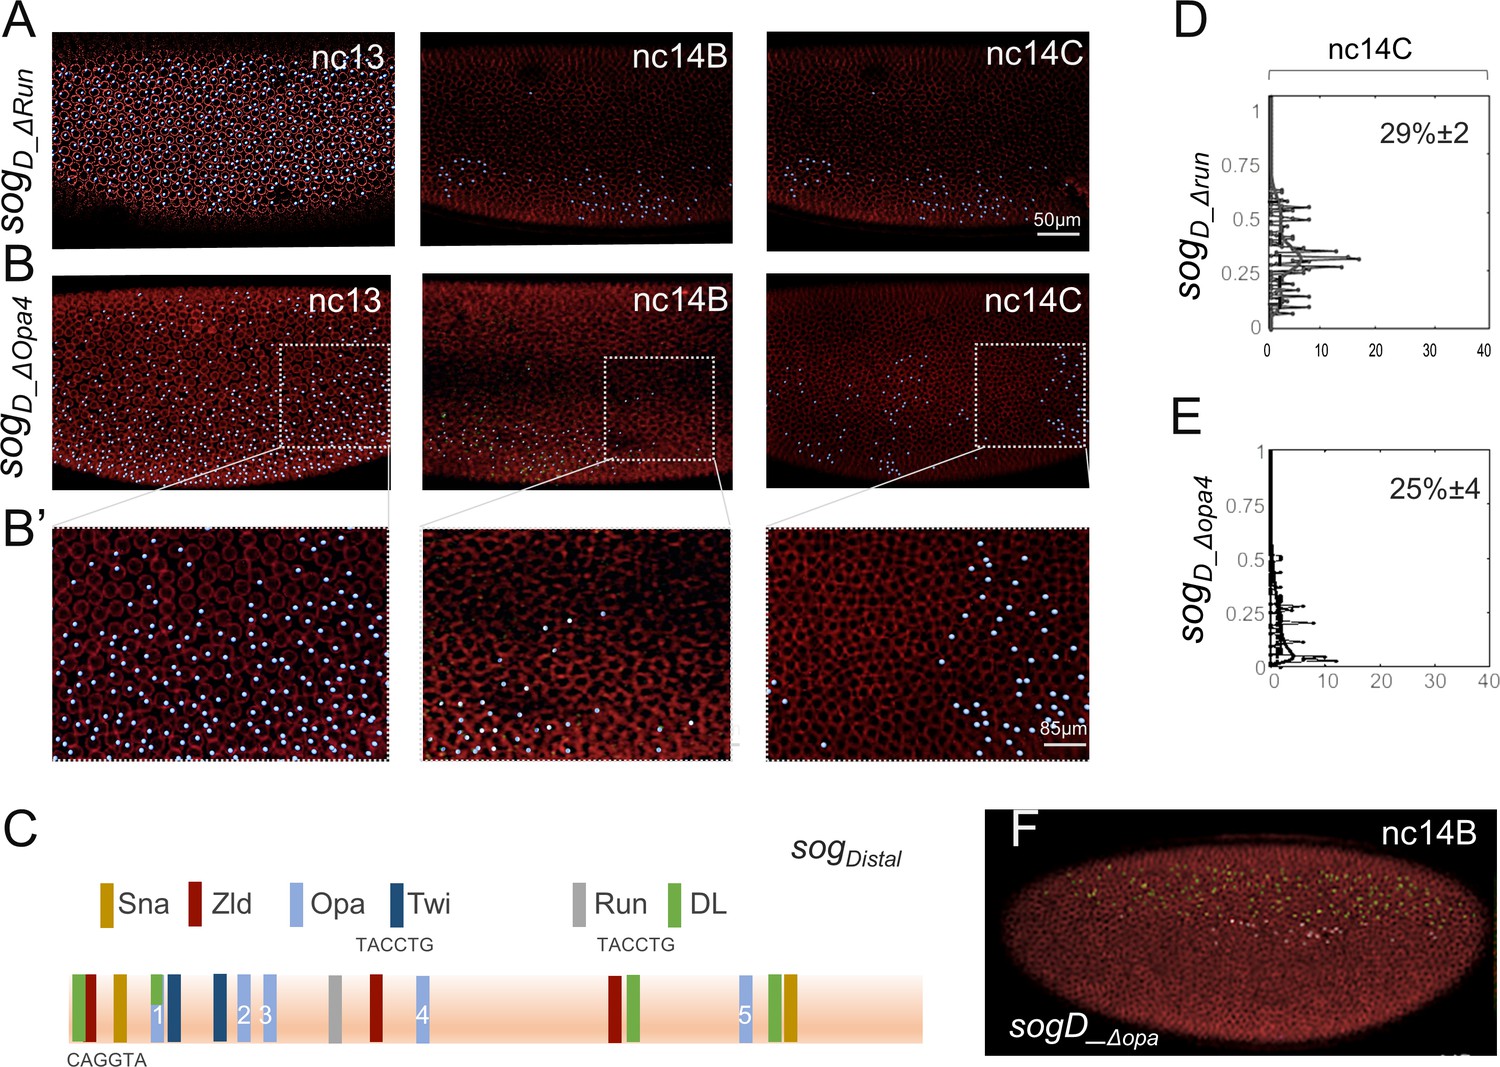
Assay of sog_Distal expression outputs through live in vivo imaging following mutagenesis of Opa or Run predicted binding sites.
(A–B’) MS2-MCP imaging-based computationally defined dots of nascent transcripts (blue) and nuclear membranes marked by Nup-RFP (Lucas et al., 2013) associated with the sogD_Δrun reporter in which the single Run site (see C) is mutated (Koromila and Stathopoulos, 2019) or the sogD_Δopa4 reporter, in which only one Opa binding site, site 4 (C), is mutated. (A) Depicts a lateral view, including a ventral domain in which the reporter is repressed by Snail, whereas (B) Shows a dorsal-lateral view. (B’) Shows magnified views of B; expression is sometimes retained at the posterior of embryos. (C) 650 bp sog_Distal enhancer sequence showing relative organization of binding sites for transcription factors based on matches to consensus sequences: 5 sites for Opa, 3 sites for Zld, 3 sites for DL, 2 sites for Sna, 2 sites for Twi and 1 site for Run (JASPAR). Base-pair sequences for three Zld sites shown, which are matches to the consensus. Zld and Run sites were previously mutated and characterized (Foo et al., 2014; Koromila and Stathopoulos, 2017). (D, E) Plots of number of active nuclei, defined by counting dots (x-axis) versus relative DV axis embryo-width (EW) position (y-axis), analyzed from representative stills of three embryos (movies) at nc14C for both sogD_Δrun and sogD_Δopa4 reporters. Numbers in upper right corners represent widths of reporter expression defined as EW distance at 30% maximal signal; average values of data for three embryos (for detailed methods see Koromila and Stathopoulos, 2019). (F) Screenshot of the sogD_ΔOpa-MS2-yellow reporter at nc14B from a different movie depicting a ventral vantage point that demonstrates sogD_ΔOpa expression is repressed ventrally.
Figure 1—figure supplement 2
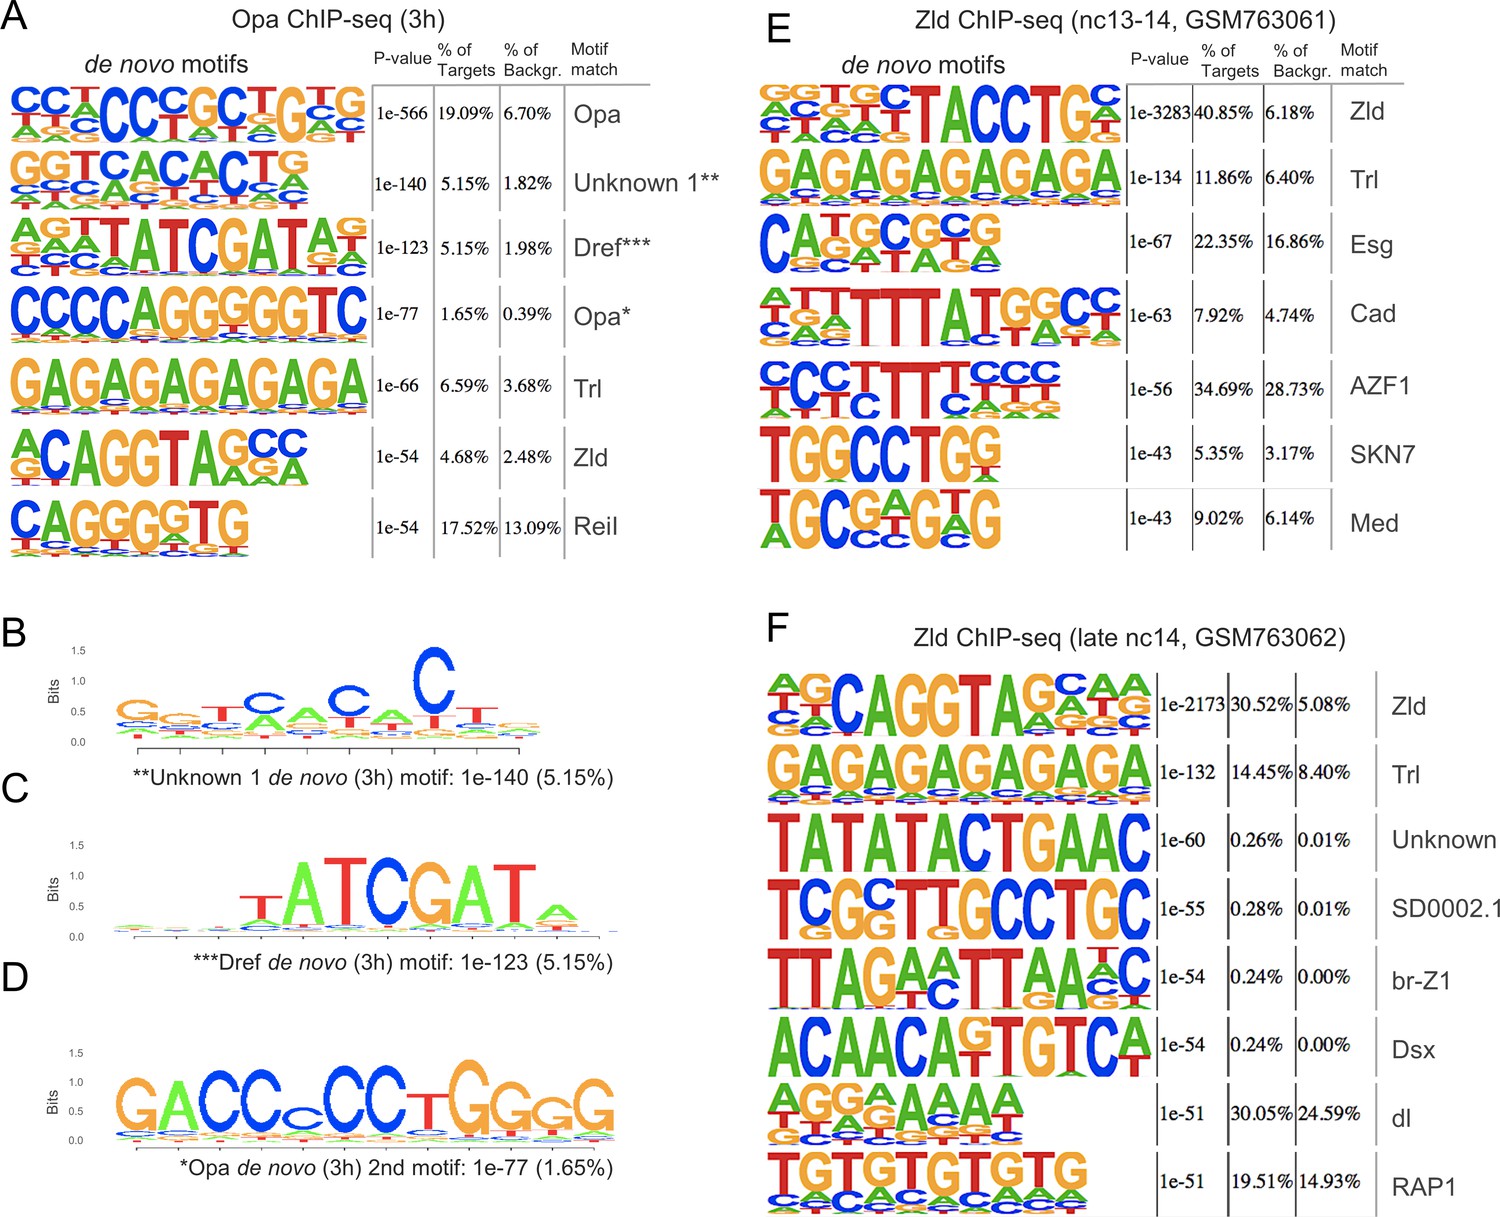
Most abundant motifs identified using HOMER de novo motif analysis within the Opa (3 hr) ChIP-seq and two Zld ChIP-seq datasets spanning nc14.
(A) Seven most enriched motifs for Opa (3 hr) ChIP-seq ChIP-seq analysis as detected by HOMER. The top identified motifs also shown in Figure 1. A second motif exhibiting extended homology with the JASPAR Opa consensus was identified at lower frequency (see panel B). (B, C, D) Reverse complement of three most abundant motifs identified using HOMER within the 3 hr Opa ChIP-seq dataset, showing extended homology to JASPAR Opa site. (E) Seven most enriched motifs for Zld nc13-nc14 ChIP-seq analysis as detected by HOMER. The top identified motifs also shown in Figure 1. (F) Zld ChiP-seq eight most enriched motifs for nc14 late embryos.
Figure 2 with 1 supplement
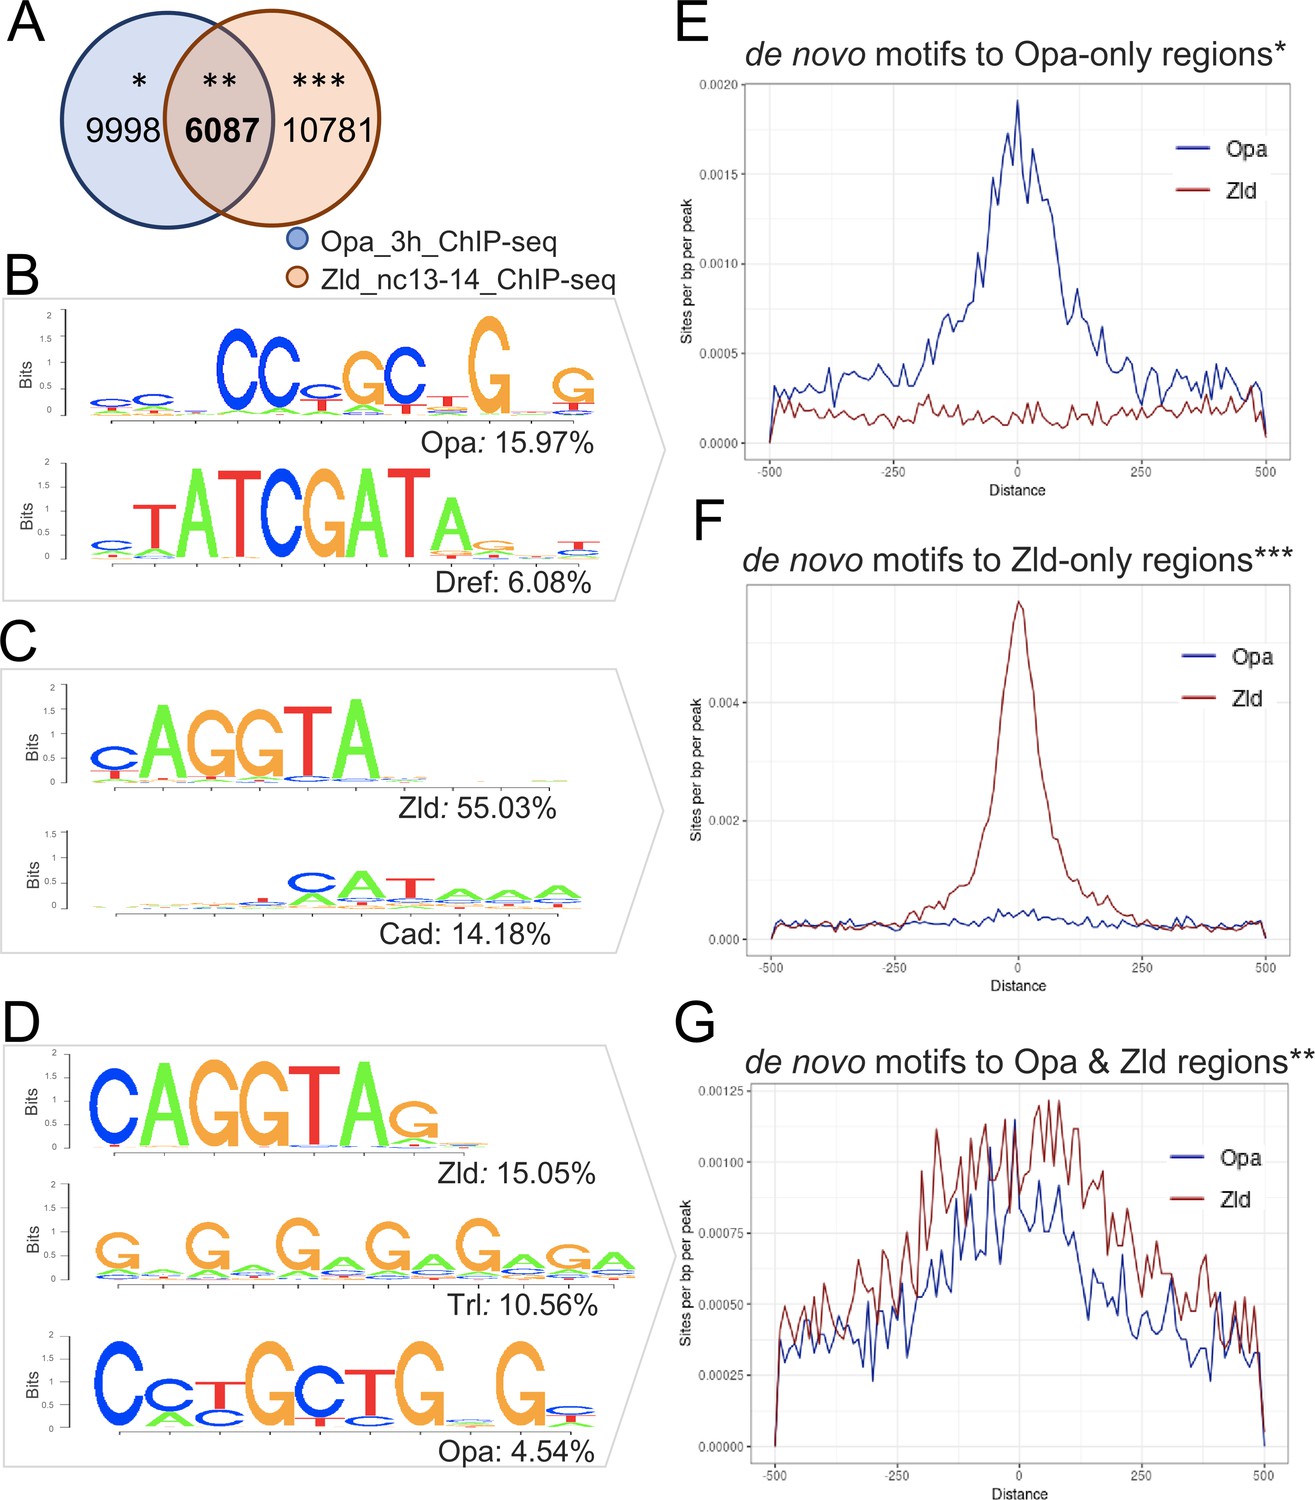
Enrichment of Opa and Zld de novo motifs in a subset of peaks that correspond to Opa-only, Zld-only, or Opa/Zld-bound regions identified by ChIP-seq.
(A) Venn diagram showing overlap between peaks called using MACS2 analysis of Opa (3 hr) and Zld (nc13-14) ChIP-seq data. Opa and Zld experiments used embryos of 2.5–3.5 hr in age or nc13-14, respectively, which are overlapping timepoints. Opa-only peaks (*); Opa/Zld overlap peaks (**); Zld-only peaks (***). (B–D) Sequence logo representations of two to three most abundant motifs identified using HOMER de novo motif analysis within three sets of peaks: Opa-only, Zld-only, Opa/Zld overlap peaks (D). Sequence logo height indicates nucleotide frequency; corresponding percentage of peaks containing match to motifs also shown for each set, as indicated. p-Values represent the significance of motifs’ enrichment compared with the genomic background, which is greater than 1e-43 in all cases. See also Figure 2—source data 1. (E–G) Aggregation plots showing enrichment of Opa or Zld de novo motifs identified within Opa-only, Zld-only, or Opa/Zld-bound regions from Opa (3 hr) peaks and Zld (nc13-nc14) ChIP-seq peaks. Averaging of ChIP-seq data from two replicates was performed prior to the de novo analysis. (E) Opa-only bound regions (after exclusion of Zld-only and Opa-Zld overlap peaks); (F) Zld-only bound regions (after exclusion of Opa and Opa-Zld overlap peaks); and (G) for Opa-Zld overlap regions.
-
Figure 2—source data 1
Significance and abundance of motifs for known transcription factors found by HOMER within the three corresponding sets of peaks.
- https://cdn.elifesciences.org/articles/59610/elife-59610-fig2-data1-v3.docx
Figure 2—figure supplement 1
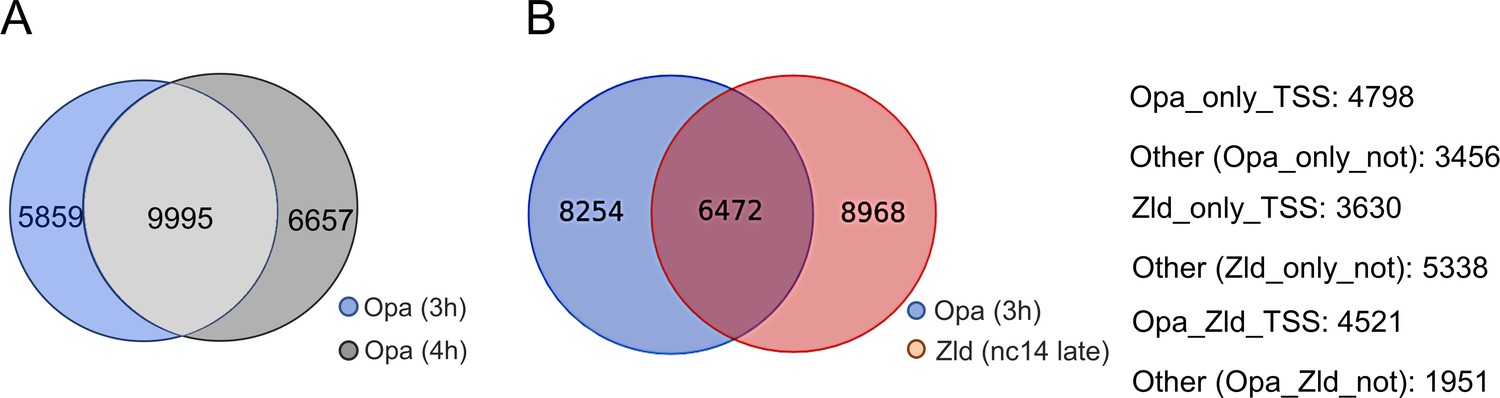
Overlapping peaks identified in the Opa (3 hr), Opa (4 hr), and/or Zld (nc14 late) ChIP-seq datasets, as well as information regarding promoter/non-promoter peak locations.
(A) Venn diagram comparing the number of Opa-early (3 hr) versus Opa-late (4 hr) ChIP-seq called peaks identified using the MACS2 peak caller (see Materials and methods). (B) Number of Opa or Zld peaks associated with Opa-only, Zld-only, or Opa/Zld-bound classes in comparison of Opa (3 hr) and Zld (nc14 late) ChIP-seq experiments; compare overlap/Venn diagram with Opa (3 hr) and Zld (nc13-nc14) ChIP-seq experiments analyzed in Figure 2A. Of the Opa-only, Zld-only, or Opa/Zld bound classes, data support the view that Opa-occupied peaks (with or without Zld) are more often associated with promoter regions (TSS ± 3 kB).
Figure 3 with 1 supplement
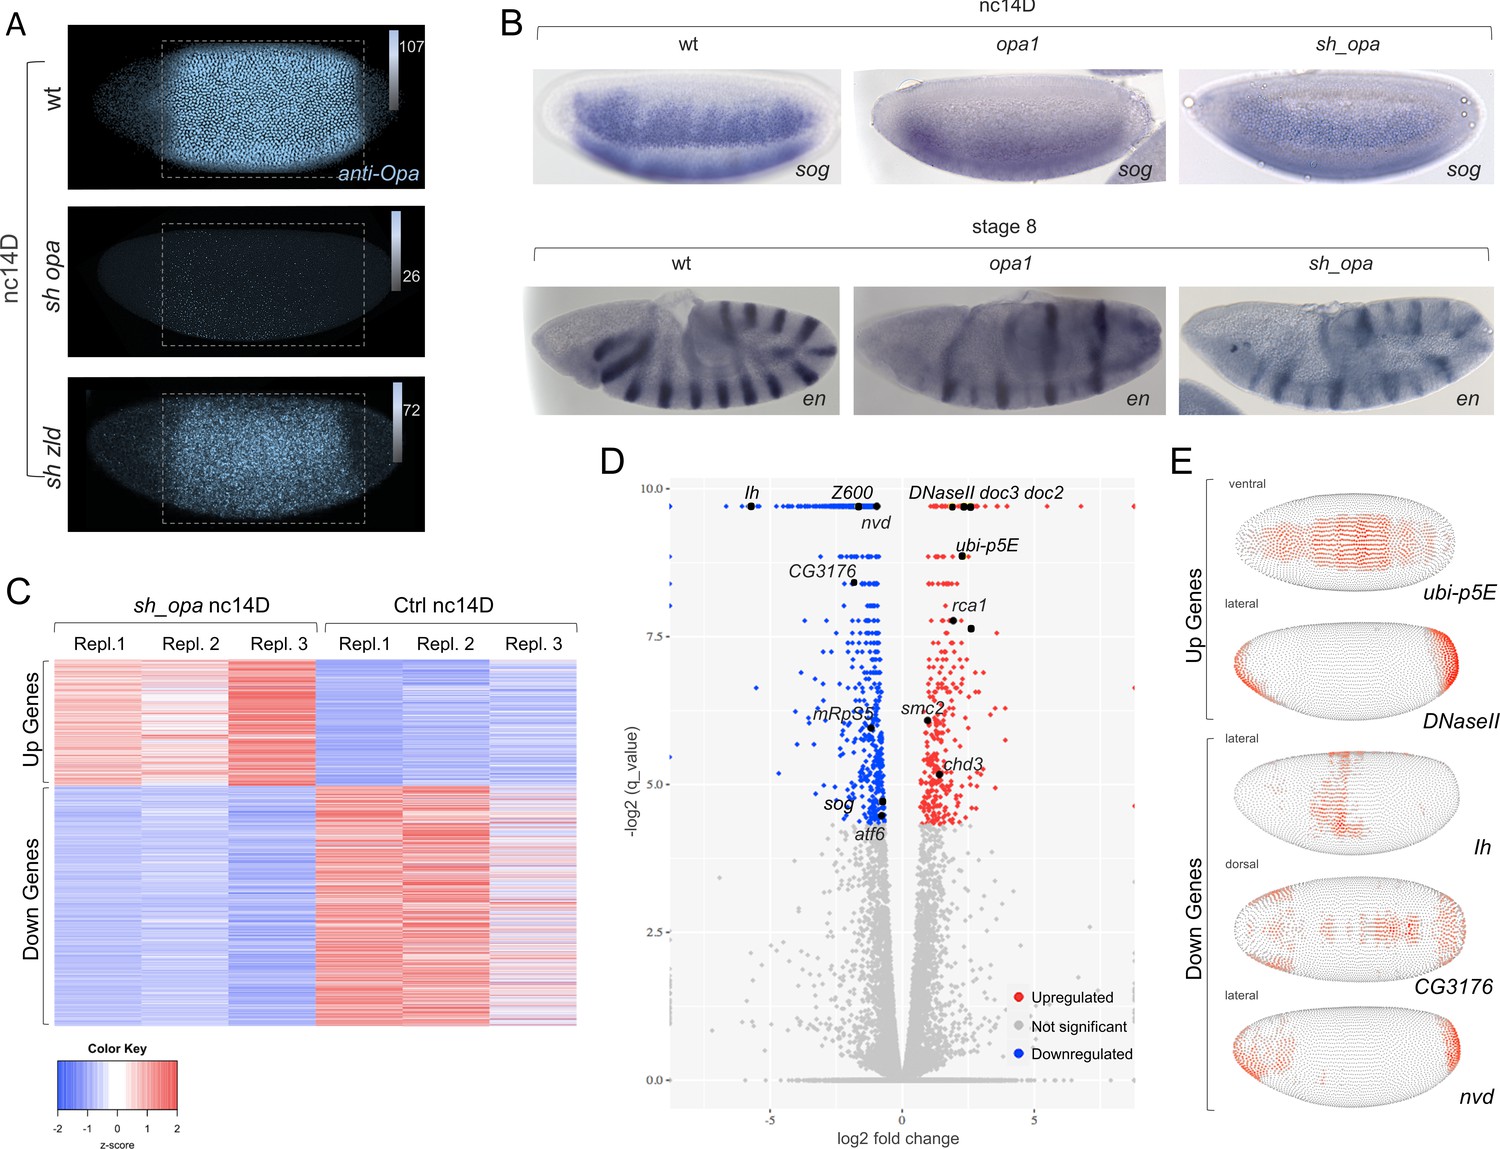
opa mutants broadly affect gene expression in nc14, preceding segmentation, suggesting a more general role for this gene.
(A) Anti-Opa antibody staining (cyan) of wildtype (wt; A), opa RNAi (sh_opa), or zld RNAi (sh_zld) embryos (n = 3–5 per genotype) at nc14D. The selected area (grey rectangular box) was quantified using ImageJ/Fiji (see Materials and methods). Gradient bars and numbers in upper right corners represent the intensity of each fluorescent image’s selected area. (B) In situ hybridization using riboprobes to sog at nc14D, as well as en staining at stage eight in wt, opa1 mutant and sh_opa.MTD-Gal4 embryos. (C) RNA-seq analysis was performed using control (yw females crossed to sh_opa males) and sh_opa embryos at nc14D (n = 3 per genotype). Replicate expression of up- and down-regulated genes is presented as a heatmap with Z-score representing relative expression value across replicates. Color-key: blue represents low expression and red high expression. This plot demonstrates consistency of RNA-seq results across different replicates. (D) Volcano plots for genes identified through RNA-seq to be significantly downregulated (left; blue versus grey) or significantly upregulated (right; red versus grey) genes. Subset of genes that exhibit Zld and/or Opa occupancy are noted; see also Figure 3—source data 1. (E) Images from the DVEX virtual expression software show expression patterns of some of the differentially expressed Opa/Zld or Opa-only targets (Karaiskos et al., 2017).
-
Figure 3—source data 1
Single embryo RNA-seq data associated with opa RNAi versus control nc14D embryos.
- https://cdn.elifesciences.org/articles/59610/elife-59610-fig3-data1-v3.xlsx
-
Figure 3—source data 2
Association of genes identified by sh_opa RNA-seq with Zld and/or Opa ChIP-seq peaks.
- https://cdn.elifesciences.org/articles/59610/elife-59610-fig3-data2-v3.docx
Figure 3—figure supplement 1

Opa is responsible for differential gene expression in both embryonic axes as early as nc14.
(A–C) Heatmaps of normalized ChIP-seq data of Opa-early (3 hr; A), Zld nc13-nc14 (B), Zld nc14 late (C) samples centered at the transcription start sites of upregulated, or downregulated genes based on opa RNAi (sh_opa) RNA-seq data (see Figure 3). Transcription start sites are positioned at 0; the region shown is extended to 3 kb on either side. The size of the peaks is displayed as a color code from white (smallest) to red (largest). Key indicates normalized signal intensities. (D, E) Gene Ontology (GO) enrichment was used to create a functional profile of genes that are differentially expressed, upregulated (D) or downregulated (E), in sh_opa embryos according to the RNA-seq analysis. (F) Statistical analysis of Opa (3 hr) and Zld nc14 late binding at differentially expressed RNA-seq genes to determine if observed changes in expression relate to direct action of Opa and/or Zld.
Figure 4 with 2 supplements

Opa chromatin immunoprecipitation (ChIP) demonstrates binding globally including enhancers active at nc14 as well as later stages.
(A–E’) In house (A’, hb_stripe ; Perry et al., 2012; Koromila and Stathopoulos, 2017) and publicly available genome-scale enhancer characterization (VT reporters; Kvon et al., 2014) demonstrating expression at nc14D by in situ (A’, B’, E’), as well as IGV browser tracks of genes expressed along either the AP (A, B, D, E) or DV (C) axes showing Zld nc13-14 (orange), Zld nc14 late (pink), and Opa (3 hr) (blue) ChIP-seq replicates (as indicated). Anti-Opa antibody was used to immunoprecipitate chromatin isolated from embryos ~ 3 hr in age (see Materials and methods). Published Zld ChIP-seq data for two different timepoints is shown (GSM763061: nc13-14 and GSM763061:nc14 late; Harrison et al., 2011). Nc14 was used as a point of comparison between the 3 ChIP samples. Gray boxes indicate regions with significant occupancy by both Opa and Zld as detected by ChIP-seq peaks, which can be located at promoter and/or distal regions (A, C, D, F); whereas, light blue boxes indicate regions with significant Opa-only binding at promoter and/or distal regions (A, B, E). (F, G) Heatmaps produced by deepTools (see Materials and methods) were used to plot histone H3K4me3 and H3K4me1 at nc14a (G) and H3K4me3 and H3K4me1 at nc14C (H) signal intensities centered at different ChIP-seq regions (Zld-only, Opa-Zld overlap, and Opa-only bound ChIP-seq peaks). For the two different timepoints nc14A and nc14C, different Zld ChIP data were used (GSM763061: nc13-nc14 and nc14 late, respectively; Harrison et al., 2011). Key indicates histone signal intensities (deepTools normalized RPKM with bin size 10). For this and all subsequent data presented using heatmaps, the first sample in the heatmap was used for sorting the genomic regions based on descending order of mean signal value per region; all other comparison samples were plotted using the same order determined by the first sample.
Figure 4—figure supplement 1
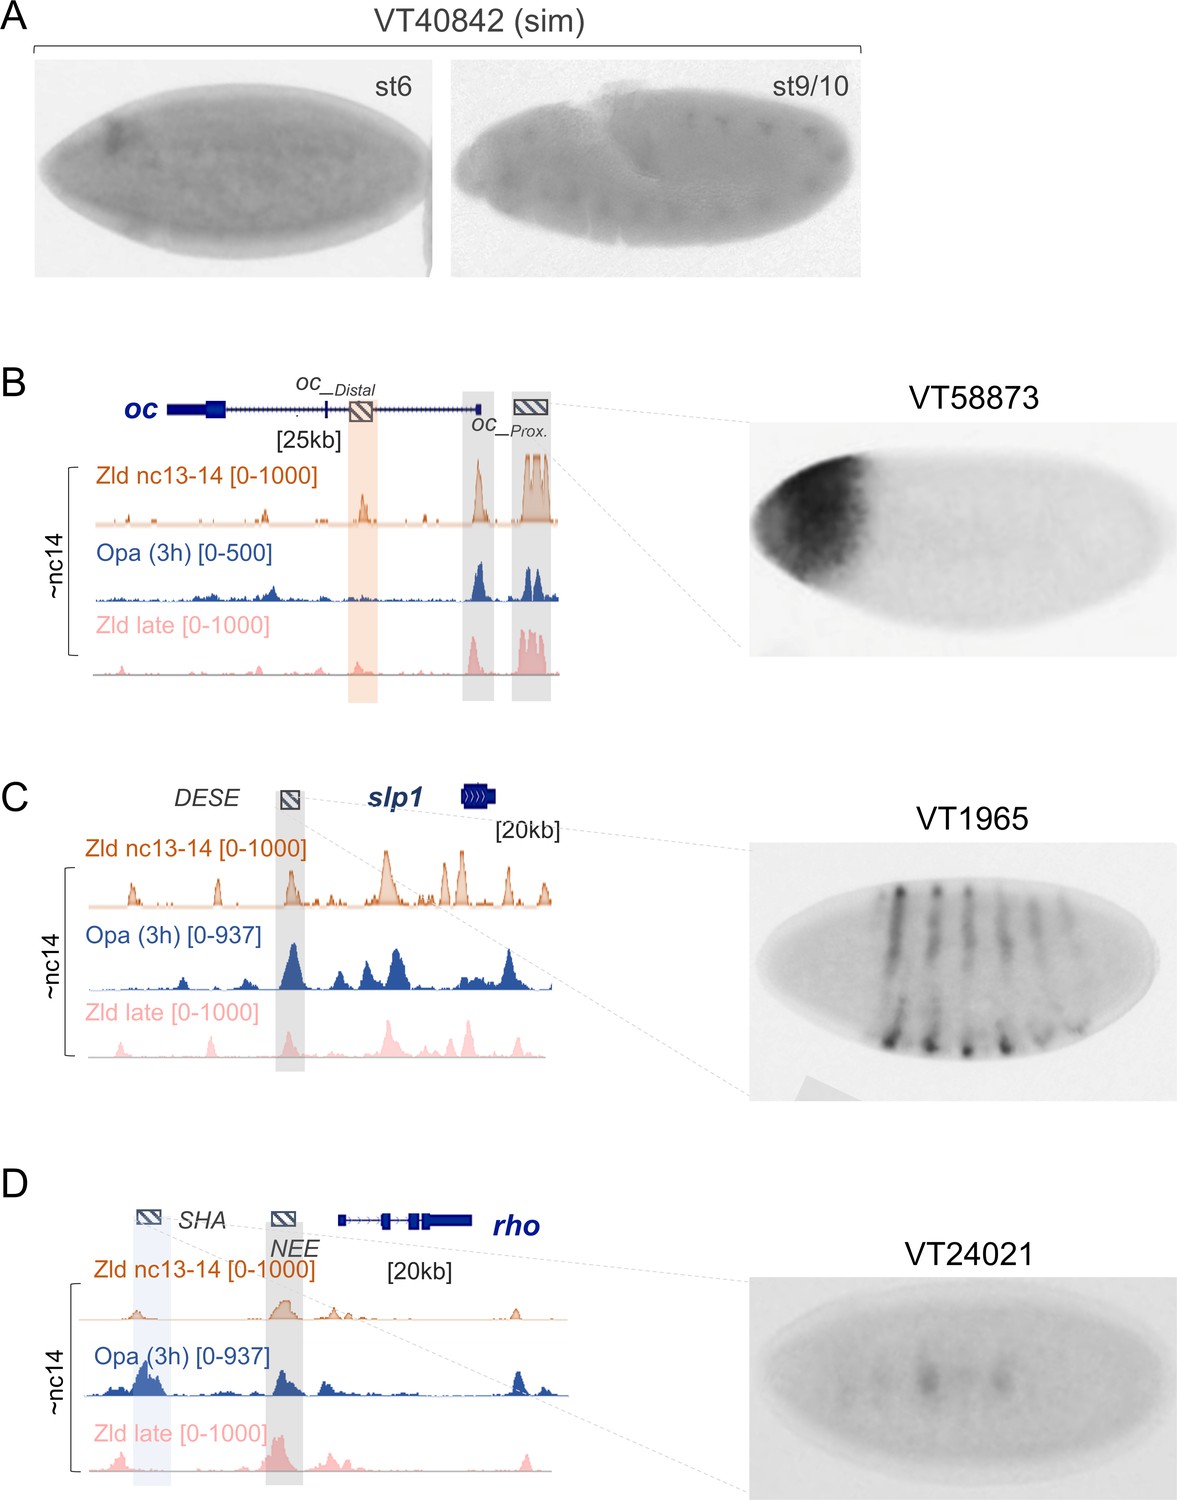
Additional examples of binding of Opa and/or Zld to enhancer regions active in nc14 and later.
Embryo ventrolateral or lateral views are shown except (D), which shows a dorsal view; anterior is to the left. Embryos were stained by in situ hybridization using a GAL4 riboprobe. Images from Stark lab web viewer of data from Kvon et al., 2014. (A) Data from publicly available genome-scale enhancer characterization (Kvon et al., 2014) demonstrating expression for VT40842 enhancer associated with sim locus (stage 6 and stage 9/10). (B–D) IGV browser tracks of individual gene loci expressed showing combined replicates of Opa (3 hr) (blue), Zld nc13-nc14 (orange), Zld nc14 late (pink) ChIP-seq (as indicated) for comparisons at nc14. Publicly available data demonstrating expression for VT58873 enhancer associated with oc locus (nc14D), VT1965 enhancer associated with slp1 locus and VT24021 enhancer associated with rho locus.
Figure 4—figure supplement 2
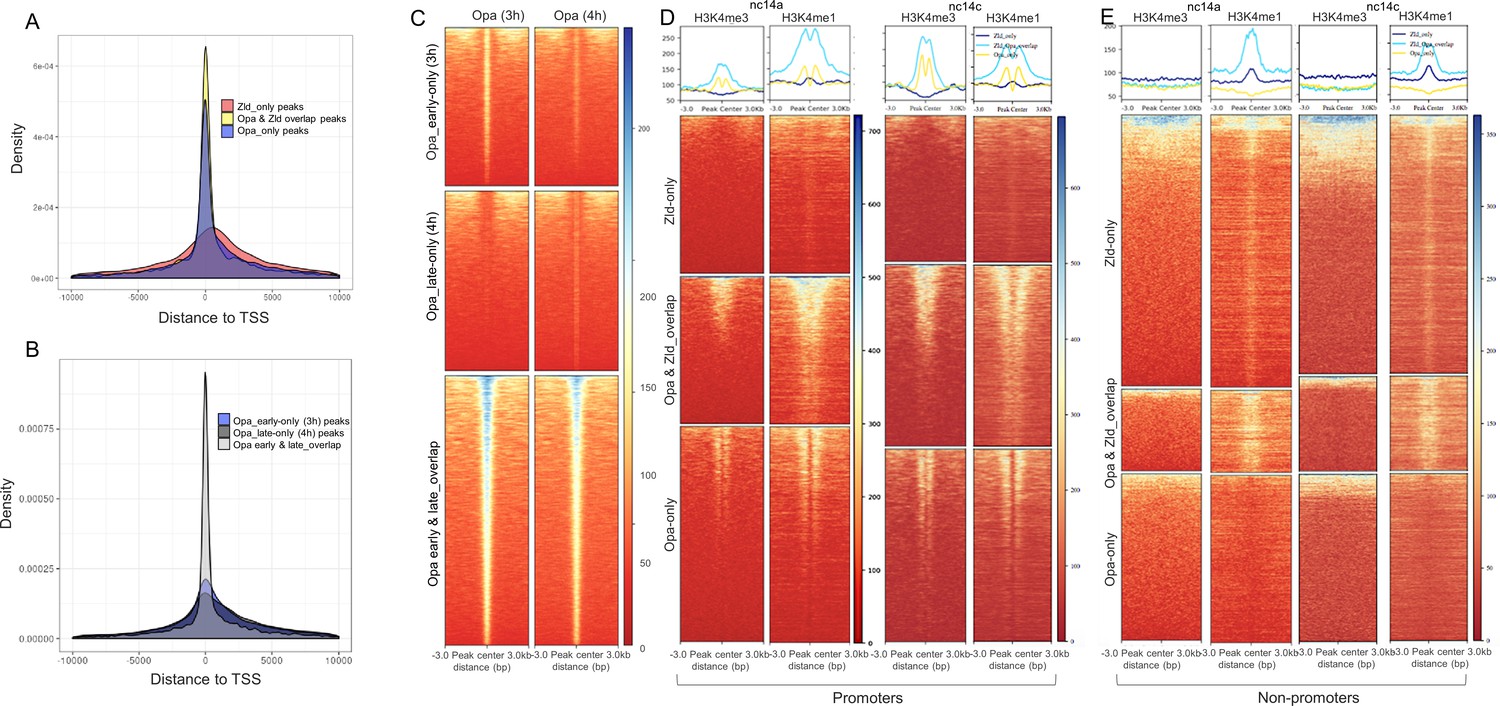
Position of ChIP-seq called peaks relative to transcription start sites (TSSs) as well as a comparison of Opa-early (3 hr) versus Opa-late (4 hr) peak size and overlap.
(A, B) Histograms showing the distribution of the position of Opa-only (3 hr), Opa (3 hr)/Zld (nc13-14) overlap and Zld nc13-14 only peaks (A) or Opa_(3 hr) only, Opa_(4 hr) only, and Opa (3 hr) and (4 hr) overlap peaks (B) relative to the transcription start site (TSS). (C) Heatmaps of normalized ChIP-seq data of Opa-early (3 hr; left) or Opa-late (4 hr; right) centered on genomic sequences representing called peaks of one of three classes: Opa-early only (3 hr), Opa-late only (4 hr), or Opa-early and -late overlap. Center of ChIP-seq called peaks are positioned at 0, and extended to 3 kb shown on either side. The size of the peaks is displayed as a color code from blue (largest) to red (smallest). Opa-early only (3 hr; top), Opa-late only (4 hr; right) ChIP-seq regions split up to illustrate relative size of peaks and enrichment of these DNA regions in the two ChIP-seq samples. Key indicates normalized signal intensities (see Materials and methods) around different ChIP-seq regions. (D, E) Heatmaps produced by deepTools (see Materials and methods) were used to plot histone H3K4me3 and H3K4me1 at nc14A and at nc14C signal intensities around different promoter and non promoter ChIP-seq regions (Zld-only, Opa-Zld overlap, and Opa-only bound ChIP-Seq peaks). For the two different timepoints nc14A and nc14C, different Zld ChIP datasets were used (GSM763061: nc13-nc14 and nc14 late, respectively; Harrison et al., 2011). Heatmaps are centered on ChIP-seq peak summits. Key indicates histone signal intensities (deepTools normalized RPKM with bin size 10) around (±3 kb) different ChIP-seq regions.
Figure 5 with 3 supplements
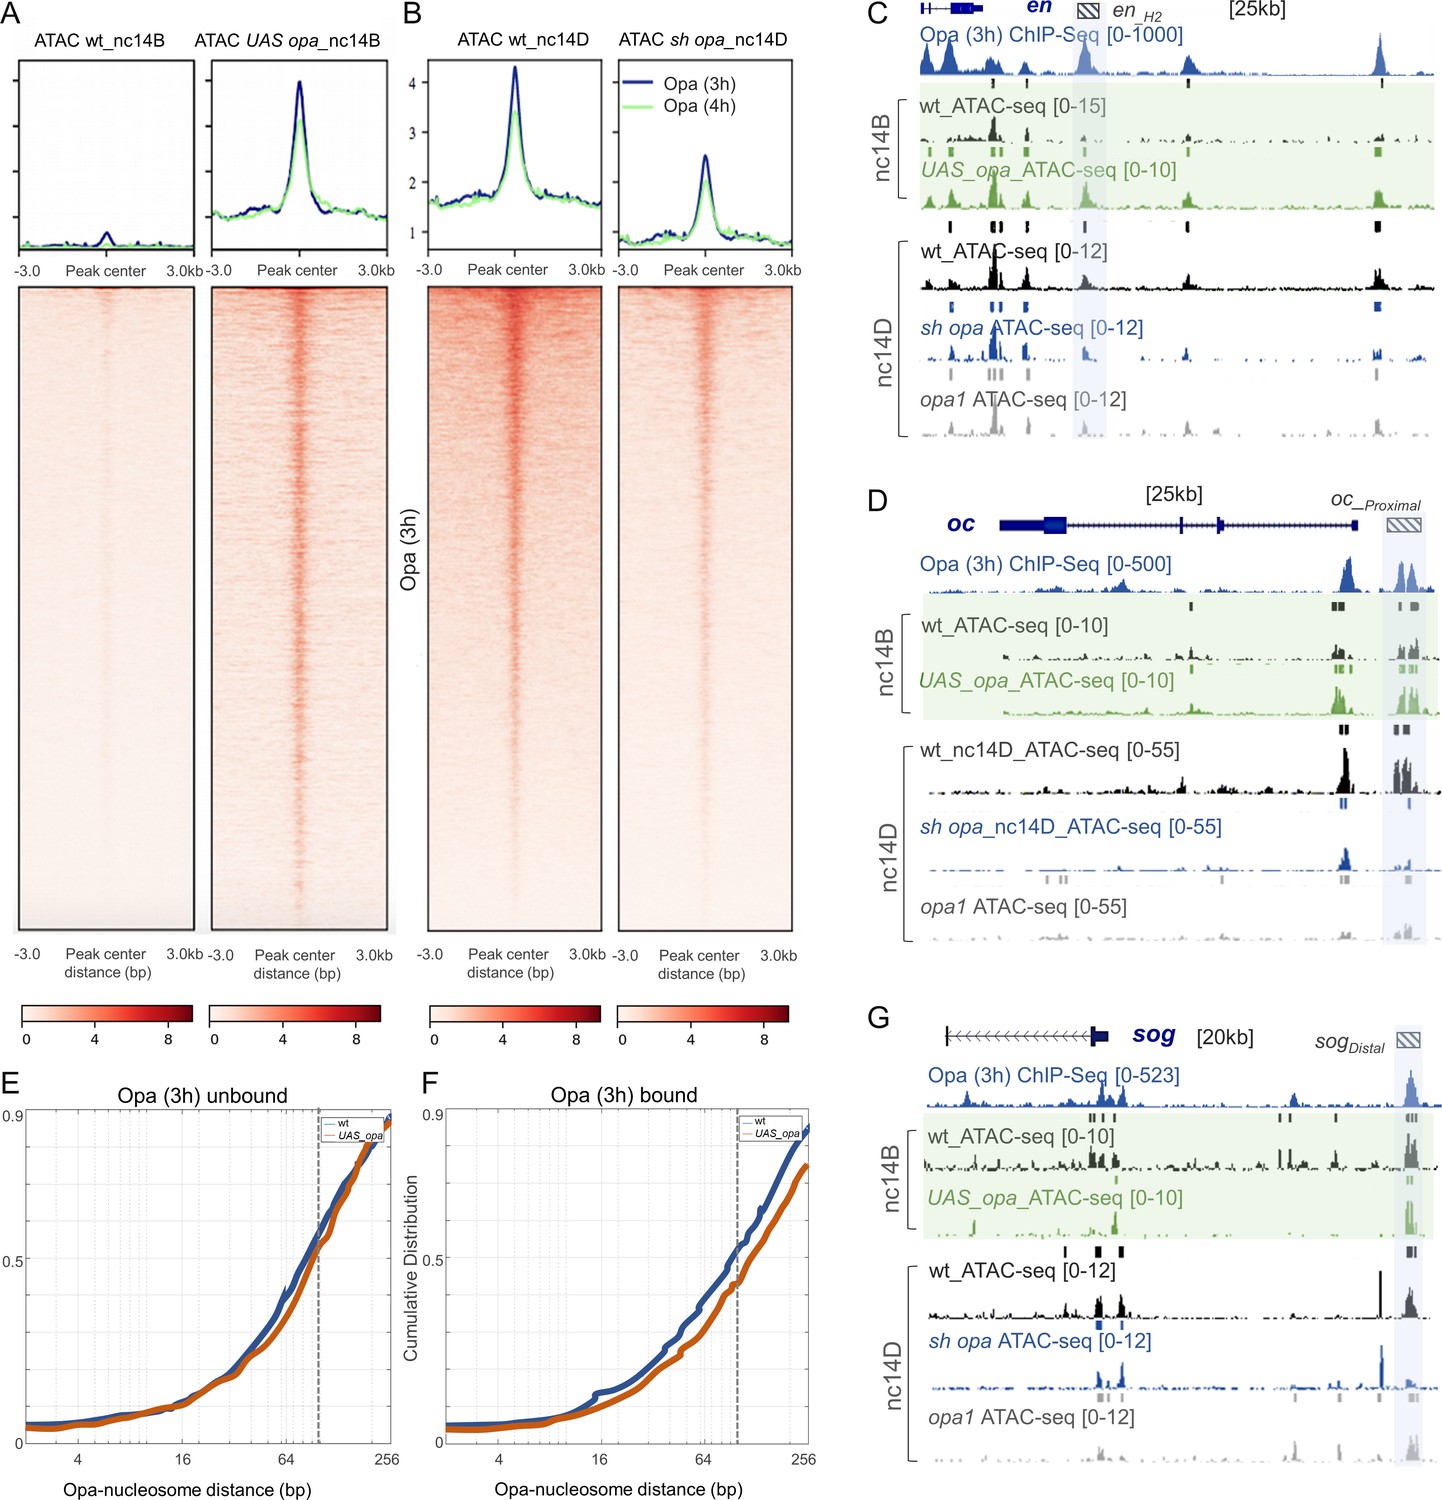
Opa influences chromatin accessibility during nc14 in Drosophila embryos in part by displacing nucleosomes.
(A, B) Heatmaps of normalized paired-end ATAC-seq signal from nc14D wt, sh_opa and opa1 mutant embryos for the regions called from Opa (3 hr) ChIP-seq. Each row of the heatmap is a genomic region, centered to peaks of accessibility signals. The accessibility is summarized with a color code key representative of no accessibility (white) to maximum accessibility (red). Plot at the top of the heatmap shows the mean signal at genomic regions centered at peaks of accessibility signals (Opa 3 hr: blue trace; Opa 4 hr: green trace). Averaging of ATAC-seq data from two nc14D embryos (n = 3) were used for this analysis (see Materials and methods). (C, D, G) UCSC dm6 genome browser tracks of representative loci showing Opa (3 hr) (navy blue), ChIP-seq replicates, as well as single replicates of nc14B (green box) and nc14D ATAC-seq. Examples of late enhancer regions that significantly gain/lose accessibility, compared to wt, in either UAS-opa, sh_opa and/or opa1 mutants are defined by blue shaded regions. Plots show mean normalized read coverage of the replicates (see also Figure 5—source data 1). (E, F) Cumulative distribution of measured distances between 21440 unbound (E) and 4481 bound (F) Opa motif sites and modeled nucleosome dyad positions (Schep et al., 2015) under wildtype conditions (blue) or upon ectopic expression of opa (red). The expected coverage of a nucleosome is depicted by the vertical dotted line. X-axis is log2 scaled.
-
Figure 5—source data 1
Single embryo ATAC-seq data for multiple genetic backgrounds and stages (see tabs) to investigate relationship of Opa to chromatin accessibility.
- https://cdn.elifesciences.org/articles/59610/elife-59610-fig5-data1-v3.xlsx
Figure 5—figure supplement 1
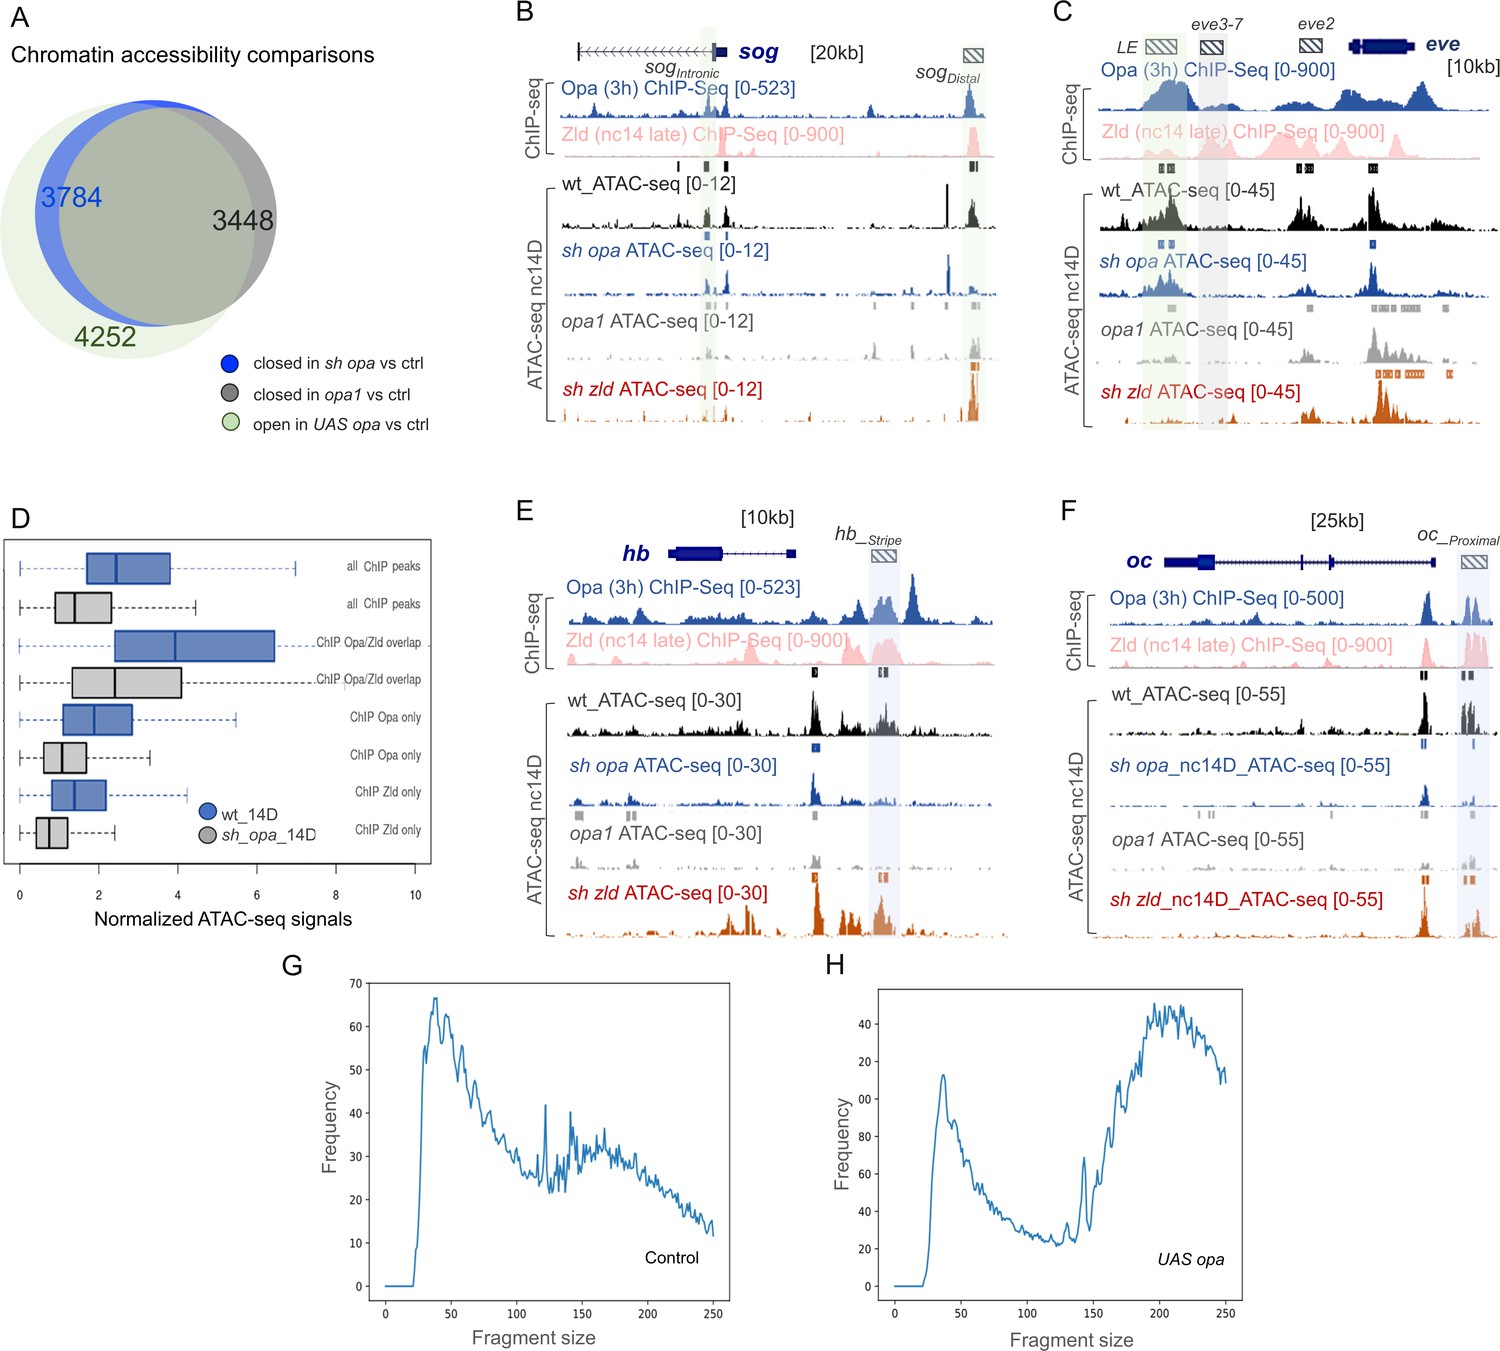
Opa or Opa+Zld are required for chromatin accessibility as revealed by ATAC-seq on single embryos.
(A) Venn diagram comparing the number of closed chromatin peaks in sh_opa (3784), opa1 (3448) versus control at nc14D, and more open chromatin peaks in UAS-opa versus control at nc14B. There is 88.5% overlap (3301 peaks) between the opa1 and sh_opa closed chromatin peaks (versus open peaks in control), and 75% overlap (3187 peaks) between the sh_opa closed (accessible/open peaks in control) and UAS-opa open peaks (non-accessible/closed peaks in control). (B, C, E, F) UCSC dm6 genome browser tracks of representative loci showing Opa (3 hr) (navy blue), and Zld nc14 late (pink) ChIP-seq data for combined replicates (as indicated), as well as representative ATAC-seq data for individual nc14D embryos. Examples of late enhancer regions that significantly lose accessibility, compared to wt, either in sh_opa and opa1 mutants (B, E, F; blue shaded box) or in both opa mutants and sh_zld (C; grey shaded box). Mint shaded boxes in B and C define enhancer regions that lose accessibility in sh_zld but not in sh_opa or opa1 mutants. ChIP-seq plots show mean normalized read coverage of the replicates. (D) Normalized ATAC-seq signals of nc14D control and opa RNAi (sh_opa) sample groups (x-axis) were quantified within 1 kb genomic bins surrounding three classes of ChIP-seq regions: Opa-early only (3 hr), Opa-early and Zld-late (nc14 late) overlap or Zld-late only (nc14 late), and presented in a box plot. For comparison, ATAC-seq signals surrounding all ChIP-seq peak regions are presented for comparison. (G, H) Fragment-size distribution for single-embryo ATAC-seq samples. X-axis represents the fragment size (i.e. between 5’ ends of a pair-end sequencing read pair) measured by the mapped read pairs while Y-axis represents frequency counts.
Figure 5—figure supplement 2
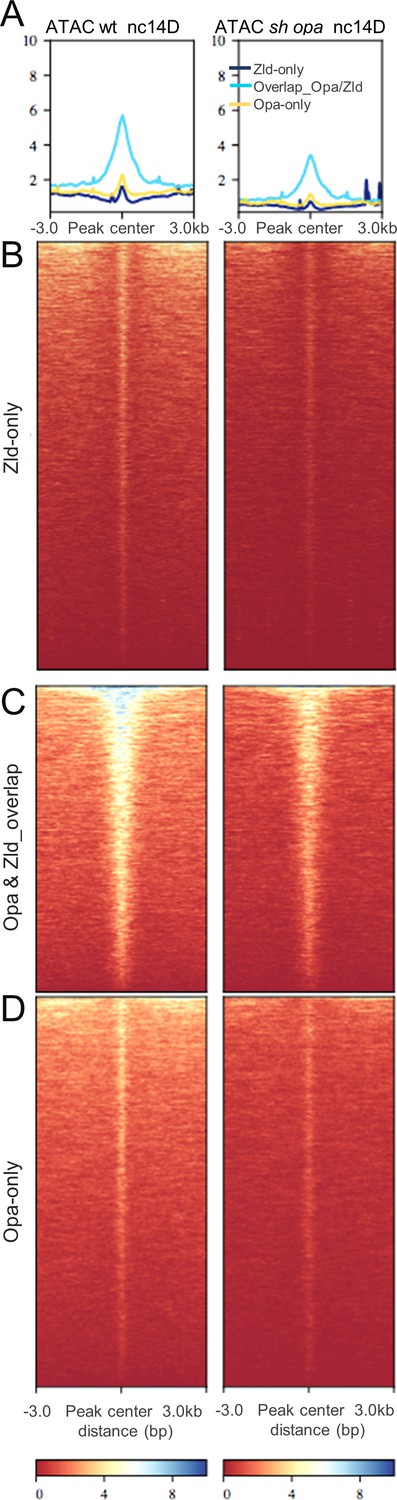
Chromatin accessibility changes associated with Opa ChIP-detected binding as related to Opa/Zld occupancy.
(A–D) Aggregated signals (A) and heatmaps of normalized paired-end ATAC-seq data from wt and sh_opa mutant nc14D embryos centered at Opa (3 hr) ChIP-seq called peak regions [i.e. Zld-only (B), Opa-Zld overlap (C), and Opa-only (D) regions; see Figure 2A]. Each line of the heatmap is a genomic region. The accessibility is summarized with a color code from red (no accessibility) to blue (maximum accessibility). The aggregation plot shows the mean signal at the genomic regions for these three classes of ChIP-seq defined regions, which were centered to peaks of corresponding accessibility signals.
Figure 5—figure supplement 3
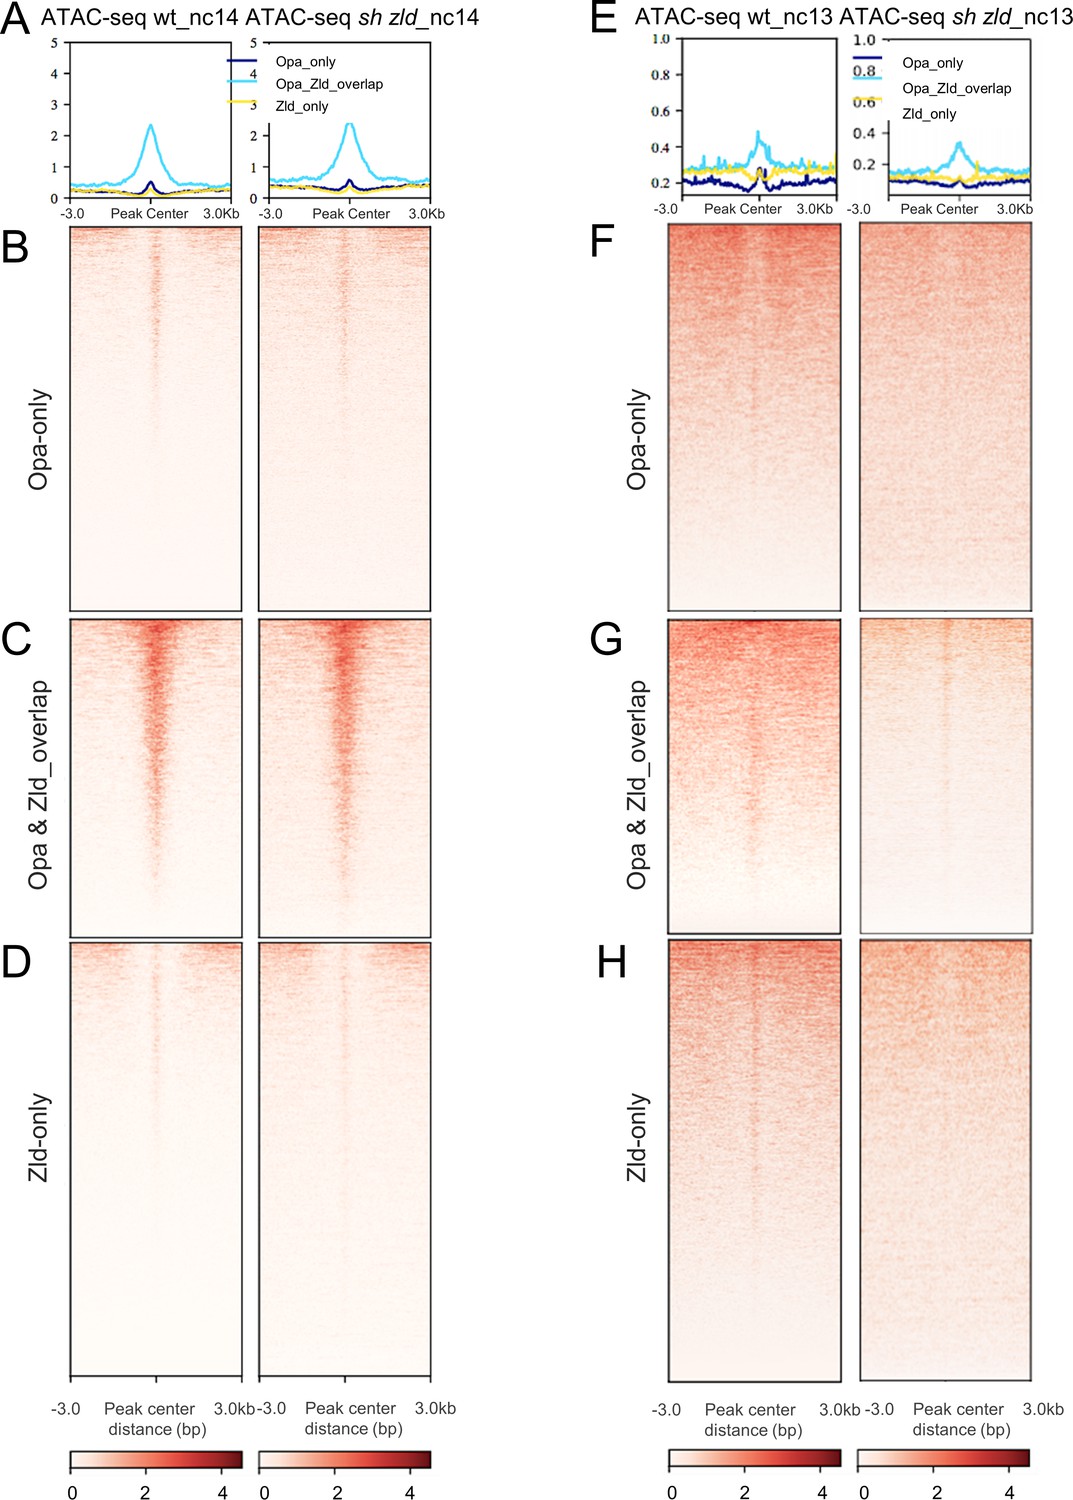
Single-end ATAC-seq confirms Zld’s role early (nc13) but with minimal effect later (nc14).
Aggregation plots at the top show the mean signal at the genomic regions, which were centered to peaks of accessibility signals (A,D). Each line of the heatmap is a genomic region. The accessibility is summarized with a color code from white (no accessibility) to red (maximum accessibility). (A–D) Aggregated signals (A) and heatmaps of normalized ATAC-seq data from individual staged nc14 wt and sh_zld mutant embryos (average of two samples each) for Opa-only (B), Zld and Opa overlap (C) and Zld-only (D). (E–H) Aggregated signals (E) and heatmaps (F–H) of normalized ATAC-seq data from individual staged nc13 wt and sh_zld mutant embryos (average of two samples each) for Opa-only (F), Zld and Opa overlap (G) and Zld-only (H).
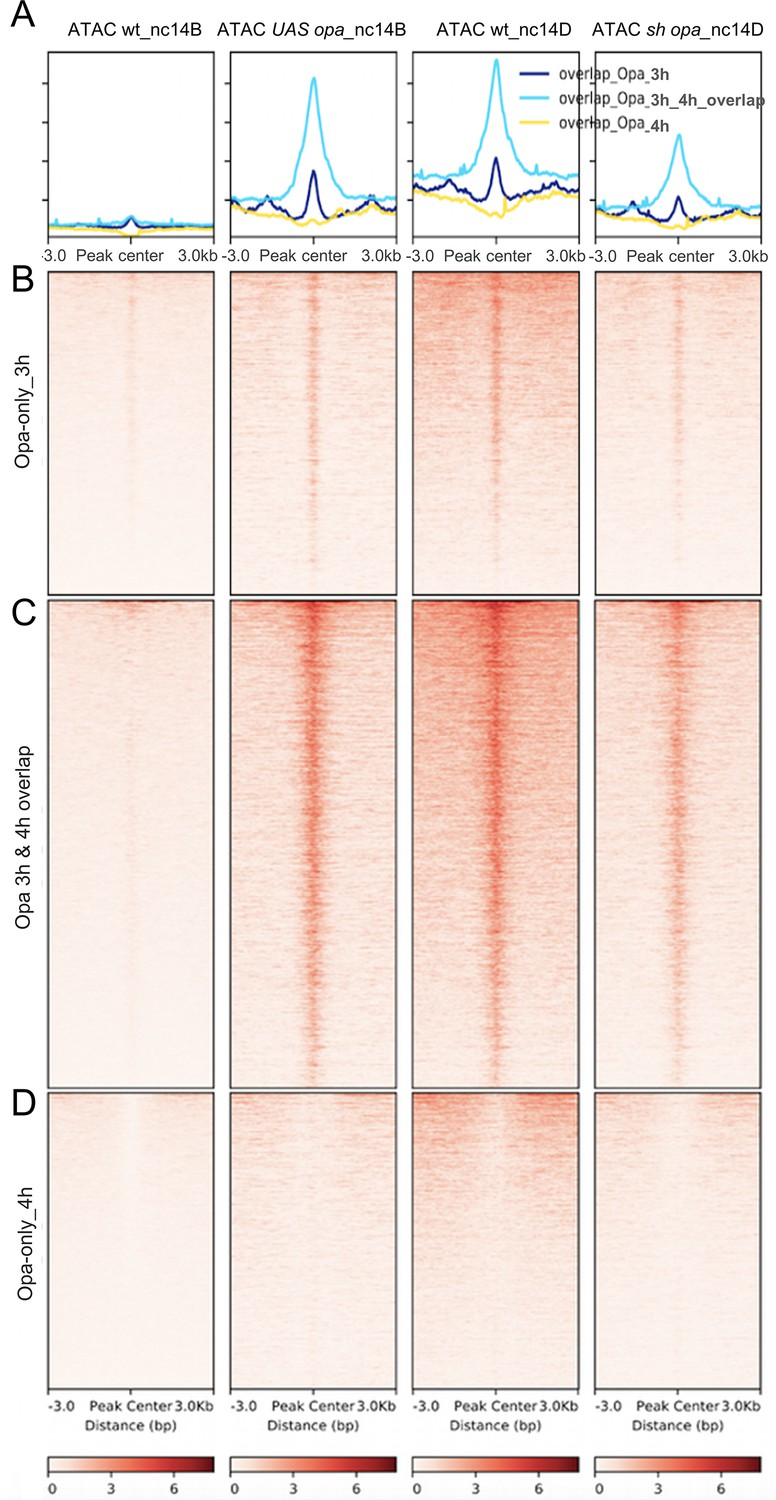
Figure 6 with 1 supplement
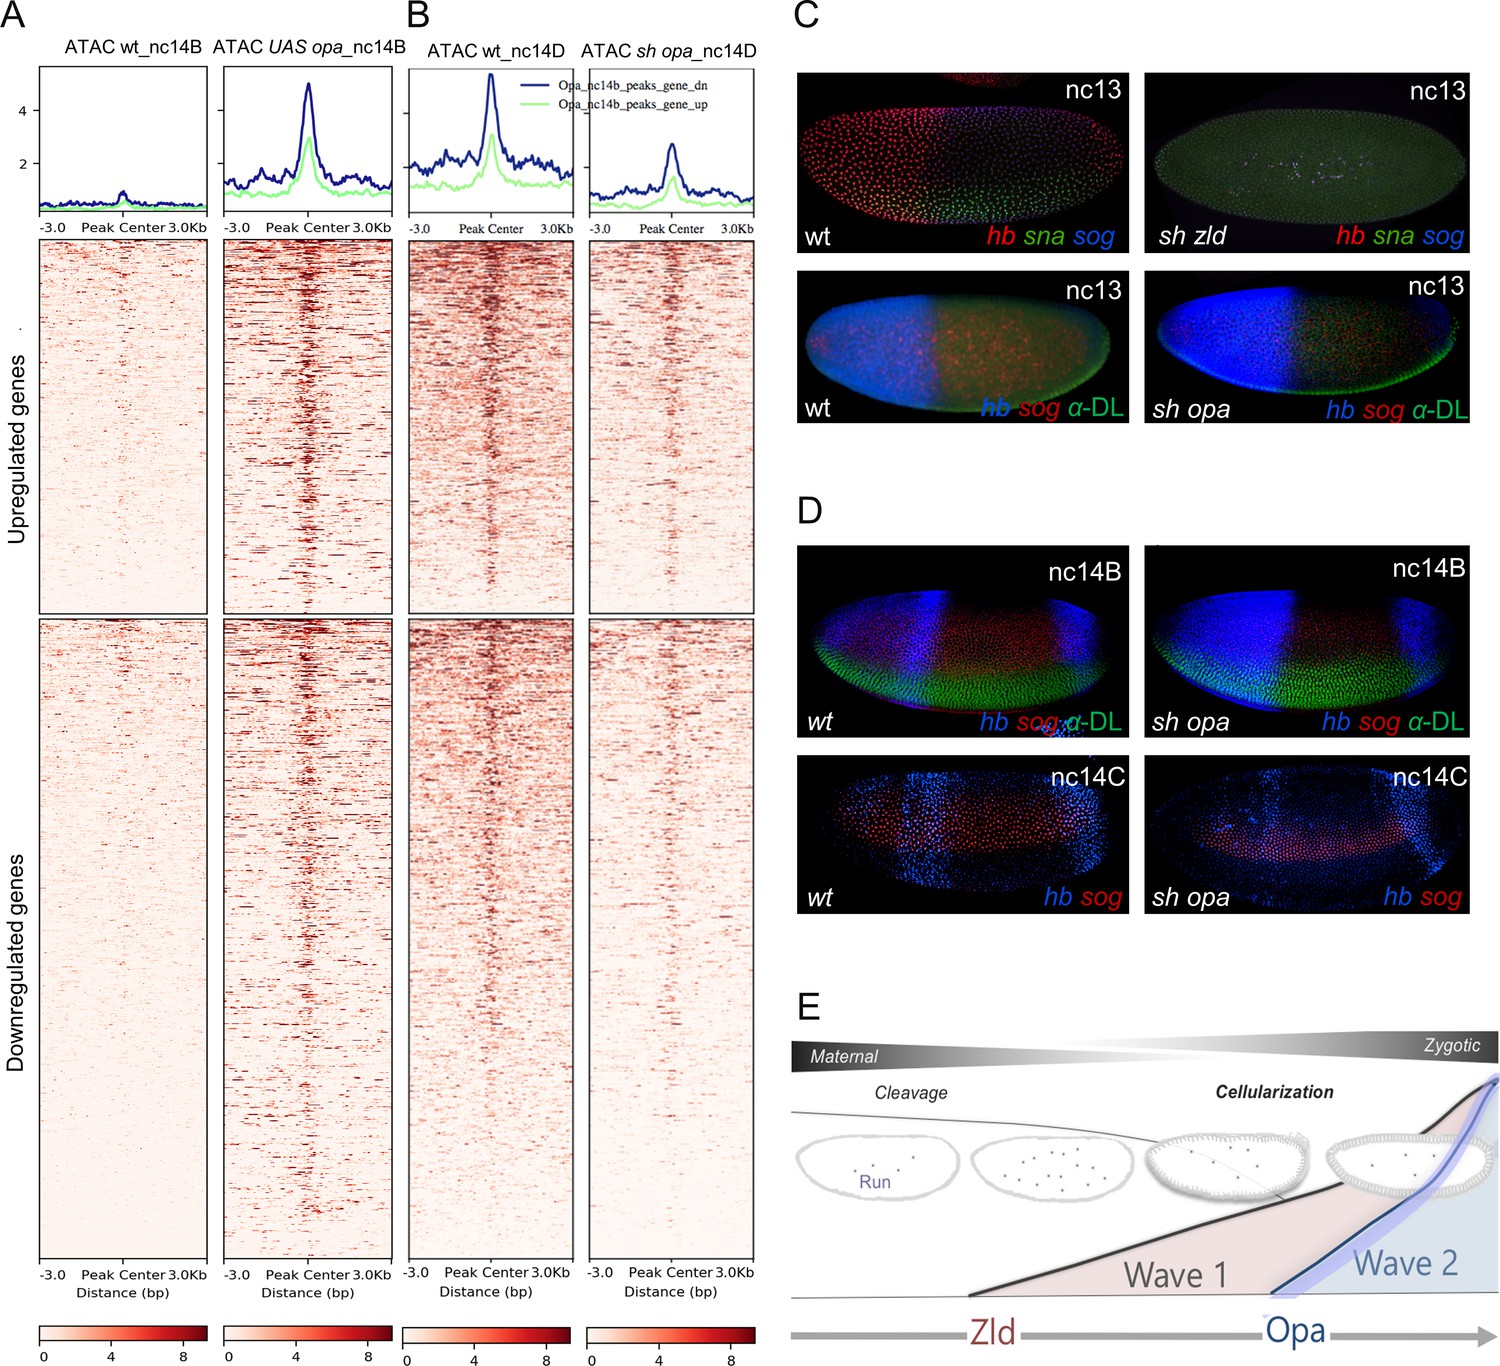
Opa is a late-acting, pioneer factor whose action follows Zelda to drive a second wave of zygotic gene expression.
(A, B) Aggregated signals and heatmaps of nc14B normalized ATAC-seq signal from wt and UAS-opa, as well as nc14D wt and opa RNAi (sh_opa) mutant embryos for downregulated (blue trace) and upregulated target genes as identified by RNA-seq (green trace). Each row of the heatmap is a genomic region, centered to peaks of accessibility signals. The accessibility is summarized with a color code key representative of no accessibility (white) to maximum accessibility (red). Plot at the top of the heatmap shows the mean signal at genomic regions centered to peaks of accessibility signals (A). (C, D) In situ hybridization using riboprobes to hb, sna, and/or sog, as well as anti-Dorsal staining (where noted to highlight ventral regions) of wt and sh_opa embryos at indicated stages (n = 5 per genotype). (E) Schematic illustrating a model supported by our results, which is that Opa, a general timing factor and likely a late-acting pioneer factor, drives a secondary wave of zygotic gene expression, following and coordinating with Zelda, to support the maternal-to-zygotic transition.
Figure 6—figure supplement 1
Opa changes in chromatin accessibility in opa overexpression and opa shRNAi embryos in regions identified by Opa (3 hr) and/or (4 hr) ChIP-seq time points.
(A–D) Aggregated signals (A) and heatmaps of normalized pair-end ATAC-seq data from nc14B wt and UAS-opa, as well as nc14D wt and sh_opa mutant embryos for ChIP-seq Opa-only (3 hr) (B), Opa-only (4 hr; D) compared to peaks in common between Opa-early (3 hr) and Opa-late (4 hr) peaks (C). Each line of the heatmap is a genomic region. The accessibility is summarized with a color code from white (no accessibility) to red (maximum accessibility).
Videos
Video 1
Visualization of sogD_ΔOpa transcriptional activities in a representative early embryo from nc12 to gastrulation using MS2-MCP in vivo imaging.
Expression normally extends until gastrulation for the wildtype reporter (Koromila and Stathopoulos, 2019) but upon mutation of five Opa-binding sites expression is extinguished by nc14C. Stills from the movie are shown in Figure 1C.
Tables
Key resources table
| Reagent type (species) or resource | Designation | Source or reference | Identifiers | Additional information |
|---|---|---|---|---|
| Recombinant DNA reagent | eve2 promoter-MS2.yellow-attB | Bothma et al., 2014 | N/A | |
| Recombinant DNA reagent | sogD_ΔOpa eve2 promoter-MS2.yellow-attB | This study | TK61_DNA | |
| Recombinant DNA reagent | sogD_ΔOpa4 eve2 promoter-MS2.yellow-attB | This study | TK62_DNA | |
| Recombinant DNA reagent | sog_Distal_ eve2 promoter-MS2.yellow-attB | Koromila and Stathopoulos, 2019 | TK54_DNA | |
| Antibody | anti-Opa (Rabbit polyclonal) | Mendoza-García et al., 2017 | E990 | IF: 1:200 |
| Antibody | anti-Opa (Rabbit polyclonal) | This study | E992 | IF: 1:200 |
| Antibody | anti-Zelda (Rabbit polyclonal) | This study | N/A | |
| Genetic reagent (D. melanogaster) | ZH-attP-86Fb | Bloomington Drosophila Stock Center (BDSC) | BDSC:23648; FLYB:FBti0076525; RRID:BDSC_23648 | |
| Genetic reagent (D. melanogaster) | sog_Distal | Koromila and Stathopoulos, 2019 | TK54 | Transgenic insertion into 86Fb attP |
| Genetic reagent (D. melanogaster) | sogD_ΔRun | Koromila and Stathopoulos, 2019 | TK56 | Transgenic insertion into 86Fb attP |
| Genetic reagent (D. melanogaster) | sogD_ΔOpa4 | This study | TK62 | Transgenic insertion into 86Fb attP |
| Genetic reagent (D. melanogaster) | sogD_ΔOpa | This study | TK61 | Transgenic insertion into 86Fb attP |
| Genetic reagent (D. melanogaster) | yw;Nucleoporin- RFP;MCP-NoNLS-GFP | Lucas et al., 2013 and Koromila and Stathopoulos, 2019 | TK59 | |
| Genetic reagent (D. melanogaster) | UAS-shRNA-opa | BDSC | BDSC:34706: FLYB:FBal0175559: RRID:BDSC_34706 | |
| Genetic reagent (D. melanogaster) | MTD-Gal4 | BDSC | BDSC:31777; FLYB:FBtp0001612; RRID:BDSC_31777 | FlyBase symbol: P{GAL4-nos.NGT} |
| Genetic reagent (D. melanogaster) | opa1 | BDSC | BDSC:3312; FLYB:FBst0305629;RRID:BDSC_3312 | |
| Software, algorithm | JASPAR | Khan et al., 2018 | http://jaspar.binf.ku.dk/cgi-bin/jaspar_db.pl?rm=browse and db = core and tax_group = insects | |
| Software, algorithm | Imaris 9.0 | N/A | ||
| Software, algorithm | Fiji | Schindelin et al., 2012 | N/A | |
| Software, algorithm | Bowtie2 | Langmead and Salzberg, 2012 | ||
| Software, algorithm | MACS2 | Zhang et al., 2008 | ||
| Other | Halocarbon 27 oil | Sigma-Aldrich | MKBJ5699 |
Additional files
Download links
A two-part list of links to download the article, or parts of the article, in various formats.
Downloads (link to download the article as PDF)
Open citations (links to open the citations from this article in various online reference manager services)
Cite this article (links to download the citations from this article in formats compatible with various reference manager tools)
Odd-paired is a pioneer-like factor that coordinates with Zelda to control gene expression in embryos
eLife 9:e59610.
https://doi.org/10.7554/eLife.59610


