Dynamically evolving novel overlapping gene as a factor in the SARS-CoV-2 pandemic
- Biodiversity Research Center, Academia Sinica, Taiwan
- Institute for Comparative Genomics, American Museum of Natural History, United States
- Chair for Microbial Ecology, Technical University of Munich, Germany
- Department of Pathobiological Sciences, University of Wisconsin-Madison, United States
- Global Health Institute, University of Wisconsin-Madison, United States
- Bavarian Center for Biomolecular Mass Spectrometry (BayBioMS), Technical University of Munich, Germany
- Department of Epidemiology and Biostatistics, School of Public Health, SUNY Downstate Health Sciences University, United States
- Institute for Genomic Health, SUNY Downstate Health Sciences University, United States
- Division of Infectious Diseases, Department of Medicine, SUNY Downstate Health Sciences University, United States
- Departments of Integrative Biology and Statistics, University of California, Berkeley, United States
- Departments of Computer Science, Human Genetics, and Computational Medicine, University of California, Los Angeles, United States
Figures
Figure 1 with 1 supplement
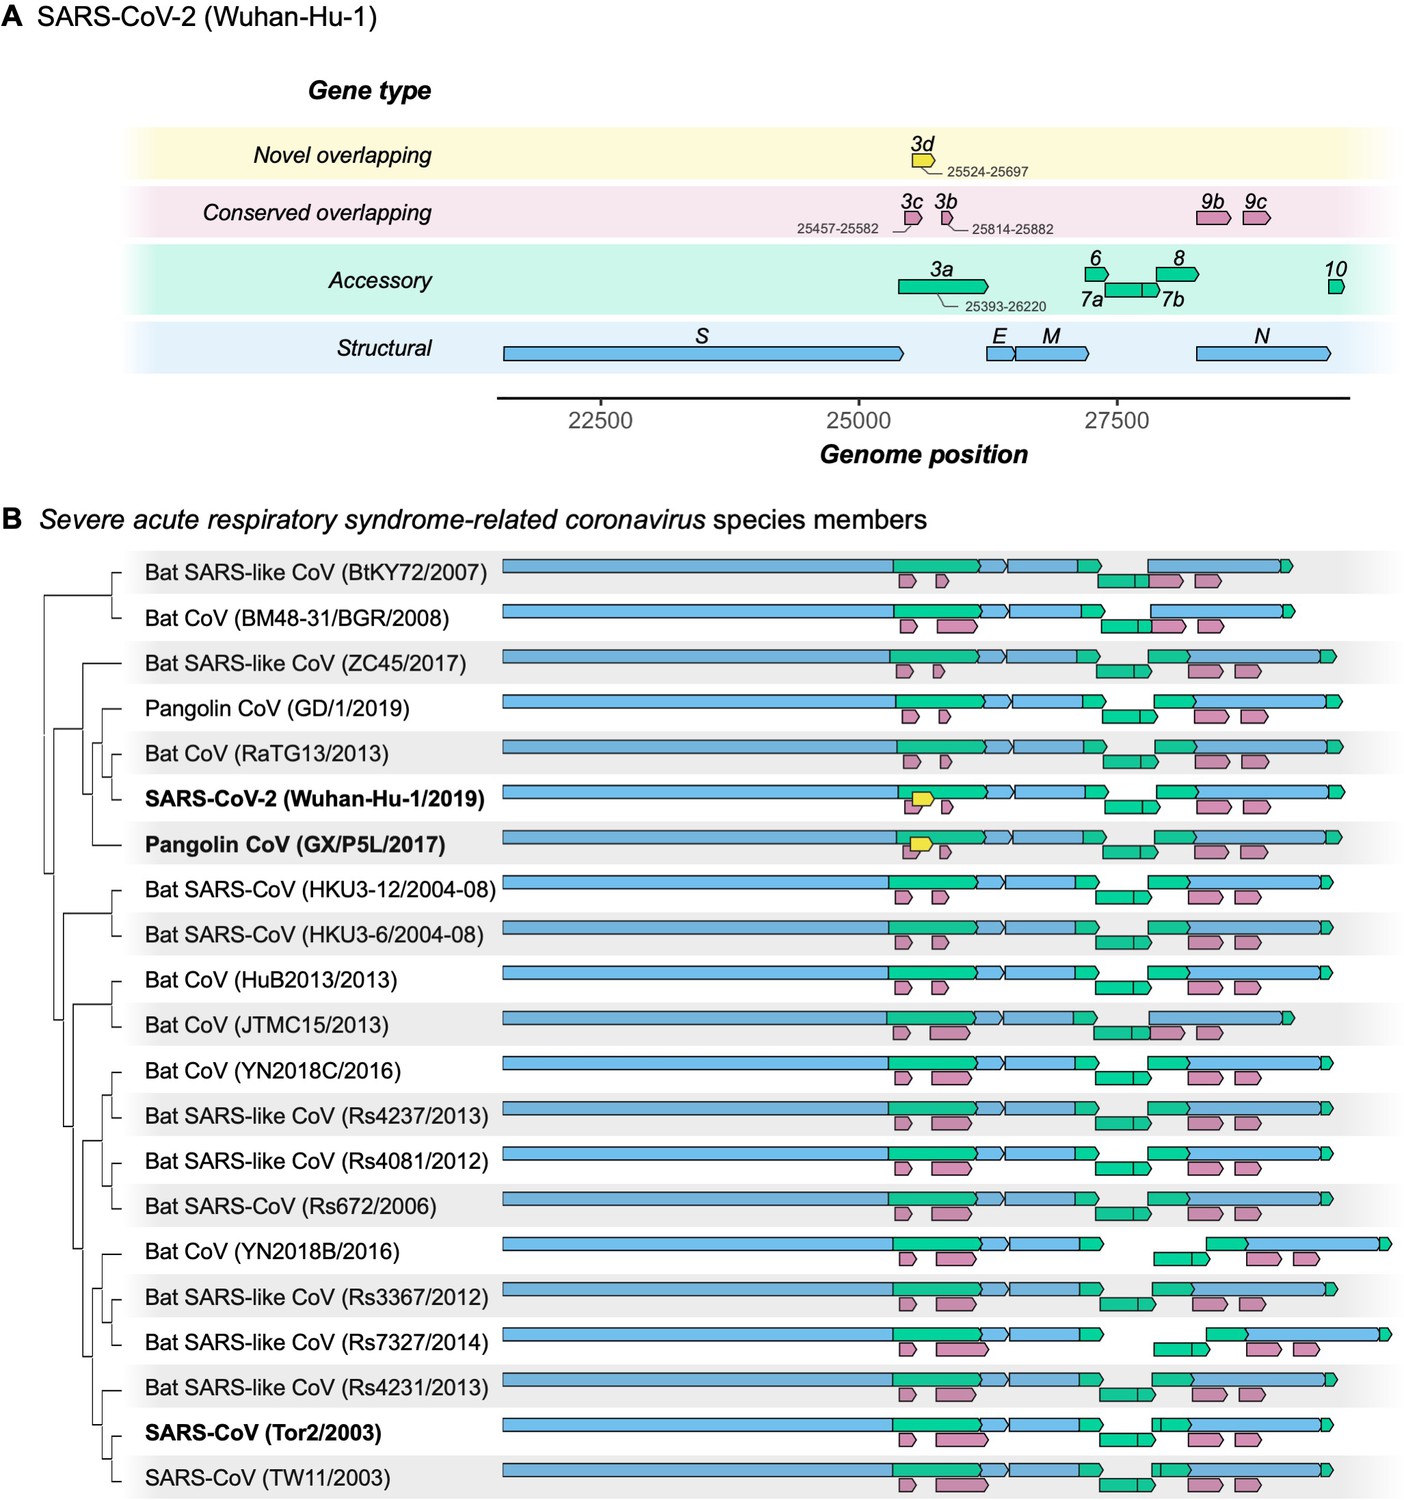
Gene repertoire and evolutionary relationships of Severe acute respiratory syndrome-related coronavirus species members.
Only genes downstream of ORF1ab are shown, beginning with the Spike gene S. (A) Four types of genes and their relative positions in the SARS-CoV-2 Wuhan-Hu-1 genome (NCBI: NC_045512.2). Genes are colored by type: novel overlapping genes (OLGs) (gold; ORF3d only); conserved OLGs (burgundy); accessory (green); and structural (blue). Note that ORF3b has been truncated relative to SARS-CoV genomes, whereas ORF8 remains intact (i.e. has not been split into ORF8a and ORF8b). (B) Genes with intact ORFs in each of 21 Severe acute respiratory syndrome-related coronavirus genomes. Gene positions are shown relative to each genome, i.e. homologous genes are not precisely aligned. Only the full-length isoforms of ORF3a and ORF3d are shown (for shorter isoforms, see Table 1). Note that the first 20 codons of ORF3d overlap the last codons of ORF3c (Supplementary file 1), such that the beginning of ORF3d involves a triple overlap (ORF3a/ORF3c/ORF3d). ORF3b is full-length in only three sequences (SARS-CoV TW11, SARS-CoV Tor2, and bat-CoV Rs7327), while the remaining sequences have premature STOP codons (Supplementary file 1). ORF8 is not novel in SARS-CoV-2 (contra Chan et al., 2020), but is intact in all but five sequences (split into ORF8a and ORF8b in SARS-CoVs TW11 and Tor2; deleted in bat-CoVs BtKY72, BM48-31, and JTMC15). ORF9b and ORF9c are found throughout this virus species, yet rarely annotated in genomes at NCBI.
-
Figure 1—source data 1
SARS-related-CoV_ALN.fasta.
Whole-genome multiple sequence alignment of 21 genomes of the species Severe acute respiratory syndrome-related coronavirus. Note that the pangolin-CoV GD/1 sequence has been masked as N (license constraint), but can be acquired with GISAID registration.
- https://cdn.elifesciences.org/articles/59633/elife-59633-fig1-data1-v2.fasta.txt
-
Figure 1—source data 2
SARS-related-CoV_ALN.gtf.txt.
Gene Transfer Format (GTF) file giving gene positions within SARS-related-CoV_ALN.fasta. Genes were extracted and gaps removed from each sequence before displaying.
- https://cdn.elifesciences.org/articles/59633/elife-59633-fig1-data2-v2.gtf.txt
Figure 1—figure supplement 1
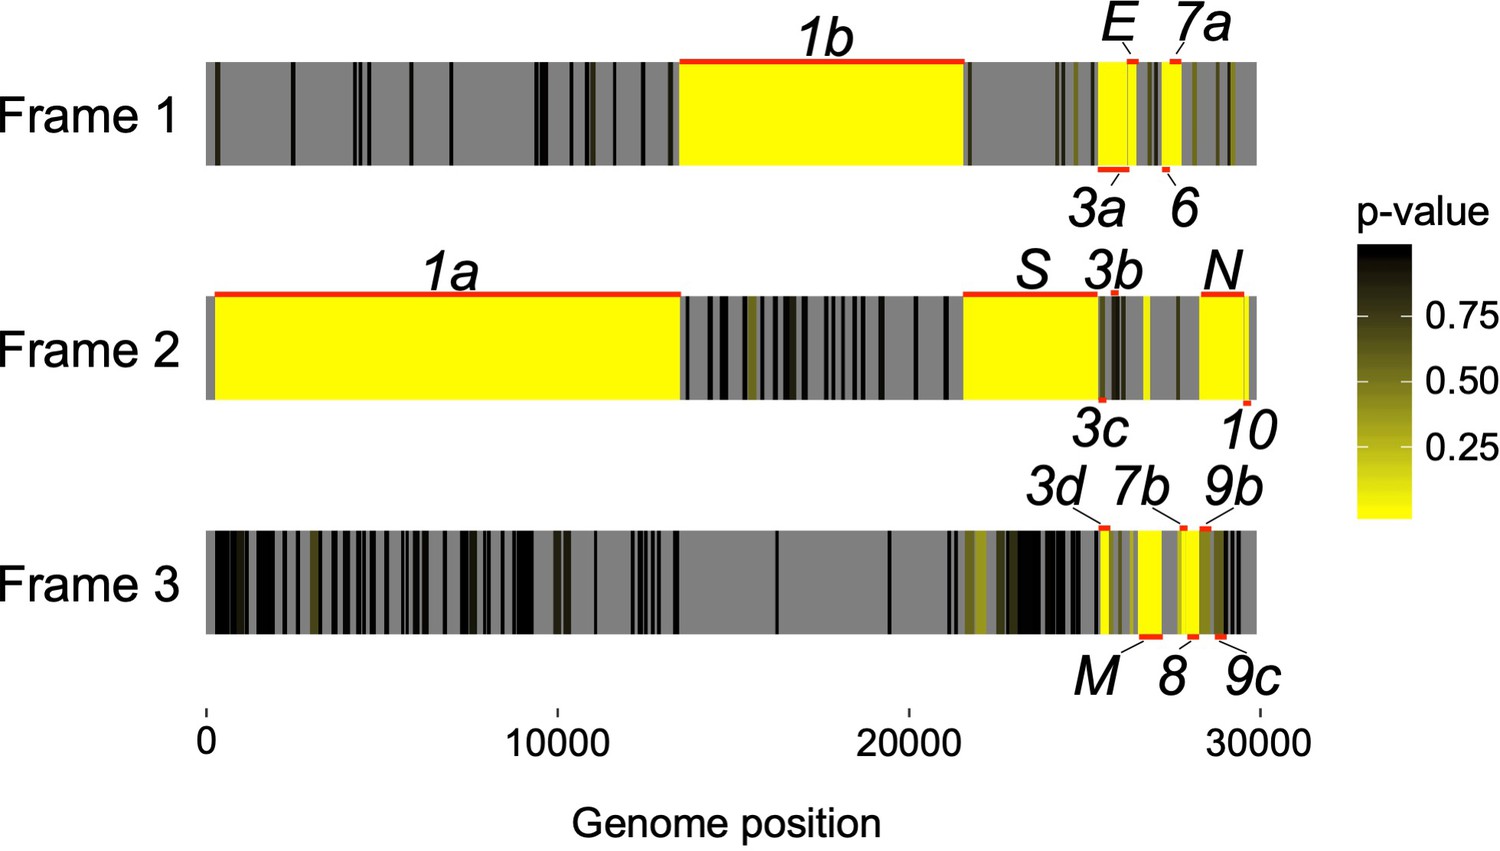
Codon permutation analysis to identify candidate overlapping genes in all three forward-strand reading frames of the SARS-CoV-2 genome.
Genome positions of known and hypothesized genes are indicated with horizontal red lines. Reading frames 1, 2, and 3 begin at positions 1, 2, or 3 of the Wuhan-Hu-1 reference genome, respectively, with genome coordinates shown at the bottom (Supplementary file 1). Yellow indicates low p-values (natural logarithm scale), while gray indicates absence of a STOP-to-STOP ORF longer than 30 codons or presence outside of an annotated non-overlapping gene (not tested). Note that low p-values are expected for the non-overlapping genes. Only the first of four SARS-CoV-2 ORFs homologous to ORF3b is shown (Figure 4; Supplementary file 1).
Figure 2 with 9 supplements
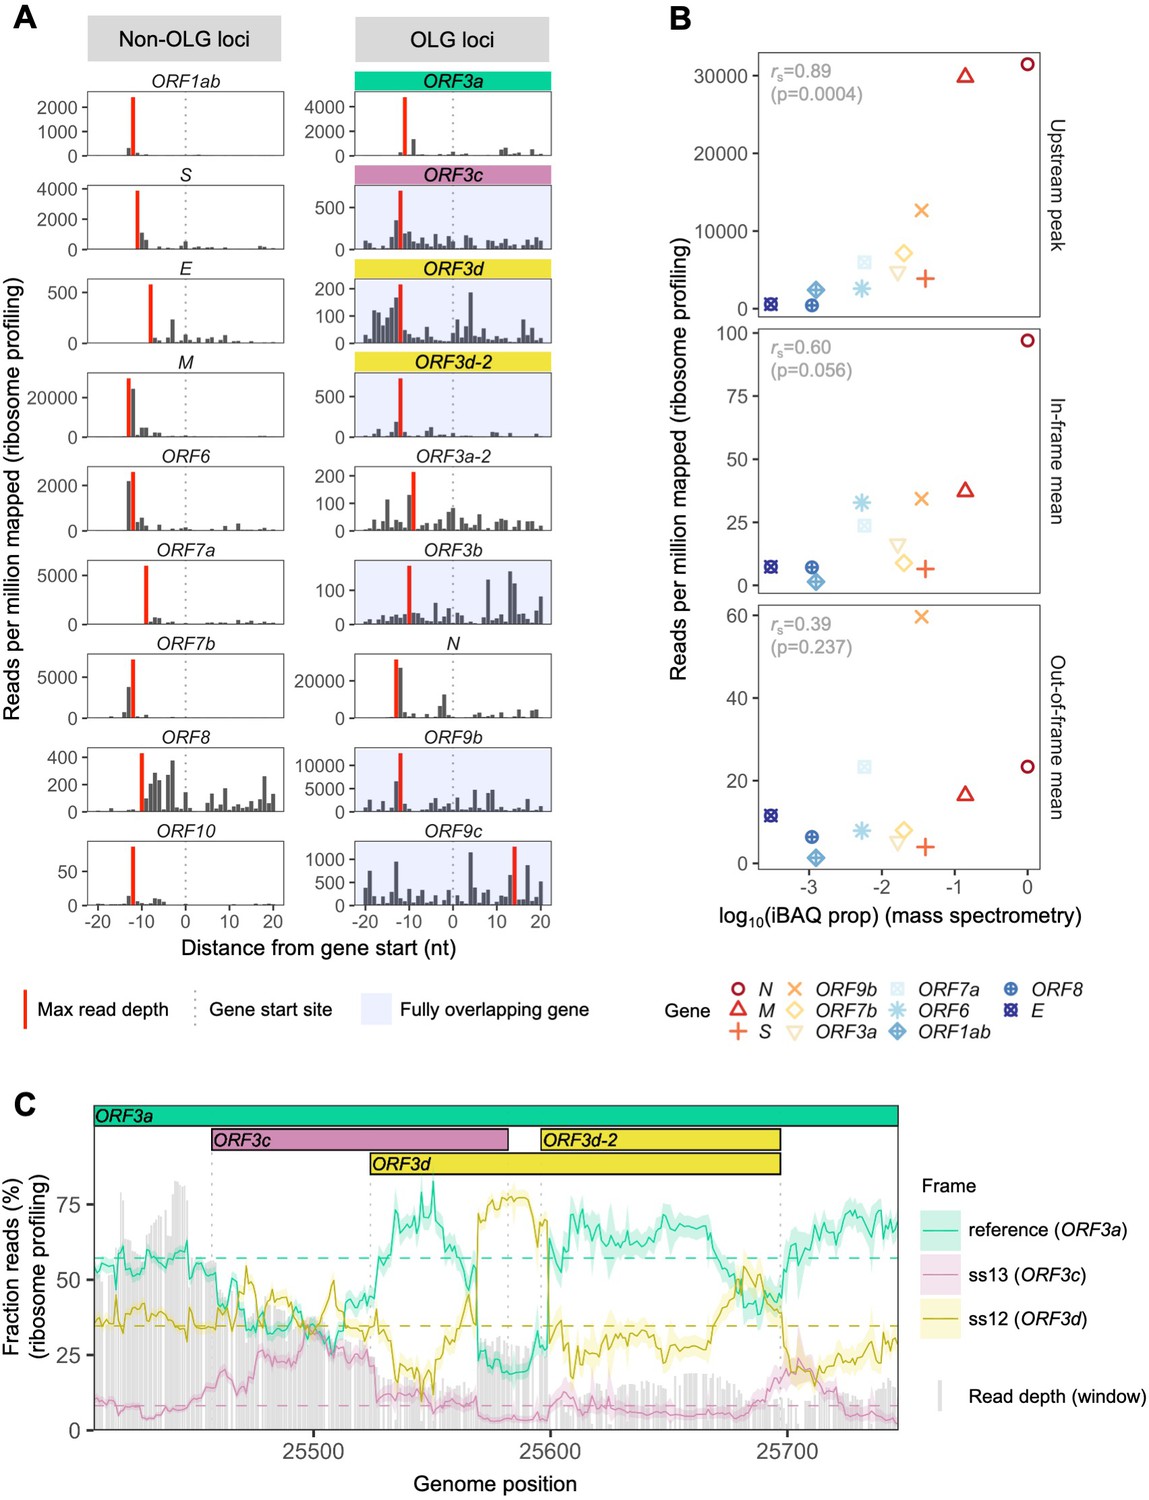
SARS-CoV-2 gene expression in ribosome profiling and mass spectrometry datasets.
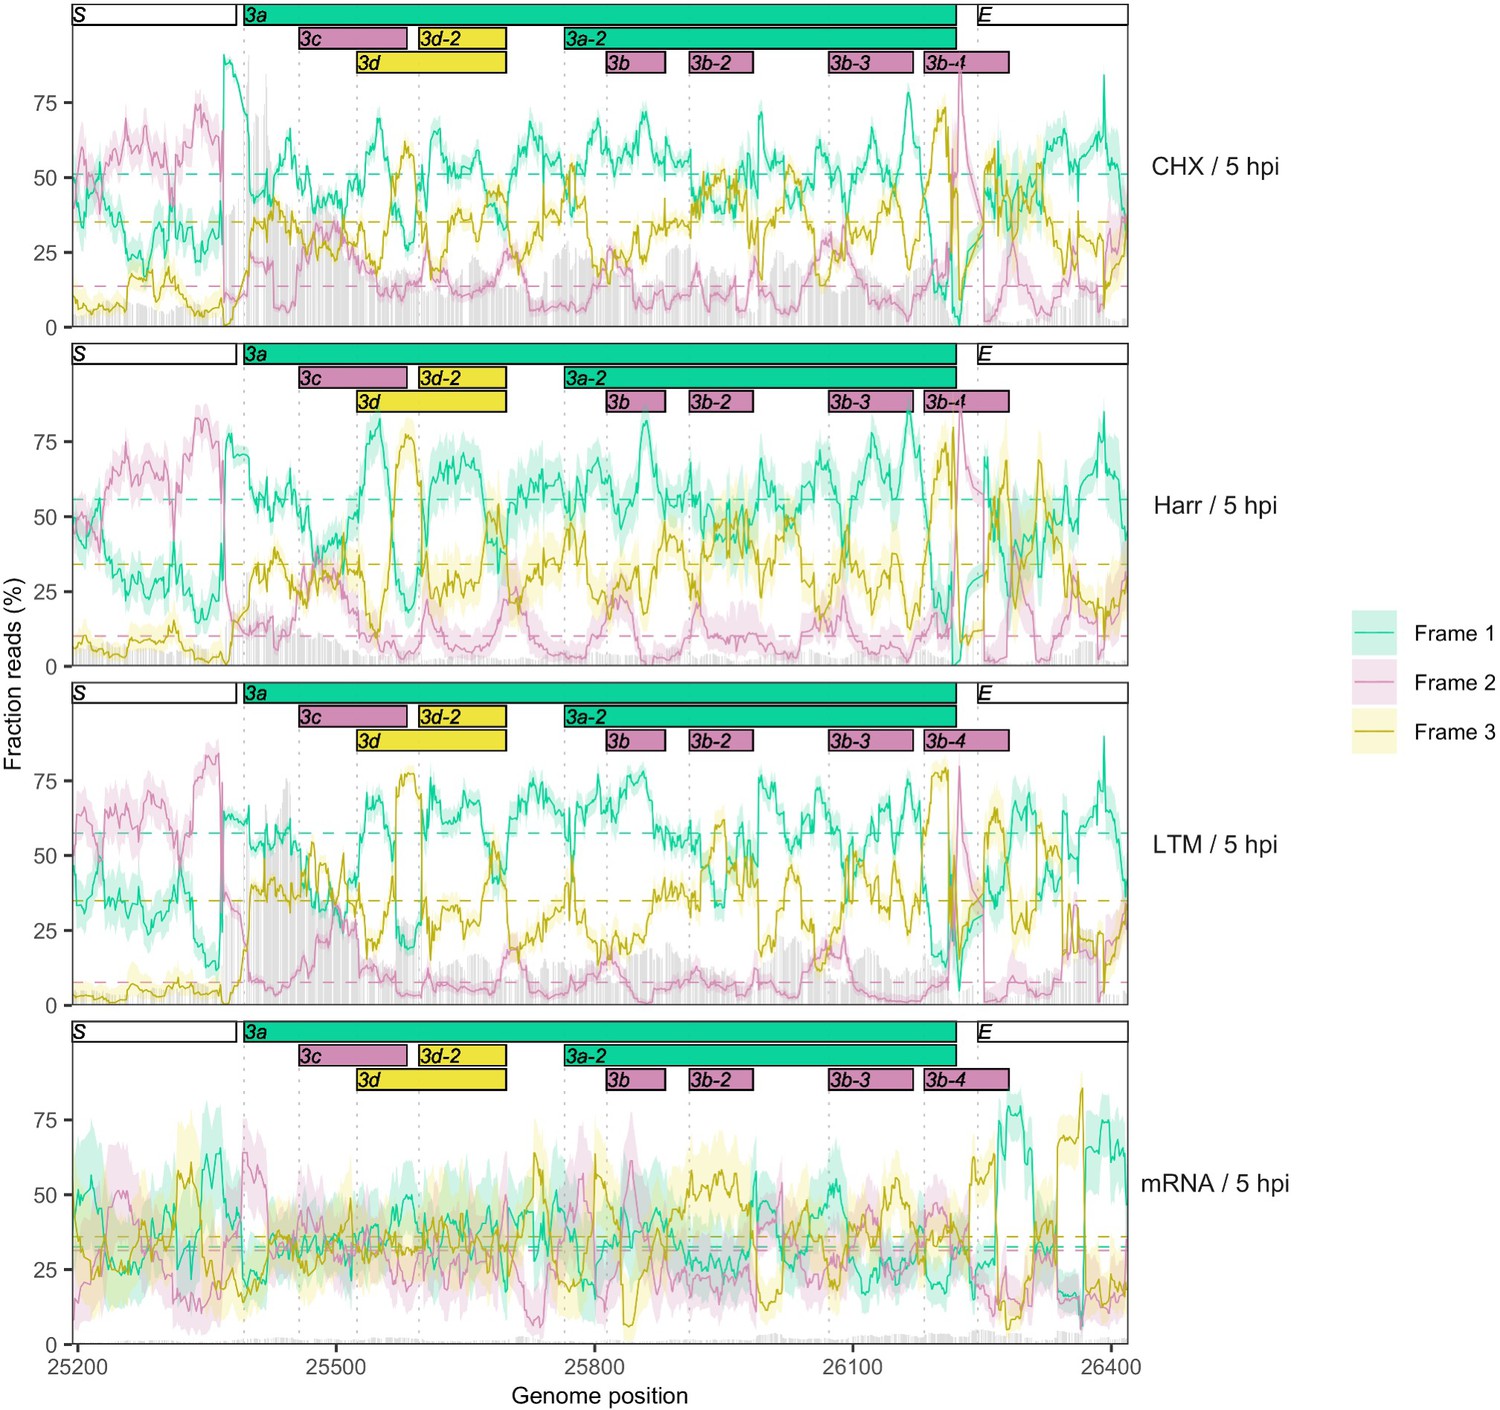
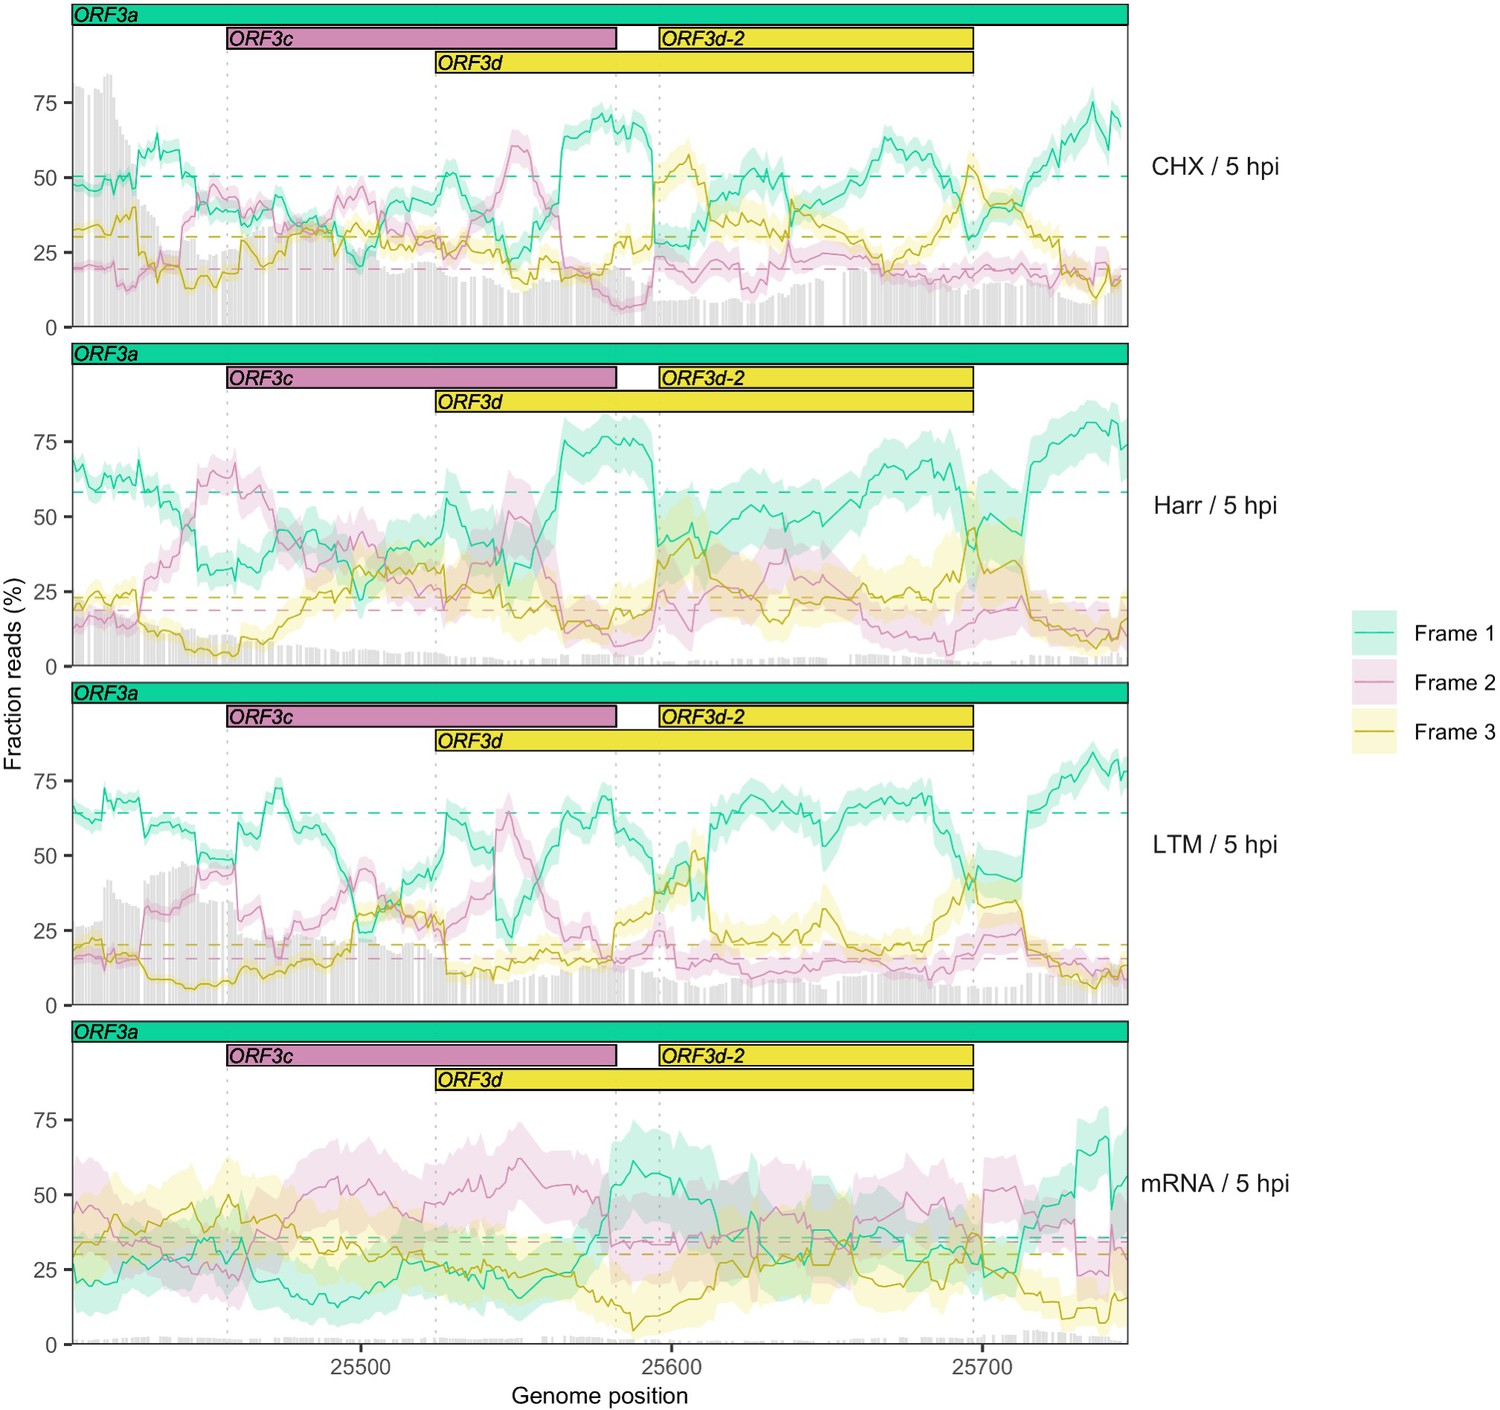
Ribosome profiling (Ribo-seq) data were obtained from Finkel et al., 2020; mass spectrometry data were obtained from Davidson et al., 2020 and Bezstarosti et al., 2020. Reads were trimmed to their first (5′) nucleotide to minimize statistical dependence while preserving reading frame. Results are shown after pooling samples treated with harringtonine (SRR11713360, SRR11713361) or lactimidomycin (SRR11713358, SRR11713359) at 5 hr post-infection. (A) Ribosome profiling coverage (read depth) near translation initiation sites, measured as mean reads per million mapped reads. Only reads of length 29–31 nucleotides were used, chosen for their enrichment at the start sites of highly expressed annotated genes (Figure 2—figure supplement 4). Light blue backgrounds denote fully (internal) overlapping genes. Annotated genes show an accumulation of 5′ ends of protected reads upstream of the gene’s start site (vertical gray dotted lines), peaking near the ribosome P-site offset of −12 nt (red = maximum depth). Distributions are largely consistent across individual samples (Figure 2—figure supplement 1). The ranges of the y-axes vary according to expression level, with the most highly expressed gene (N; Figure 2—figure supplement 2) having the largest range. (B) Correlation between protein expression as estimated by mass spectrometry and ribosomal profiling. ‘iBAQ prop’ refers to the relative (proportion of maximum) protein intensity-based absolute quantification (iBAQ) value (Schwanhäusser et al., 2011). Genes are denoted by shape and ordinally colored by iBAQ prop from high (red) to low (blue). ‘Upstream peak’ refers to the maximum read depth observed at the approximate P-site offset (red bars in A), while mean read depths were measured across each gene using 30 nt reads separately for in-frame (codon position 1) and out-of-frame (codon positions 2 and 3) sites (non-overlapping gene regions only, except for ORF9b). (C) Reading frame of ribosome profiling reads in the ORF3c/ORF3d region of ORF3a. Solid lines show the fraction of reads in each frame, summed across samples in sliding windows of 30 nt (step size = 1 nt; read length = 30 nt). Color denotes frame: green = reference frame (ORF3a); burgundy = ss13, the forward-strand frame encoding ORF3c, whose codon position 3 overlaps codon position 1 of ORF3a; and gold = ss12, the forward-strand frame encoding ORF3d, whose codon position 2 overlaps codon position 1 of ORF3a. Values are shown for the central nucleotide of each window, with shaded regions corresponding to 95% binomial confidence intervals. Alternative frame translation is suggested where a given frame (solid line) exceeds its average across the remainder of the gene (horizontal dashed line; non-OLG regions of ORF3a). Vertical gray dotted lines indicate gene start and end sites. Gray bars show read depth for each window, with a maximum of 2889 reads at genome position 25442.
-
Figure 2—source data 1
riboseq_upstream_peaks.txt.
Source data for Figure 2A.
- https://cdn.elifesciences.org/articles/59633/elife-59633-fig2-data1-v2.txt
-
Figure 2—source data 2
expression_data_by_gene_frame.txt.
Source data for Figure 2B.
- https://cdn.elifesciences.org/articles/59633/elife-59633-fig2-data2-v2.txt
-
Figure 2—source data 3
riboseq_ORF3d_sliding_window.txt.
Source data for Figure 2C.
- https://cdn.elifesciences.org/articles/59633/elife-59633-fig2-data3-v2.txt
Figure 2—figure supplement 1
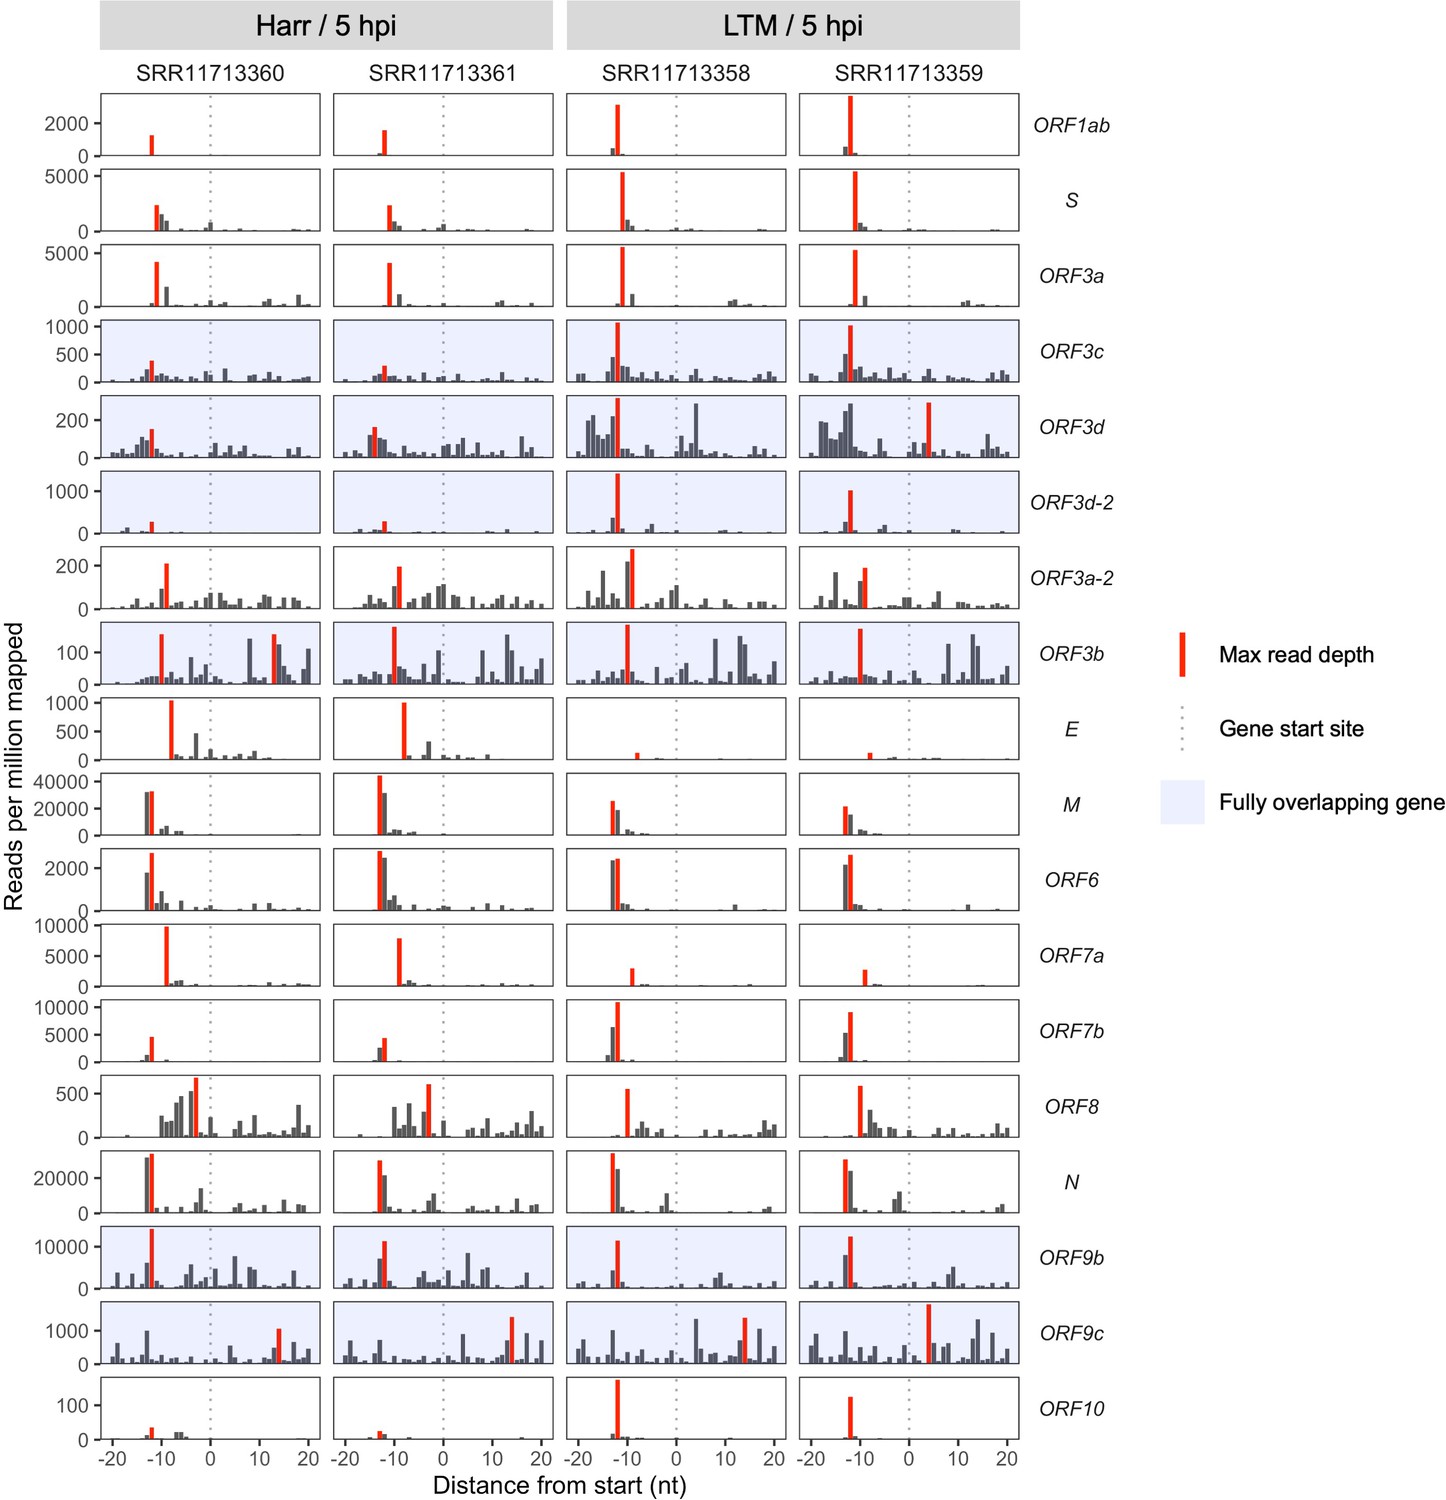
Ribosome profiling coverage near translation initiation sites for individual samples.
Details as in Figure 2A, except samples were not pooled and genes are arranged vertically by start site in the genome from 5′ to 3′ (top to bottom). Treatments are indicated as Harr = harringtonine and LTM = lactimidomycin at 5 hr post-infection (hpi).
Figure 2—figure supplement 2

Correlation between protein expression as estimated by mass spectrometry and ribosomal profiling, for individual treatments and codon positions.
Details as in Figure 2B, except estimates are shown for all sites in a gene (All frames) and out-of-frame reads are shown separately for codon positions (Codon pos) 2 and 3. ORF9b is a fully (internal) overlapping gene occurring within N, with codon position 3 of ORF9b corresponding to codon position 1 of N (i.e. frame ss13 of N). As a result, codon position 3 of ORF9b is predominantly occupied by ribosomes translating N, the most highly expressed gene, leading to overestimation of ORF9b expression (Codon pos 3; right). Ribosome profiling read depth at codon position 1 exhibits a marginal Spearman’s rank correlation with mass spectrometry for cycloheximide (CHX), harringtonine (Harr), and lactimidomycin (LTM) treatments; however, as expected, all correlations for RNA-seq (mRNA), as well as reads mapping to other codon positions, were not significant.
Figure 2—figure supplement 3

Reading frames occupied by the 5′ ends of ribosome profiling reads as a function of read length.
Processed, aligned reads from Finkel et al., 2020 were trimmed to their 5′ ends (first nt). Fractions of reads mapping to each codon position (x-axis) are shown as a function of read length (y-axis; 26–32 nt) after pooling samples according to treatment (CHX = cycloheximide, Harr = harringtonine, LTM = lactimidomycin, mRNA = RNA seq) and time (hours post-infection; hpi). Codon position is defined relative to gene start sites of annotated non-overlapping genes, excluding any overlapping gene regions. Gray bars show relative total counts for reads of different lengths, with different scales for 5 hpi (lower coverage; max = 284,608 reads at CHX/30nt) and 24 hpi (higher coverage; max = 3,149,251 reads at Harr/29nt). At 5 hpi, reads of length 29 and 30 nt tend to have 5′ ends mapping to the correct protein-coding reading frame (codon position 1) of the gene in which they occur, and also tend to be most abundant, as expected given the size of ribosome-protected fragments (~30 nt). Samples from 24 hpi have flatter (left-shifted) read length distributions and no clear frame signal. The horizontal dashed gray line corresponds to the expectation for RNA fragments not protected by ribosomes, that is 33% of reads mapping to each codon position (random).
Figure 2—figure supplement 4
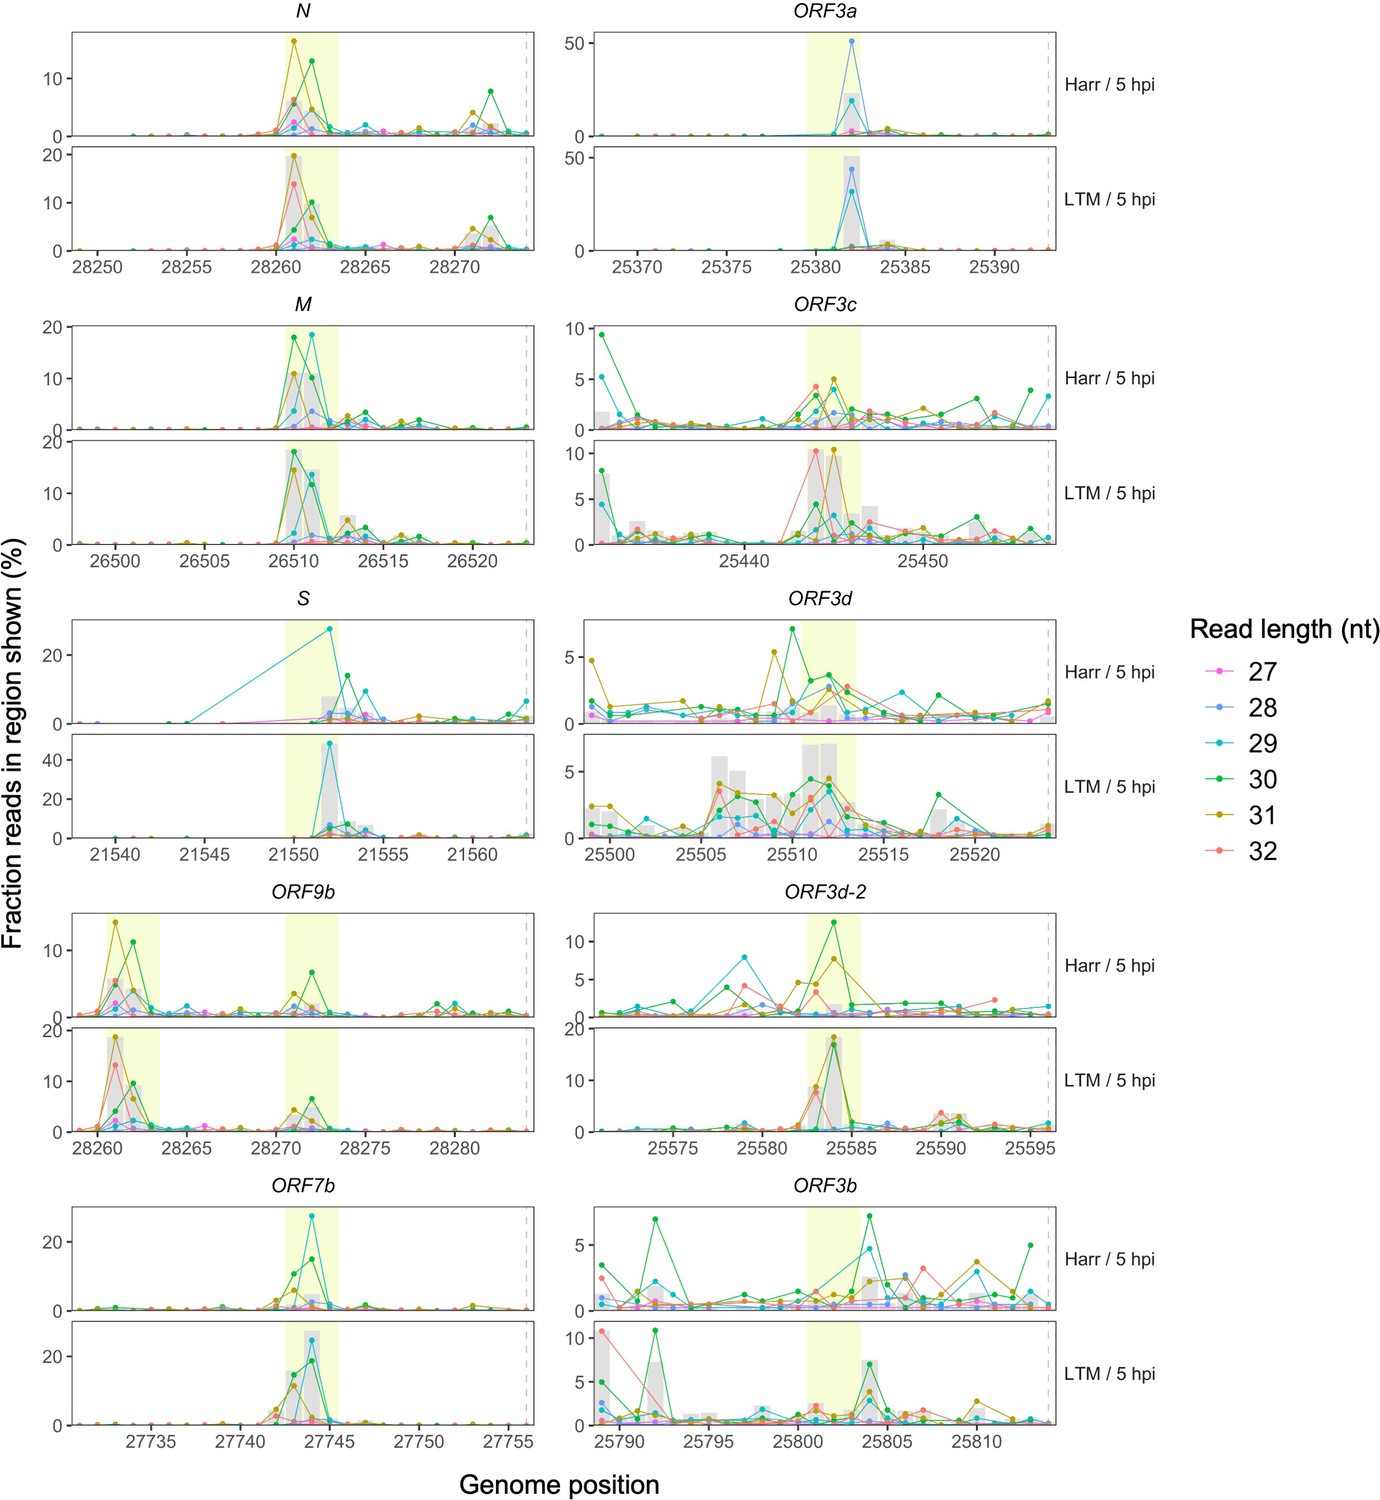
Ribosome profiling read accumulation at gene start sites as a function of read length.
Points indicate the percentage of all reads in the region shown whose first nucleotides (5′ ends) map to each genome position, colored according to read length. In each case, the longer read lengths have 5′ ends that predominate at approximately −12 nt from the gene start site (horizontal dashed lines, right), corresponding to the ribosome P-site offset (center of yellow highlighted region). A peak in total read depth (gray bars) is also observed at this position, as seen in Figure 2A. Highly expressed non-overlapping (N, M, S, and ORF7b) and overlapping (ORF9b) genes are shown on the left, while ORF3a and its hypothesized overlapping genes are shown on the right. Note that ORF9b begins shortly after N, such that the upstream peak of N occurs at position −22 nt relative to the start site of ORF9b.
Figure 2—figure supplement 5
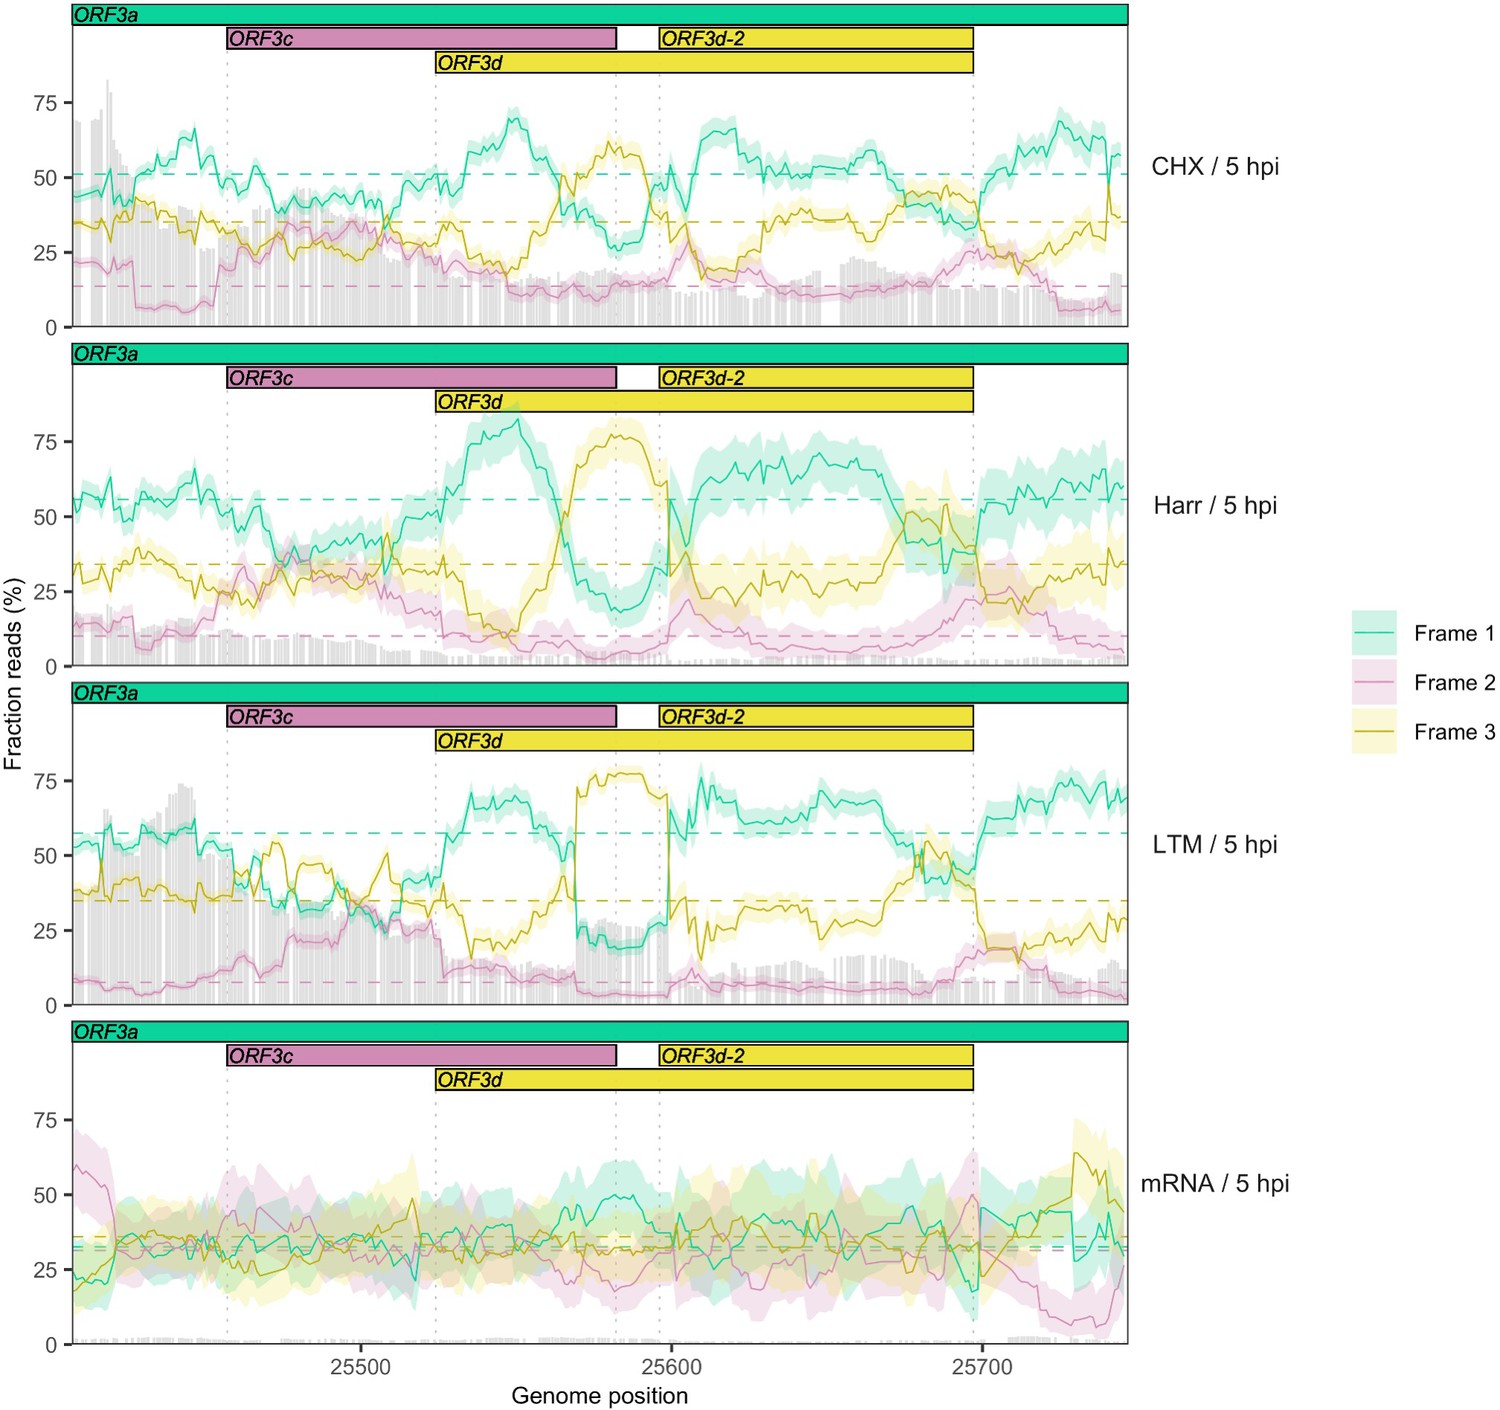
Reading frame of ribosome profiling reads in the ORF3c/ORF3d region of ORF3a for individual treatments.
Details as in Figure 2C, except results are shown separately after pooling the two biological replicates for each treatment (CHX = cycloheximide, Harr = harringtonine, LTM = lactimidomycin, mRNA = RNA seq) (Finkel et al., 2020). Genes and their reading frames are denoted by color according to Figure 1, with Frames 1, 2, and 3 corresponding to the frames beginning at codon positions 1, 2, and 3 of ORF3a, respectively. Clear evidence for translation in the appropriate reading frame is observed for ORF3c (burgundy) and ORF3d/ORF3d-2 (gold). The status of the first half of ORF3d is obscured by the signal of ORF3c, but the increase in Frame 1 (ORF3a) reads and drop in proportion of Frame 2 (ORF3c) reads at the start of ORF3d is suggestive of an otherwise-unexpected biological change at this locus.
Figure 2—figure supplement 6
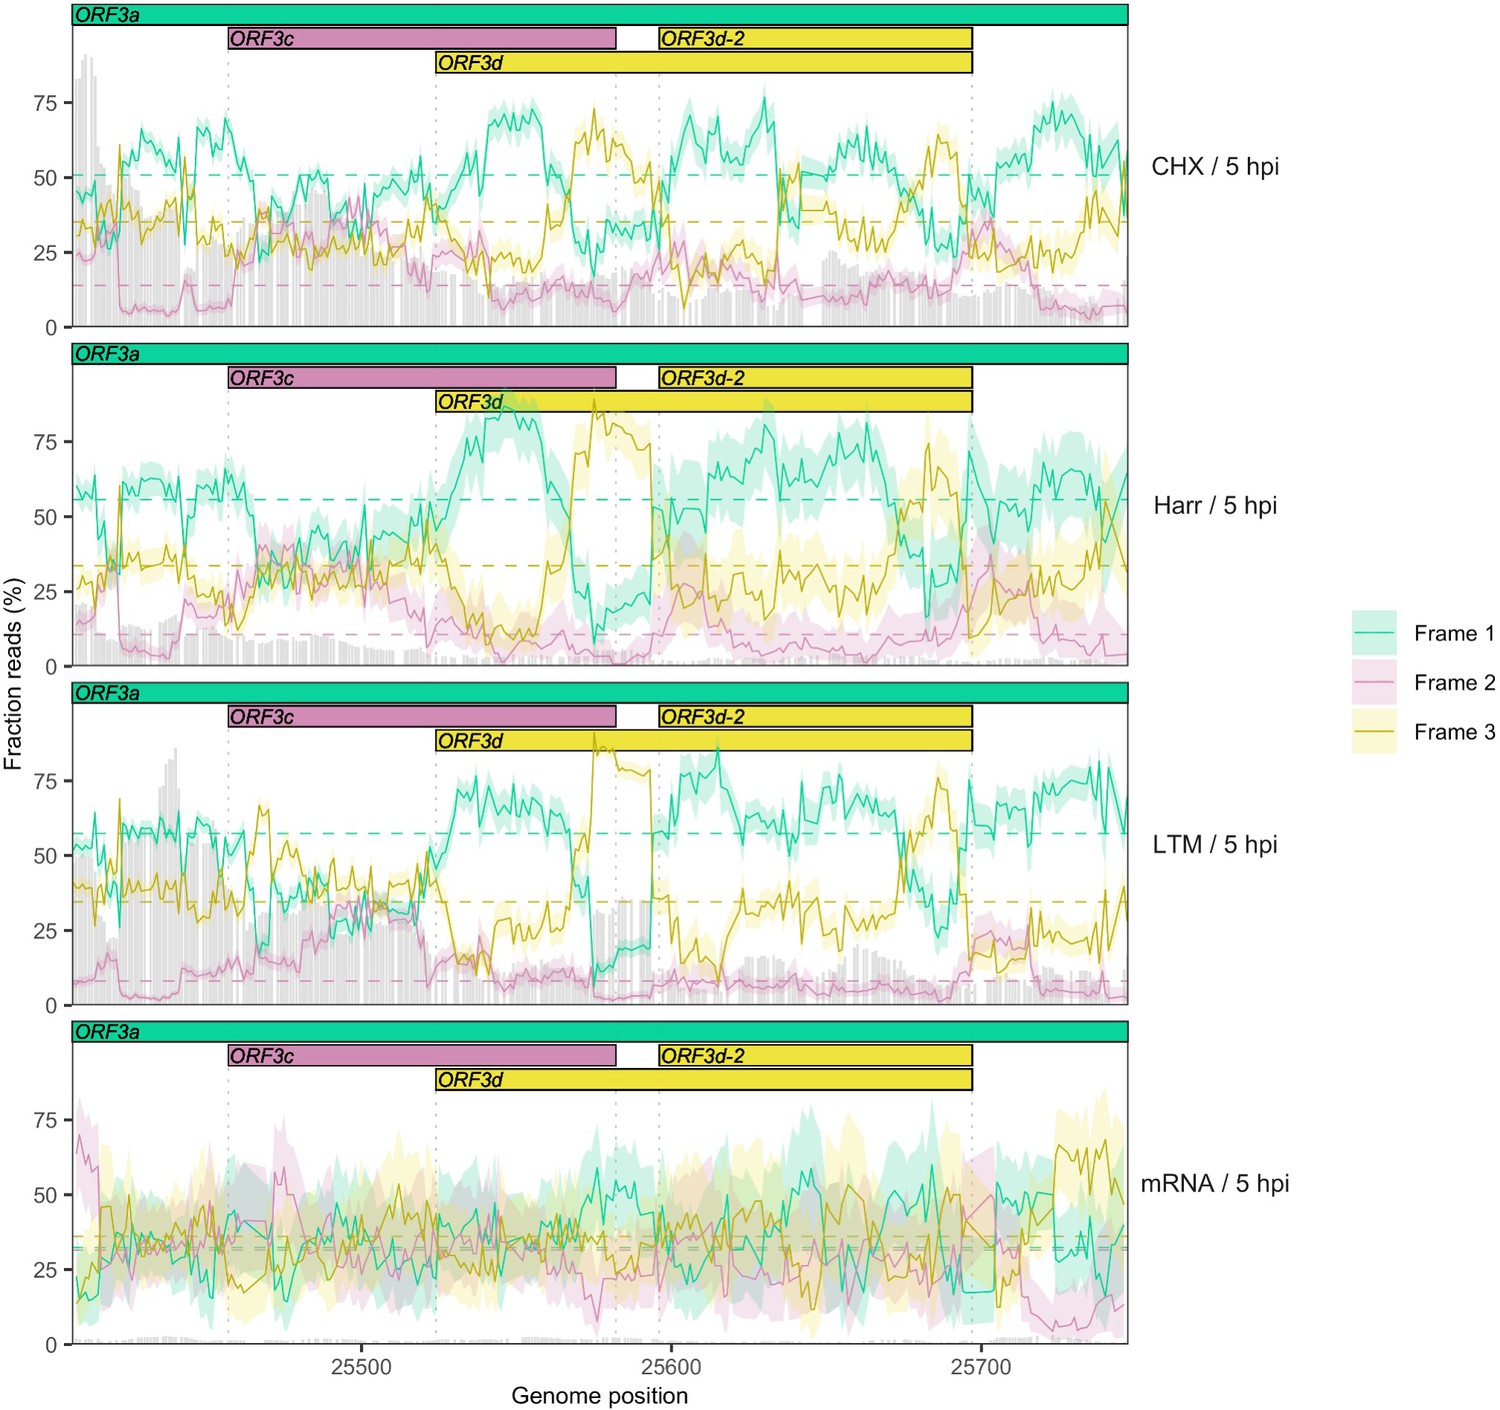
Reading frame of ribosome profiling reads in the ORF3c/ORF3d region of ORF3a for individual treatments using a smaller sliding window size of 19 nt.
Details as in Figure 2C and Figure 2—figure supplement 5, except results are shown for a sliding window size of 19 nt (step size = 1 nt).
Figure 2—figure supplement 7
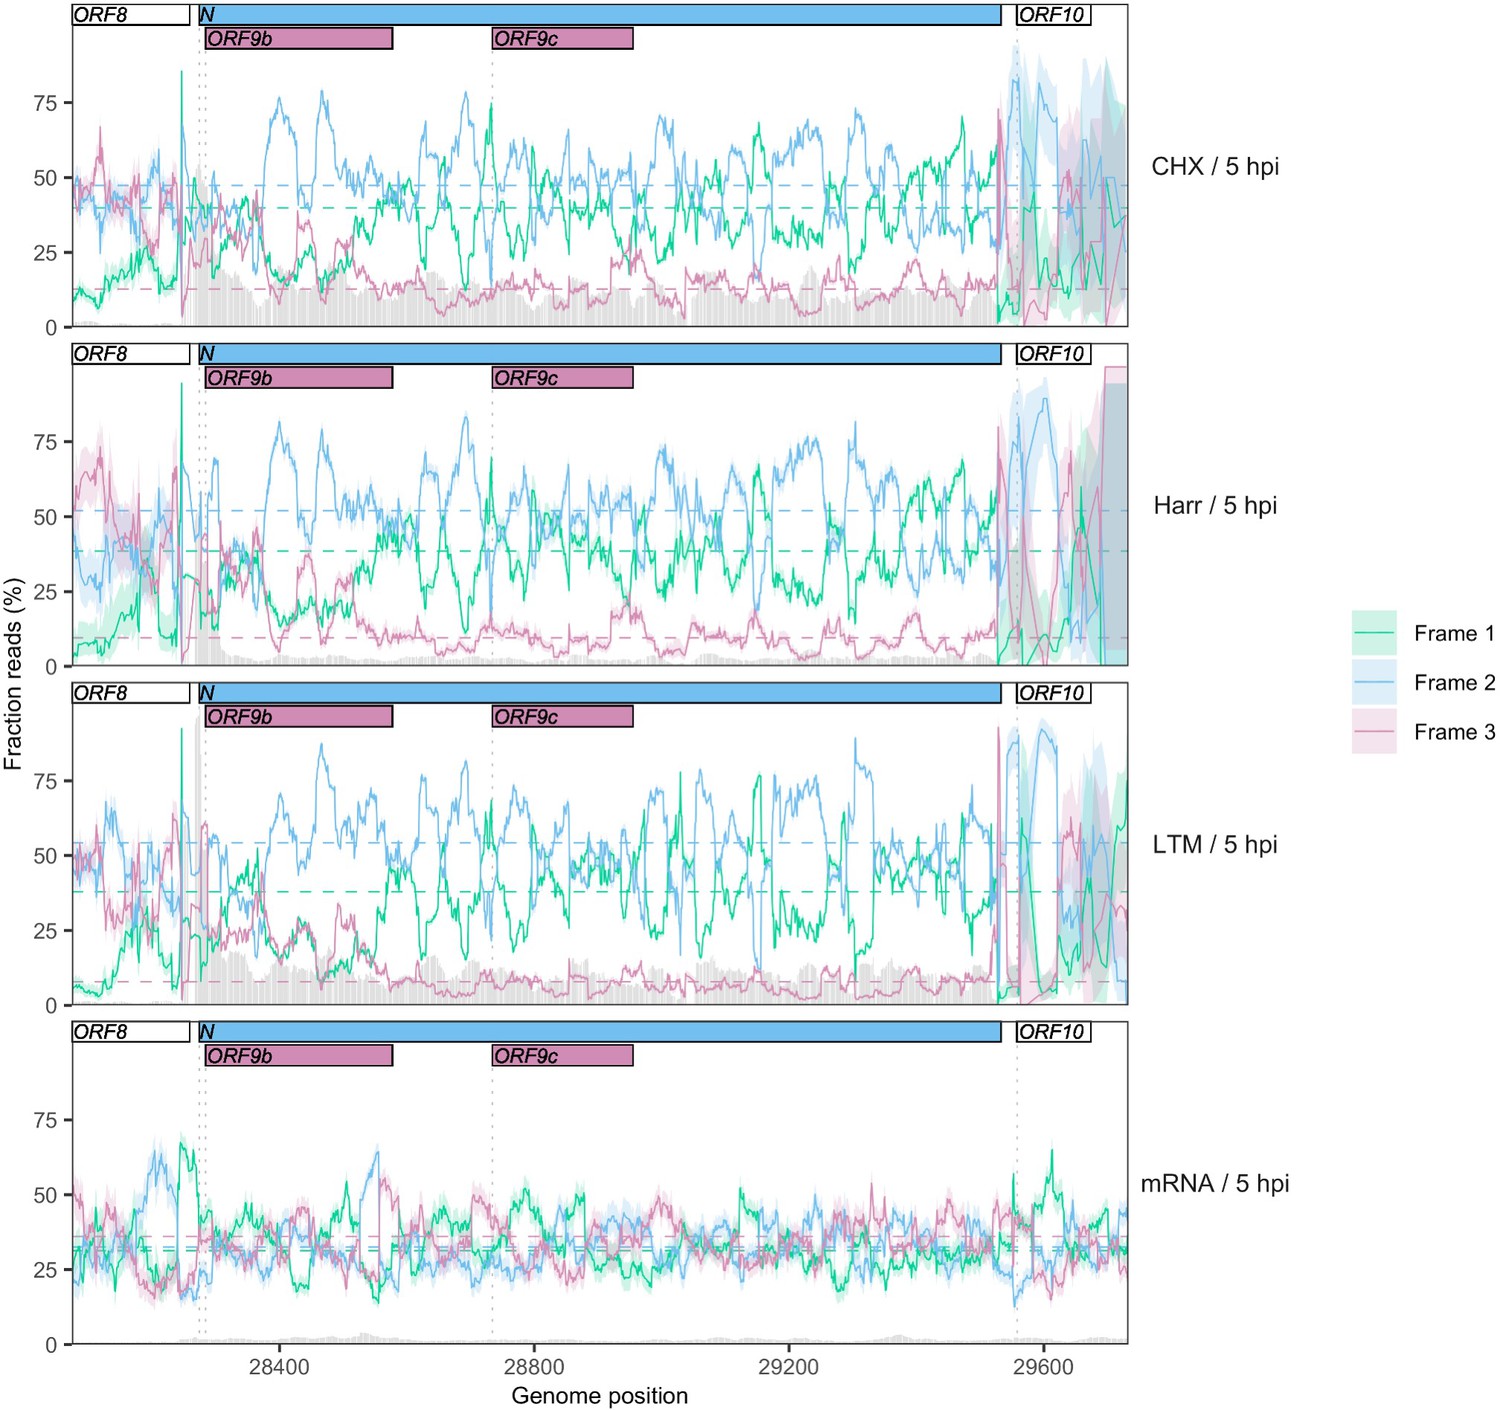
Reading frame of ribosome profiling reads in the N/ORF9b/ORF9c region.
Details as in Figure 2C and Figure 2—figure supplement 5, except Frames 1, 2, and 3 correspond to the frames beginning at positions 1, 2, and 3 of the Wuhan-Hu-1 reference genome, respectively. Expression of ORF9b is evidenced by a peak in the fraction of reads mapping to Frame 3 (burgundy) at the appropriate region, as well as a peak in read depth (gray bars) immediately upstream (Figure 2A). Translational status of ORF9c is ambiguous, with minimal enrichment of reads in the appropriate frame (burgundy) along the gene.
Figure 2—figure supplement 8
Reading frame of ribosome profiling reads in the full ORF3a gene.
Details as in Figure 2C and Figure 2—figure supplement 5. No clear evidence is observed for the expression of any of the ORF3b ORFs present in SARS-CoV-2, but the translational status of these ORFs requires further investigation.
Figure 2—figure supplement 9
Reading frame of ribosome profiling reads in the ORF3c/ORF3d region of ORF3a for reads of length 29 nt.
Details as in Figure 2C and Figure 2—figure supplement 5, except results are shown for reads of length 29 nt, which are also indicative of frame but have slightly lower coverage (Figure 2—figure supplement 3) and exhibit frame-related periodicity. Evidence for ORF3c (Frame 2; burgundy) is more pronounced using this read length, while the peak for ORF3d (Frame 3; gold) occurs slightly later, overlapping ORF3d-2.
Figure 3 with 3 supplements
SARS-CoV-2 protein sequence properties.
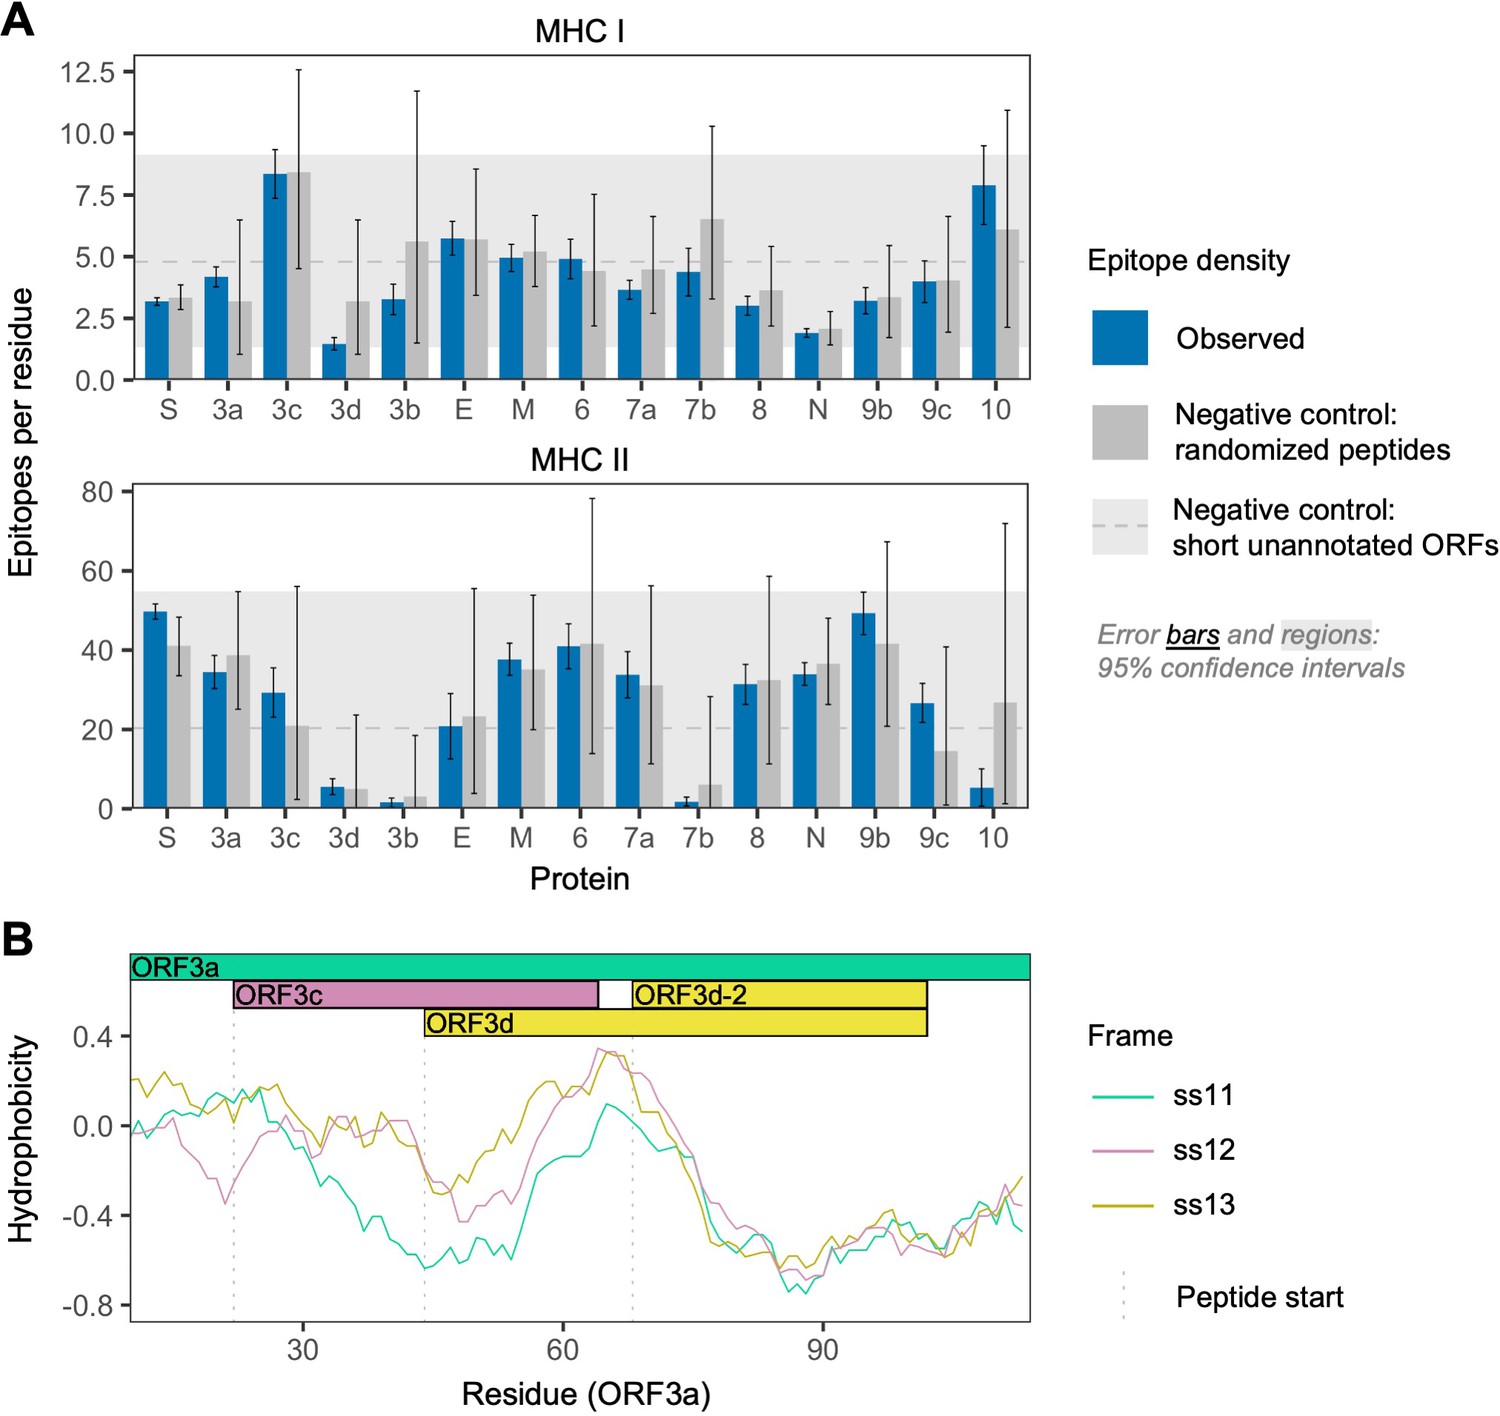
(A) Predicted densities of MHC class I-bound CD8+ T cell 9 amino acid (aa) epitopes (top) and MHC class II-bound CD4+ T cell 15 aa epitopes (bottom). Results for proteins encoded downstream of ORF1ab are shown. Mean numbers of predicted epitopes per residue (blue bars) are calculated as the number of epitopes overlapping each amino acid position divided by protein length. Error bars show 95% confidence intervals. Two sets of negative controls were also tested: (1) n = 1000 randomized peptides generated from each protein by randomly sampling its amino acids with replacement (dark gray bars), representing the result expected given amino acid content alone; and (2) short unannotated ORFs, the peptides encoded by n = 103 putatively nonfunctional ORFs present in the SARS-CoV-2 genome, representing the result expected for ORFs that have been evolving without functional constraint. For the short unannotated ORFs, the horizontal gray dotted line shows the mean number of epitopes per residue, and the gray-shaded region shows the 95% confidence interval (i.e. 2.5% to 97.5% quantiles). ORF3d, N, and ORF8 have the lowest MHC class I epitope densities; ORF3d, ORF3b, ORF7b, and ORF10 have the lowest MHC class II epitope densities. (B) Hydrophobicity profiles of amino acid sequences encoded by the three forward-strand reading frames of the ORF3a/ORF3c/ORF3d gene region, as calculated by the VOLPES server, using the unitless ‘Factor 1’ consensus hydrophobicity scale. Frame is reported using ORF3a as the reference, for example ss12 refers to the frame encoding ORF3d, for which codon position 2 overlaps codon position 1 of ORF3a (Figure 2C).
-
Figure 3—source data 1
epitope_summary_MHCI_LONG.txt.
Source data for MHC class I in Figure 3A.
- https://cdn.elifesciences.org/articles/59633/elife-59633-fig3-data1-v2.txt
-
Figure 3—source data 2
epitope_summary_MHCII_LONG.txt.
Source data for MHC class II in Figure 3A.
- https://cdn.elifesciences.org/articles/59633/elife-59633-fig3-data2-v2.txt
-
Figure 3—source data 3
hydrophobicity_profiles_ORF3a_corr.txt.
Source data for hydrophobicity profiles in Figure 3B.
- https://cdn.elifesciences.org/articles/59633/elife-59633-fig3-data3-v2.txt
Figure 3—figure supplement 1
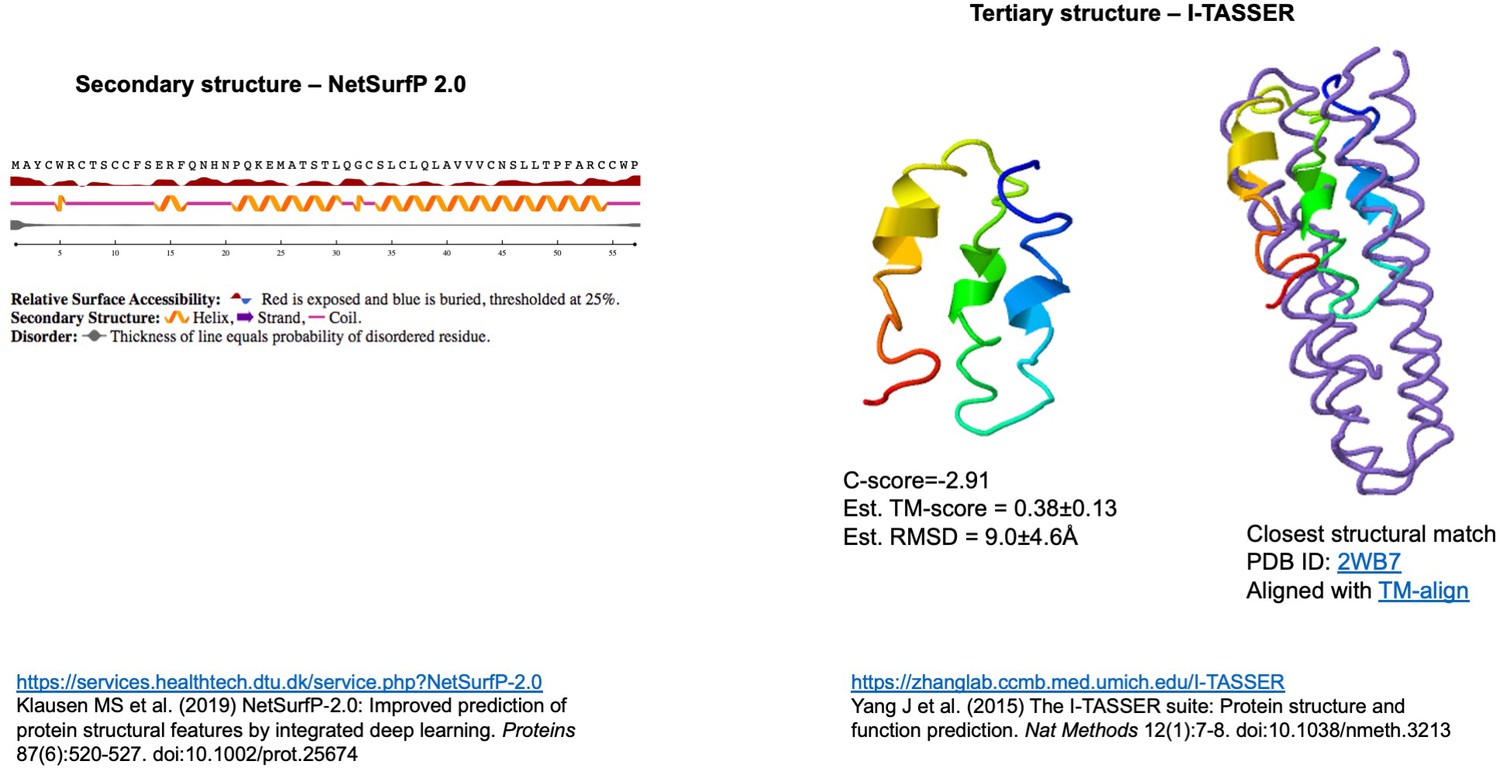
Structural prediction for the ORF3d protein.
Independent computational modeling predictions of α-helices at the secondary (left inset, carried out in NetSurf v2) and tertiary structure levels (right inset, carried out in I-TASSER). Folding concordance with the closest protein structure match is shown (rightmost inset, aligned with TM-align). For explanation of shown metrics, see https://zhanglab.ccmb.med.umich.edu/I-TASSER. Chan et al., 2020 also predict a fold with α-helices (Raven Kok, pers. comm.).
Figure 3—figure supplement 2
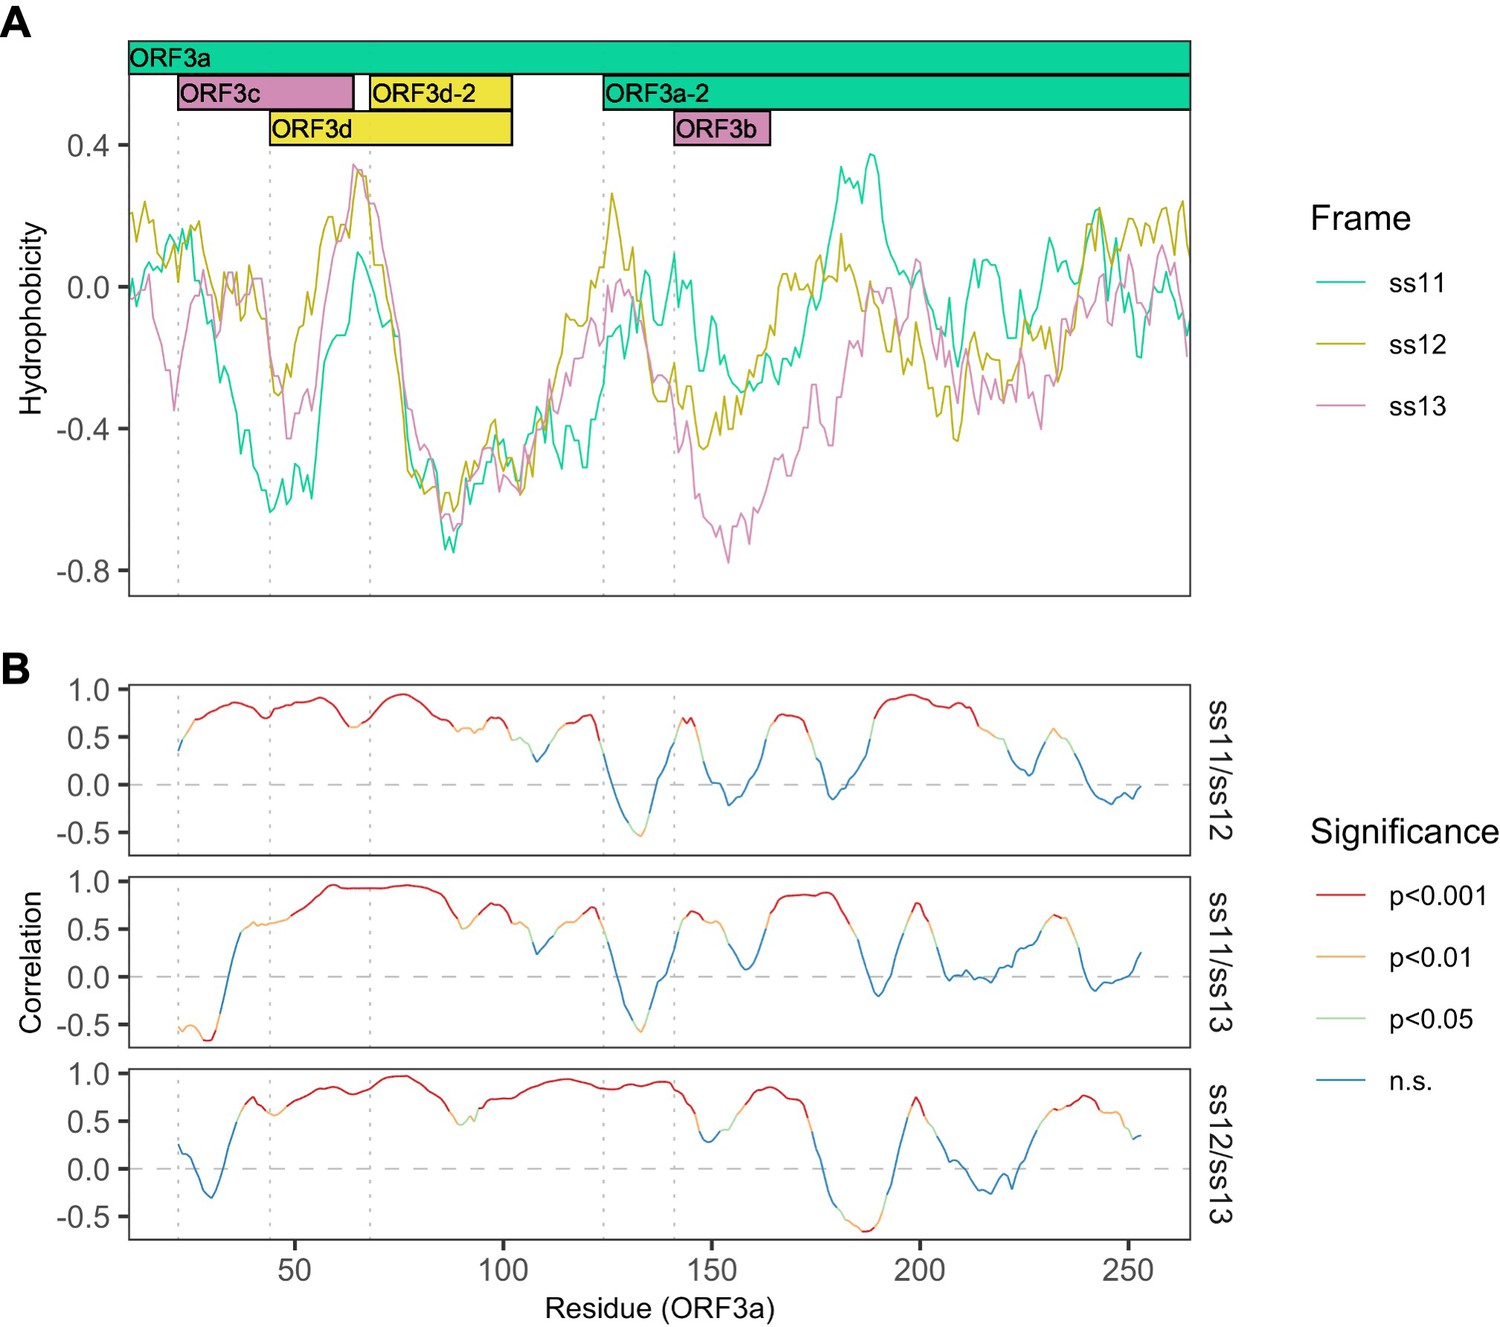
Correlations between hydrophobicity profiles of amino acid sequences encoded by the three forward-strand reading frames of the ORF3a region.
Vertical dotted gray lines denote gene start sites. (A) Hydrophobicity profiles of the amino acid sequences encoded by all three forward-strand reading frames of ORF3a. Details as in Figure 3B, except the entire region encoding ORF3a is shown. (B) Correlations (Spearman’s rank) between hydrophobicity profiles for the three forward-strand reading frames. Color denotes significance.
Figure 3—figure supplement 3

Correlation between hydrophobicity profiles in the amino acid sequences encoded by all three forward-strand frames of ORF3a, by gene subregion.
Details as in Figure 3—figure supplement 2. ORF3a (left) refers to those codons of ORF3a that encode residues not overlapping any hypothesized overlapping genes. Codons counts refer to ORF3a, that is 21 codons of ORF3a (20 codons of ORF3d) are involved in a triple overlap (at least one nucleotide) with ORF3c.
Figure 4

Amino acid variation in proteins encoded by genes overlapping ORF3a in viruses of the species Severe acute respiratory syndrome-related coronavirus.
(A) Amino acid sequences of ORF3c, ORF3d, and ORF3b, as encoded by SARS-CoV-2 (Wuhan-Hu-1; NCBI: NC_045512.2). Note that, while ORF3b encodes a protein of 154 amino acids (aa) in SARS-CoV (NCBI: NC_004718.3), a premature STOP codon in SARS-CoV-2 has resulted in an ORF encoding only 22 aa. (B) Amino acid alignments of ORF3c, ORF3d, and ORF3b (3b) show their sequence conservation. Black lines indicate STOP codons in ORF3d and ORF3b, showing their restricted taxonomic ranges. Intact ORF3d is restricted to SARS-CoV-2 and pangolin-CoV GX/P5L; however, note that ORF3d-2 (denoted 3d-2), a shorter isoform of ORF3d, could have a slightly wider taxonomic range if TTG or GTG are permitted as translation initiation codons. Full-length ORF3b (ORF3b region) is found throughout members of this virus species, but truncated early in most genomes outside of SARS-CoV (Supplementary file 1), with the shortest isoform (denoted 3b) found in SARS-CoV-2 and closely related viruses.
-
Figure 4—source data 1
aa_alignments_3c_3d_3b.xlsx.
Amino acid alignments shown in Figure 4. The full translation of the ORF3b region is provided for ORF3b. Note that the pangolin-CoV GD/1 sequence has been masked as X (license constraint), but can be acquired with GISAID registration.
- https://cdn.elifesciences.org/articles/59633/elife-59633-fig4-data1-v2.xlsx
Figure 5 with 2 supplements
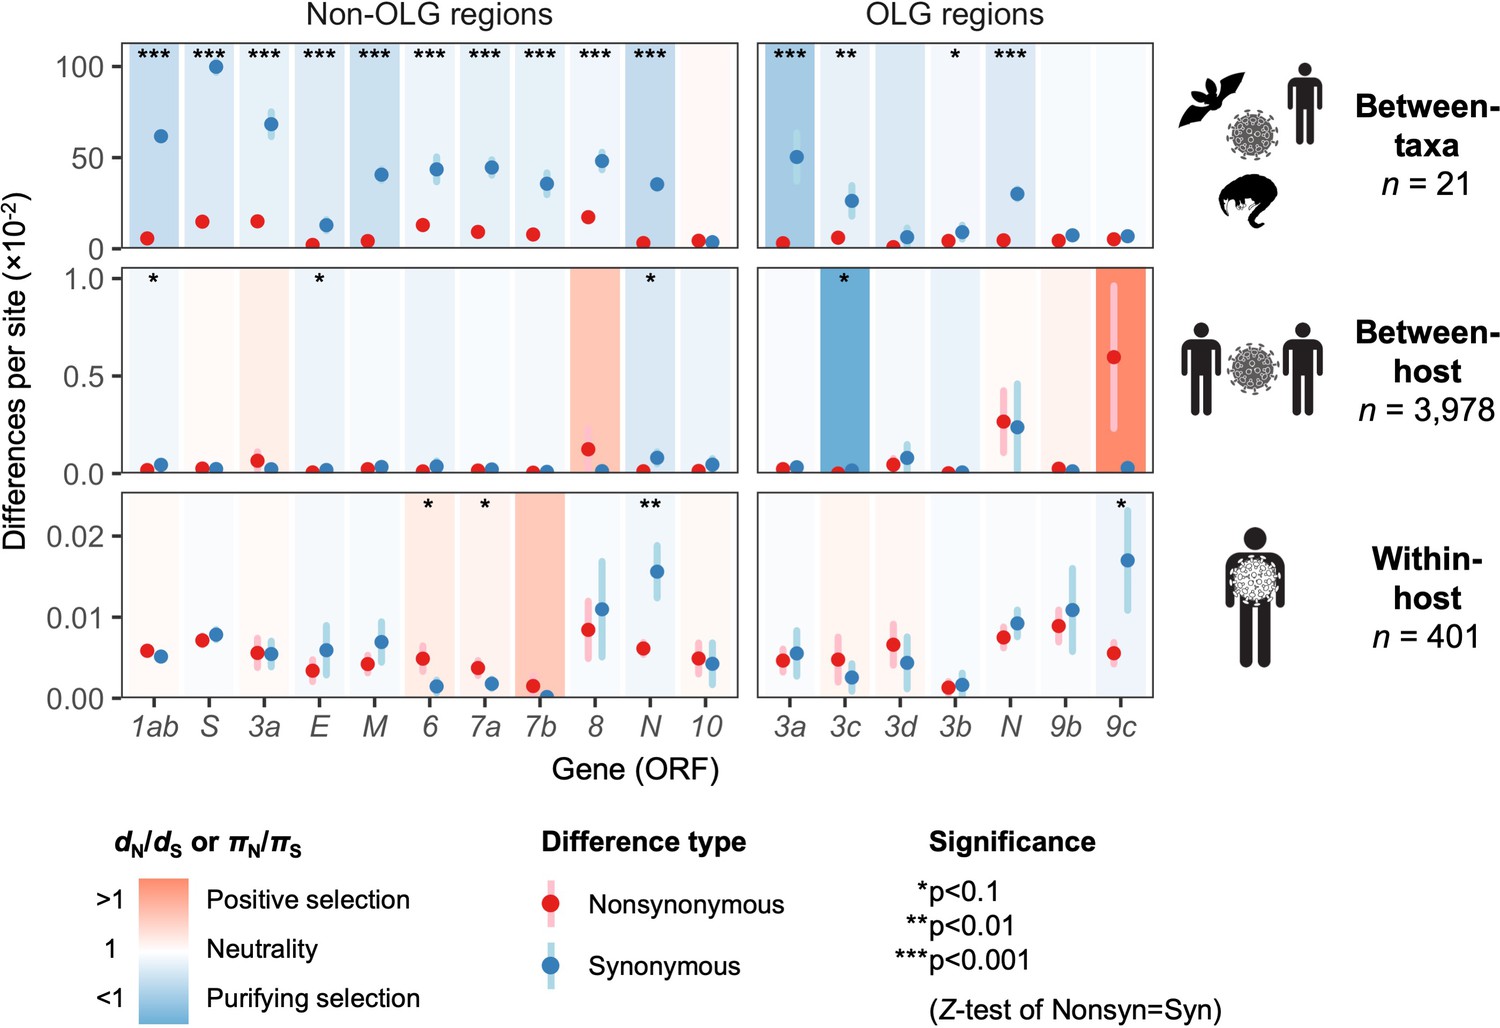
Natural selection analysis of viral nucleotide differences at three hierarchical evolutionary levels.
Nucleotide differences in each virus gene were analyzed at three host levels: between-taxa divergence (d) among Severe acute respiratory syndrome-related coronavirus genomes infecting bat, human, and pangolin species; between-host diversity (π) for SARS-CoV-2 infecting human individuals (consensus-level); and within-host diversity (π) for SARS-CoV-2 infecting human individuals (deep sequencing). Each gene/level is shaded according to the ratio of mean nonsynonymous to synonymous differences per site to indicate purifying selection (dN/dS < 1 or πN/πS < 1; blue) or positive selection (dN/dS > 1 or πN/πS > 1; red). The extremely low ratio for ORF3c was artificially adjusted to allow the display of other ratios, and a Jukes-Cantor correction was applied to dN and dS values. Values range from a minimum of πN/πS = 0.04 (ORF3c, between-host; p=0.0410) to a maximum of 21.0 (ORF9c, between-host; p=0.126), where significance was evaluated using Z-tests of the hypothesis that dN-dS = 0 or πN-πS = 0 (10,000 bootstrap replicates, codon unit). The mean of all pairwise comparisons is shown for sequenced genomes only, i.e. no ancestral sequences were reconstructed or inferred. For each gene, sequences were only included in the between-species analysis if a complete, intact ORF (no STOPs) was present. Genes containing an overlapping gene (OLG) in a different frame were analyzed separately for non-OLG and OLG regions using SNPGenie and OLGenie, respectively. For ORF3b, only the region corresponding to the first ORF in SARS-CoV-2 (Table 1) was analyzed. The short overlap between ORF1a and ORF1b (nsp11 and nsp12) was excluded from the analysis. Error bars represent the standard error of mean pairwise differences. See Materials and methods for further details.
-
Figure 5—source data 1
selection_three_levels.txt.
Source data for Figure 5.
- https://cdn.elifesciences.org/articles/59633/elife-59633-fig5-data1-v2.txt
Figure 5—figure supplement 1
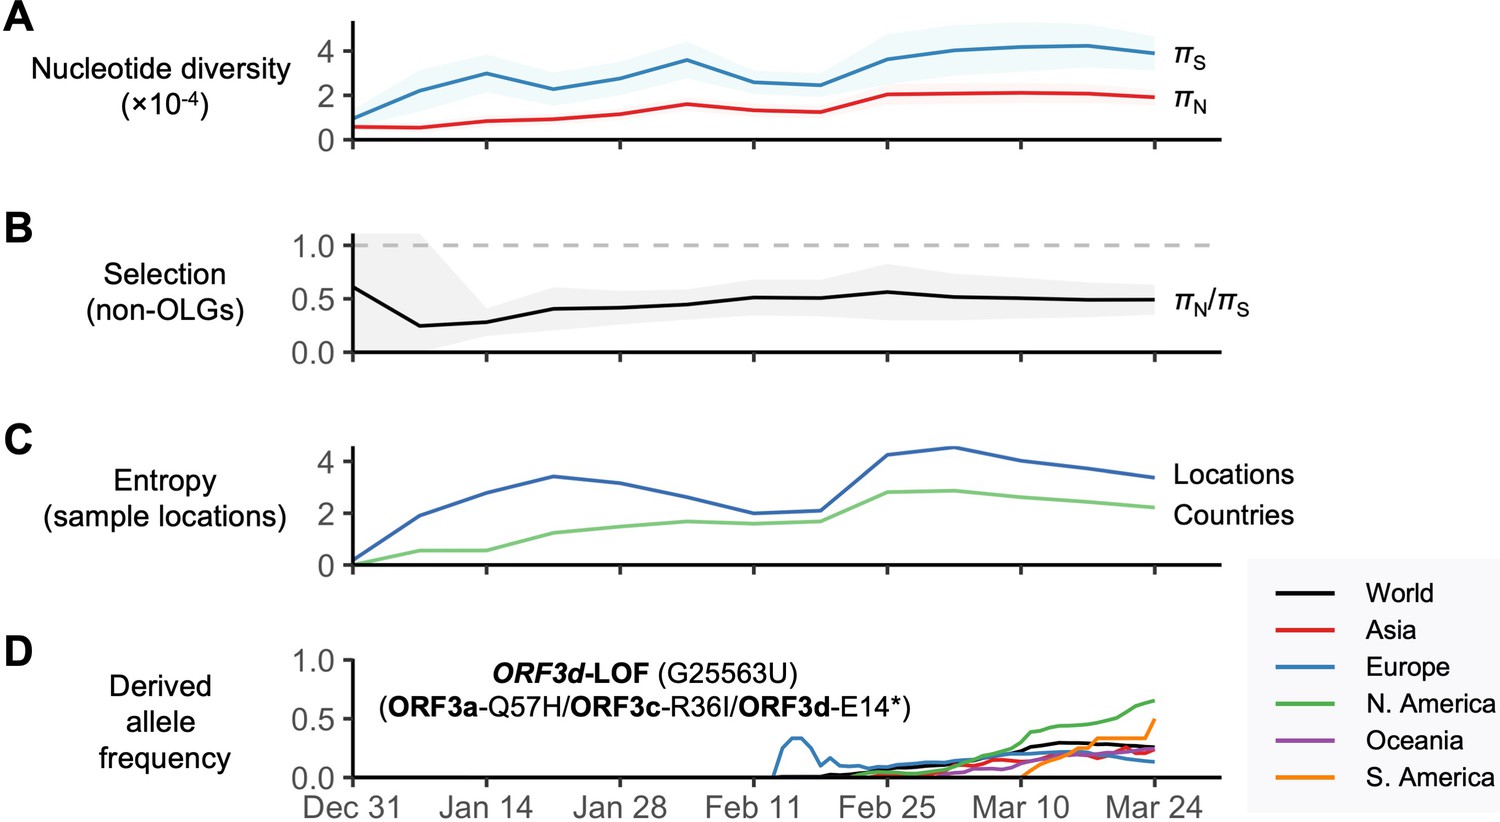
SARS-CoV-2 between-host nucleotide diversity and allele frequencies as a function of date during the initial period of the COVID-19 pandemic.
Analyses refer to human SARS-CoV-2 consensus sequences obtained from GISAID. Results show sliding windows of 14 days (step size = 7 days) representing 13 time points since the first GISAID sample was collected (EPI_ISL_402123 on 12/24/2019). Regions with overlapping genes were excluded from estimates of π. Shaded regions show standard error of mean πN, πS, or πN/πS (10,000 bootstrap replicates, codon unit). (A) Nonsynonymous (πN) and synonymous (πS) nucleotide diversity. (B) πN/πS, where the horizontal dashed gray line denotes the πN/πS ratio expected under neutrality (1.0). (C) Diversity of sampling locations measured as entropy, defined as -∑p*ln(p), where p is the number of distinct (unique) locations or countries reported for a given window (Ewens and Grant, 2001). (D) Allele frequency trajectories of the ORFd-LOF mutation, colored by continent and limited to sufficient sample sizes (Supplementary file 1).
Figure 5—figure supplement 2
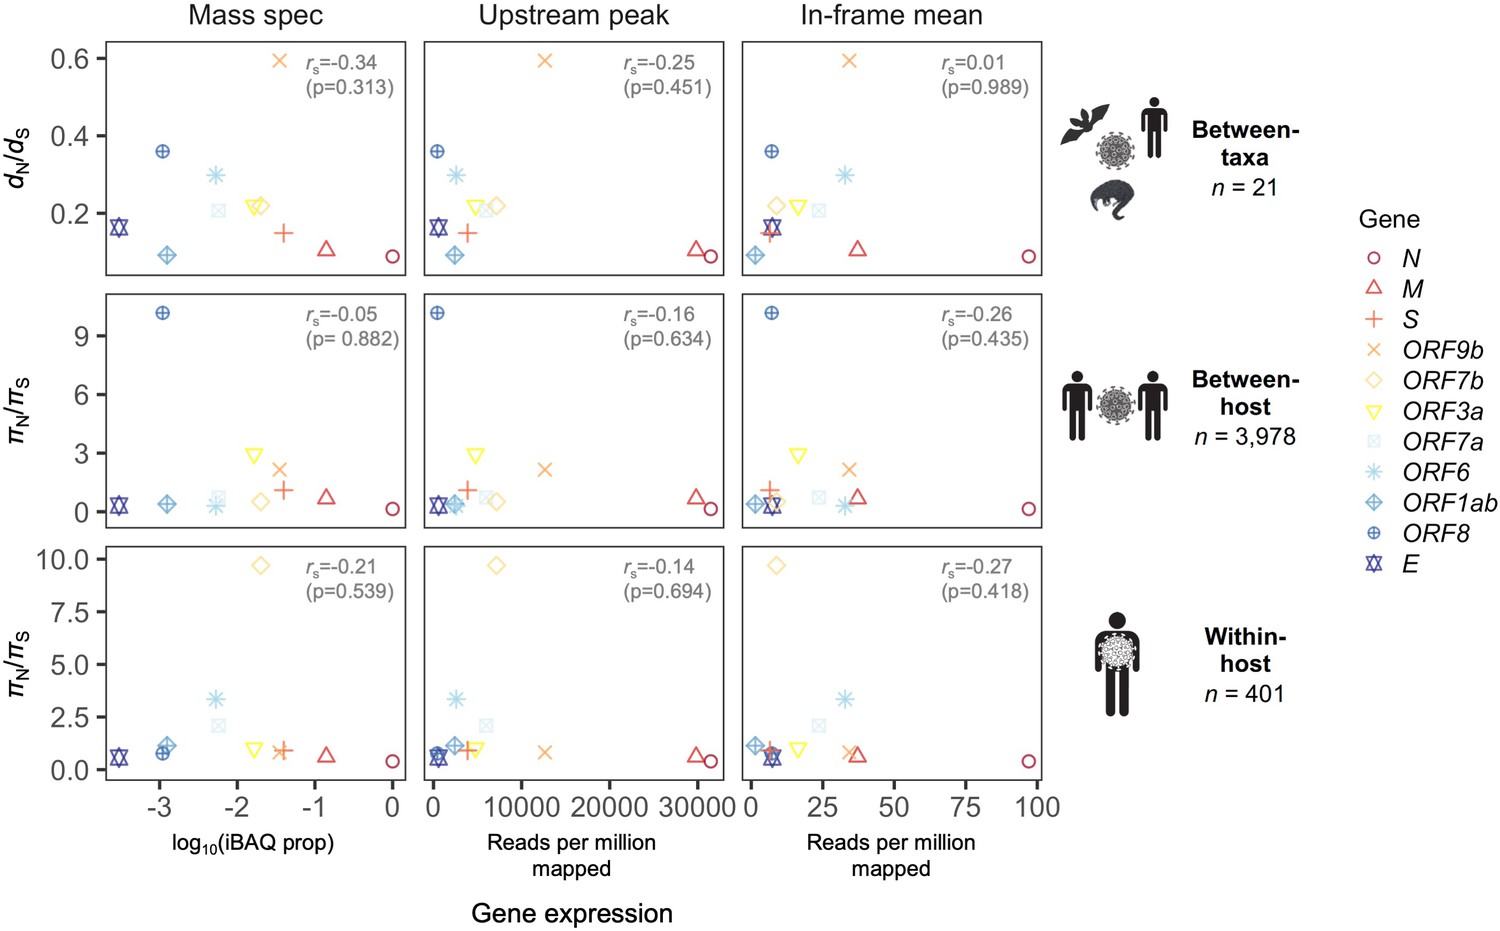
Correlation between natural selection and gene expression.
A weak negative Spearman correlation between dN/dS (πN/πS) and gene expression is observed across all three evolutionary levels (between-taxa, between-host, and within-host). The x-axes of different panels differ by method for inferring gene expression, which are those shown in Figure 2B: (1) ‘Mass spec’ refers to log10(iBAQ prop), where iBAQ prop is the proportion of the maximum intensity-based absolute quantification (iBAQ) observed; (2) ‘Upstream peak’ is the peak in ribosome profiling read depth upstream of the gene start site, measured for reads of length 29-31nt (Figure 2A); and (3) ‘In-frame mean’ is the mean read depth at Codon pos 1, measured for reads of length 30nt (Figure 2B). A given gene (color) has only one selection value (y-axis) per evolutionary level, and only one gene expression value (x-axis) per method for determining expression. Selection was calculated as dN/dS (πN/πS) except for the overlapping gene ORF9b, where the OLG-appropriate measure dNN/dNS (πNN/πNS) was used (see Materials and methods).
Figure 6 with 1 supplement
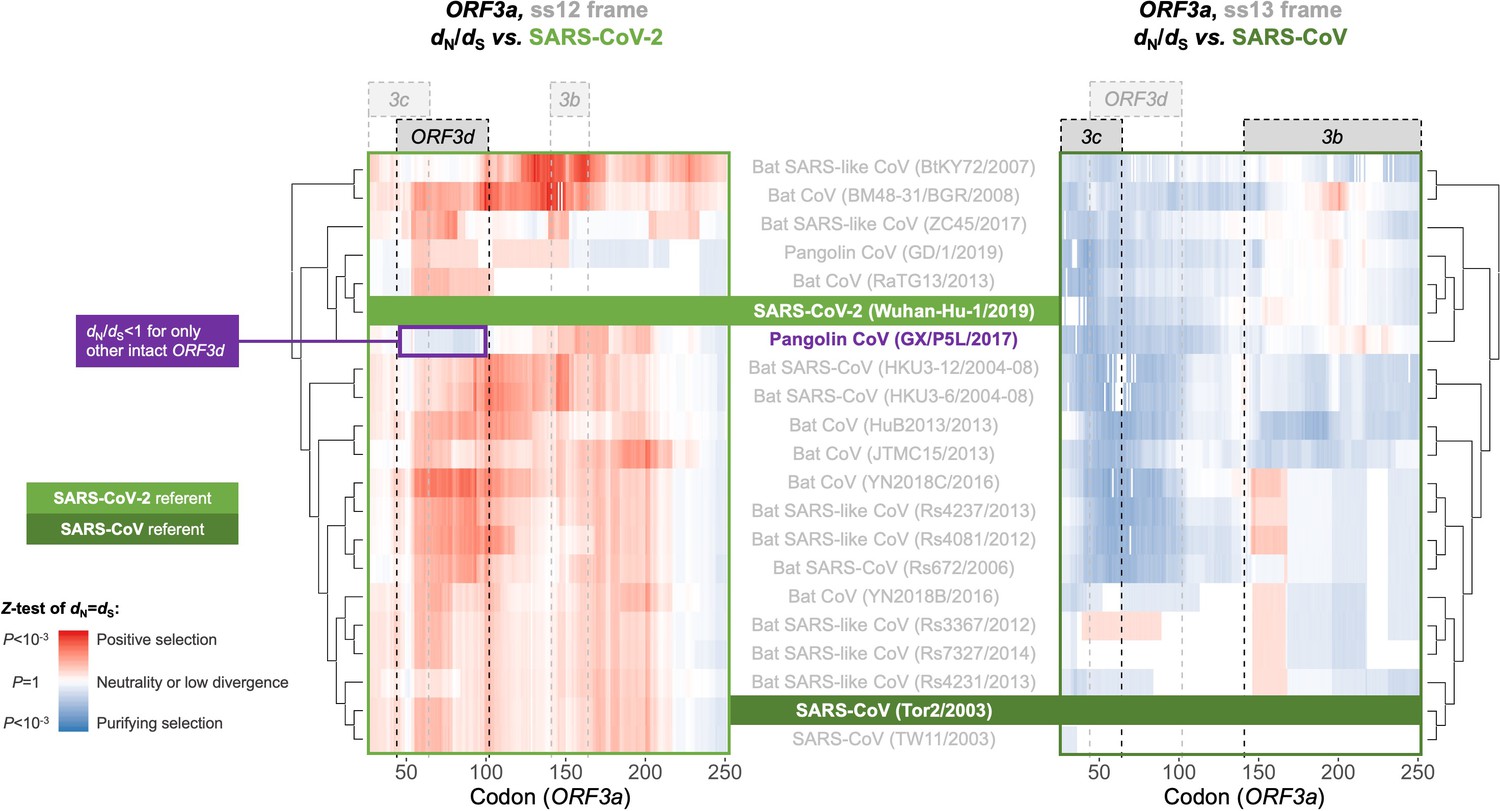
Between-taxa sliding window analysis of natural selection on overlapping frames of ORF3a.
Pairwise sliding window analysis (window size = 50 codons; step size = 1 codon) of selection across members of the species Severe acute respiratory syndrome-related coronavirus. OLG-appropriate dN/dS values were computed using OLGenie (Nelson et al., 2020a), a method that is conservative (non-conservative) for detecting purifying (positive) selection, and a Jukes-Cantor correction for multiple hits was employed. On the left-hand side, each genome is compared to SARS-CoV-2 in the ss12 reading frame of ORF3a, which contains ORF3d (Table 1 and Figure 2C). This frame shows evidence for purifying selection specific to the ORF3d region that is limited to the comparison with pangolin-CoV GX/P5L. On the right-hand side, this analysis is repeated for the ss13 reading frame of ORF3a, which contains ORF3c and ORF3b (Table 1 and Figure 2C), this time with respect to SARS-CoV, where full-length ORF3b is functional. This frame shows constraint across much of this gene and virus species, and ORF3c in particular is deeply conserved.
-
Figure 6—source data 1
SARS-CoV-2-ref_ORF3a_ss12_windows.txt.
OLGenie sliding window dN/dS results for comparisons to SARS-CoV-2 in the frame of ORF3d, shown on the left side of Figure 6.
- https://cdn.elifesciences.org/articles/59633/elife-59633-fig6-data1-v2.txt
-
Figure 6—source data 2
SARS-CoV-ref_ORF3a_ss13_windows.txt.
OLGenie sliding window dN/dS results for comparisons to SARS-CoV in the frame of ORF3b, shown on the right side of Figure 6.
- https://cdn.elifesciences.org/articles/59633/elife-59633-fig6-data2-v2.txt
Figure 6—figure supplement 1
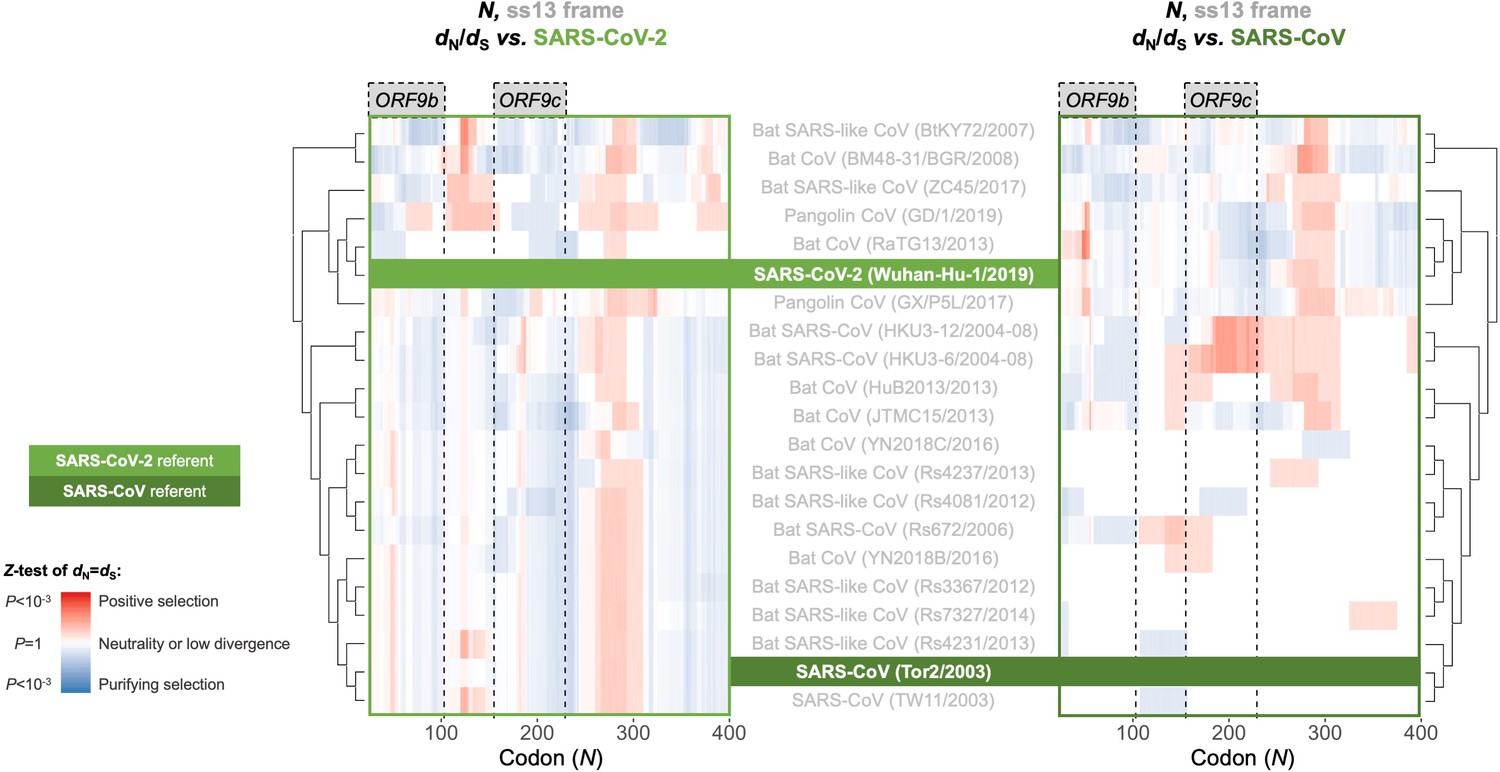
Between-taxa sliding window of genes overlapping N.
Pairwise OLGenie analysis of the N gene’s ss13 reading frame across members of the species Severe acute respiratory syndrome-related coronavirus. Details as in Figure 6, except only the ss13 frame is shown.
Figure 7
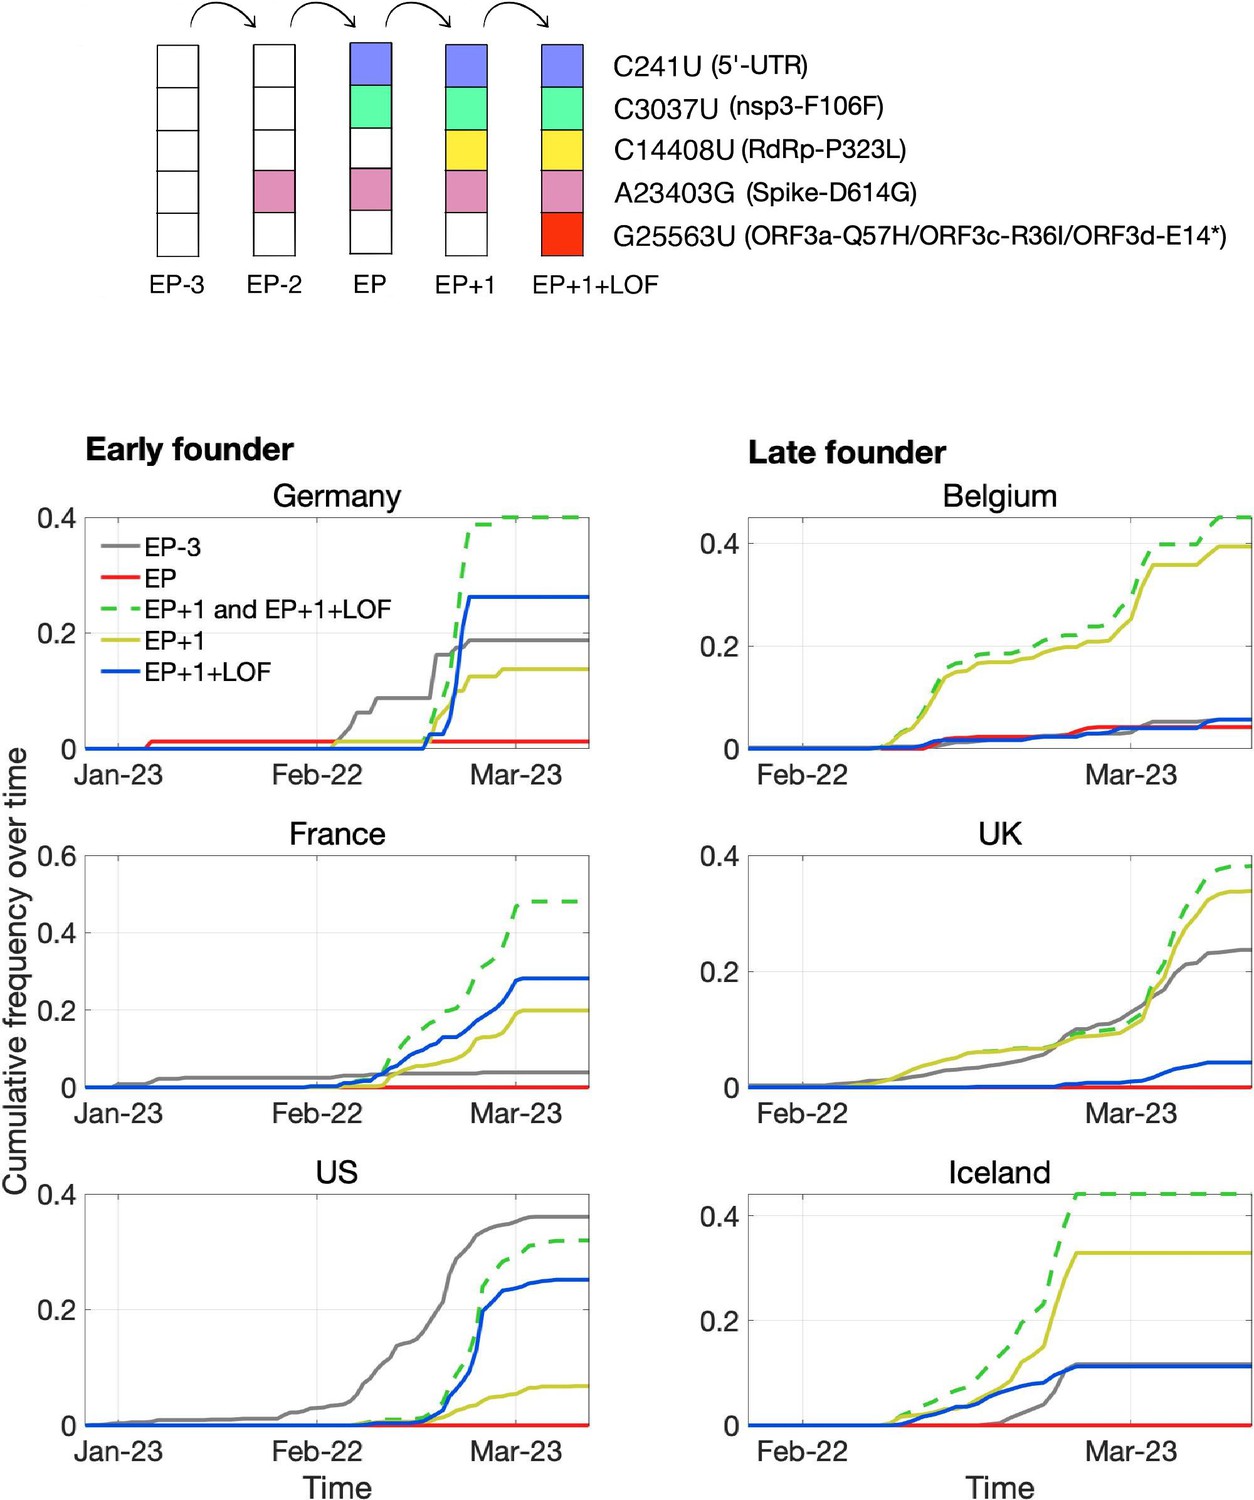
Pandemic spread of the EP+1 haplotype and the hitchhiking of ORF3d-LOF.
The mutational path leading to EP+1+LOF is shown in the upper panel. Cumulative frequencies of haplotypes in samples from Germany and five other countries with the most abundant sequence data are shown in the lower panel. Countries are grouped into early founder (left) and late founder (right) based on the presence or absence of SARS-CoV-2 samples from January, respectively. In the early founder group, EP–3 (gray) is observed earlier than other haplotypes in France and the US, and EP (red) is observed early in Germany, giving them the advantage of a founder effect. However, neither EP nor EP–3 dominate later spread; instead, EP+1 (yellow) and EP+1+LOF (blue) increase much faster despite their later appearance in these countries. In the late founder group, multiple haplotypes appear at approximately the same time, but EP–3 and EP spread more slowly. The green dashed line shows the combined frequencies of EP+1 and EP+1+LOF (yellow and blue, respectively). Note that EP–1 is never observed in our dataset.
Figure 8 with 1 supplement
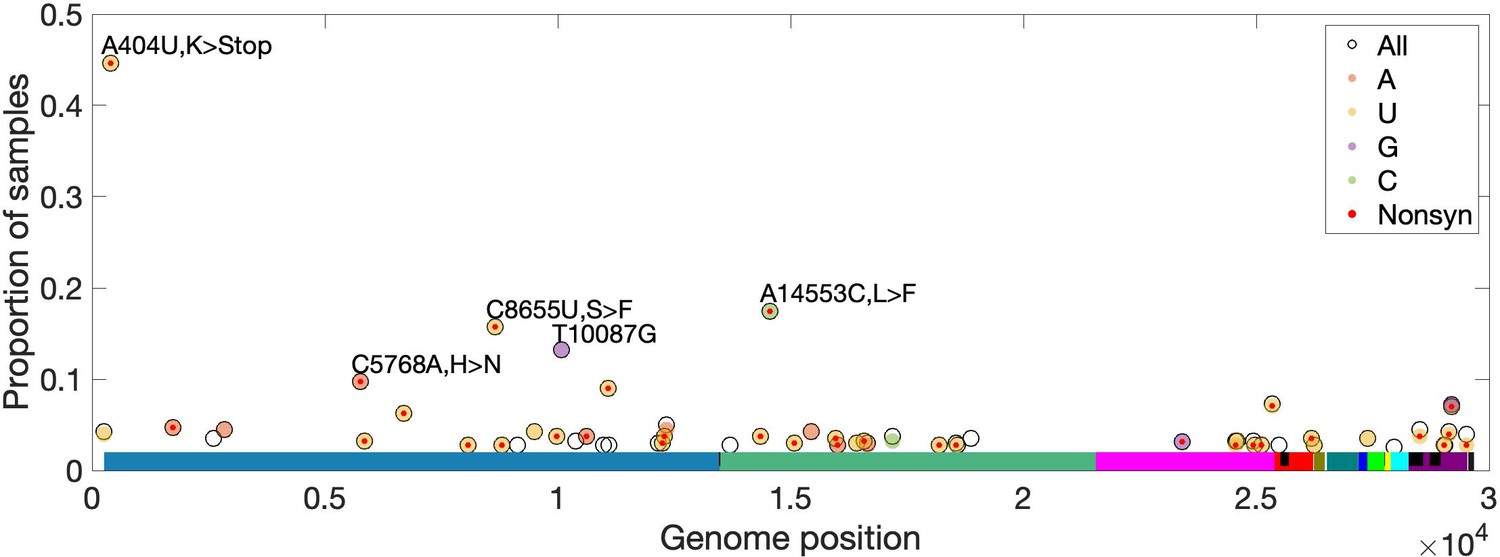
High-frequency within-host mutations.
For each site, mutations that occur in more than 2.5% of samples are shown, limiting to samples where the major or fixed allele matches Wuhan-Hu-1 at that site. The y-axis shows the proportion of such samples having the indicated minor (derived) allele. Each locus has up to three possible single-nucleotide derived alleles compared to the reference background. Open circles (black outlines) show the proportion of samples having any of the three possible derived alleles ('All'), while solid circles (color fill) show the proportion of samples having a specific derived allele (equivalent to 'All' if only one variant is observed). For most sites, only one derived mutation type (e.g. C→U) is observed across all samples. Precluding co-infection by multiple genotypes and sequencing errors, derived mutations occurring in more than one sample (y-axis) must be identical by state but not descent (i.e. recurrent). Genome positions are plotted on the x-axis, with distinct genes shown in different colors and overlapping genes shown as black blocks within reference genes. Nonsynonymous and nonsense mutations (together denoted 'Nonsyn') are indicated with a red dot. Source data are available in the supplementary material.
Figure 8—figure supplement 1
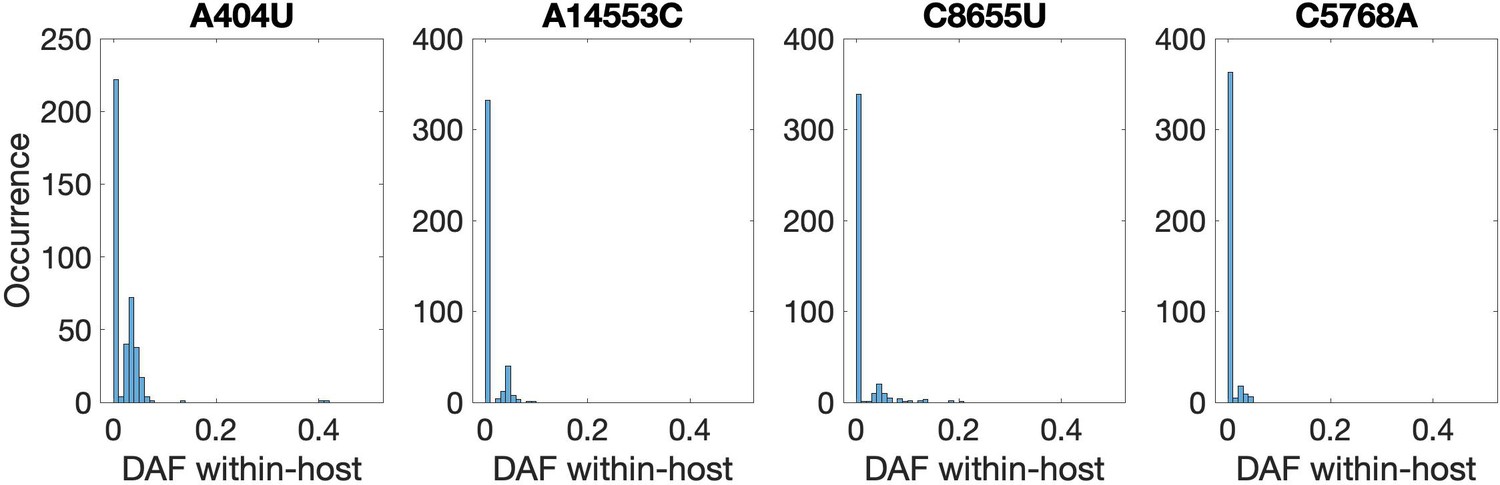
Recurrent nonsynonymous mutations observed in multiple human hosts.
Histogram of the derived allele frequency (DAF) of the four most common recurrent protein-coding mutations across all within-host samples (bin width = 0.01). Mutation A404U introduces a premature STOP codon in nsp1, whereas the remainder are nonsynonymous.
Tables
Table 1
Nomenclature and reading frames for overlapping gene candidates in SARS-CoV-2 ORF3a.
| Gene* | Reading frame† | Genome positions, Wuhan-Hu-1 (CDS positions, ORF3a)‡ | Length | Description | References |
|---|---|---|---|---|---|
| ORF3a | ss11 (reference) | 25393–26220 (1-828) | 276 codons (828 nt) | Ion channel formation and virus release in SARS-CoV infection; host cell apoptosis; triggers inflammation; antagonizes interferon | Lu et al., 2010; Cui et al., 2019 |
| ORF3c | ss13 | 25457–25582 (65-190) | 42 codons (126 nt) | Features suggestive of a viroporin (Cagliani et al., 2020); lowest πN/πS ratio estimated for any gene in our between-host selection analysis (Figure 5); overlaps codons 22–64 of ORF3a | First discovered by Cagliani et al., 2020 as ORF3h; ORF3c in Firth, 2020; ORF3c in Jungreis et al., 2020; ORF3a.iORF1 in Finkel et al., 2020; ORF3b in Pavesi, 2020 |
| ORF3d | ss12 | 25524–25697 (132-305) | 58 codons (174 nt) | Aligned to and named ORF3b by Chan et al., 2020 but is not homologous to ORF3b; interferon antagonism has not been demonstrated; binds STOML2 mitochondrial protein (Gordon et al., 2020); contains a predicted signal peptide in the region encoding ORF3d-2; contains an X motif in pangolin-CoV but not SARS-CoV-2 (Michel et al., 2020); may contribute to differences between SARS-CoV and SARS-CoV-2 in immune response as a unique antigenic target (Hachim et al., 2020; Niloufar Kavian, pers. comm.); overlaps codons 44–102 of ORF3a | Present study; first discovered by Chan et al., 2020 but misclassified as ORF3b; ORF3b in Gordon et al., 2020, Hachim et al., 2020, and citing studies; ‘hypothetical protein’ in Pavesi, 2020; ‘a completely different ORF’ in Michel et al., 2020 |
| ORF3d-2 | ss12 | 25596–25697 (204-305) | 34 codons (102 nt) | A shorter isoform of ORF3d that starts after the first 24 codons, where the majority of premature STOP codons in SARS-CoV-2 are located; contains a predicted signal peptide (Finkel et al., 2020); likely expressed at higher levels than full-length ORF3d (Figure 2A) overlaps codons 68–102 of ORF3a | Discovered by Finkel et al., 2020 as ORF3a-iORF2 |
| ORF3a-2 | ss11 (reference) | 25765–26220 (373-828) | 152 codons (456 nt) | A shorter isoform of ORF3a that starts after the first 124 codons; evidence of expression separate from that of ORF3a (Davidson et al., 2020); has also been conflated with ORF3b; equivalent to codons 124–276 of ORF3a | Discovered by Davidson et al., 2020 (pers. comm.) but referred to as ORF3b |
| ORF3b region§ | ss13 | 25814–26281; four ORFs at 25814–82, 25910–84, 26072–170, and 26183–281 (422-889; ORFs at 422–90, 518–92, 680–778, and 791–889) | 156 codons (468 nt); the four ORFs are 23, 25, 33, and 33 codons (69, 75, 99, and 99 nt) | Full-length in some related viruses, but truncated by multiple in-frame STOP codons in SARS-CoV-2; longer forms function as an interferon antagonist in SARS-related viruses; may contribute to differences between SARS-CoV and SARS-CoV-2 in immune response; although aligned to ORF3d by Chan et al., 2020, the two are not homologous; overlaps codons 141–276 of ORF3a (first ORF overlaps codons 141–164) | Konno et al., 2020 claim functionality for the first (23-codon) ORF in SARS-CoV-2; the first ORF is also mentioned by Wu et al., 2020a |
-
*Genes are listed by position of start site in the genome from 5′ (top) to 3′ (bottom).
†Nomenclature as described in Wei and Zhang, 2015 and Nelson et al., 2020a: ss = sense-sense (same strand); ss12 = codon position 1 of the reference frame overlaps codon position 2 of the overlapping frame on the same strand; ss13 = codon position 1 of the reference frame overlaps codon position 3 of the overlapping frame on the same strand. Frame is indicated from the perspective of ORF3a as the reference gene, i.e. ORF3d starts at codon position 3 of ORF3a, while ORF3c and ORF3b start at codon position 2 of ORF3a.
-
‡Positions and counts include STOP codons. Positions or sequences were indicated by the original publications or verified by personal communication if ambiguous.
§The SARS-CoV-2 region homologous to ORF3b of SARS-CoV contains four premature STOP codons and four distinct ORFs (AUG-to-STOP); see Figure 4, Figure 6, and Supplementary file 1.
Table 2
The mutational path to European pandemic founder haplotypes*.
| Variant | EP–3 | EP–2 | EP† | EP+1† | EP+1+LOF |
|---|---|---|---|---|---|
| C241U (5′-UTR) | - | - | + | + | + |
| C3037U (nsp3-F106F) | - | - | + | + | + |
| C14408U (RdRp-P323L) | - | - | - | + | + |
| A23403G (Spike-D614G) | - | + | + | + | + |
| G25563U (ORF3a-Q57H/ORF3c-R36I/ORF3d-E14*) | - | - | - | - | + |
| Earliest collection§ | 24-Dec | 7-Feb | 28-Jan | 20-Feb | 21-Feb |
| Earliest location§ | Wuhan | Wuhan | Munich (Shanghai)‡ | Lombardy | Hauts de France |
| Occurrence in China | 233 | 1 | 1 (2)‡ | 0 | 0 |
| Occurrence in Europe | 458 | 0 | 21 | 1153 | 310 |
| Occurrence in Italy | 1 | 0 | 0 | 27 | 0 |
| Occurrence in Germany | 15 | 0 | 1 | 11 | 21 |
| Occurrence in Belgium | 27 | 1 | 20 | 187 | 27 |
| Occurrence in UK | 210 | 0 | 0 | 338 | 38 |
| Occurrence in Iceland | 56 | 0 | 0 | 212 | 54 |
| Occurrence in France | 14 | 0 | 72 | 102 | |
| Occurrence in US | 467 | 0 | 0 | 88** | 326** |
| Total in GISAID†† | 1610 | 2 | 22 | 1455 | 752 |
-
*Haplotypes are here defined by the presence (+) or absence (-) of five high-frequency variants (rows 1–5), and other variants with lower frequencies on these backgrounds are ignored. EP-1 is not observed in our dataset.
†The EP haplotype is first detected in German patient #4 and is a documented founder for coronavirus spread in Germany (Rothe et al., 2020). Neither the EP nor EP+1 haplotypes were detectable between January 28 and February 20, although they immediately became a major haplotype once EP+1 was detectable. Failure to detect these two haplotypes during these 3 weeks could potentially be explained by ascertainment bias, for example lack of testing for travel-independent cases.
-
‡This Shanghai sample (GISAID: EPI_ISL_416327) comprises 1.32% poly-Ns and failed our quality control criteria, but is added here since it is potentially relevant to the origin of the EP haplotype. Including this sample, the EP haplotype is observed in Shanghai twice.
§The earliest collection location and time are highly subject to collection and submission bias and do not necessarily reflect where the mutation/haplotype first occurred.
-
**There is likely a testing bias in the United States, as the EP+1+LOF haplotype was often detected in Washington but EP+1 was not.
††These numbers are based on 3853 samples from December 24 to April 1 at the time of GISAID accession that passed both our quality control criteria for alignment and for this particular analysis (i.e. no ambiguous genotype calls among the five SNPs in this table), unless otherwise stated.
Additional files
-
Supplementary file 1
SARSCoV2_ORF3d_supplementary_tables.xlsx.
Supplementary Tables; detailed descriptions given in the CONTENTS sheet.
- https://cdn.elifesciences.org/articles/59633/elife-59633-supp1-v2.xlsx
-
Supplementary file 2
gisaid_hcov-19_acknowledgement_table_2020_04_28_08.xls.
List of laboratories submitting SARS-CoV-2 consensus-level genome sequences to the GISAID EpiCov Database for public access.
- https://cdn.elifesciences.org/articles/59633/elife-59633-supp2-v2.xls
-
Transparent reporting form
- https://cdn.elifesciences.org/articles/59633/elife-59633-transrepform-v2.docx
Download links
A two-part list of links to download the article, or parts of the article, in various formats.
Downloads (link to download the article as PDF)
Open citations (links to open the citations from this article in various online reference manager services)
Cite this article (links to download the citations from this article in formats compatible with various reference manager tools)
Dynamically evolving novel overlapping gene as a factor in the SARS-CoV-2 pandemic
eLife 9:e59633.
https://doi.org/10.7554/eLife.59633


