RETRACTED: Alcohol drinking alters stress response to predator odor via BNST kappa opioid receptor signaling in male mice
- Bowles Center for Alcohol Studies, Department of Pharmacology, University of North Carolina, United States
Figures
Figure 1 with 2 supplements
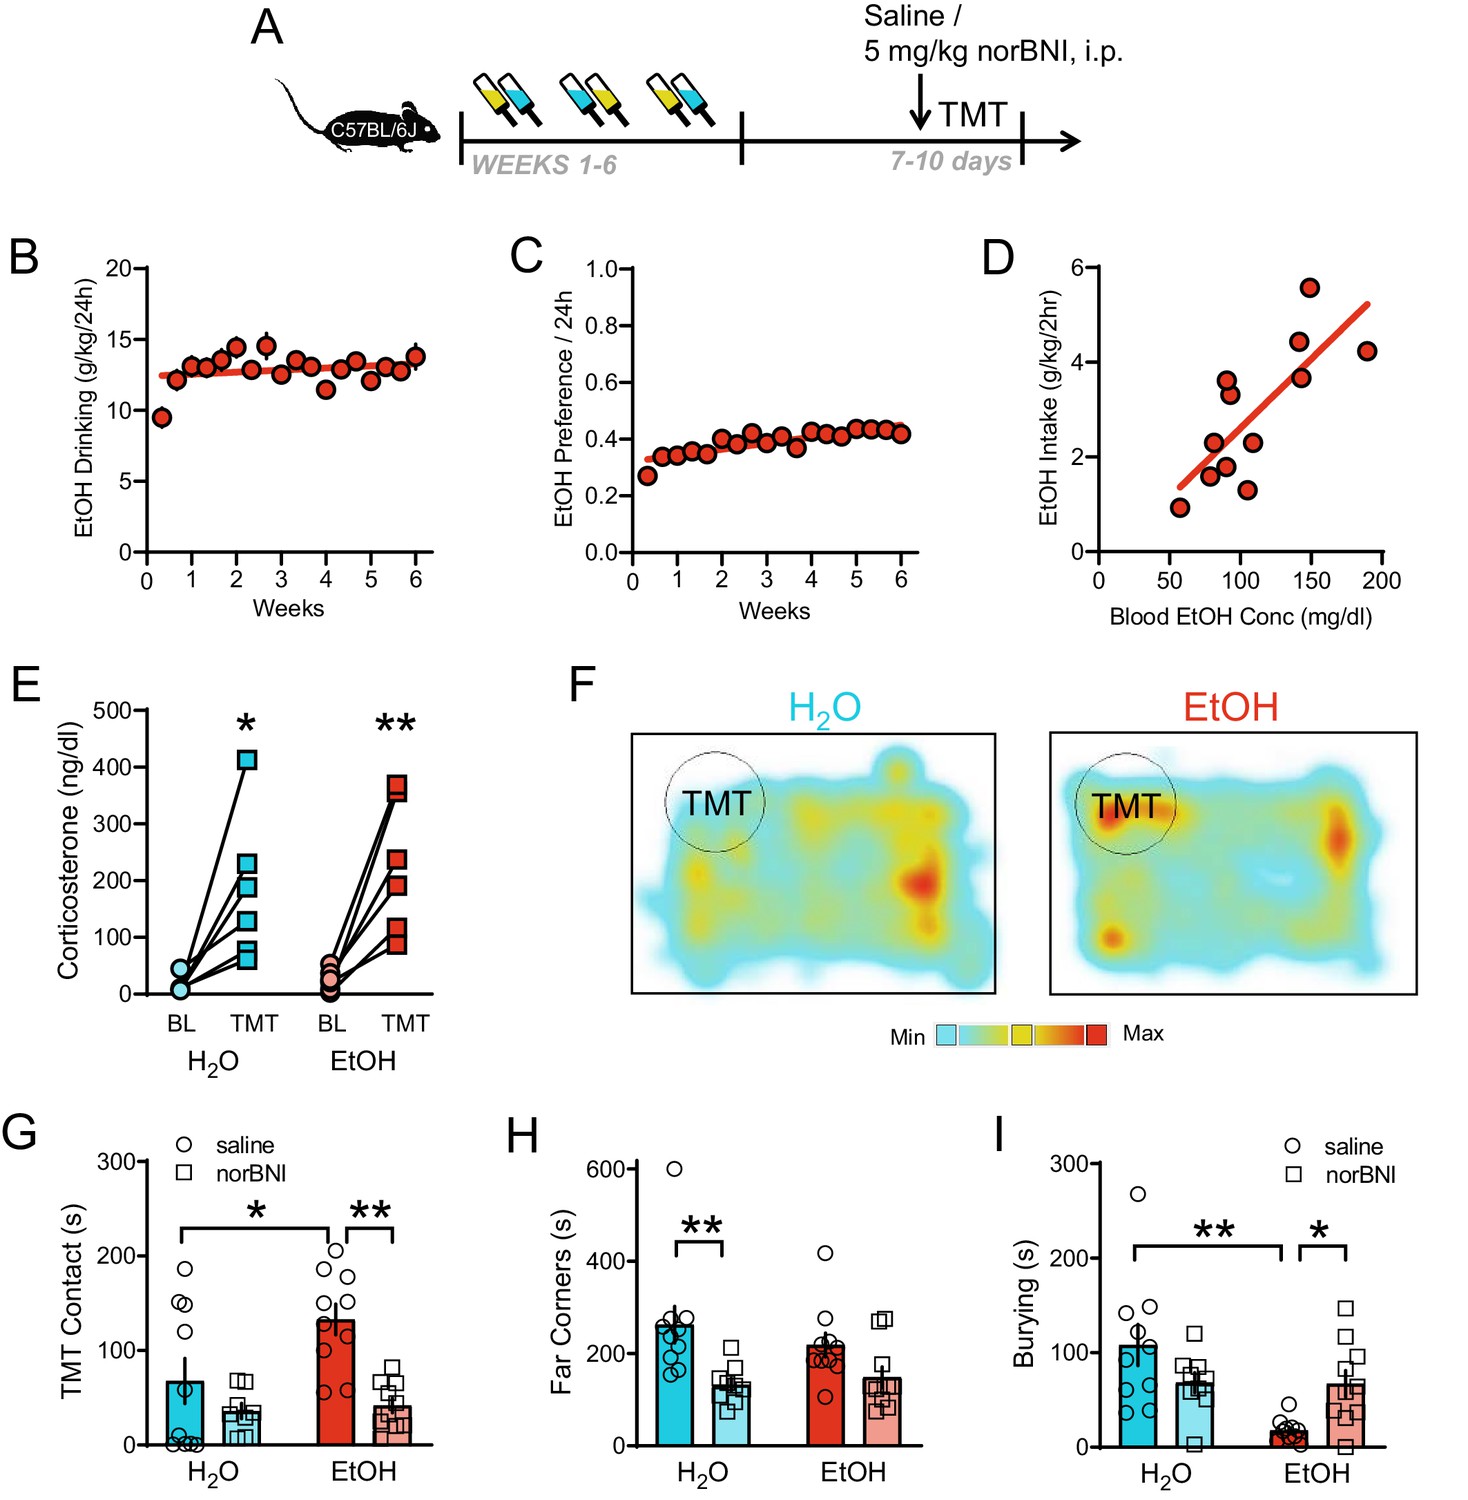
KOR regulation of responses to TMT predator odor after long-term alcohol drinking.
(A) Experimental protocol for 5 mg/kg i.p. KOR antagonist manipulation of predator odor behavior after intermittent EtOH. (B) EtOH drinking (g/kg/24 hr) and C) EtOH preference/24 hr of male C57BL/6J mice (n = 46 mice). (D) Blood EtOH concentrations (mg/dl) correlated with EtOH intake (g/kg/2 hr) in a subset of mice. (E) Plasma corticosterone (ng/dl) response 30 min after TMT exposure. (F) Representative heatmaps of individual H2O (left) and EtOH (right) spatial location in the 10 min test. The circle indicates TMT location. Red color indicates maximum time spent. Aqua color indicates minimum time spent. Pretreatment with norBNI affected: (G) TMT contact (sec), (H) Time spent in the far corners (sec), and (I) Burying (sec). *p<0.05, **p<0.01.
Figure 1—figure supplement 1
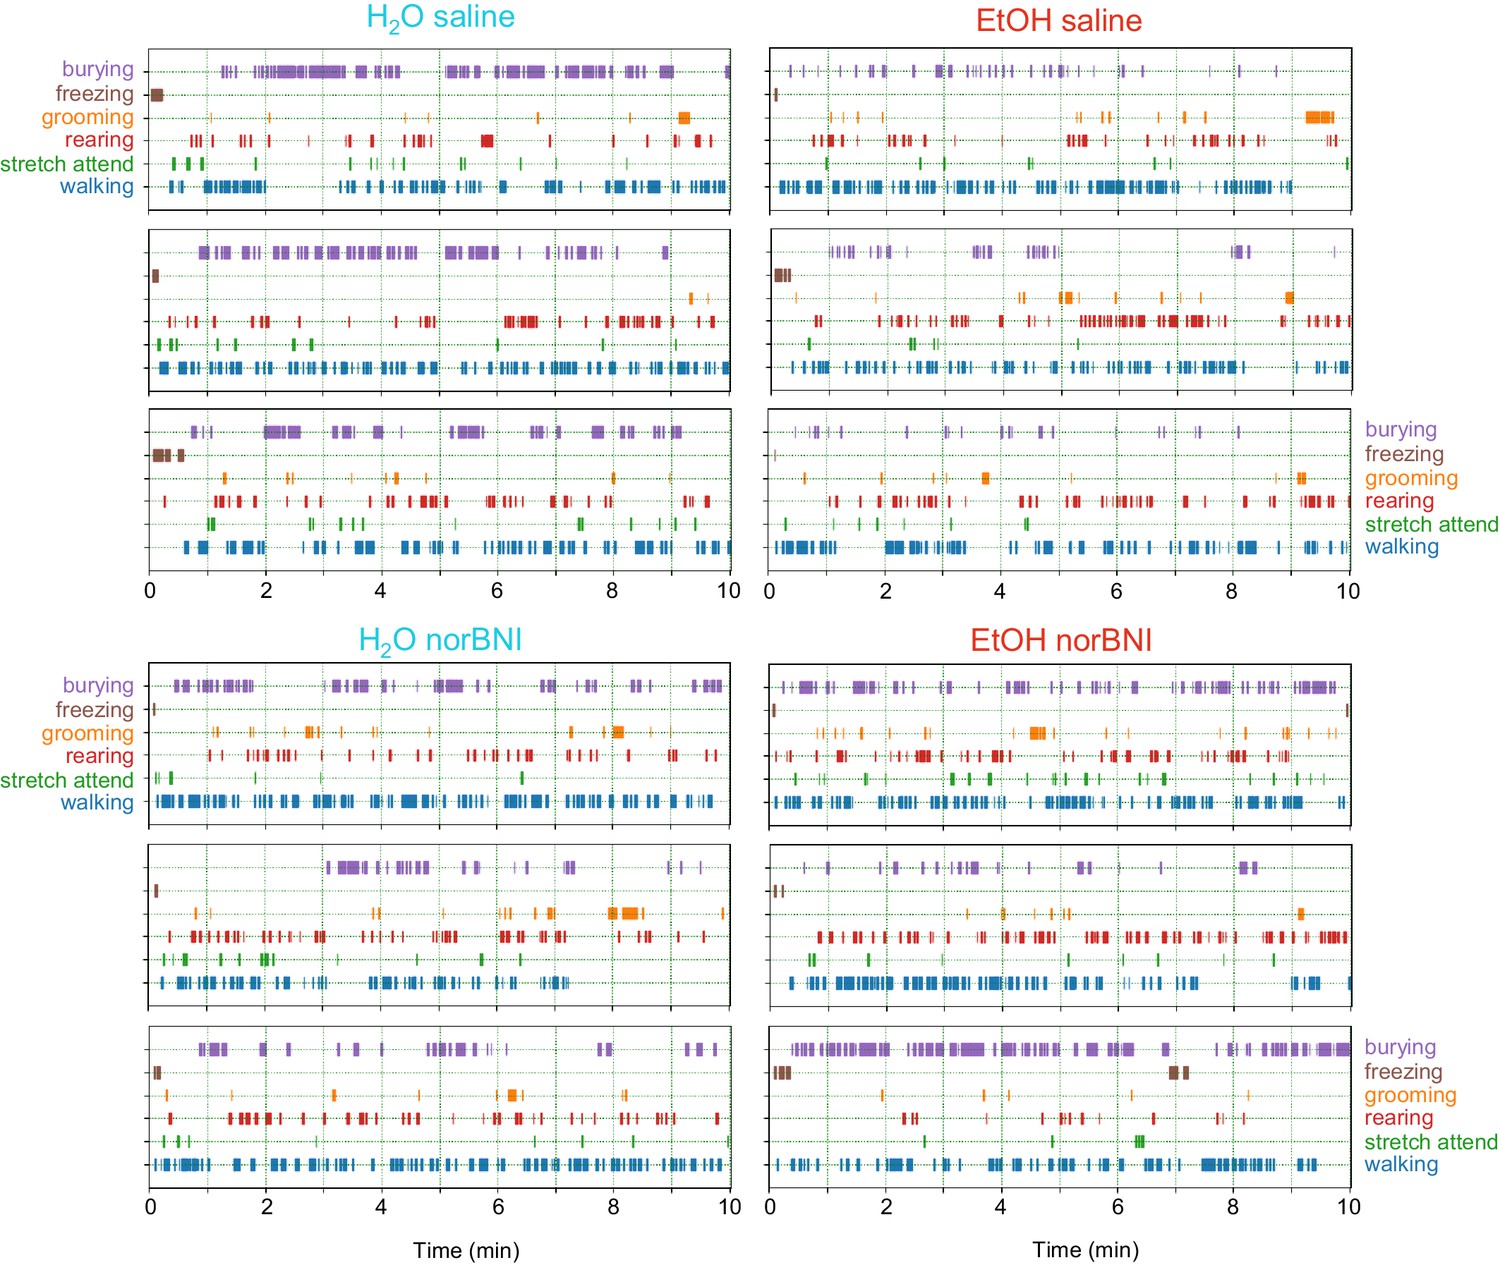
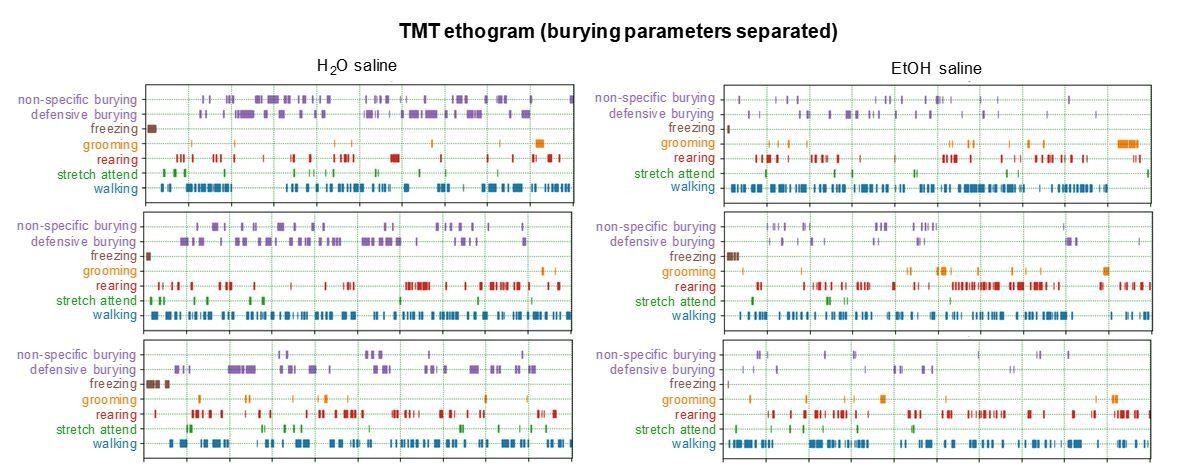
Home cage TMT predator odor ethograms.
Stress-related and exploratory behaviors were observed and plotted using BORIS behavioral software: burying (purple), freezing (brown), grooming (orange), rearing (red), stretch-attend (green), and walking (blue). H2O mice are in aqua on the left. EtOH mice are in red on the right. Saline-injected mice are the top plots over the 5 mg/kg norBNI-injected mice on the bottom. Ticks represent time and duration of behaviors during a 10 min test.
Figure 1—figure supplement 2

Elevated plus maze and peanut oil tests after intermittent EtOH during protracted withdrawal.
(A) Schematic of elevated plus maze (EPM) and home cage peanut oil trial after 6 weeks of EtOH exposure, where time (s) spent in the (B) open arms and (C) closed arms was assessed. (D) Representative heat maps of H2O and EtOH mice with peanut oil in the home cage. (E) Contact with the peanut oil and (F) time in the far corners. *p<0.05.
Figure 2
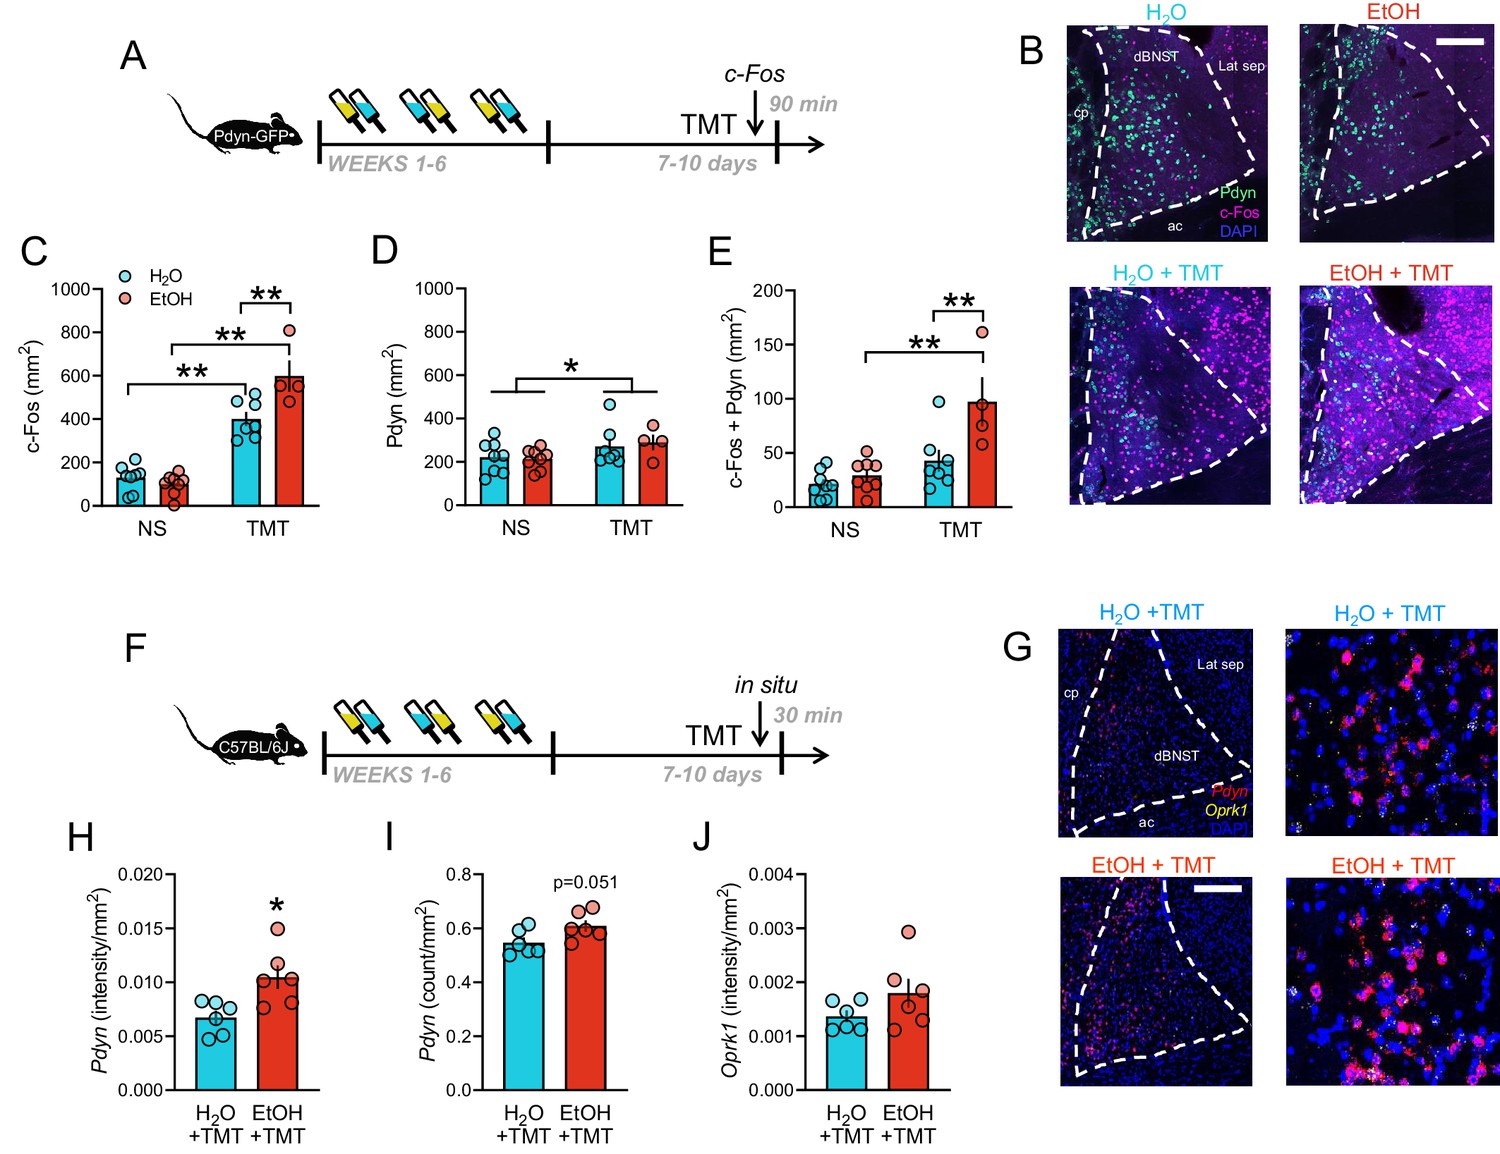
BNST as a critical site for prodynorphin neurons activated after stress during protracted withdrawal from alcohol.
(A) Schematic of obtaining BNST tissue for c-Fos immunohistochemistry 90 min post-TMT in Pdyn-GFP mice. (B) Representative images of Pdyn (green) and c-Fos Cy3 immunostaining (pseudocolored purple) in H2O (n = 8), EtOH (n = 8), H2O + TMT (n = 7), and EtOH + TMT (n = 4) conditions. Scale bar is 200 µm. cp = caudate putamen, ac = anterior commissure, Lat sep = lateral septum. (C) BNST c-Fos quantification (mm2). Aqua bars are H2O, red bars are EtOH. (D) Pdyn-GFP quantification (mm2). (E) Colocalization between c-Fos and Pdyn-GFP (mm2). (F) Schematic of obtaining BNST tissue for in situ hybridization 30 min post-TMT in C57BL/6J mice. (G) BNST images of Pdyn (pseudocolored red) Oprk1 (pseudocolored yellow) mRNA expression in H2O (n = 6) and EtOH (n = 6) mice after TMT. (H) Pdyn (intensity/mm2), (I) pdyn (counts/mm2), and (J) Oprk1 (intensity/mm2) are shown. *p<0.05. **p<0.01.
Figure 3 with 1 supplement
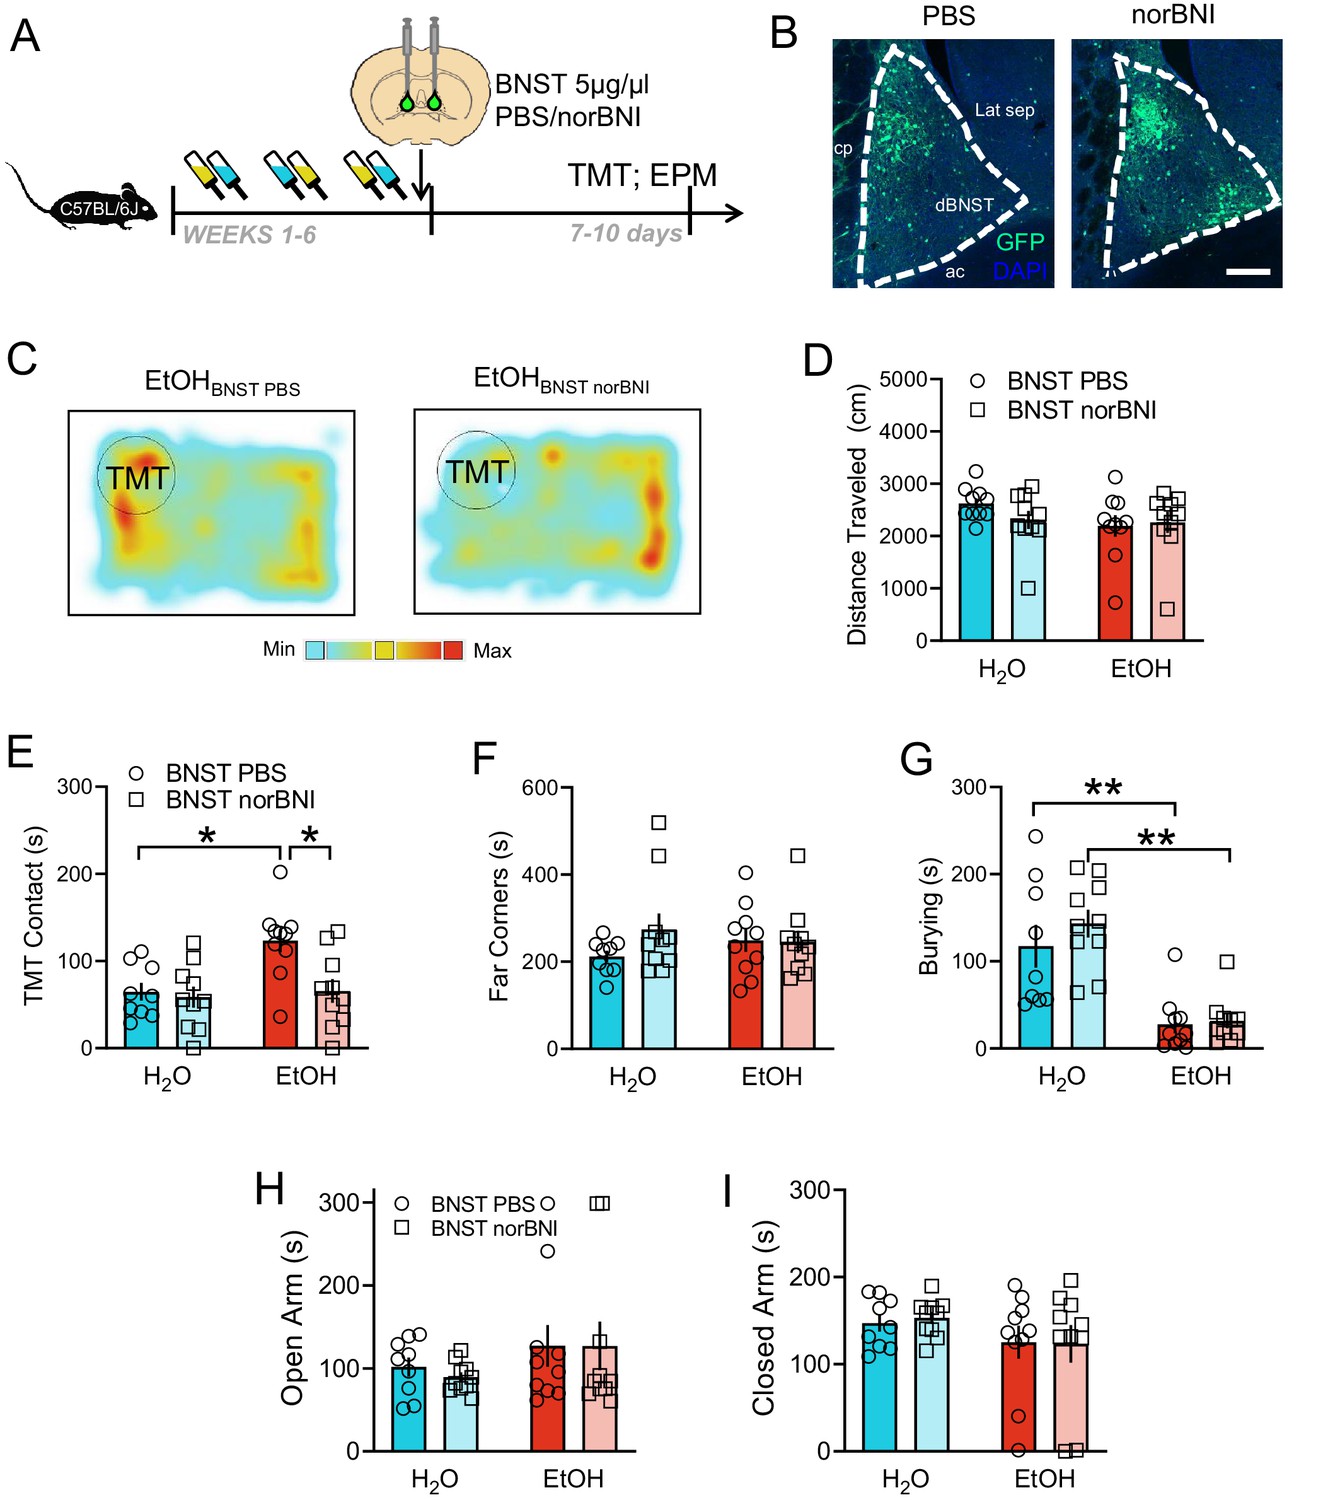
Role of BNST KOR in responses to predator odor after alcohol.
(A) Experimental design for 5 µg/µl norBNI in the BNST. (B) Representative images of BNST infusions of PBS (n = 9 H2O, n = 10 EtOH) and norBNI (n = 10 H2O, n = 10 EtOH) marked with GFP. Scale bar indicates 200 µM. (C) Representative heatmaps of TMT-induced activity with EtOH BNST PBS (left) and EtOH BNST norBNI (right). (D) Distance traveled during the TMT test. (E) TMT contact (sec), (F), time spent in the far corners (sec), and (G), burying (sec) during the TMT trial. Time spent in the (H), open arms (sec) and (I) closed arms (sec) of the elevated plus maze. *p<0.05. **p<0.01.
Figure 3—figure supplement 1
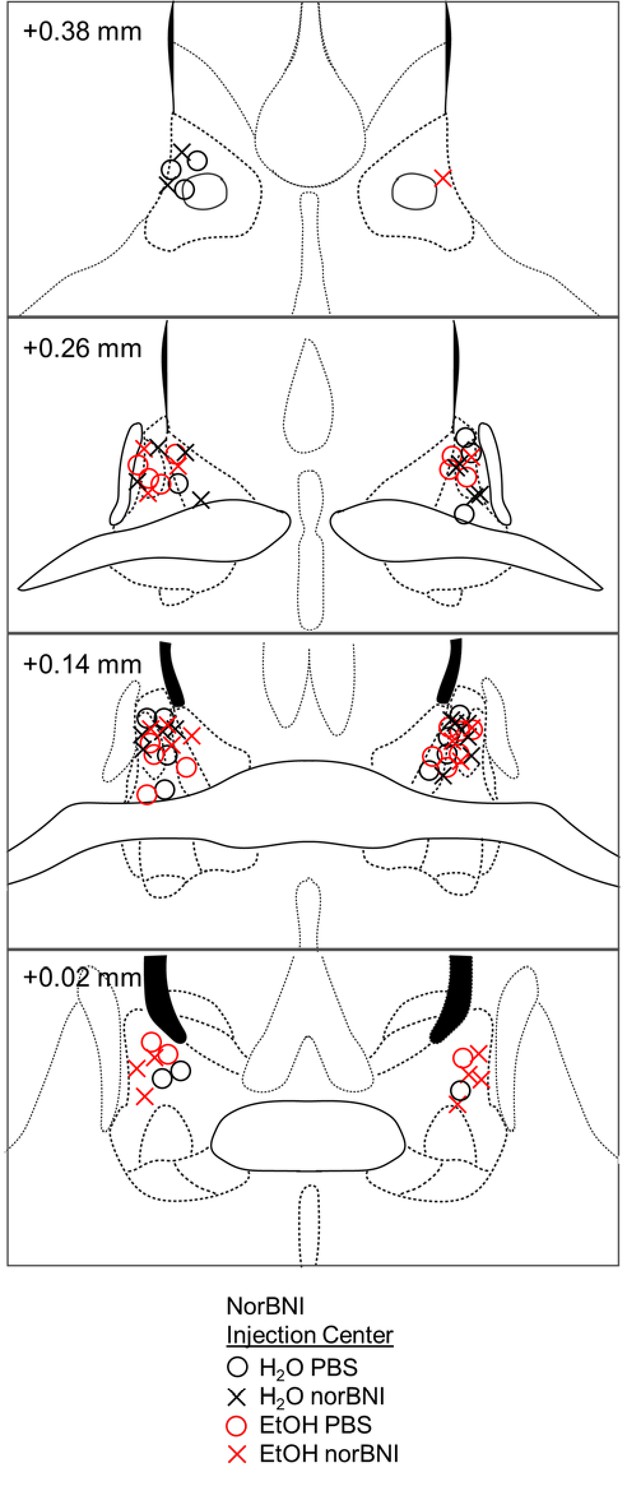
Histological verification of stereotaxic injections in male mice.
Correct placements of a single norBNI or PBS infusion are shown in coronal sections in millimeters from bregma surrounding the BNST of C57BL/6J mice. Circles represent the injection center of PBS, and crosses represent norBNI. Both groups had 10 nl GFP to mark the injection site.
Figure 4 with 1 supplement
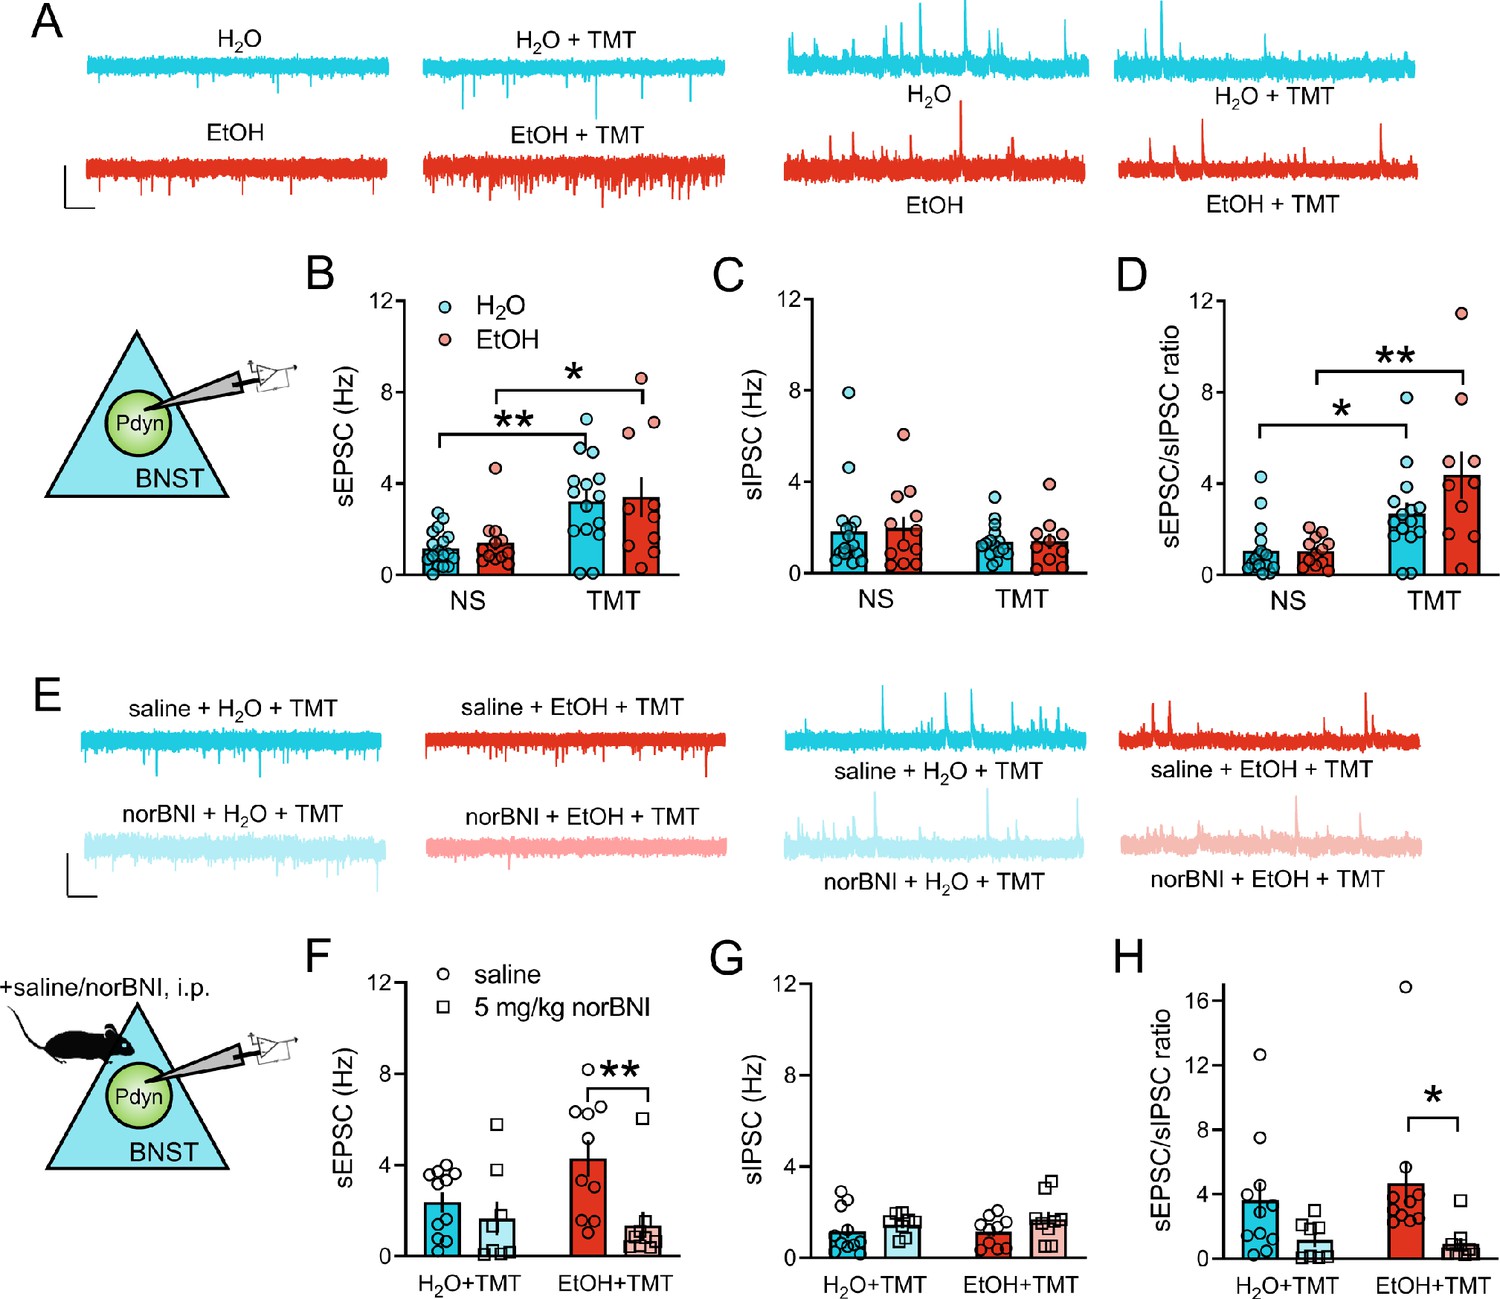
KOR regulation of increased synaptic transmission onto BNST Pdyn neurons after stress and EtOH.
(A) Representative traces of BNSTPDYN cell synaptic transmission in H2O (n = 6, 17 cells), EtOH (n = 4, 12 cells), H2O + TMT (n = 5, 15 cells), and EtOH + TMT (n = 4, 10 cells). Scale bar indicates 50 pA height and 1 s time. Spontaneous excitatory post-synaptic currents (sEPSC) are on the left, and spontaneous inhibitory post-synaptic currents (sIPSC) are on the right. (B) sEPSC frequency (Hz), (C) sIPSC frequency (Hz), and D), sEPSC/sIPSC ratio in dorsal BNST Pdyn cells. (E) Sample traces of BNSTPDYN cell synaptic transmission after 16 hr pretreatment with 5 mg/kg norBNI or saline, i.p. Aqua is saline + H2O + TMT (n = 4, 11 cells). Red is saline + EtOH + TMT (n = 4, 10 cells). Light aqua is norBNI + H2O + TMT (n = 3, 8 cells). Light red is norBNI + EtOH + TMT (n = 3, 9 cells). Scale bar equals 50 pA height and 1 s time. (F) sEPSC frequency (Hz). (G) sIPSC frequency (Hz). (H) sEPSC/sIPSC ratio. *p<0.05. **p<0.01.
Figure 4—figure supplement 1
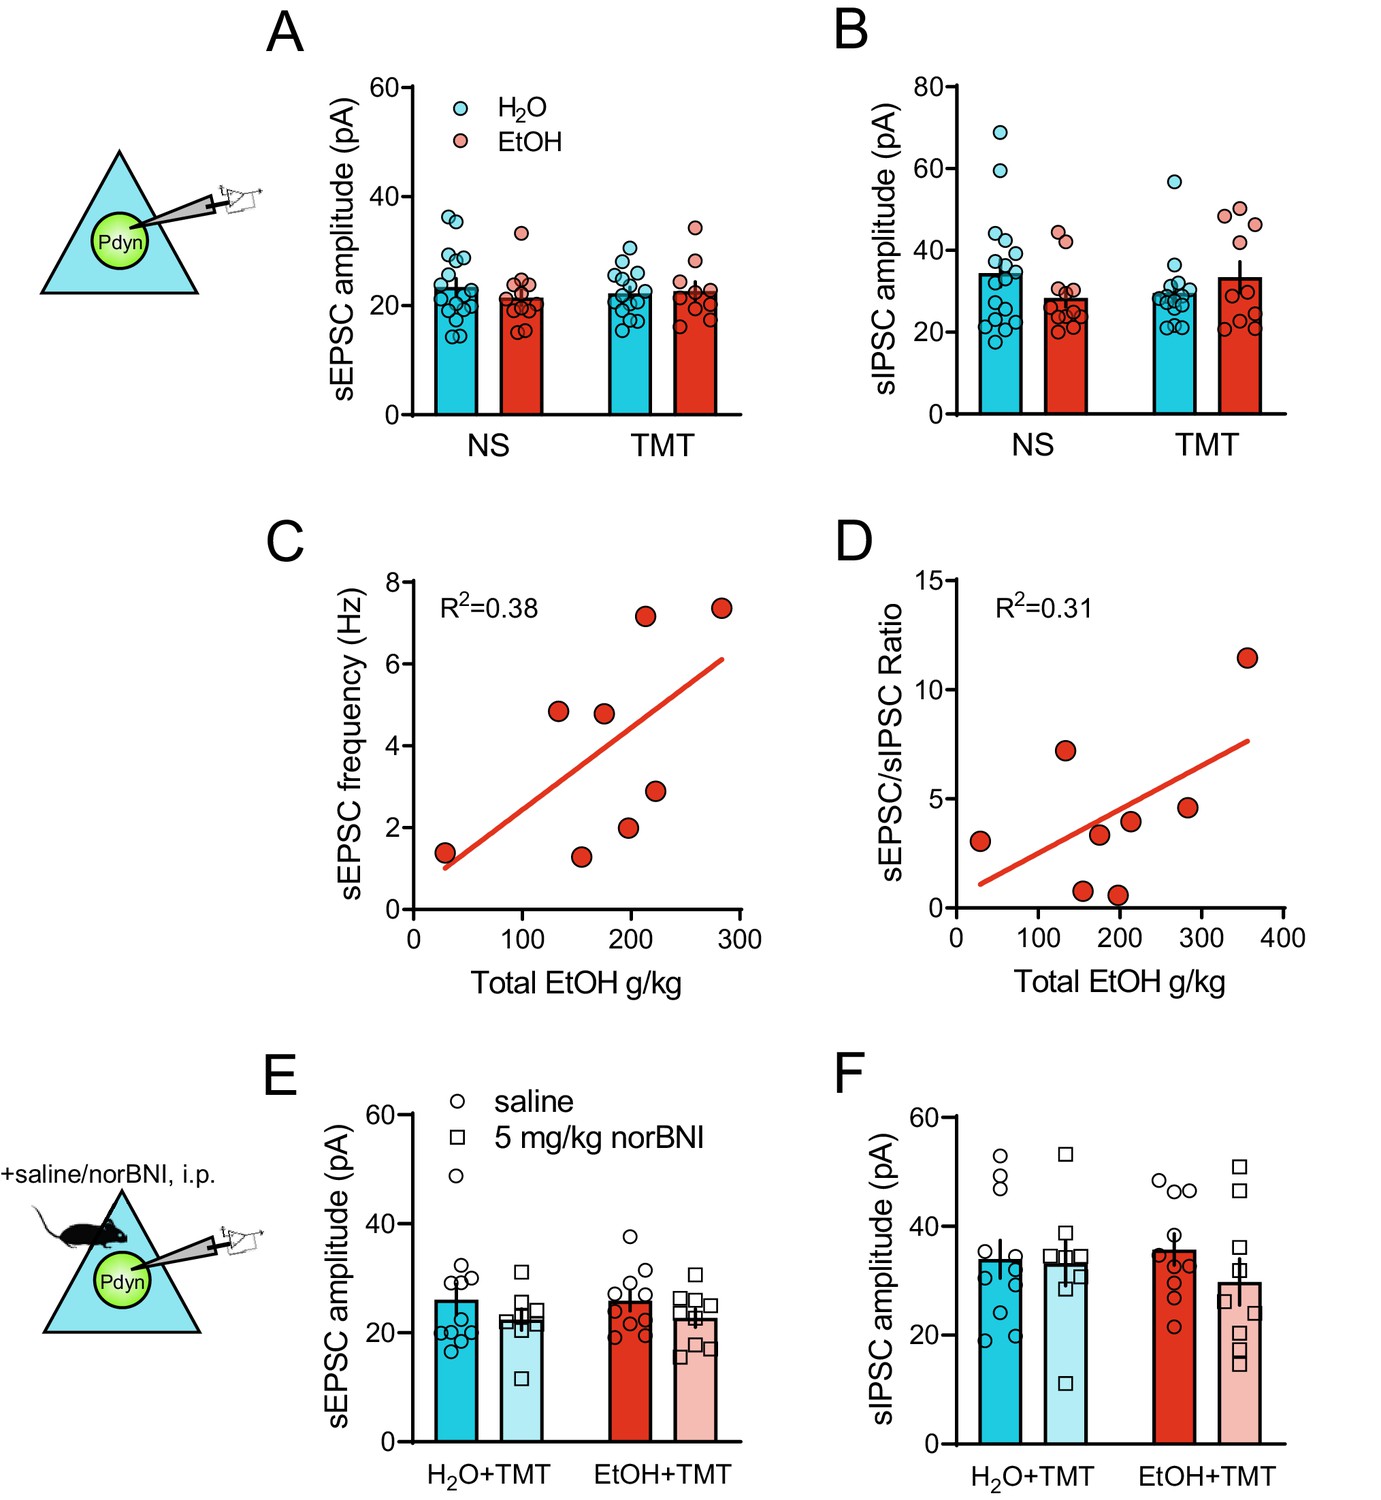
Additional synaptic transmission elements of BNST Pdyn neurons after TMT stress and EtOH drinking.
(A) TMT BNSTPDYN cell synaptic transmission sEPSC amplitude (pA). (B) sIPSC amplitude (pA). Correlation between cumulative, total EtOH (g/kg) across six weeks and (C) sEPSC frequency (Hz) and (D), sEPSC/sIPSC ratio in Pdyn-GFP mice after EtOH and TMT. (E) NorBNI pretreatment BNSTPDYN cell sEPSC amplitude (pA). (F) sIPSC amplitude (pA).
Figure 5 with 1 supplement
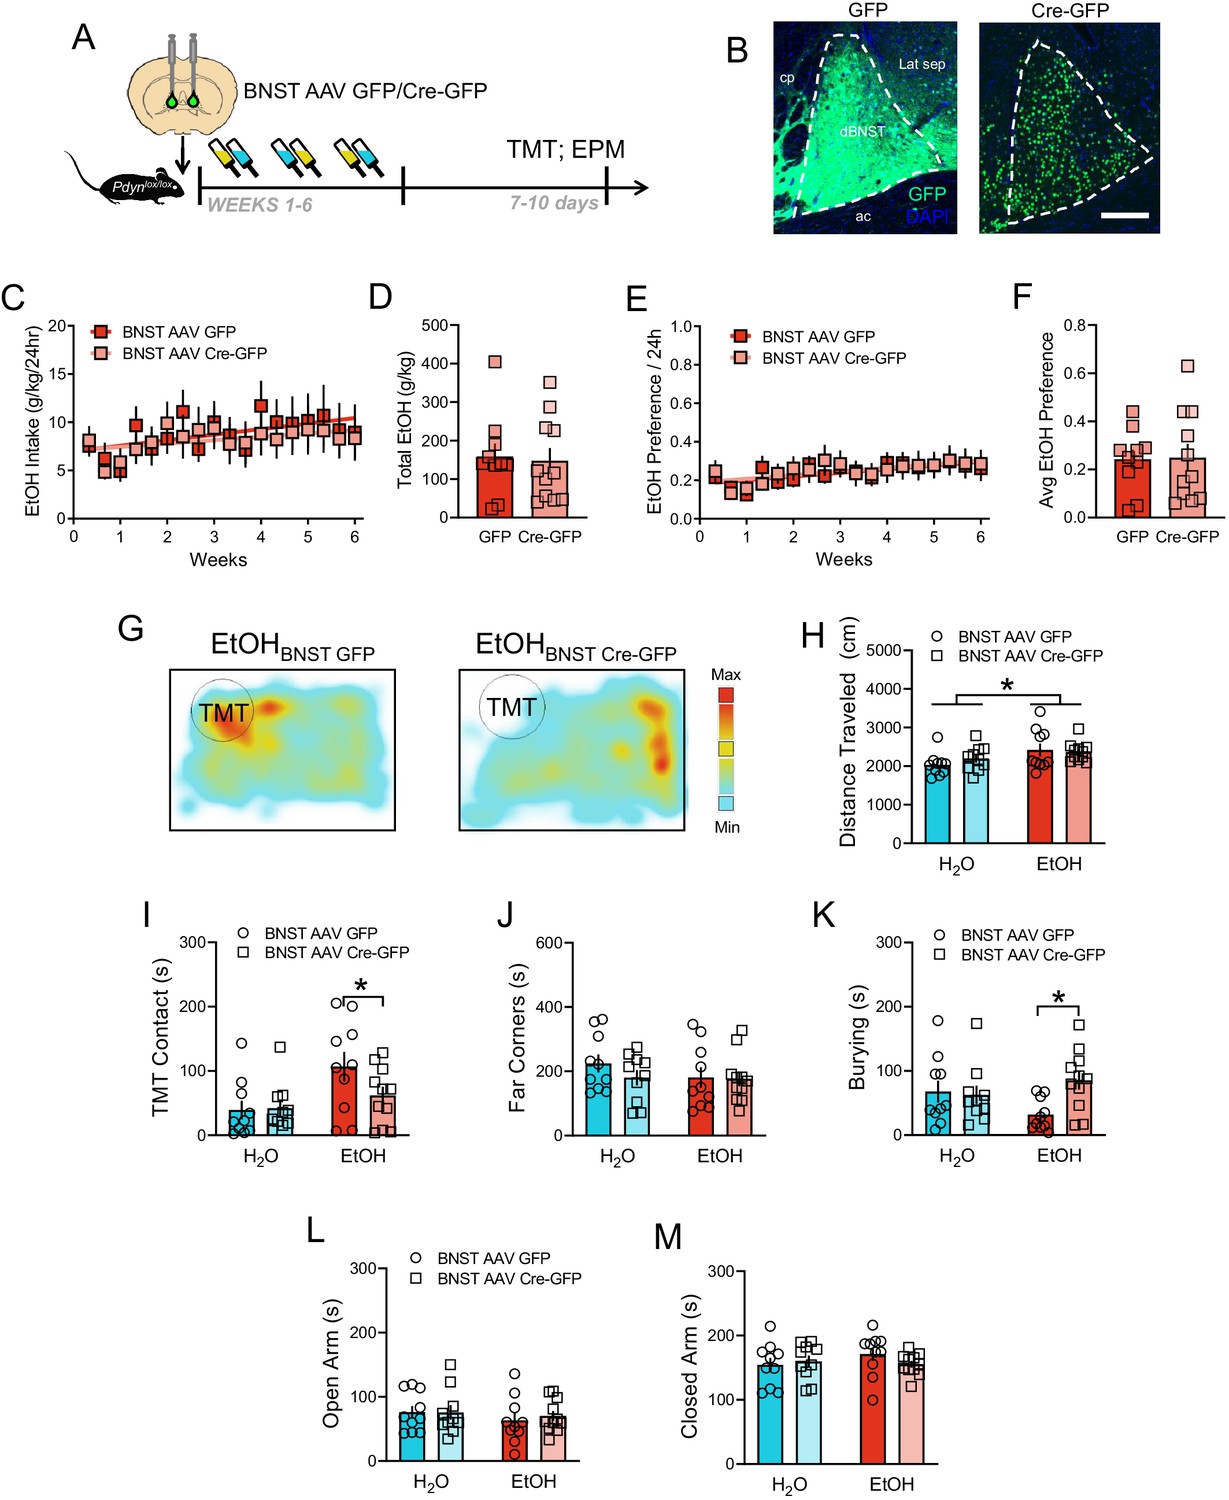
EtOH drinking and TMT responses after BNST Pdyn deletion.
(A) Time course of deletion of BNST Pdyn in Pdynlox/lox mice before EtOH and TMT. (B) Images of AAV-GFP and AAV-Cre-GFP expression (H2O GFP n = 10, Cre-GFP n = 10. EtOH GFP n = 10, EtOH Cre-GFP n = 11). Scale bar measures 200 µM. (C) Pdynlox/lox mice EtOH drinking (g/kg/24 hr) across 6 weeks with BNST GFP (red) or Cre-GFP (light red). (D) Cumulative EtOH drinking (g/kg) per group. (E) Average EtOH Preference ratio/24 hr per group across time. (F) Average EtOH Preference per mouse across the 6 weeks. (J) Pdynlox/lox mice daily EtOH preference across 6 weeks with BNST GFP (red) or Cre-GFP (light red). (K) Average EtOH preference per group. (G) Sample TMT heatmaps of EtOH BNST GFP (left) and EtOH BNST Cre-GFP (right) mice. In the TMT test, (H) distance traveled (cm), (I) TMT contact, (J) far corners (sec), and (K) burying (sec). In the elevated plus maze, duration in the (L) open arms (sec), and (M) closed arms (sec). *p<0.05.
Figure 5—figure supplement 1
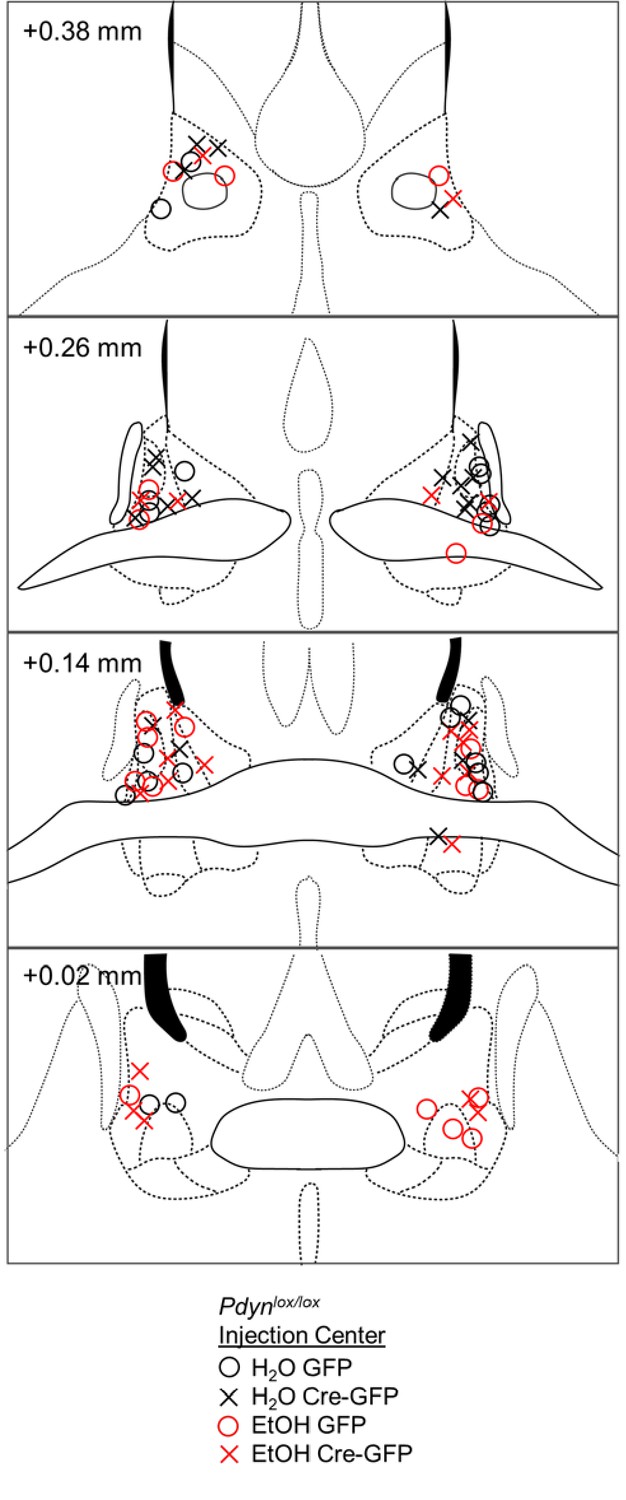
Histological verification of BNST Pdyn deletion.
Correct BNST placements of AAV-Cre-GFP or AAV-GFP infusion are shown in coronal sections in millimeters from bregma in a floxed Pdyn mouse line. Injection centers are represented by circles for GFP or crosses for Cre-GFP.
Figure 6 with 1 supplement
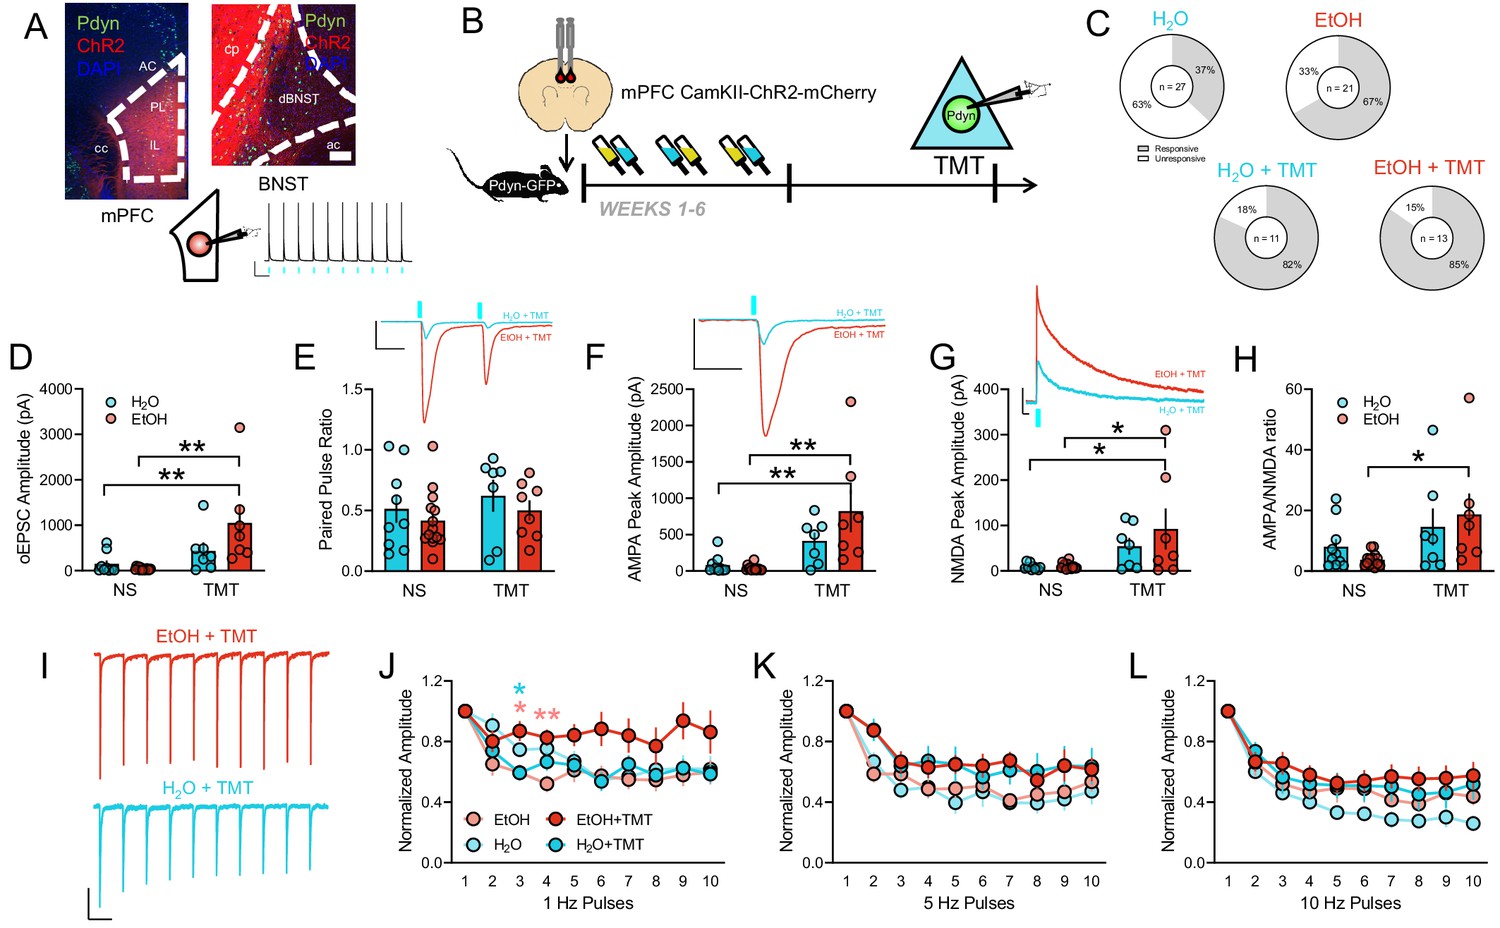
Cortical input onto BNSTPDYN cells gates stress-enhanced glutamatergic plasticity after history of alcohol.
(A) Image of CamKII-ChR2-mCherry expression in the mPFC (left) and at BNST terminals (right). Pdyn-GFP cells are green. Inset photo scale bars measure 100 µm. Representative traces of optically-evoked mPFC action potentials at 1 Hz. Blue rectangles indicate 470 nm LED onset. Scale bar indicates 20 mV and 1 s. (B) Experimental design testing synaptic connectivity of mPFC input to BNSTPDYN cells using channelrhodopsin (ChR2) after EtOH and TMT. (C) Proportions of light-responsive (white) and non-light-responsive (grey) BNSTPDYN cells to optically evoked EPSC in H2O (10/27 responsive cells, n = 7), EtOH (14/21 responsive cells, n = 5), H2O + TMT (9/11 responsive cells, n = 4), and EtOH + TMT (11/13 responsive cells, n = 4) groups. (D) mPFC-BNSTPDYN oEPSC amplitude (pA). (E) Paired pulse ratio. Inset example traces of H2O + TMT (aqua) and EtOH + TMT (red) with blue LED onset. Scale bar indicates 200 pA height and 50 ms time. (F) AMPA peak amplitude (pA). Inset AMPA traces of H2O + TMT (aqua) and EtOH + TMT (red) with blue LED onset. Scale bar indicates 200 pA height and 50 ms time. (G) NMDA peak amplitude (pA). Inset NMDA traces of H2O + TMT (aqua) and EtOH + TMT (red) with blue LED onset. Scale bar indicates 200 pA height and 50 ms time. (H) AMPA/NMDA ratio. (I) Representative traces of 1 Hz pulse trains in EtOH + TMT (red) and H2O + TMT (aqua) BNSTPDYN cells. Scale bar indicates 200 pA height and 1 s time. oEPSC normalized amplitude across (J) 1 Hz, (K) 5 Hz, and (L) 10 Hz pulse trains. *p<0.05. **p<0.01.
Figure 6—figure supplement 1
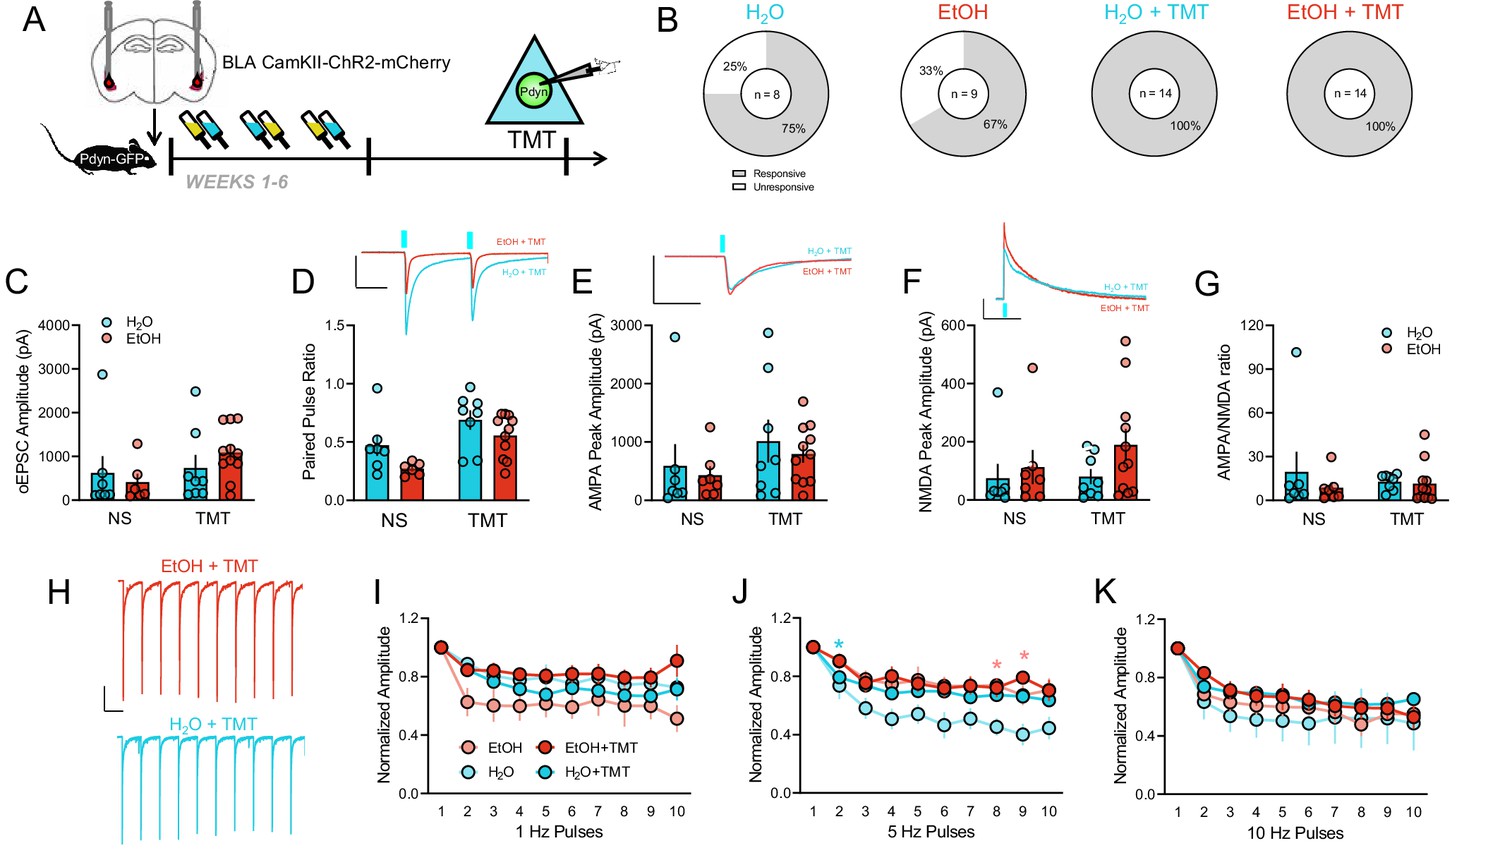
Basolateral amygdala input onto BNSTPDYN cells after history of alcohol and TMT exposure.
(A) Experimental design testing synaptic connectivity of basolateral amygdala (BLA) input to BNSTPDYN cells using channelrhodopsin (ChR2) after EtOH and TMT. (B) Proportions of light-responsive (white) and non-light-responsive (grey) BNSTPDYN cells to optically-evoked EPSC in H2O (6/8 responsive cells, n = 3), EtOH (6/9 responsive cells, n = 4), H2O + TMT (14/14 responsive cells, n = 4), and EtOH + TMT (14/14 responsive cells, n = 4) groups. (C) BLA-BNSTPDYN oEPSC amplitude (pA). (D) Paired pulse ratio. Inset example traces of H2O + TMT (aqua) and EtOH + TMT (red) with blue LED onset. Scale bar indicates 500 pA height and 50 ms time. (E) AMPA peak amplitude (pA). Inset AMPA traces of H2O + TMT (aqua) and EtOH + TMT (red) with blue LED onset. Scale bar indicates 1000 pA height and 50 ms time. (F) NMDA peak amplitude (pA). Inset NMDA traces of H2O + TMT (aqua) and EtOH + TMT (red) with blue LED onset. Scale bar indicates 200 pA height and 500 ms time. (G) AMPA/NMDA ratio. (H) Representative traces of 1 Hz pulse trains in EtOH + TMT (red) and H2O + TMT (aqua) BNSTPDYN cells. Scale bar indicates 200 pA height and 1 s time. oEPSC normalized amplitude across (I) 1 Hz, (J) 5 Hz, and (K) 10 Hz pulse trains. *p<0.05.
Figure 7 with 1 supplement

DREADD-mediated inhibition of mPFC-BNST pathway and assessment of EtOH drinking and TMT-related behaviors.
(A) Time course of mPFC-BNST chemogenetic strategy in C57BL/6J mice before EtOH and TMT. (B) Images of AAV-hM4Di-mCherry expression in mPFC cell bodies, left, and BNST terminals, right (H2O mCherry n = 7, H2O hM4Di-mCherry n = 7. EtOH mCherry n = 8, EtOH hM4Di-mCherry n = 7). mCherry was enhanced with a GFP immunostain. Slice physiology validation of the DREADD strategy, in mPFC neurons, as represented by (C), hyperpolarization of resting membrane potential after CNO bath application. Inset scale bar indicates 2 mV height and 30 s time. (D) Latency to action potential threshold before and after CNO with 100 pA current ramp steps. Scale bar indicates 20 pA height and 100 ms time. (E) EtOH drinking (g/kg/24 hr) across 6 weeks with mPFC-BNST hM4Di (red) or mCherry (light red). EtOH intake (g/kg) across (F) 1 hr, (G) 4 hr, and (H) 24 hr after i.p. saline (circles) or 3 mg/kg CNO (diamonds). (I) Sample TMT heatmaps of EtOH mPFC-BNST mCherry (left) and EtOH mPFC-BNST hM4Di (right) mice. In the TMT test, (J) distance traveled (cm), (K) TMT contact, (L), far corners (sec), and (M), burying (sec). In the elevated plus maze, duration in the (N), open arms (sec), and (O), closed arms (sec). *p<0.05.
Figure 7—figure supplement 1
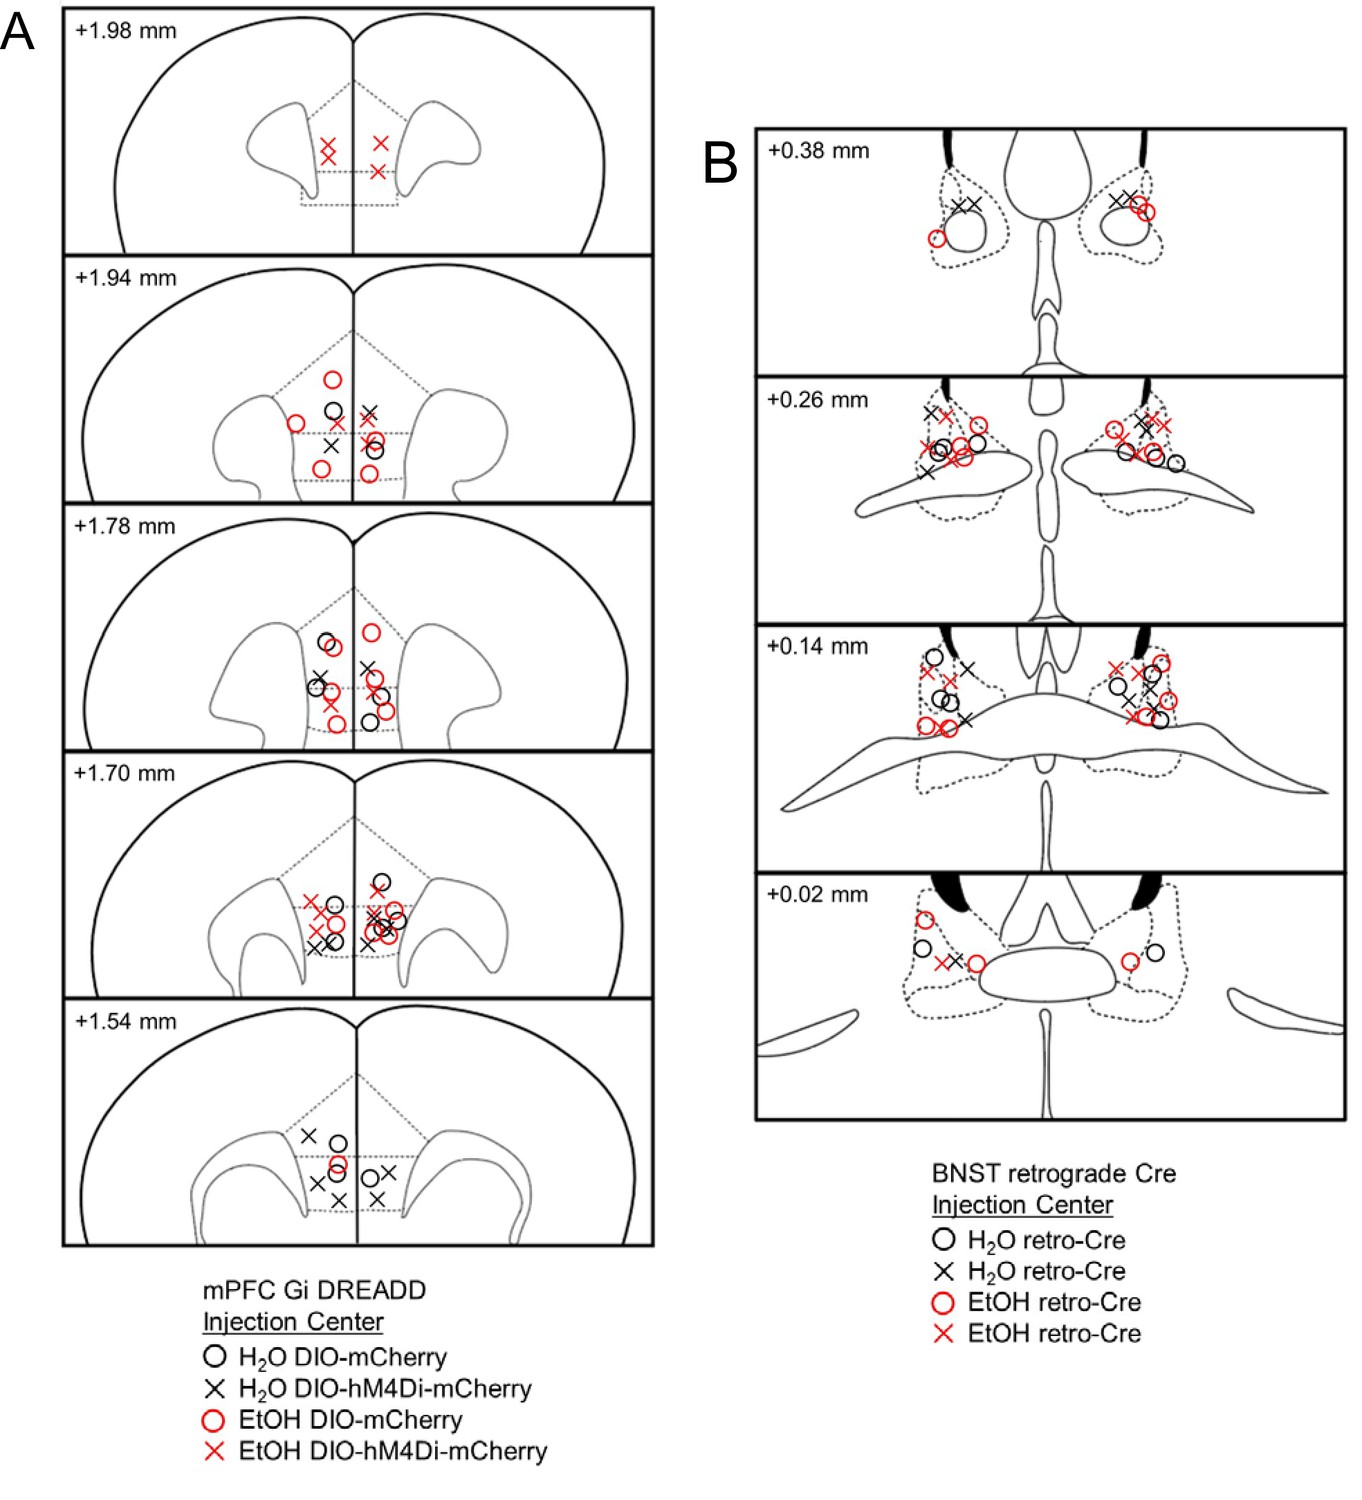
Histological verification of multiplexed DREADD injection sites.
(A) mPFC placements of AAV-DIO-hM4Di-mCherry or AAV-DIO-mCherry and, (B) BNST placements of retrograde AAV-Cre infusion are shown in coronal sections in millimeters from bregma in C57BL/6J mice. Injection centers are represented by circles for mCherry or crosses for hM4Di-mCherry.
Author response image 1
Author response image 2
Tables
Key resources table
| Reagent type (species) or resource | Designation | Source or reference | Identifiers | Additional information |
|---|---|---|---|---|
| Strain, strain background (Mus musculus male) | C57BL/6J | Jackson Laboratories | B6/J | Stock # 000664 |
| Strain, strain background (Mus musculus male) | PdynIRES-Cre | Jackson Laboratories | B6;129S-Pdyntm1.1(cre)Mjkr/LowlJ | Stock # 027958 |
| Strain, strain background (Mus musculus male) | EGFP-L10a | Jackson Laboratories | B6;129S4-Gt(ROSA) 26Sortm9(EGFP/Rpl10a)Amc/J | Stock # 024750 |
| Strain, strain background (Mus musculus male) | Pdynlox/lox | Bloodgood et al., 2020 | ||
| Antibody | anti-c-Fos (Rabbit polyclonal) | Millipore | Cat# ABE457, RRID:AB_2631318 | (1:3000) |
| Antibody | anti-rabbit horse radish peroxidase-conjugated IgG (Goat polyclonal) | PerkinElmer | Cat# NEF812001EA, RRID:AB_2571640 | (1:200) |
| Antibody | anti-mCherry (Chicken polyclonal) | Abcam | Cat# ab205402, RRID:AB_2722769 | (1:500) |
| Antibody | Alexa Fluor 488 anti-chicken (Donkey polyclonal) | Jackson Immuno Research Laboratories | Cat# 703-545-155, RRID:AB_2340375 | (1:200) |
| Strain, strain background (AAV) | AAV5-CamKII-Cre-eGFP | UNC Vector Core | Lot 6450 | |
| Strain, strain background (AAV) | AAV5-CamKII-eGFP | UNC Vector Core | Lot 4621B | |
| Strain, strain background (AAV) | AAV5-CamKIIa-hChR2(H134R)-mCherry-WPRE-hGH | Addgene | Lot CS1096 | |
| Strain, strain background (AAV) | AAV8-hSyn-DIO-hM4D(Gi)-mCherry | Addgene | Lot 6048 | |
| Strain, strain background (AAV) | AAV2retro-SL1-CAG-Cre | Janelia | Custom Prep | |
| Sequence-based reagent | Mm-Oprk1 | ACDbio | 316111 | |
| Sequence-based reagent | Mm-Pdyn | ACDbio | 318771 | |
| Commercial assay or kit | TSA amplification kit with Cy3 | PerkinElmer | Cat# NEL744001KT | (1:50) |
| Commercial assay or kit | RNAscope Florescent Multiplex Assay | ACDbio | ||
| Commercial assay or kit | Corticosterone ELISA Kit | Arbor Assays | ||
| Chemical compound, drug | norBNI | Tocris | Cat# 0347 | |
| Chemical compound, drug | CNO | Hello Bio | Cat# HB6149 | |
| Software, algorithm | Prism 8 | GraphPad | ||
| Software, algorithm | ClampFit 10.7 | Molecular Devices | ||
| Software, algorithm | Ethovision XT | Noldus | ||
| Software, algorithm | BORIS | Friard and Gamba | DOI:10.1111/2041-210X.12584 | |
| Other | TMT | BioSRQ | Cat# 1G-TMT-97 | |
| Other | Peanut oil | Harris Teeter |
Additional files
Download links
A two-part list of links to download the article, or parts of the article, in various formats.
Downloads (link to download the article as PDF)
Open citations (links to open the citations from this article in various online reference manager services)
Cite this article (links to download the citations from this article in formats compatible with various reference manager tools)
RETRACTED: Alcohol drinking alters stress response to predator odor via BNST kappa opioid receptor signaling in male mice
eLife 9:e59709.
https://doi.org/10.7554/eLife.59709


