Cell-density independent increased lymphocyte production and loss rates post-autologous HSCT
- Center for Translational Immunology, University Medical Center Utrecht, Netherlands
- Department of Experimental Immunology, Amsterdam UMC, University of Amsterdam, Netherlands
- Department of Hematology, University Medical Center Utrecht, Netherlands
- Department of Immunology and Pathology, Monash University and Alfred Hospital, Australia
- Theoretical Biology, Utrecht University, Netherlands
Figures
Figure 1 with 1 supplement
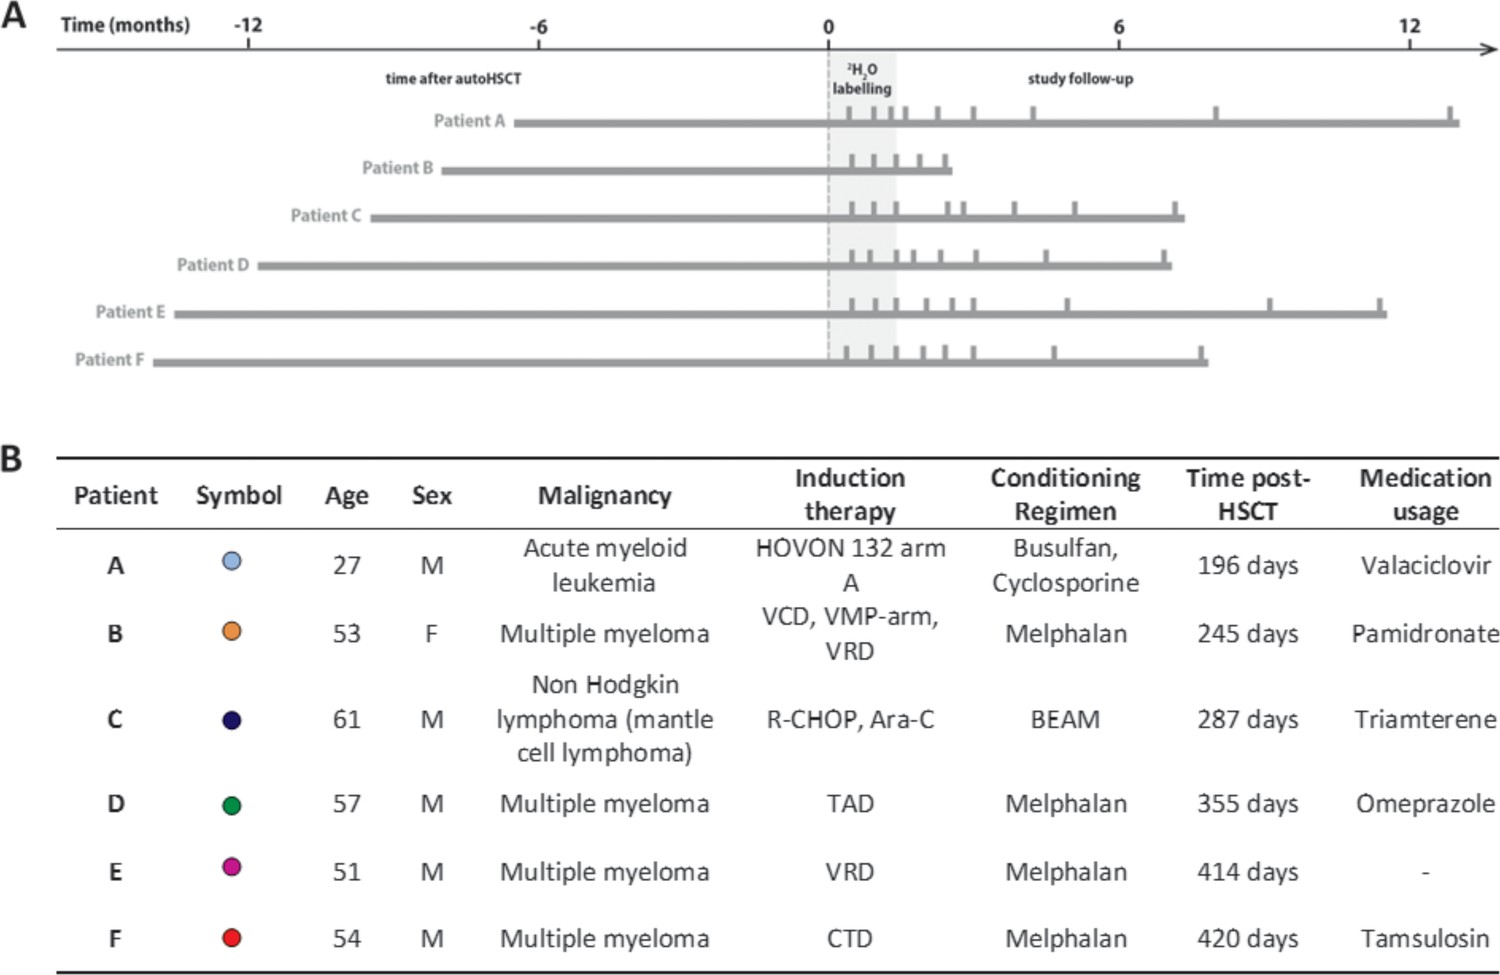
Study protocol timeline and patient characteristics.
(A) Summary figure depicting the study time line of every patient. Patients are centered by start of 2H2O labeling. The left bar indicates the time between the autologous hematopoietic stem cell transplantation (autoHSCT) and the start of the labeling period, the gray area indicates the 6 weeks 2H2O labeling period, the right bar provides the follow-up period, and the vertical bars indicate the blood sampling time points. (B) Patient characteristics. Age=age at start 2H2O labeling; M=male; F=female; Time post-HSCT=reconstitution period at start 2H2O labeling; Medication usage=medication during the study; HOVON 132 arm A (Idarubicin, Ara-C (Cytarabine), Daunorubicin); VCD (Bortezomib, Cyclophosphamide, Dexamethason); VMP (Bortezomib, Melphalan, Prednisone); VRD (Bortezomib, lenalidomide, dexamethasone); R-CHOP (Rituximab, Cyclophosphamide, Adriamycin, Vincristin, Prednisone); Ara-C (Cytarabine), TAD (Thalidomide, Adriamycin, Dexamethasone); CTD (Carfilzomib, Thalidomide, Dexamethasone); BEAM (Carmustine, Etoposide, Ara-C [Cytarabine], Melphalan). Figure 1—figure supplement 1 shows the absolute leukocytes, neutrophils, lymphocytes, and monocytes numbers over time after autoHSCT.
Figure 1—figure supplement 1
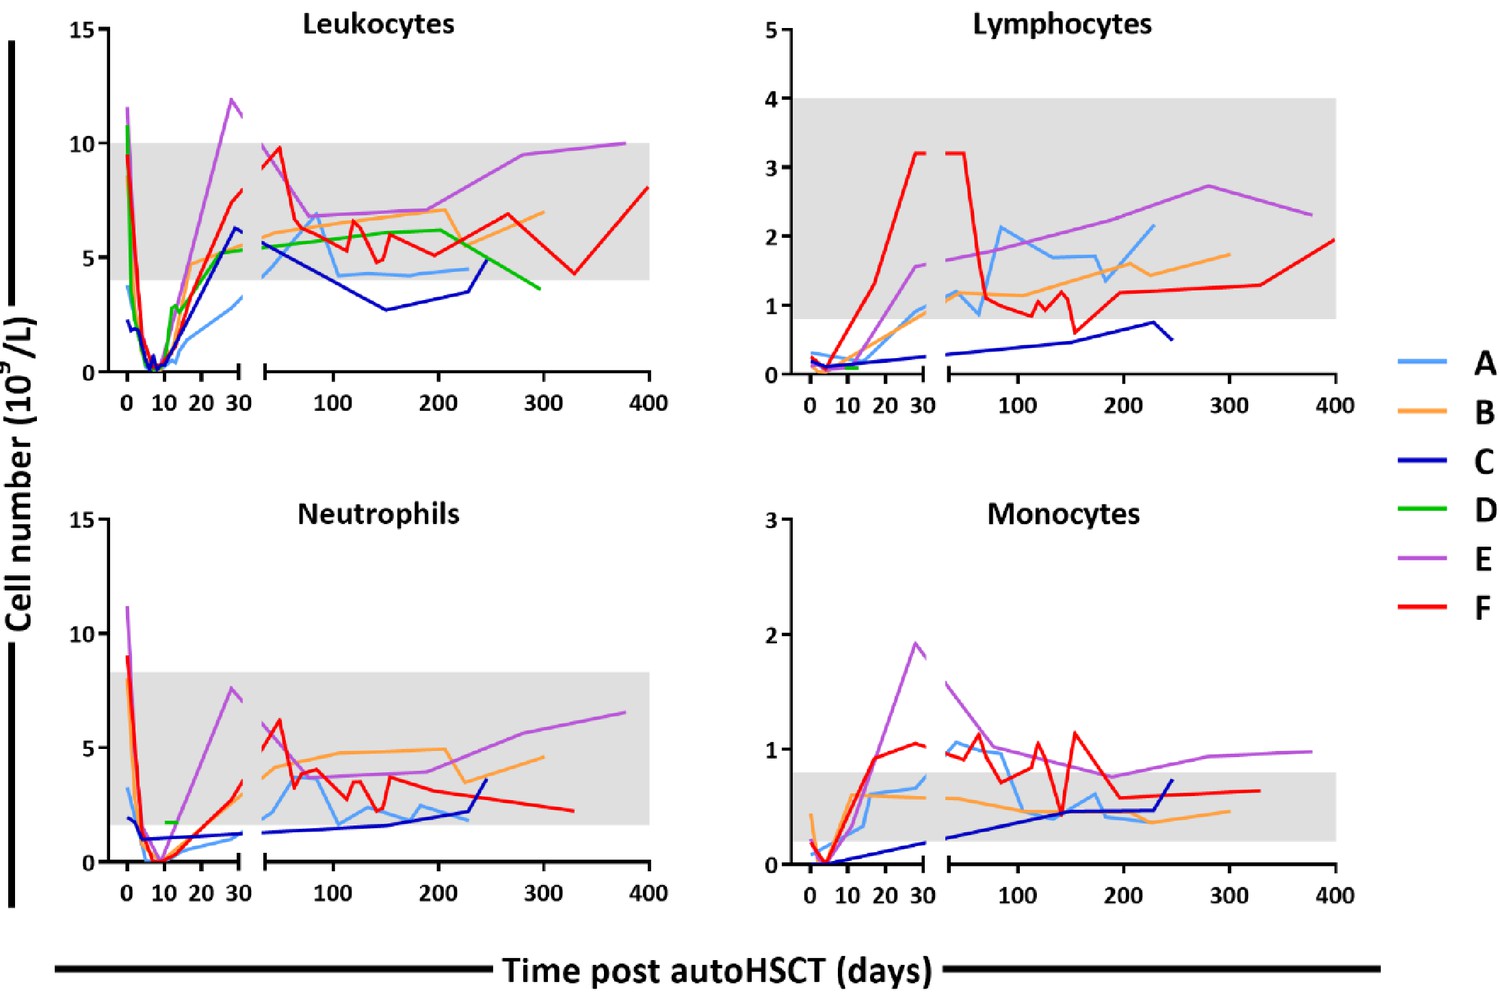
Absolute numbers (cells × 109 per liter of blood) of leukocytes, neutrophils, lymphocytes, and monocytes in peripheral blood of autologous hematopoietic stem cell transplantation (autoHSCT) patients (patients A–F) over time after autoHSCT obtained by automated blood leukocyte differential count (leukodiff).
Gray areas show the range of healthy individuals’ values.
Figure 2
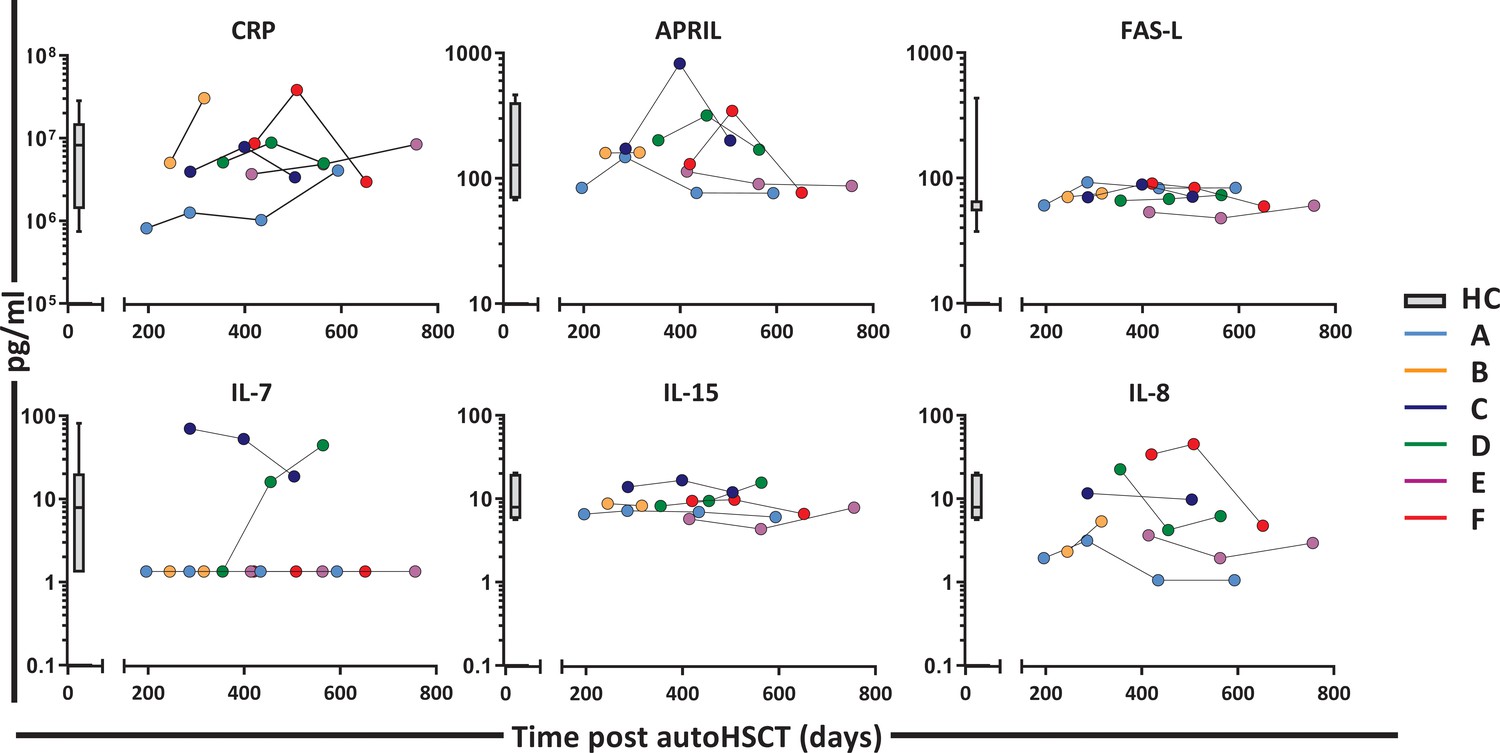
Plasma levels of CRP, APRIL, FAS-L, IL-7, IL-15, and IL-8 post-autologous hematopoietic stem cell transplantation (autoHSCT).
Plasma concentration (picogram per milliliter) of CRP (C-reactive protein), APRIL (A proliferation-inducing ligand), FAS-L (FAS ligand), IL-7 (Interleukin 7), IL-15 (Interleukin 15), and IL-8 (Interleukin 8) in patients A–F at different time points after autoHSCT. Box plots represent the distribution of values for healthy controls (n = 29, box = 25th to 75th percentile, black line=median, whiskers=min and max values). IL-7 levels which were below the level of detection (1.3 pg/ml) were set at 1. Figure 2—source data 1 shows the individual values of the different plasma markers.
-
Figure 2—source data 1
Luminex data for different plasma markers, time points and patients.
- https://cdn.elifesciences.org/articles/59775/elife-59775-fig2-data1-v2.xls
Figure 3 with 3 supplements
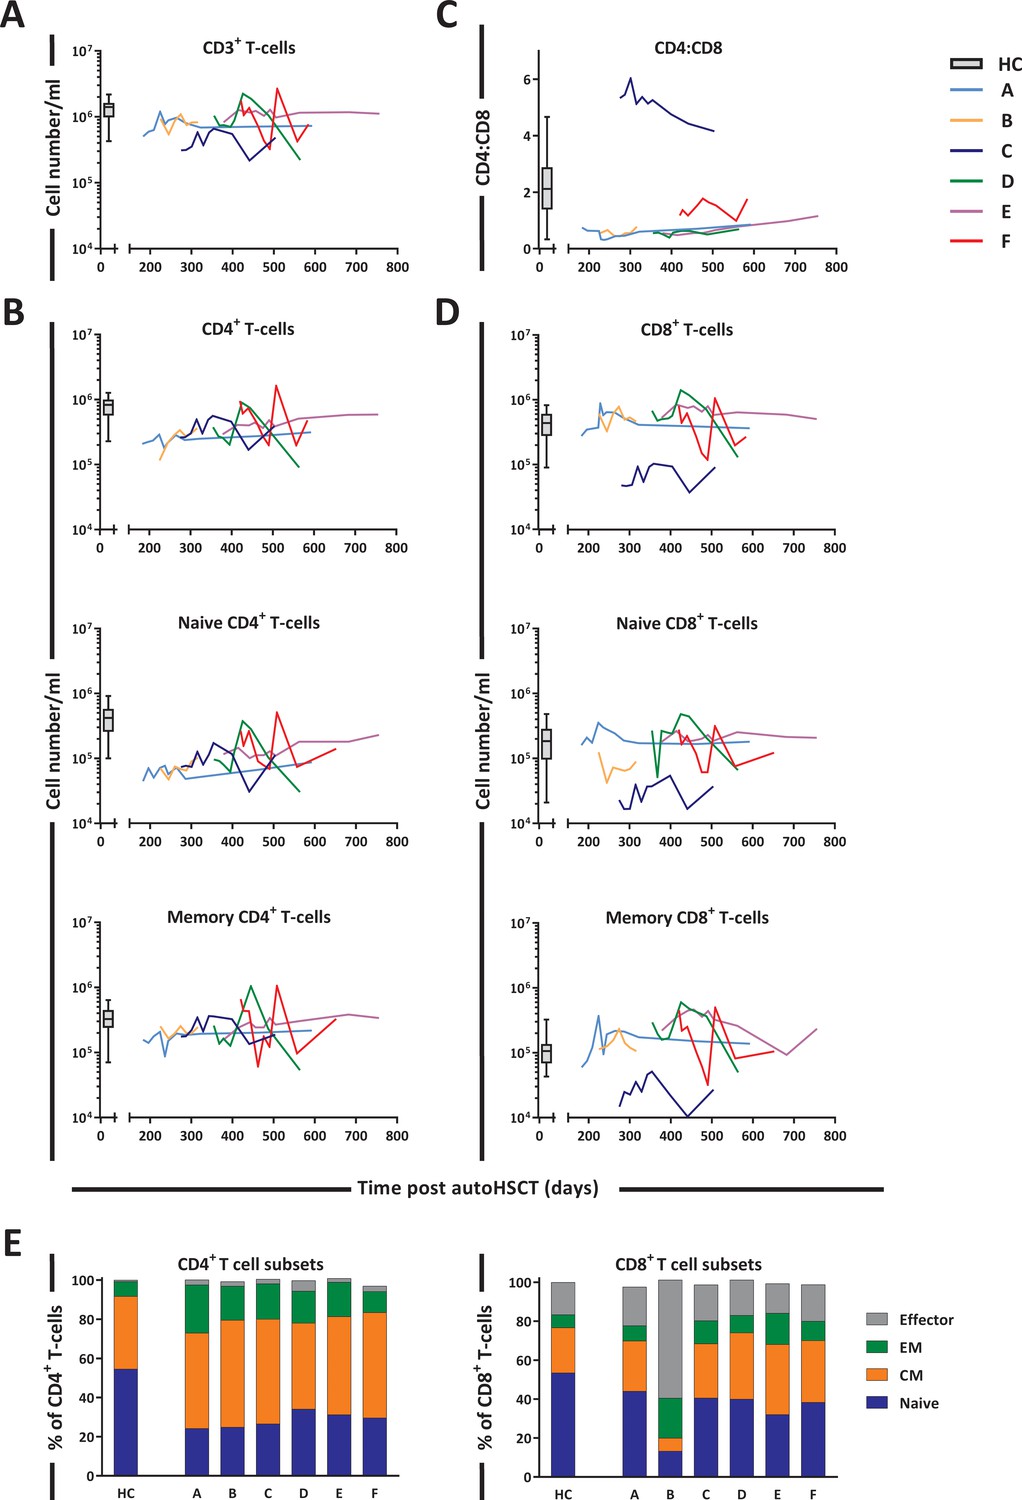
T-cell reconstitution following autologous hematopoietic stem cell transplantation (autoHSCT).
Absolute numbers (cells per milliliter) of (A) total CD3+ T-cells, (B) total, naive (CD27+CD45RO-) and memory (CD45RO+) CD3+CD4+ T-cells, (D) total, naive (CD27+CD45RO-) and memory (CD45RO+) CD3+CD8+ T-cells, and (C) the CD4:CD8 ratio over time for the duration of the study are depicted. Box plots represent the distribution of values for healthy controls (HCs) (N = 17 for CD3+, CD4+, CD8+, and CD4:CD8 ratio, other N = 27, box = 25th to 75th percentile, black line=median, whiskers=min and max values). Absolute numbers shown in the graph are not normalized. (E) Bar graphs show the median percentage of naive (CD27+CD45RO-), central memory (CM, CD27-CD45RO+), effector memory (EM, CD27+CD45RO+), and effector (CD27-CD45RO-) CD4+ and CD8+ T-cells of autoHSCT patients (A–F) and HCs (n = 6) in the indicated colors. For the T-cell subset distribution per patient over time, see Figure 3—figure supplement 1 and Figure 3—source data 1. For the gating strategy, see Figure 3—figure supplement 2.
-
Figure 3—source data 1
T-cell numbers and percentages in blood of patients and healthy controls.
- https://cdn.elifesciences.org/articles/59775/elife-59775-fig3-data1-v2.xls
Figure 3—figure supplement 1
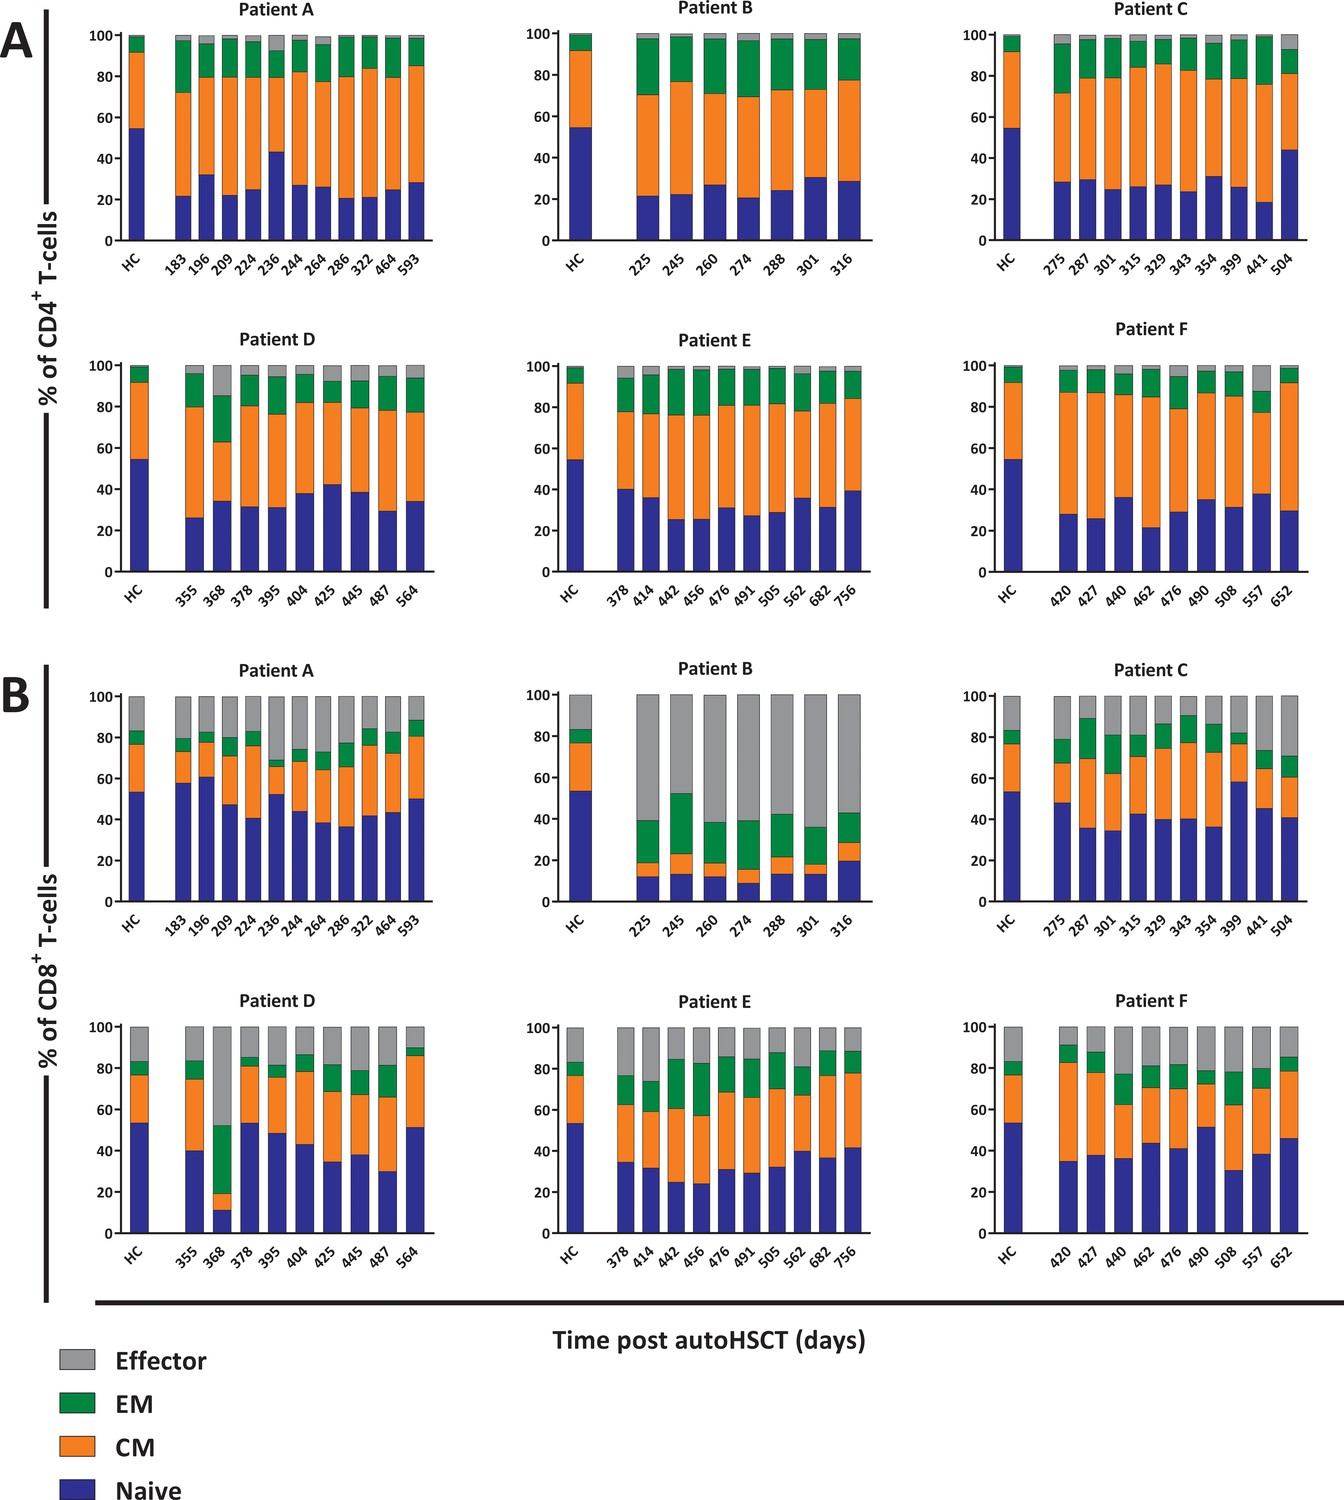
T-cell subset distribution per autologous hematopoietic stem cell transplantation (autoHSCT) patient over time.
Percentage of naive T-cells (blue), central memory T-cells (CM, orange), effector memory T-cells (EM, green), and effector T-cells (effector gray) within (A) CD4+ or (B) CD8+ T-cells at the study times after autoHSCT (patients A–F). Bar graphs for healthy controls (N = 6) show the median percentage of naive, CM, EM, and effector T-cells within CD4+ or CD8+ T-cells.
Figure 3—figure supplement 2
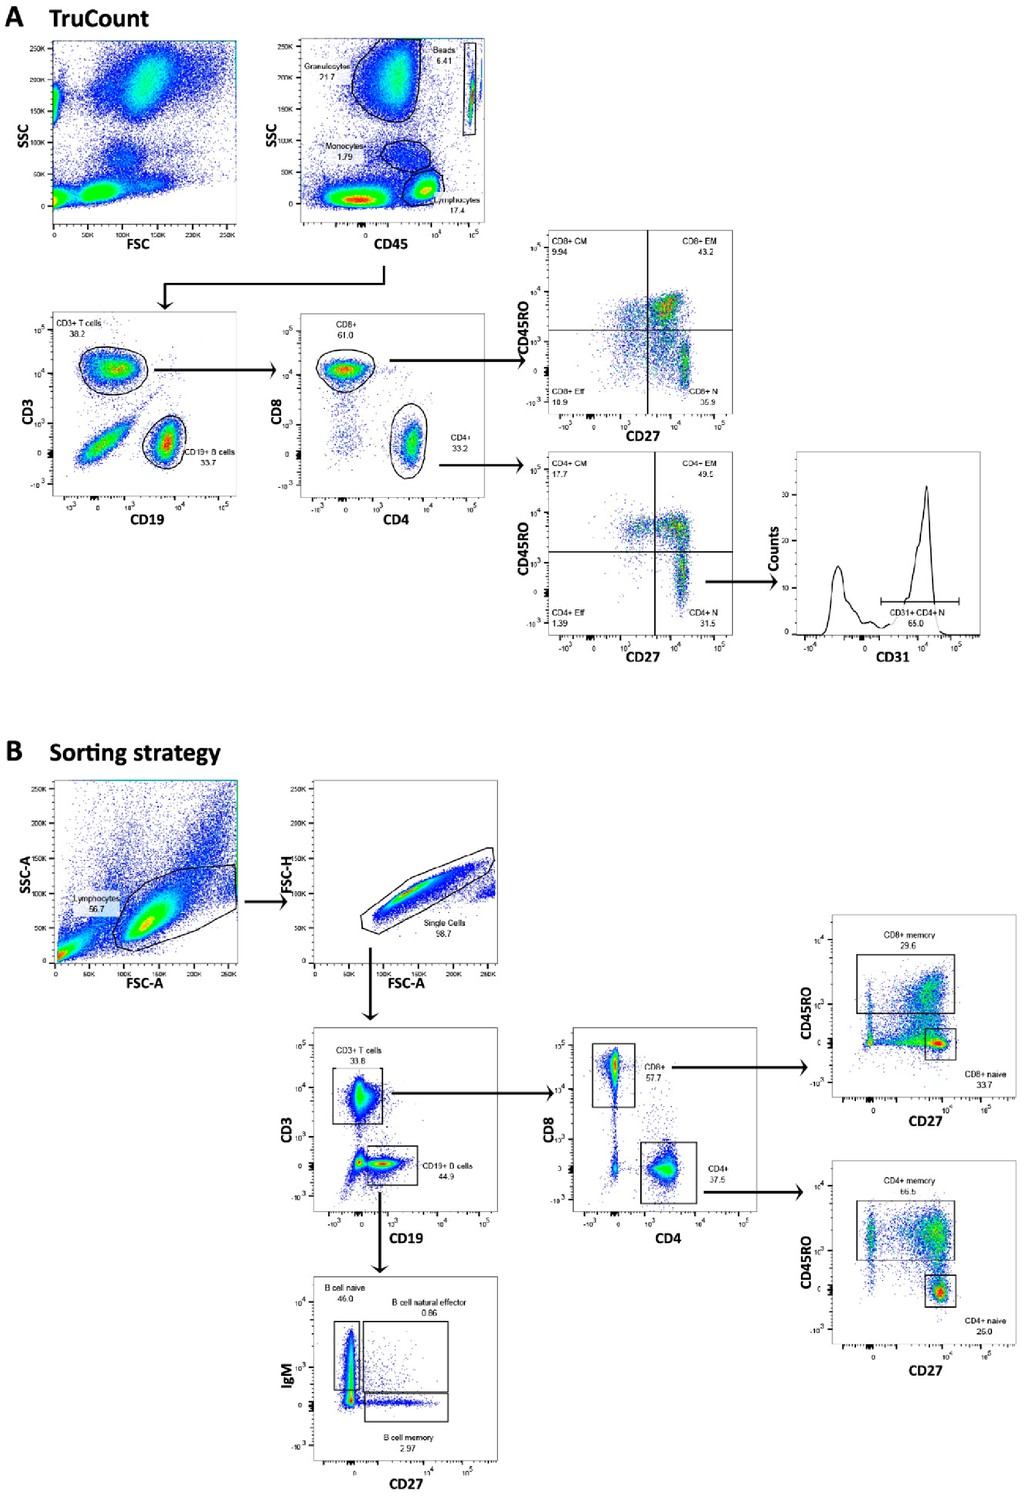
Gating strategy for TruCount analysis and cell sorting.
(A) Trucount gating strategy for naive (CD27+CD45RO-), central memory (CM, CD27-CD45RO+), effector memory (EM, CD27+CD45RO+), and effector (CD27-CD45RO-) CD4+ and CD8+ T-cells and B-cells. (B) Gating strategy for sorting for naive (CD27+CD45RO-) and memory (CD45RO+) CD4+ and CD8+ T-cells and for naive (IgM+CD27-), Ig class-switched memory (IgM-CD27+), and IgM+ memory (IgM+CD27+) B-cells.
Figure 3—figure supplement 3

Total daily production of T- and B-cell subsets, calculated as average production rate × (absolute number of cells per liter of blood) × (five liter blood) × 50, assuming that 2% of lymphocytes reside in the blood (Ponchel et al., 2011).
Horizontal lines represent median values. p-values of differences between groups are shown (Mann–Whitney test).
Figure 4 with 2 supplements
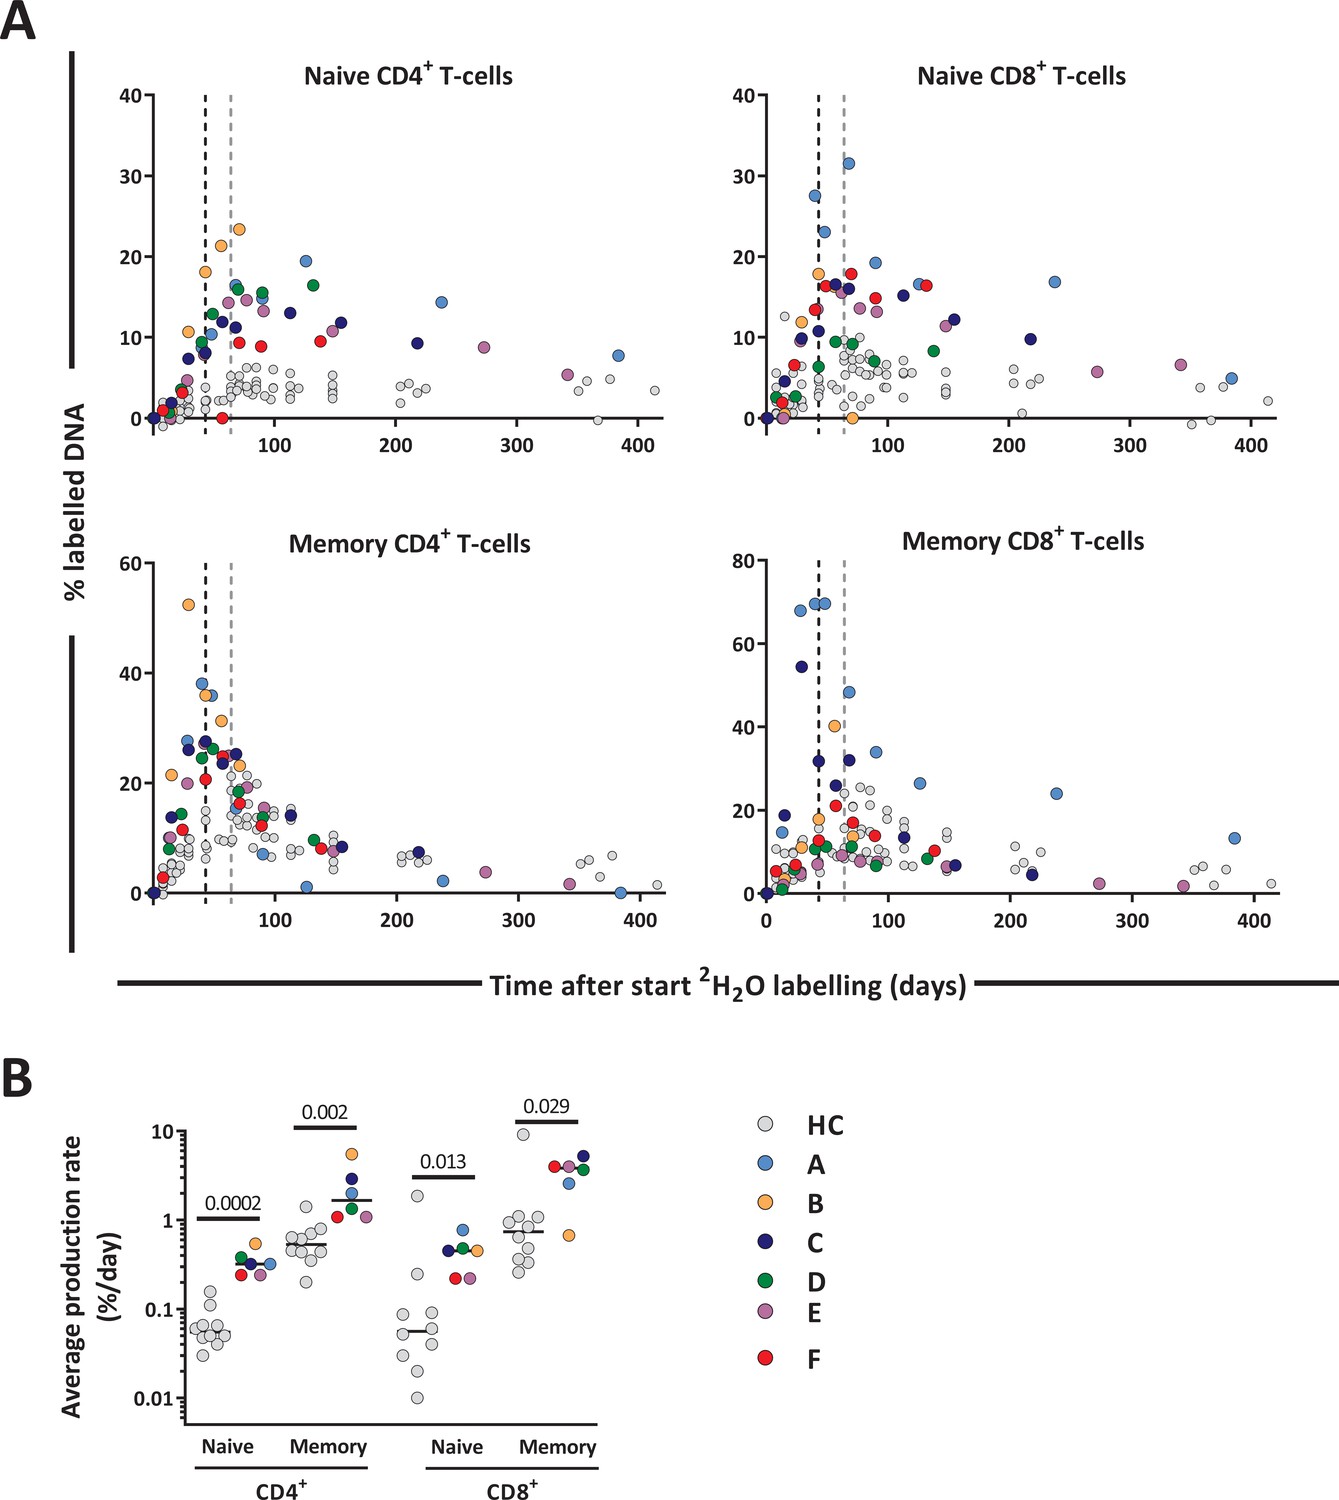
T-cell dynamics after autologous hematopoietic stem cell transplantation (autoHSCT).
(A) Deuterium enrichment in the DNA of naive and memory CD4+ and CD8+ T-cells in autoHSCT patients (A–F, color symbols) and healthy controls (HCs, gray symbols) (Westera et al., 2015). Dotted lines correspond to the end of the labeling period (black for autoHSCT patients and gray for HCs). Label enrichment was scaled between 0% and 100% by normalizing for the maximum enrichment in granulocytes (see Figure 4—figure supplement 1 and Figure 4—source data 1). (B) Estimates of the per cell production rate of naive and memory CD4+ and CD8+ T-cells in autoHSCT patients and HCs (Westera et al., 2015) (for individual fits and parameters estimates, see Figure 4—figure supplement 2 and Figure 4—source data 2). Different symbols indicate different individuals, autoHSCT patients (A–F) in color, and HCs in gray. Horizontal lines represent median values. p-values between groups are shown (Mann–Whitney test). For information on modeling in R, see Figure 4—source data 1.
-
Figure 4—source code 1
Modeling in R and raw data.
- https://cdn.elifesciences.org/articles/59775/elife-59775-fig4-code1-v2.zip
-
Figure 4—source data 1
Estimates of urine and granulocyte parameters and their corresponding 95% confidence limits for deuterium enrichment.
- https://cdn.elifesciences.org/articles/59775/elife-59775-fig4-data1-v2.xlsx
-
Figure 4—source data 2
Estimates of average daily production rates for T-cell subsets of autoHSCT patients.
- https://cdn.elifesciences.org/articles/59775/elife-59775-fig4-data2-v2.xlsx
Figure 4—figure supplement 1
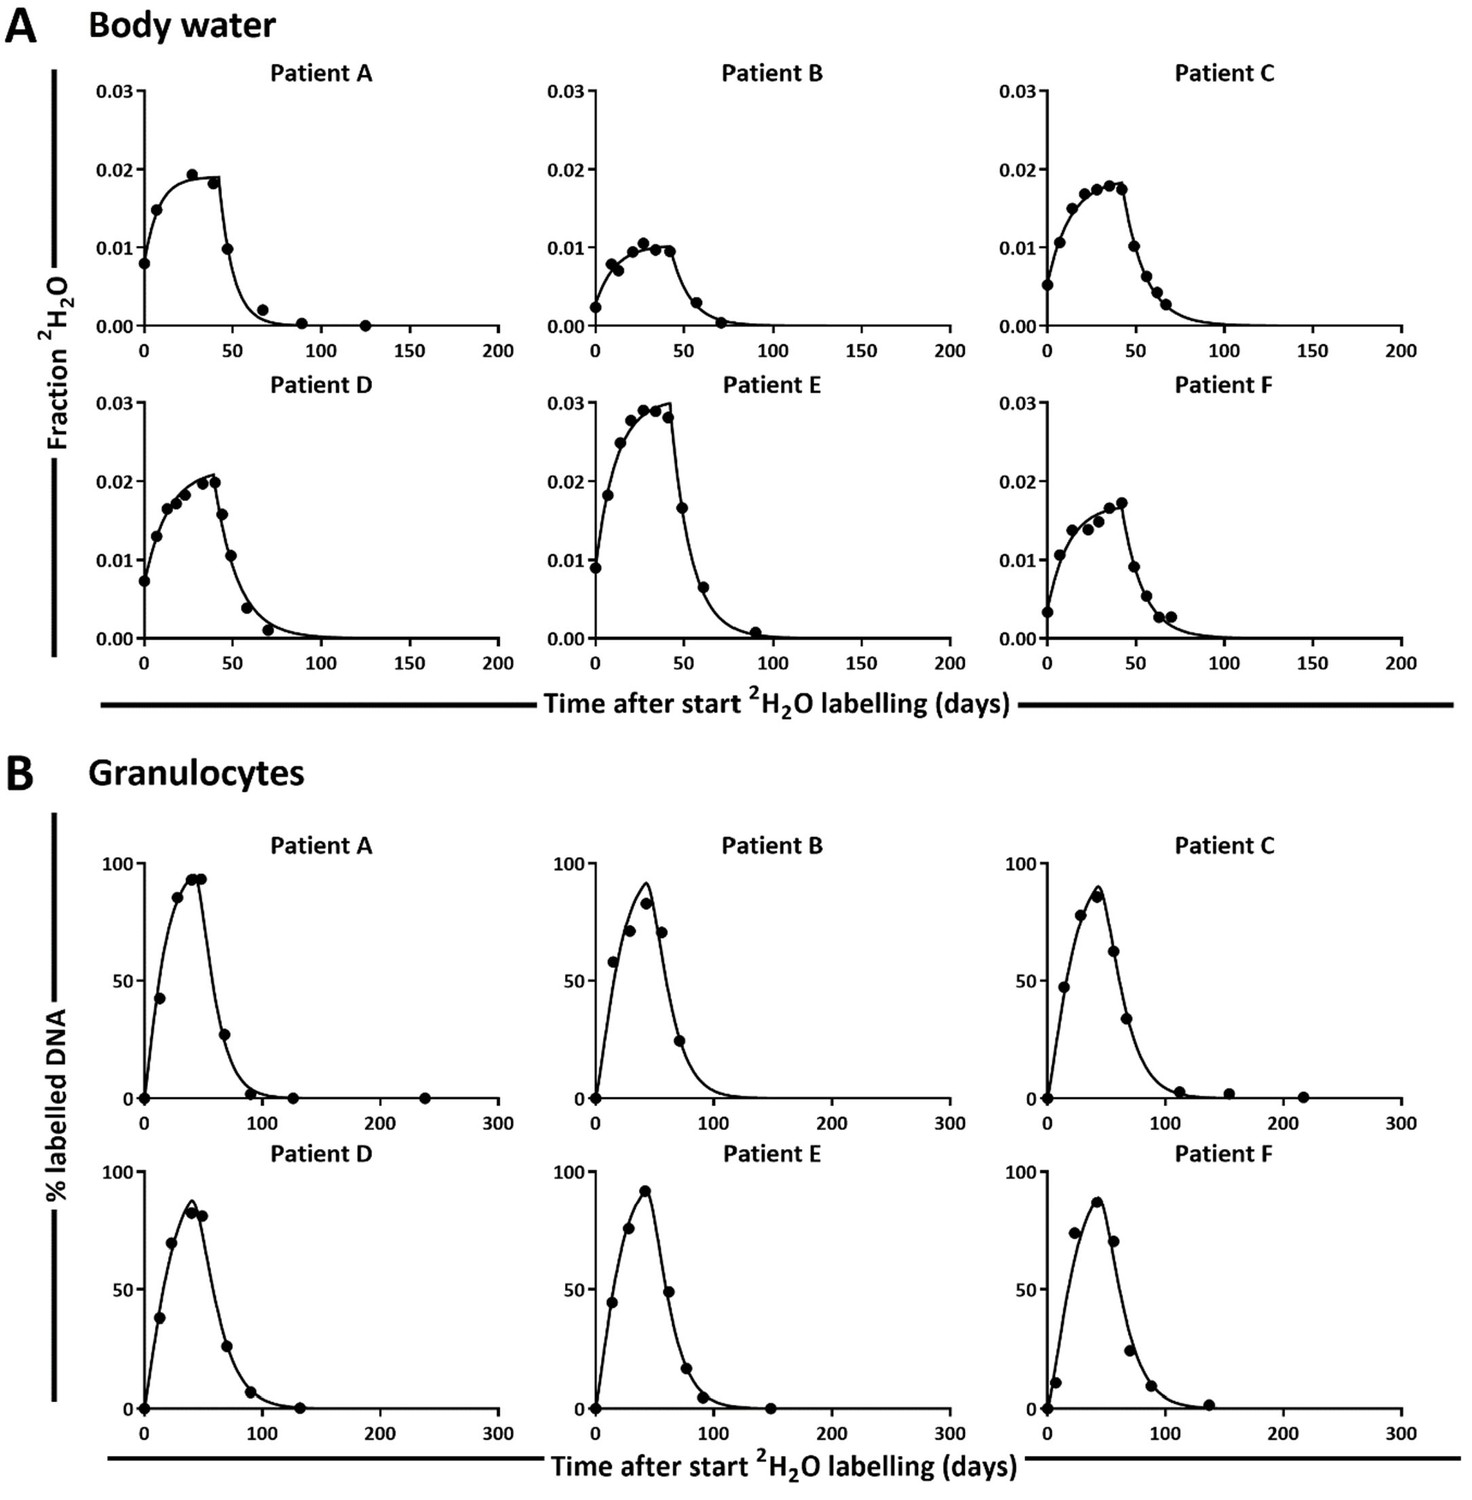
Best fits of 2H enrichment in (A) body water (urine) and (B) granulocytes from the six autologous hematopoietic stem cell transplantation (autoHSCT) patients (A–F).
The estimated parameters for urine and granulocytes can be found in Figure 4—source data 1.
Figure 4—figure supplement 2

Best fits of 2H enrichment in T-cell subsets in autologous hematopoietic stem cell transplantation (autoHSCT) patients.
Best fits of the model (see Materials and methods) to the enrichment data in naive and memory CD4+ and CD8+ T-cells in the six autoHSCT patients (A–F). Measured enrichments are shown by black dots. Label enrichment in the DNA was scaled between 0% and 100% by normalizing for the maximum enrichment in granulocytes (see Materials and methods). The end of 2H2O administration is marked by a dashed vertical line. Best fits of 2H enrichment of the corresponding subsets in healthy individuals were previously published by Westera et al., 2015.
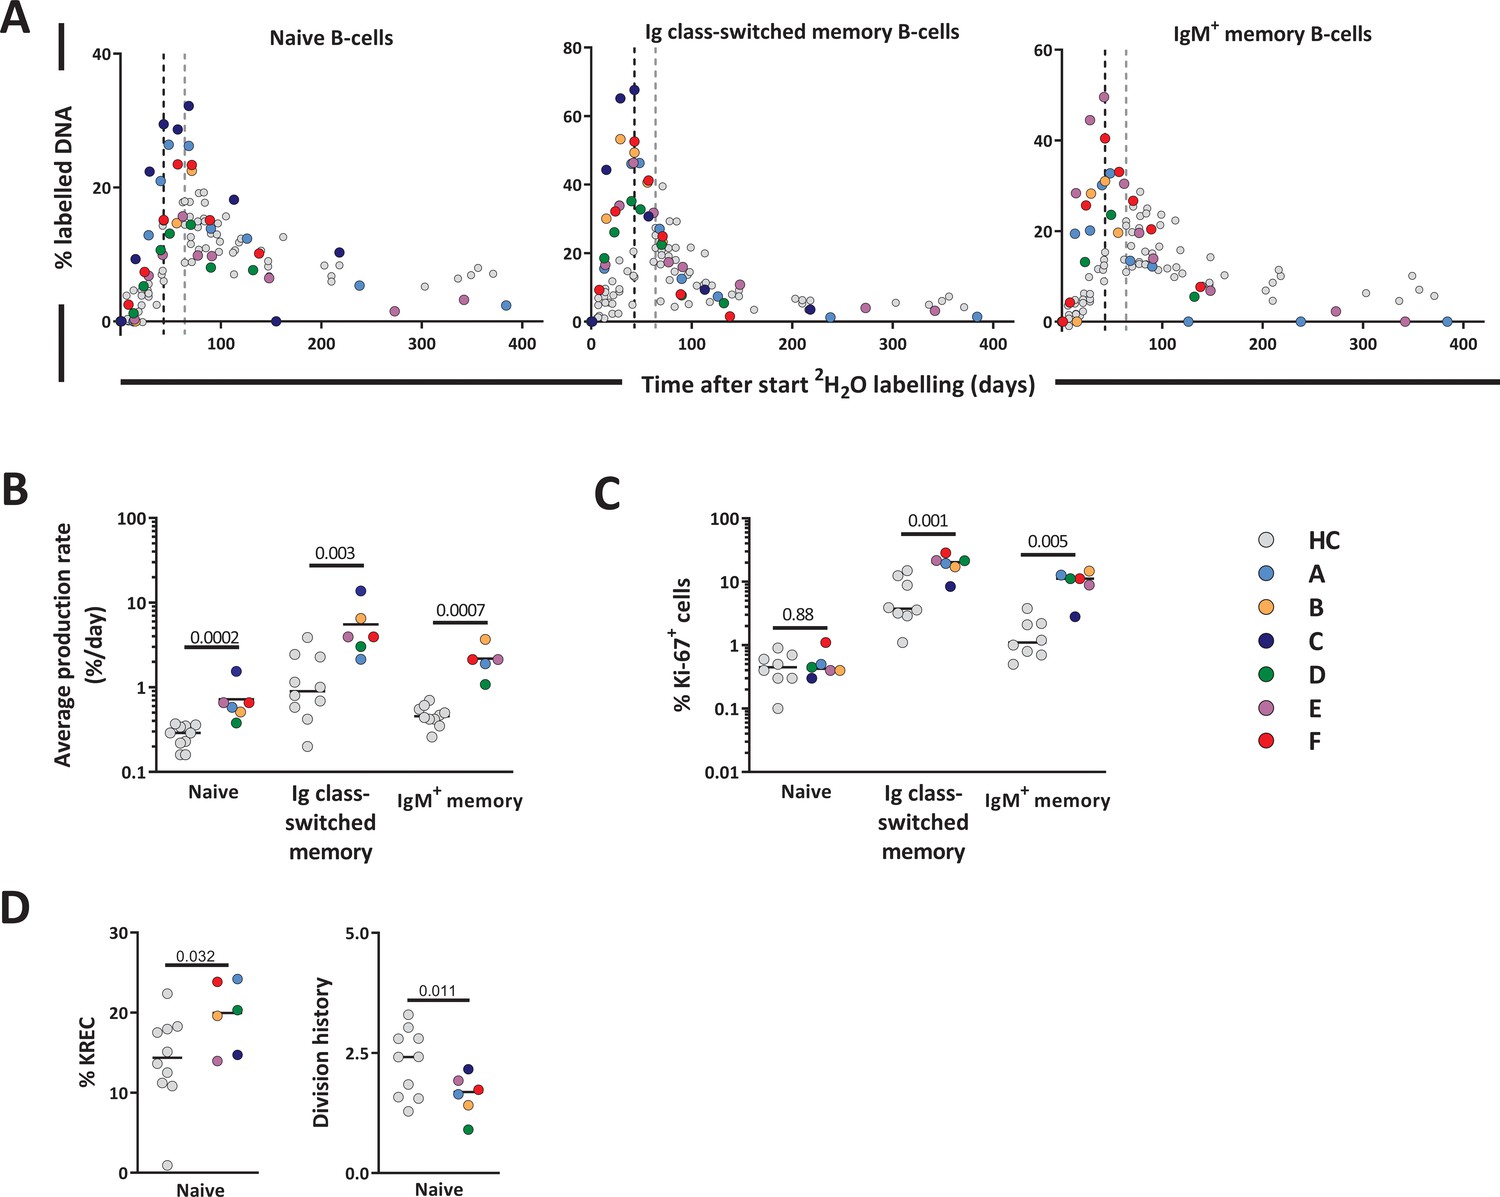
Figure 5 with 2 supplements
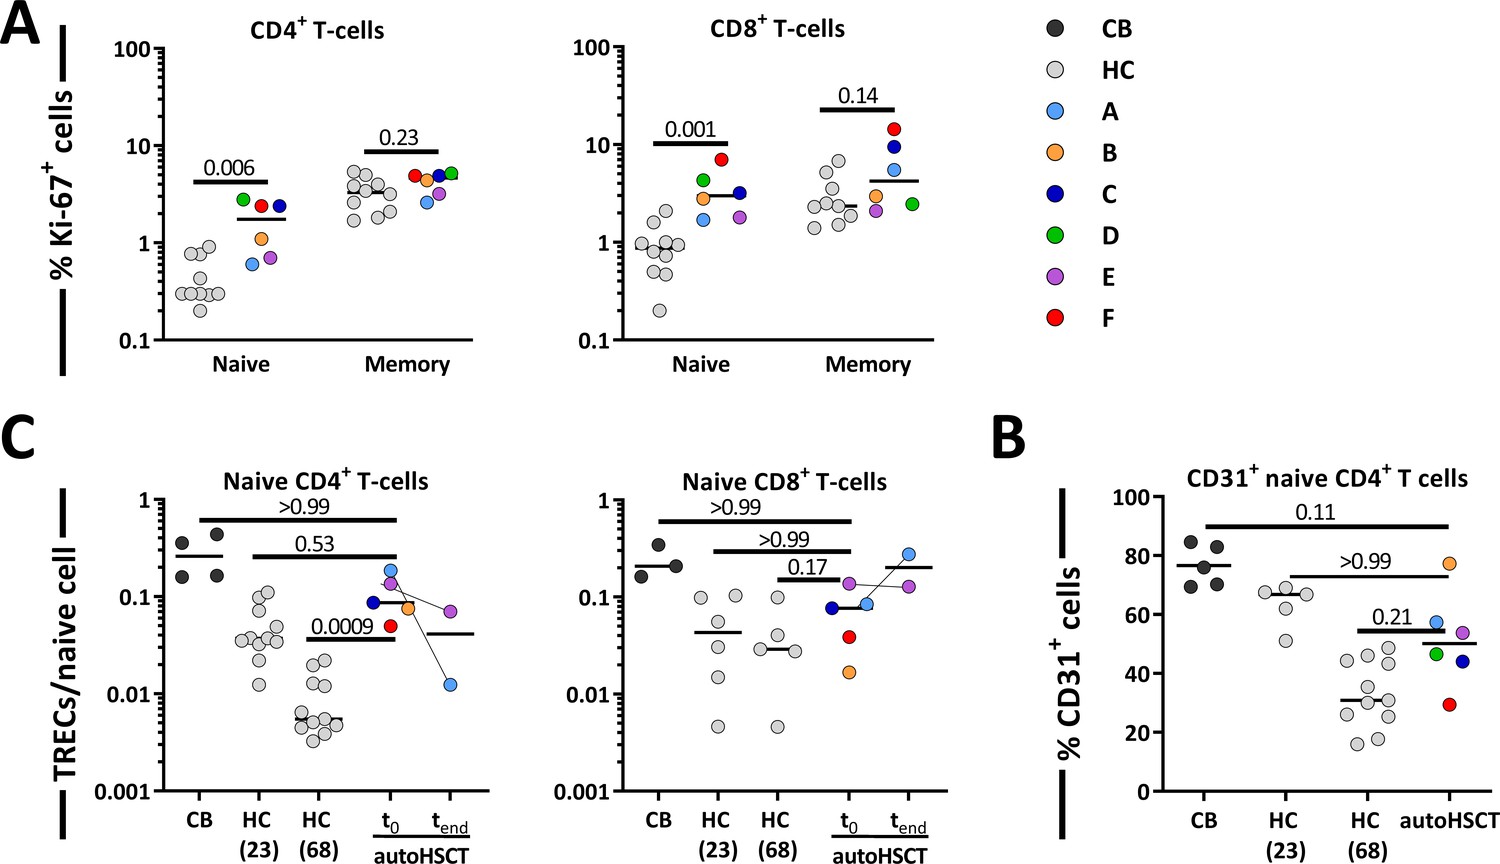
Contribution of peripheral proliferation and thymic output to T-cell production after autologous hematopoietic stem cell transplantation (autoHSCT).
(A) Ki-67 expression was measured within naive and memory CD4+ (left panel) and CD8+ (right panel) T-cell in autoHSCT patients and healthy controls (HCs) (Westera et al., 2015) (for gating strategy, see Figure 5—figure supplement 1). (B) Average number of T-cell receptor excision circles (TRECs) per naive CD4+ (left panel) and CD8+ (right panel) T-cell in autoHSCT patients, cord blood (CB), and HCs (Westera et al., 2015). For Patient A and Patient E, TREC content was measured the first day of the study (t0) as well as the last study visit (tend). For Patient D, TREC content was not successfully measured due to limited material. (C) CD31 expression was measured within naive CD4+ T-cells in autoHSCT patients, CB, and HCs (Westera et al., 2015). For changes in CD31 expression and absolute numbers of CD31+ cells over time, see Figure 5—figure supplement 2. Different symbols indicate different individuals, autoHSCT patients (A–F) in color, CB in dark gray, and young (median age of 23 years) and old (median age of 68 years) HCs in light gray. Horizontal lines represent median values. p-values of differences between groups are shown (Mann–Whitney test [A] and Kruskal–Wallis with Dunn’s correction [B], comparison with CB, HC [23], and HC [68]).
Figure 5—figure supplement 1
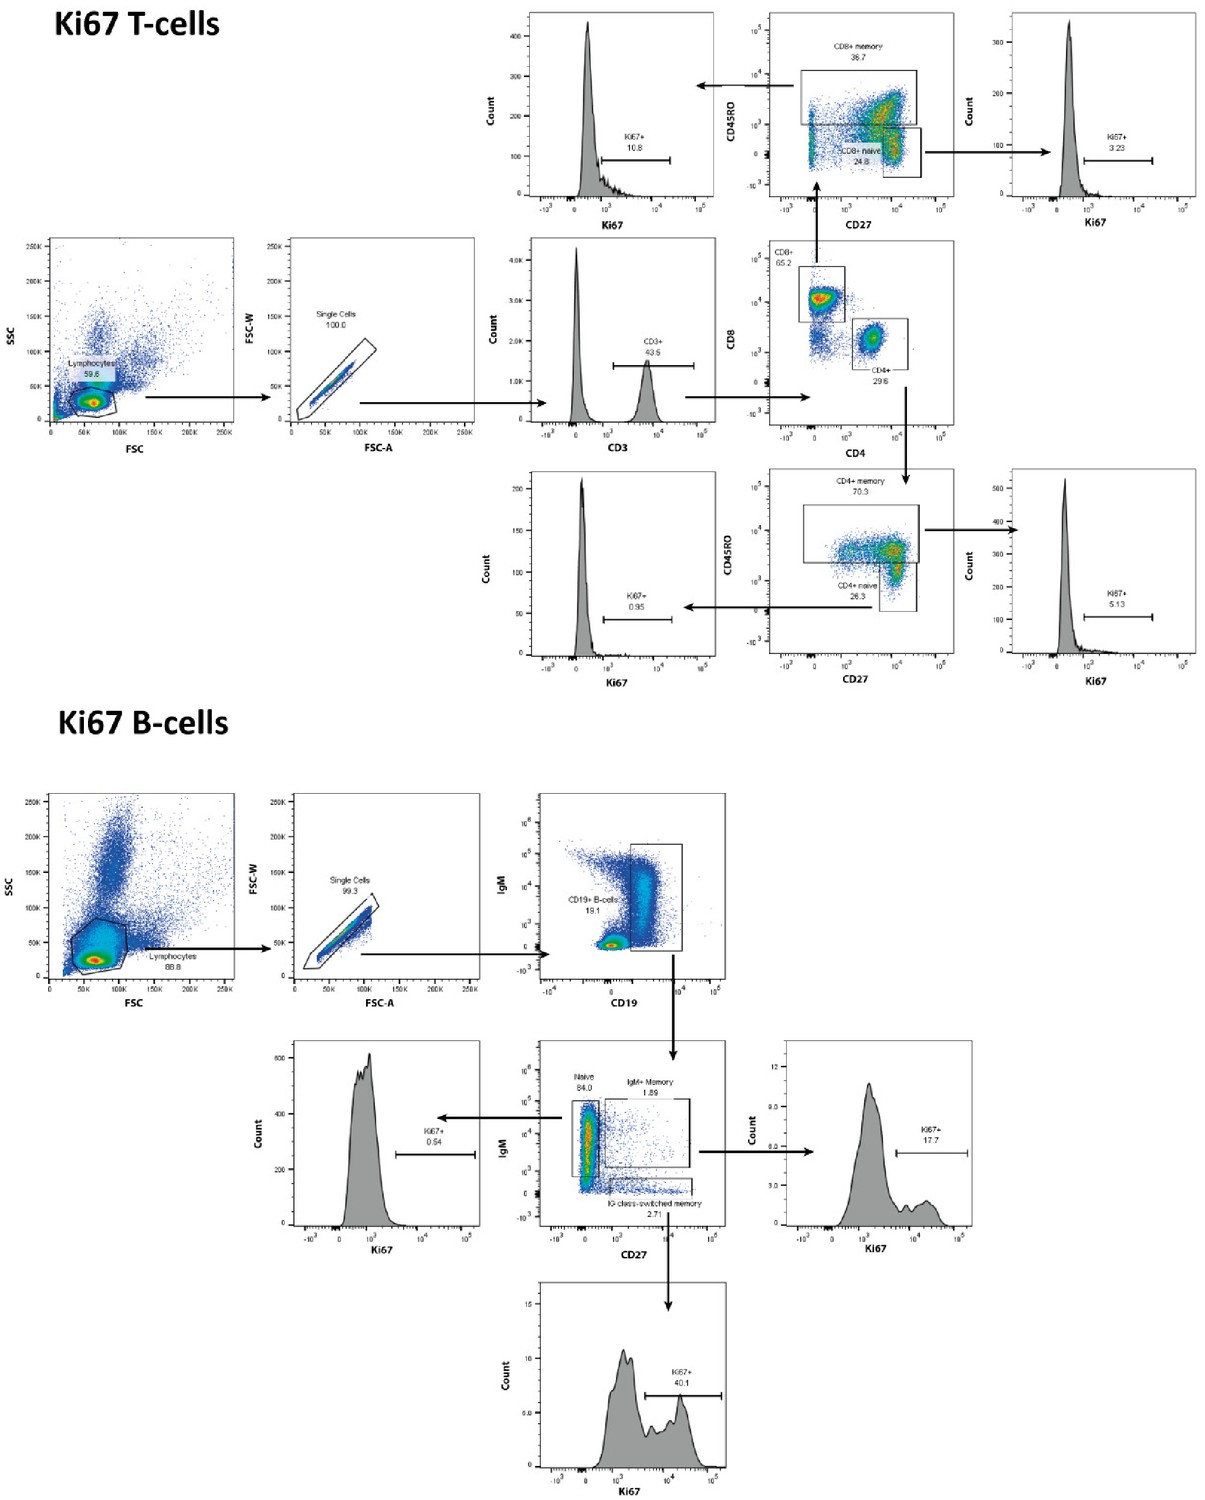
Gating strategy for Ki-67 expression of T- and B-cell subsets.
Gating strategy for Ki-67 expression of naive (CD27+CD45RO-) and memory (CD45RO+) CD4+ and CD8+ T-cells and naive (IgM+CD27-), Ig class-switched memory (IgM-CD27+) and IgM+ memory (IgM+CD27+) B-cells.
Figure 5—figure supplement 2
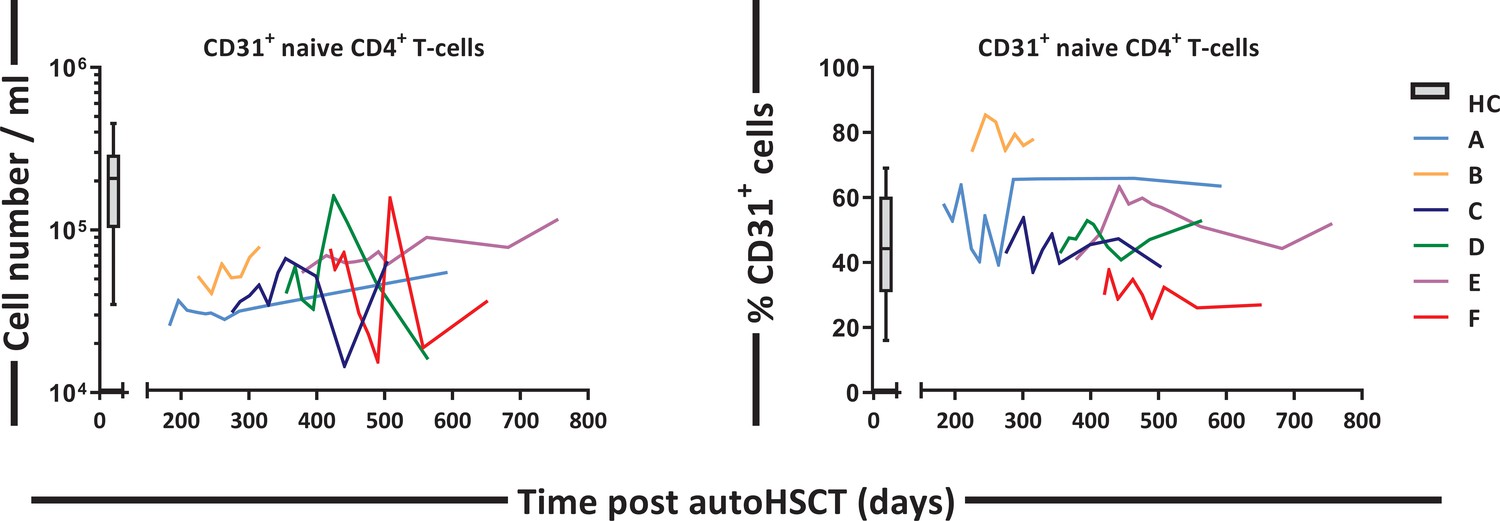
CD31+ CD4+ T cell numbers and percentage over time.
Absolute numbers of CD31+ naive CD4+ T-cells per milliliter of blood over time (left panel) and percentage CD31+ cells within naive CD4+ T-cells (right panel). Graphs show the absolute cell counts per milliliter or the percentage CD31+ cells in autologous hematopoietic stem cell transplantation (autoHSCT) patients (patients A–F, in color) over time for the duration of the study. Box plots represent the distribution of values for healthy controls (N = 23, box = 25th to 75th percentile, black line=median, whiskers=min and max values). Absolute numbers shown in the graph are not normalized.
Figure 6 with 1 supplement
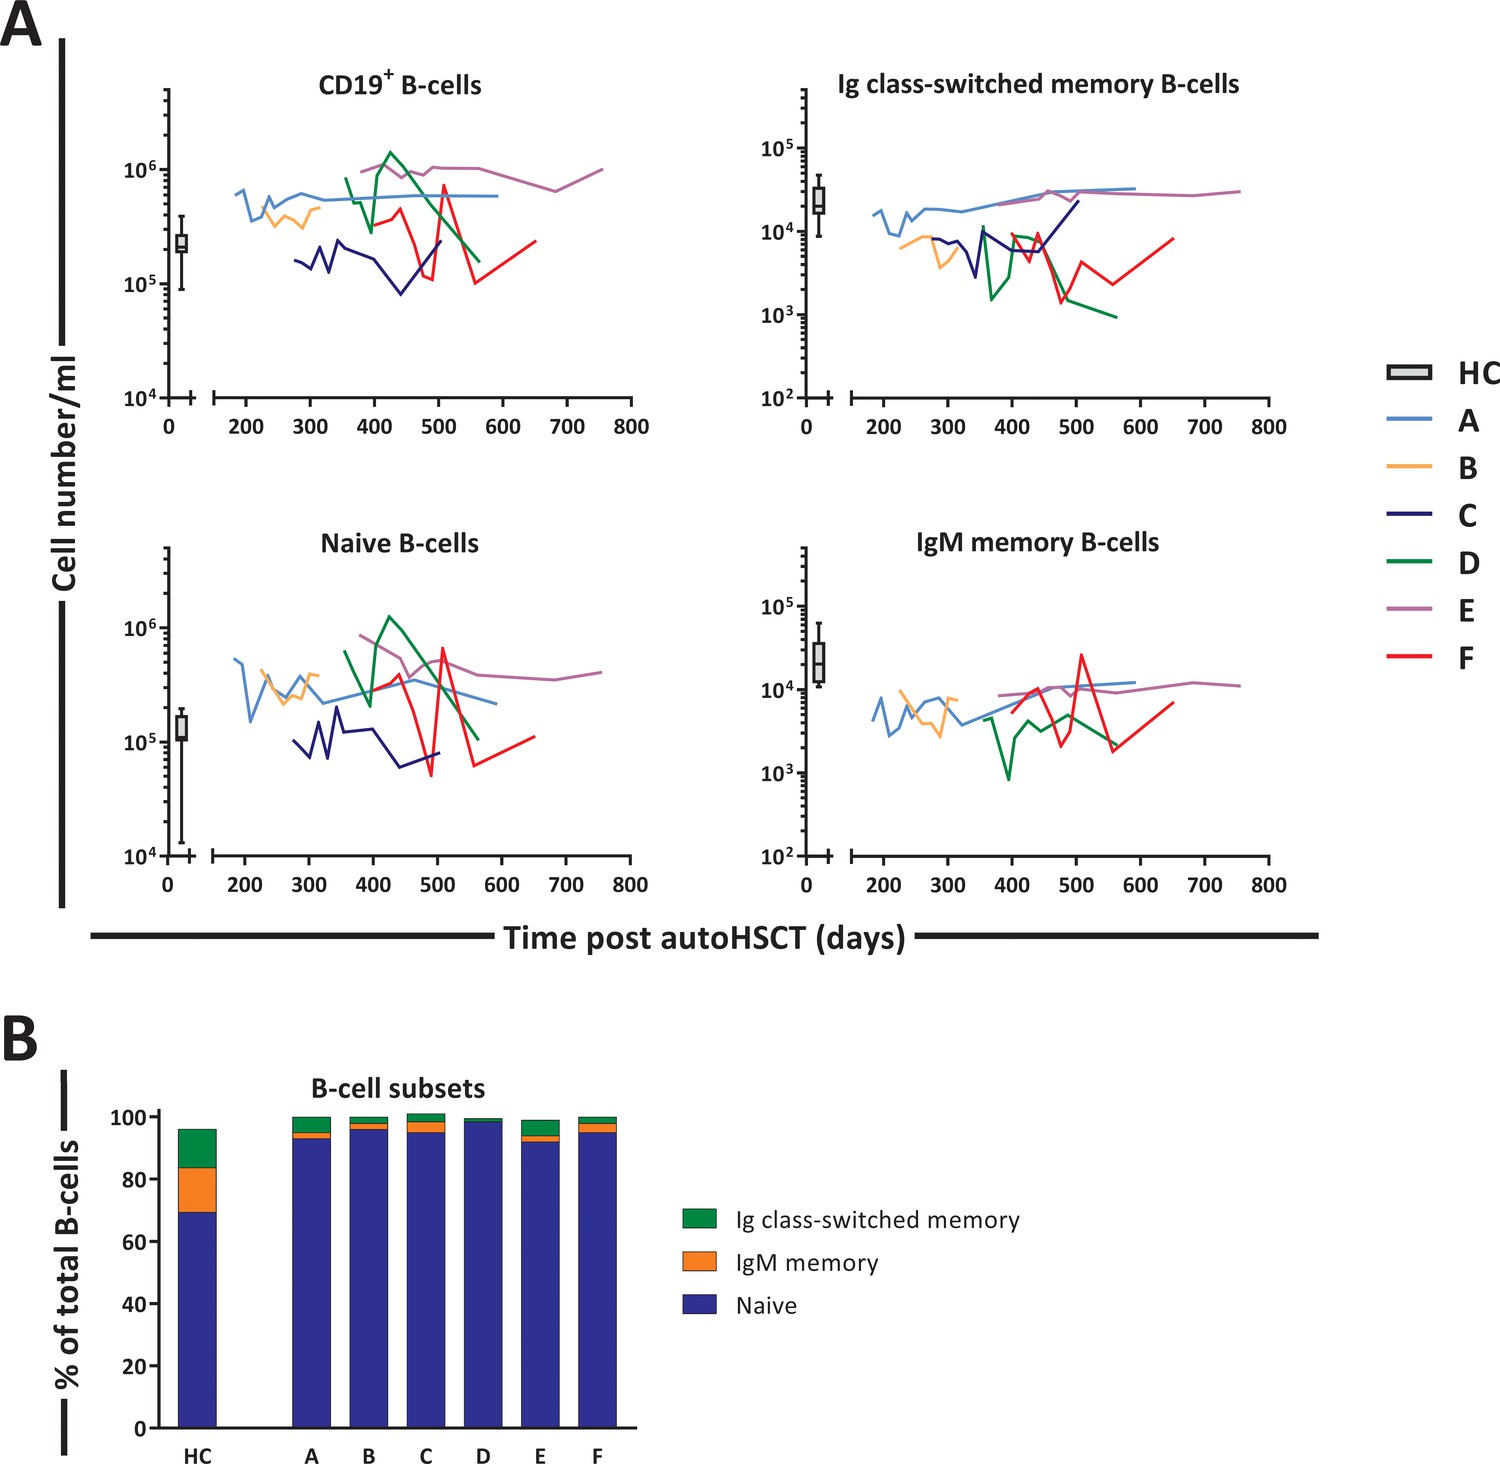
B-cell reconstitution following autologous hematopoietic stem cell transplantation (autoHSCT).
(A) Absolute numbers (cells per milliliter) of total CD19+ B-cells, naive (CD19+IgM+CD27-), Ig class-switched memory (CD19+IgM-CD27+), and IgM+ memory (CD19+IgM+CD27+) B-cells in peripheral blood over time. Graphs show the absolute cell counts per milliliter in autoHSCT patients (patients A–F) over the duration of the study. Box plots represent the distribution of values for healthy controls (HCs) (N = 10, box = 25th to 75th percentile, black line=median, whiskers=min and max values). Absolute numbers shown in the graph are not normalized. (B) Bar graphs show the median percentage of naive, Ig class-switched memory, and IgM+ memory B-cells within total CD19+ B-cells of autoHSCT patients (patients A–F) and HCs (N = 10). For the B-cell subset distribution per patient over time, see Figure 6—figure supplement 1 and Figure 6—source data 1. Note the different y-axes in panel A.
-
Figure 6—source data 1
B-cell numbers and percentage in blood of patients and healthy controls.
- https://cdn.elifesciences.org/articles/59775/elife-59775-fig6-data1-v2.xls
Figure 6—figure supplement 1
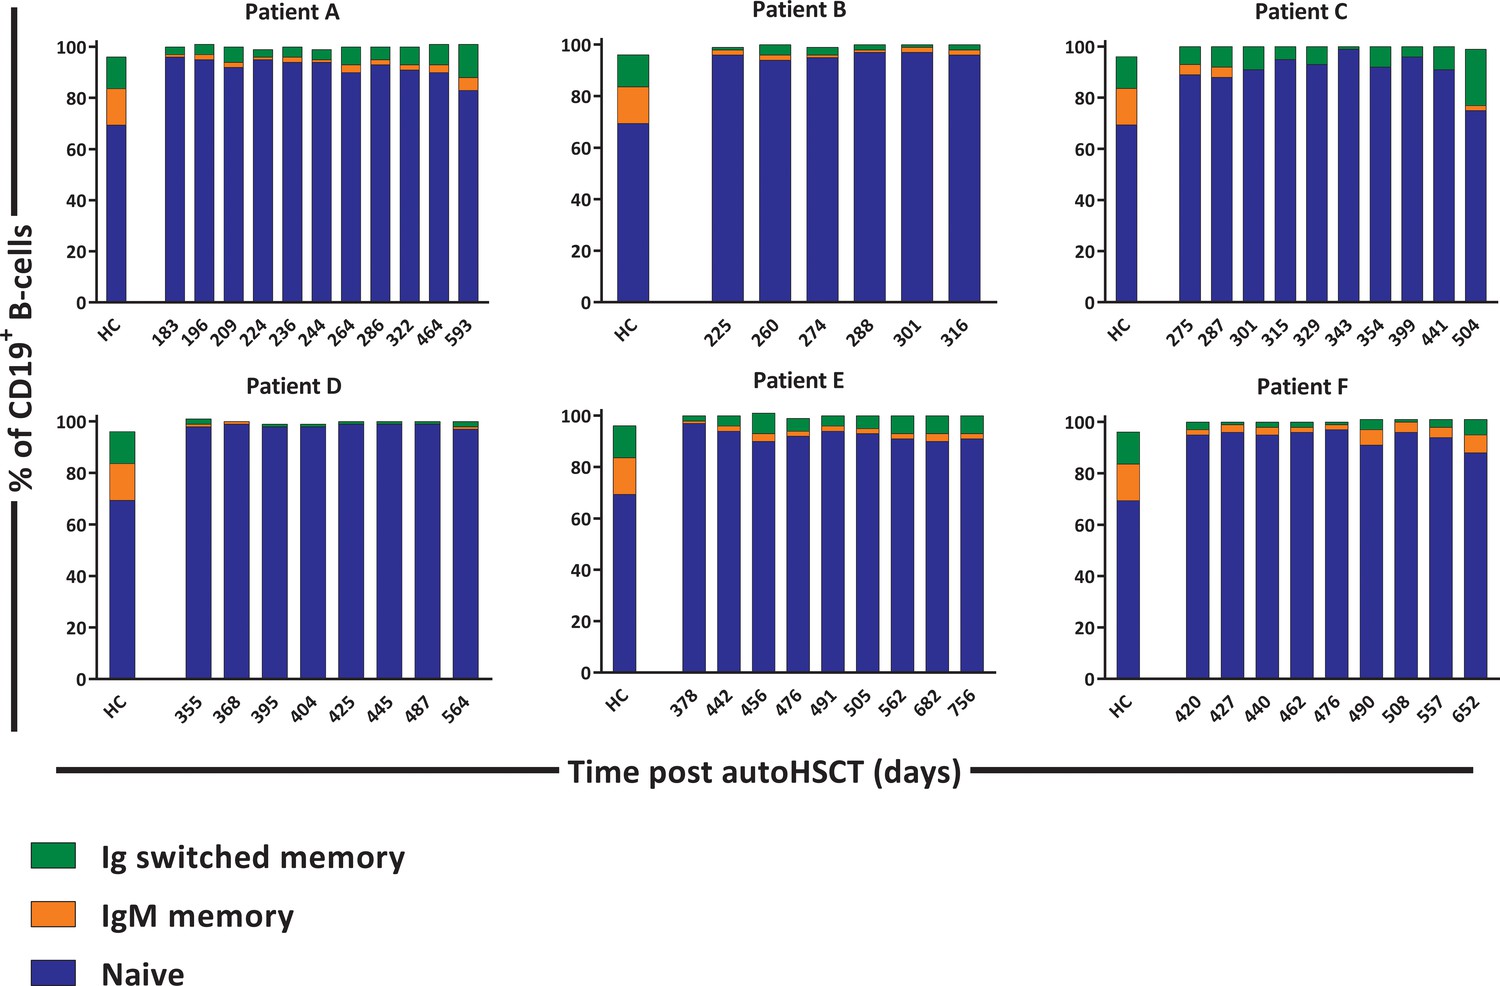
B-cell subset distribution per autologous hematopoietic stem cell transplantation (autoHSCT) patient over time.
Percentage of naive B-cells (blue), IgM+ memory B-cells (orange), and Ig class-switched memory B-cells (green) within total CD19+ B-cells per patient (patients A–F) at the study times after autoHSCT. Bar graphs for healthy controls show the median percentage of naive, memory, and natural effector B-cells within total CD19+ B-cells. For the gating strategy, see Figure 3—figure supplement 1.
Figure 7 with 1 supplement
B-cell dynamics after autologous hematopoietic stem cell transplantation (autoHSCT).
(A) Deuterium enrichment in the DNA of B-cell subsets in autoHSCT patients (A–F, color symbols) and healthy controls (HCs) (gray symbols) (Westera et al., 2015). Dotted lines correspond to the end of the labeling period (black for autoHSCT patients and gray for HCs). Label enrichment was scaled between 0% and 100% by normalizing for the maximum enrichment in granulocytes (Figure 4—source data 1). (B) Estimates of the per cell production rates of naive, Ig class-switched memory, and IgM+ memory B-cells in autoHSCT patients and HCs (Westera et al., 2015). For individual fits and estimates, see Figure 7—figure supplement 1 and Figure 7—source data 1. (C) Ki-67 expression was measured within naive, Ig class-switched memory, and IgM+ memory B-cells in autoHSCT patients and HCs (Westera et al., 2015) (for gating strategy, see Figure 5—figure supplement 1). (D) Percentage of naive B-cells containing a KREC and naive B-cell division history for autoHSCT patients and HCs (Westera et al., 2015). Different symbols indicate different individuals, autoHSCT patients (A–F) in color and HCs in gray. Horizontal lines represent median values. p-values of differences between groups are shown (Mann–Whitney test). For information on modeling in R, see Figure 4—source code 1.
-
Figure 7—source data 1
Estimates of average daily production rates for B cell subsets of autoHSCT patients.
- https://cdn.elifesciences.org/articles/59775/elife-59775-fig7-data1-v2.xlsx
Figure 7—figure supplement 1

Best fits of 2H enrichment in B-cell subsets in autologous hematopoietic stem cell transplantation (autoHSCT) patients.
Best fits of the model (see Materials and methods) to the enrichment data in naive, Ig class-switched memory and IgM+ memory B-cells in the six autoHSCT patients (A–F). Measured enrichments are shown by black dots. Label enrichment in the DNA was scaled between 0% and 100% by normalizing for the maximum enrichment in granulocytes (see Materials and methods). The end of 2H2O administration is marked by a dashed vertical line. Best fits of 2H enrichment of the corresponding subsets in healthy individuals were previously published by Westera et al., 2015.
Figure 8 with 2 supplements

Average T- and B-cell loss rates following autologous hematopoietic stem cell transplantation (autoHSCT).
(A) Estimates of the average loss rates of naive and memory CD4+ and CD8+ T-cells and of (B) naive, Ig class-switched memory and IgM+ memory B-cells in autoHSCT patients (A–F, color symbols) and healthy controls (HCs; gray symbols) (Westera et al., 2015). Average loss rates were calculated (see Figure 8—source data 1) using the estimated average production rates and the corrected cell numbers (Figure 8—figure supplements 1 and 2) as described in Materials and methods. Horizontal lines represent median values. p-values of differences between groups are shown (Mann–Whitney test).
-
Figure 8—source data 1
Estimates of average daily loss rates for T- and B-cell subsets autoHSCT patients.
- https://cdn.elifesciences.org/articles/59775/elife-59775-fig8-data1-v2.xlsx
Figure 8—figure supplement 1
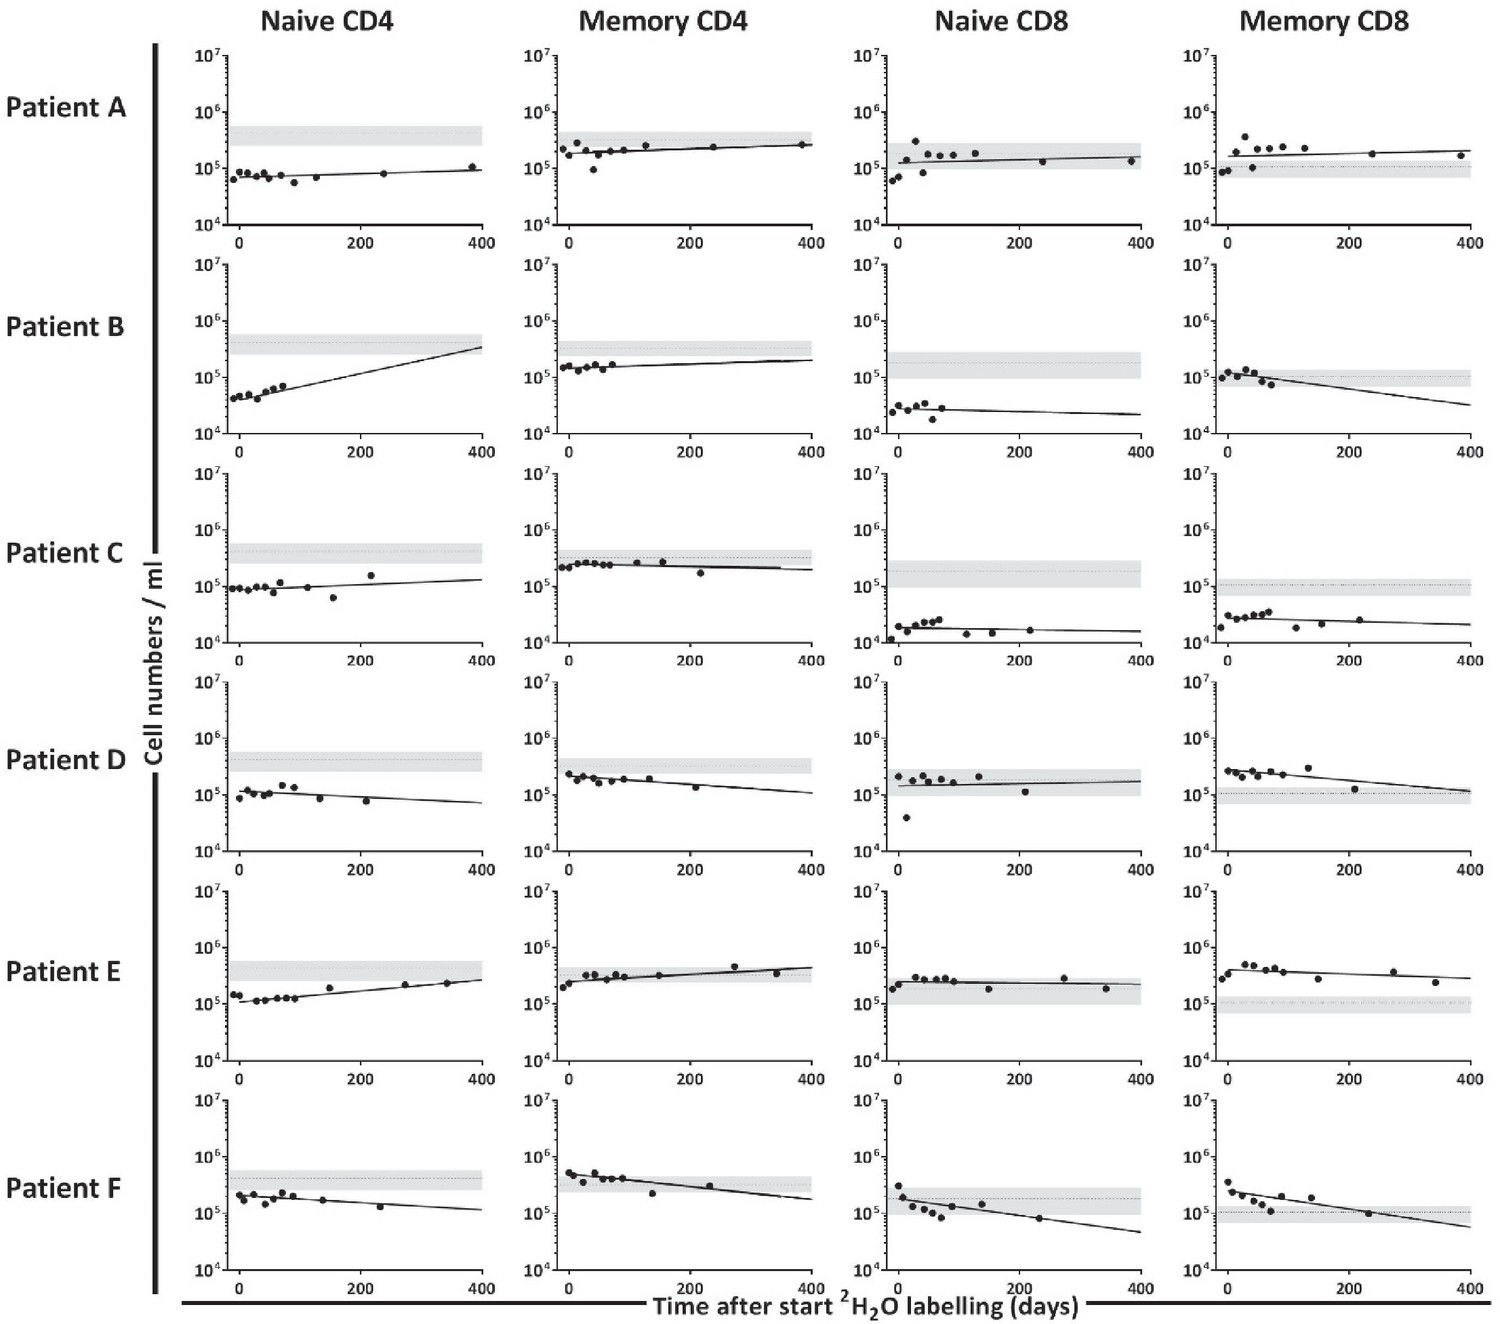
Best fits of T-cell numbers in autologous hematopoietic stem cell transplantation (autoHSCT) patients.
Best fits (black lines) to the normalized cell numbers data (black dots). Absolute numbers (cells per milliliter of blood) of naive (CD27+CD45RO-) and memory (CD45RO+) CD4+ and CD8+ T-cells were corrected for noise as described in Materials and methods. The median cell numbers (dotted gray line) and the corresponding IQR (interquartile range, gray area) for healthy controls are shown.
Figure 8—figure supplement 2

Best fits of B-cell numbers in autologous hematopoietic stem cell transplantation (autoHSCT) patients.
Best fits (black lines) to the normalized cell number data (black dots). Absolute numbers (cells per milliliter of blood) of naive (CD19+IgM+CD27-), Ig class-switched memory (CD19+IgM-CD27+), and IgM+ memory (CD19+IgM+CD27+) B-cells were corrected for noise as described in Materials and methods. The median cell numbers (dotted gray line) and the corresponding IQR (interquartile range, gray area) for healthy controls are shown.
Author response image 1
Tables
Key resources table
| Reagent type (species) or resource | Designation | Source or reference | Identifiers | Additional information |
|---|---|---|---|---|
| Antibody | Anti-human CD45-PerCP (Mouse IgG1, κ) RRID:AB_2566358 | BioLegend | Cat# 368506 Clone: 2D1 | ‘(1:20)’ |
| Antibody | Anti- human CD3-FITC (Mouse IgG1, κ) RRID:AB_2562046 | BioLegend | Cat# 399430 Clone: UCHT1 | ‘(1:25)’ |
| Antibody | Anti-human CD4-APC-eF780 (Mouse IgG1, κ) RRID:AB_1272044 | eBioscience | Cat# 47-0049-42 Clone: RPA-T4 | ‘(1:50)’ |
| Antibody | Anti-human CD8-V500 (Mouse IgG1, κ) RRID:AB_2870326 | BD Biosciences | Cat# 561617 Clone: SK1 | ‘(1:60)’ |
| Antibody | Anti-human CD19-eFluor450 (Mouse IgG1, κ) RRID:AB_1272053 | eBioscience | Cat# 48-0199-42 Clone: HIB19 | ‘(1:25)’ |
| Antibody | Anti-human CD45RO-PE-Cy7 (Mouse IgG2A, κ) RRID:AB_647426 | BD Biosciences | Cat# 337168 Clone: UCHL1 | ‘(1:60)’ |
| Antibody | Anti-human CD27-APC (Mouse IgG1, κ) RRID:AB_469371 | eBioscience | Cat# 17-0279-42 Clone: O343 | ‘(1:25)’ |
| Antibody | Anti-human CD31-PE (Mouse IgG1, κ) RRID:AB_400016 | BD Biosciences | Cat# 340297 Clone: L133.1 | ‘(1:12.5)’ |
| Antibody | Anti-human CD3-eFluor450 (Mouse IgG2A, κ) RRID:AB_1272055 | eBioscience | Cat# 48-0037-42 Clone: OKT3 | ‘(1:50)’ |
| Antibody | Anti-human CD95-PE (Mouse IgG1, κ) RRID:AB_396027 | BD Biosciences | Cat# 555674 Clone: DX2 | ‘(1:50)’ |
| Antibody | Anti-human CD19-PerCP (Mouse IgG1, κ) RRID:AB_2868816 | BD Biosciences | Cat# 363014 Clone:SJ25C1 | ‘(1:50)’ |
| Antibody | Anti-human IgM-PE (Goat IgG) RRID:AB_2795614 | Southern Biotech | Cat# 2022–09 Polyclonal | ‘(1:100)’ |
| Antibody | Anti-human Ki-67-FITC (Mouse IgG1, κ) RRID:AB_578716 | DAKO | Cat# F7268 Clone:MIB-1 | ‘(1:10)’ |
| Commercial assay or kit | Cytofix/Cytoperm | BD Biosciences | Cat#554714 | |
| Commercial assay or kit | FACS Lysing Solution | BD Biosciences | Cat#349202 | |
| Commercial assay or kit | Reliaprep Blood gDNA Miniprep System | Promega | Cat#A5081 | |
| Commercial assay or kit | Data acquisition | Luminex | xPONENT software version 4.2 | |
| Commercial assay or kit | Data acquisition | Biorad Laboratories | Biorad FlexMAP3D | |
| Chemical compound | 2H2O, 99.8% enriched | Cambridge Isotope Laboratories | Cat#DLM-2259–1 | |
| Software, algorithm | Data analysis | Biorad laboratories | Biorad Bio-Plex Manager software, version 6.1.1 | |
| Software, algorithm | Data analysis | Biorad laboratories | Biorad FlexMAP3D | |
| Software, algorithm | Data analysis | Westera et al., 2013 DOI: 10.1182/blood-2013-03-488411 | Multiexponential model | |
| Software, algorithm | Data analysis | GraphPad PRISM | GraphPad Software |
Author response table 1
| Patients | IL-7 (pg/ml) | Controls | IL-7 (pg/ml) |
|---|---|---|---|
| C-1 | 62.56 | CTRL1 | 20.37 |
| C-2 | 47.27 | CTRL2 | OOR < |
| C-3 | 17.08 | CTRL3 | 81.35 |
| F-1 | OOR < | CTRL4 | 7.91 |
| F-2 | OOR < | CTRL5 | 113.81 |
| F-3 | OOR < | CTRL7 | OOR < |
| A-1 | OOR < | CTRL8 | 1.37 |
| A-2 | OOR < | CTRL9 | 13.21 |
| A-3 | OOR < | CTRL10 | 113.22 |
| A-4 | OOR < | ||
| D-1 | OOR < | ||
| D-2 | 14.71 | ||
| D-4 | 39.94 | ||
| E-1 | OOR < | ||
| E-2 | OOR < | ||
| E-3 | OOR < | ||
| B-1 | OOR < | ||
| B-2 | OOR < |
Additional files
Download links
A two-part list of links to download the article, or parts of the article, in various formats.
Downloads (link to download the article as PDF)
Open citations (links to open the citations from this article in various online reference manager services)
Cite this article (links to download the citations from this article in formats compatible with various reference manager tools)
Cell-density independent increased lymphocyte production and loss rates post-autologous HSCT
eLife 10:e59775.
https://doi.org/10.7554/eLife.59775


