Genetic timestamping of plasma cells in vivo reveals tissue-specific homeostatic population turnover
- Immunity and Cancer, The Francis Crick Institute, United Kingdom
- Peter Gorer Department of Immunobiology, School of Immunology & Microbial Sciences, King’s College London, United Kingdom
Figures
Figure 1

Jchain transcripts are highly enriched in plasma cells.
(A) Schematic of the network of factors associated with plasma cell differentiation. Upward arrows indicate increased expression compared to the precursor population. (B–D) Differential gene expression analysis using RNA sequencing data (ImmGen, Heng et al., 2008). (B) Analysis of Xbp1 and Irf4, which encode for XBP1 and IRF4, respectively. (C) Analysis of Sdc1 and Prdm1, which encode for CD138 and BLIMP1, respectively. (D) Analysis for Jchain (Igj) that encodes for JCHAIN. ‘x’ indicates fold change. Expression Value Normalized by DESeq2. http://rstats.immgen.org/Skyline/skyline.html.
-
Figure 1—source data 1
Gene expression values normalised by DESeq2.
- https://cdn.elifesciences.org/articles/59850/elife-59850-fig1-data1-v2.xlsx
Figure 2 with 2 supplements
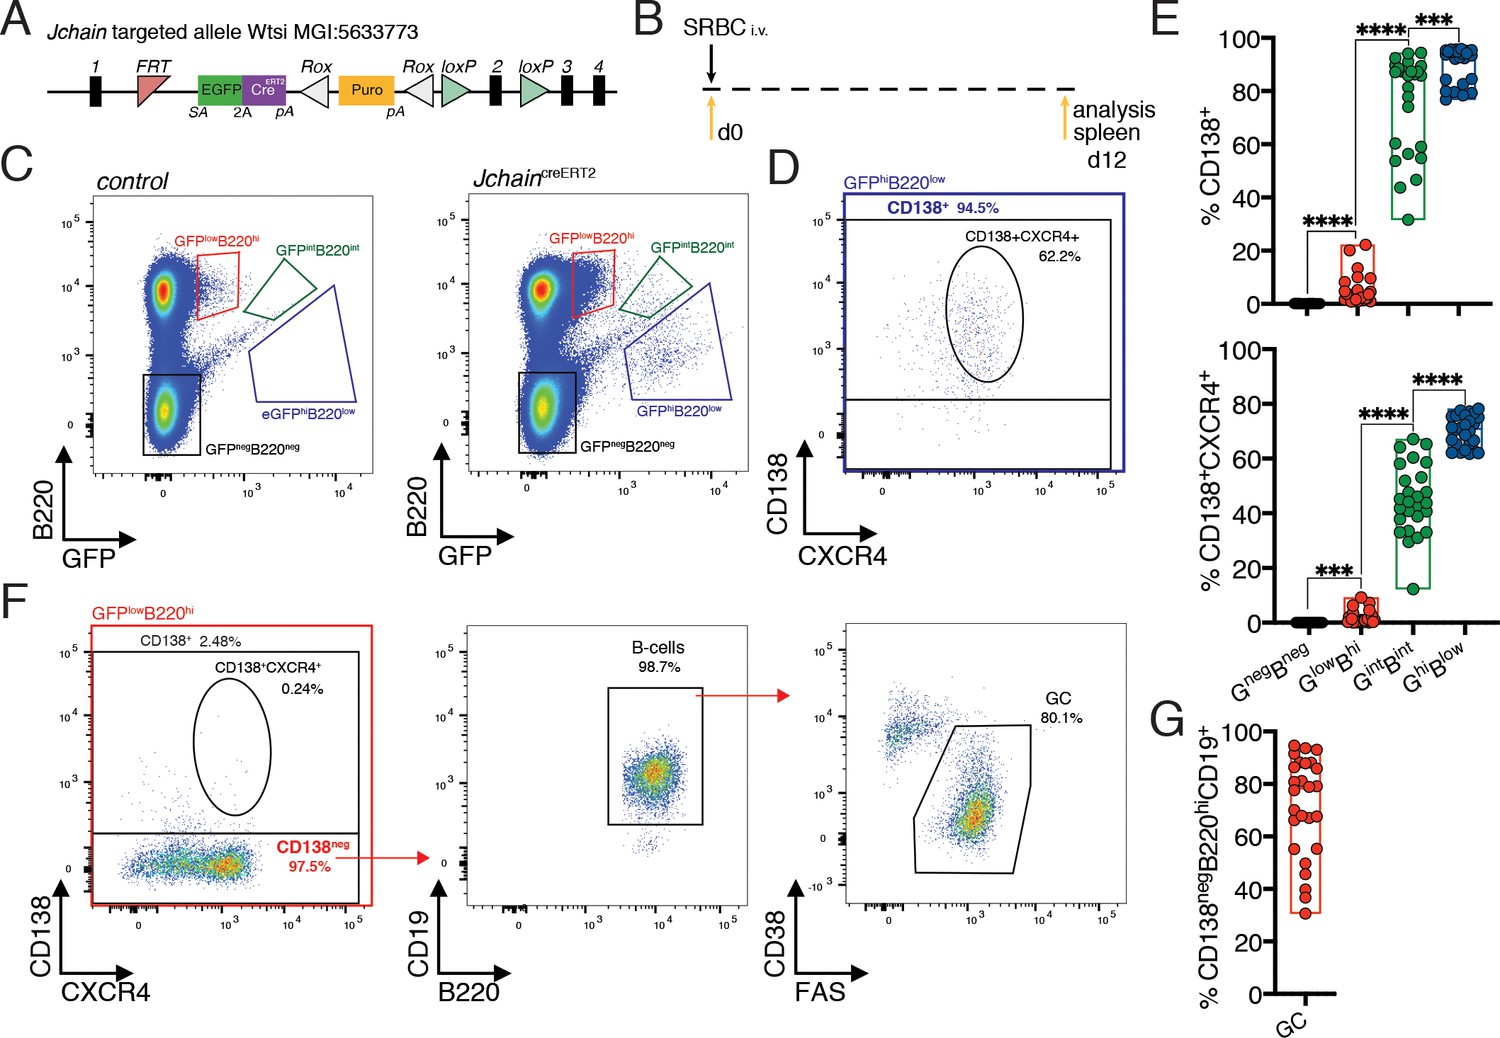
Jchain is expressed in a small fraction of GC B cells and in most plasma cells.
(A) Schematic of Jchain targeted allele Wtsi MGI:5633773. Rectangular boxes indicate exons, and exon number is on top; pink triangle indicates an FRT sequence; EGFPcreERT2 cassette contains a splice acceptor site (SA)-led EGFP-2A-creERT2 expression cassette followed by a poly-A tail inserted in the intron between exons 1 and 2; white triangle indicates a ROX sequence; orange rectangle indicates a promoter-driven puromycin resistance cassette; green triangle indicates loxP sequence. (B) Schematic of experimental procedure protocol. Mice carrying the JchaincreERT2 allele were immunized with sheep red blood cells (SRBC) intravenously (i.v.) on day 0 and spleens of mice were analyzed at day 12 post-immunization. (C) Gating strategy of populations by flow-cytometry according to the expression of GFP and B220 in mice carrying the JchaincreERT2 allele and wild-type B6 mice for a negative control of GFP expression. (D) Gating strategy by flow-cytometry for plasma cells within the GFPhiB220low population using CD138+ and CD138+CXCR4+ markers. (E) Cumulative data for CD138+ and CD138+CXCR4+plasma cells analyzed as in (D). Top: fraction of CD138+plasma cells; bottom: fraction of CD138+CXCR4+plasma cells within the four populations defined by flow-cytometry according to the expression of GFP and B220 in mice carrying the JchaincreERT2 allele. (F) Gating strategy by flow-cytometry for total CD138+ and CD138+CXCR4+plasma cells within GFPlowB220hi population. The CD138neg cell fraction within the GFPlowB220hi population was analyzed for the CD19 B cell marker and stained for CD38 and FAS to determine germinal center (GC) B cells. (G) Cumulative data for the frequency of GC B cells within the CD138negGFPlowB220hi population. Each symbol (E: n = 26, G: n = 26) represents an individual mouse; small horizontal lines indicate median, minimum, and maximum values. ***=p ≤ 0.001, ****=p ≤ 0.0001 (unpaired Student’s t-test). Data are representative of three independent experiments (E, G).
-
Figure 2—source data 1
Frequency of plasma cells or B cells within the populations defined by GFP and B220 expression.
- https://cdn.elifesciences.org/articles/59850/elife-59850-fig2-data1-v2.xlsx
Figure 2—figure supplement 1

Cell marker enrichment within the GFPlowB220hi population.
(A) Cumulative data for the frequency of GFPlowB220hi (GlowBhi) within live cells. (B) Cumulative data for the frequency of GC B cells within the CD138negGFPlowB220hi population. (C–D) Cumulative data for CD138+ (C) and CD138+CXCR4+ (D) cells within the GFPlowB220hi population. Each symbol (n = 26) represents an individual mouse; small horizontal lines indicate median, minimum, and maximum values. ns = not significant, **=p ≤ 0.01, ***=p ≤ 0.001 (unpaired Student’s t-test). Data are representative of three independent experiments (A–D).
-
Figure 2—figure supplement 1—source data 1
Cell marker enrichment within the GFPlowB220hi population.
- https://cdn.elifesciences.org/articles/59850/elife-59850-fig2-figsupp1-data1-v2.xlsx
Figure 2—figure supplement 2
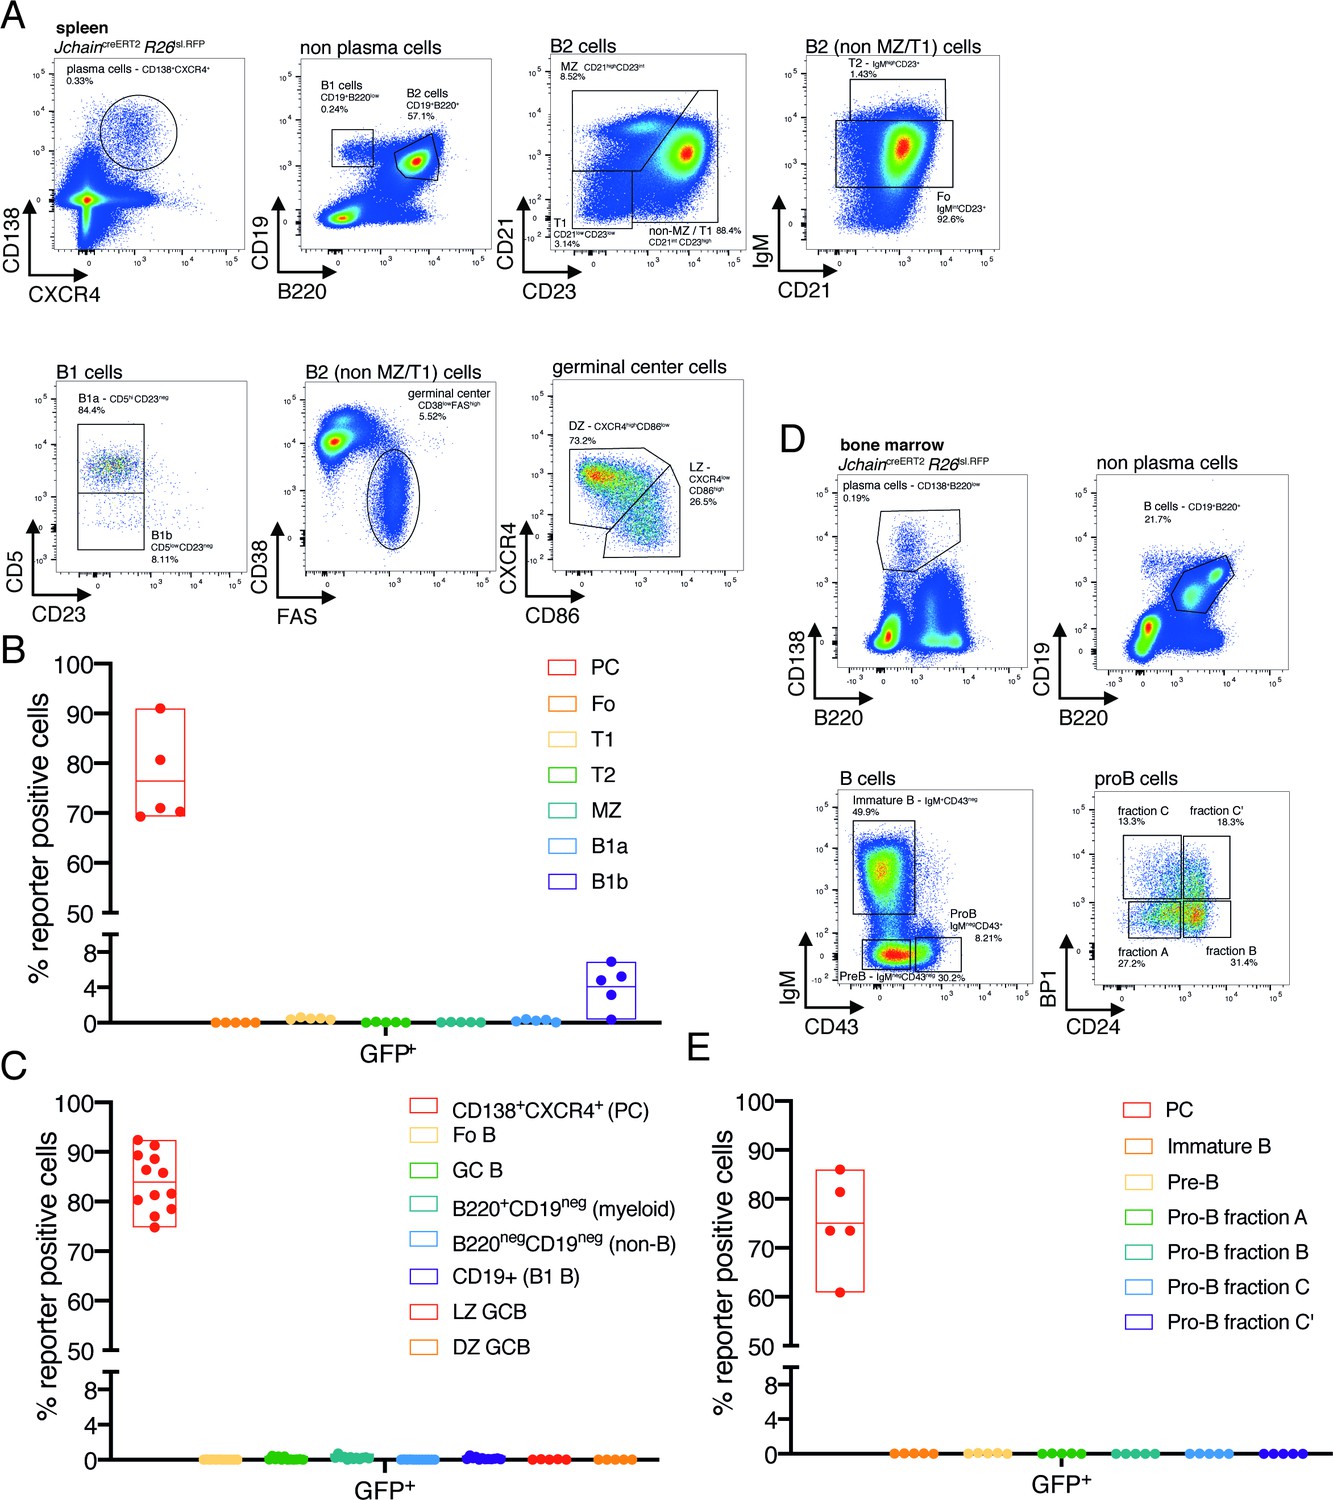
Jchain expression in multiple stages of B cell development and other cell lineages.
(A) Gating strategy by flow-cytometry for the B cell lineage in the spleen. Mice carrying the JchaincreERT2 and R26lslRFP alleles were immunized with sheep red blood cells (SRBC) intravenously (i.v.) at day 0 and spleens were analyzed at day 12. Mice did not receive tamoxifen treatment. Cells were pre-gated on live singlets and for the expression of CD138 and CXCR4 markers. CD138+CXCR4+ cells were defined as plasma cells (PC). Non-PCs positive for the CD19 and B220 markers were defined as B2 cells, whereas those cells displaying a CD19+B220low were defined as B1 cells. B1 cells were further characterized as B1a (CD5hiCD23neg) and B1b (CD5lowCD23neg) cells. B2 cells were further delineated into marginal zone (MZ) B cells (CD21hiCD23int), T1 B cells (CD21lowCD23low), T2 B cells (CD21intIgMhiCD23hi), and follicular B cells (Fo, CD21intIgMintCD23hi). Non MZ or T1 cells were gated for germinal center (GC) B cells (CD38lowFAShigh) and these were further delineated into dark zone GC B cells (CXCR4highCD86low) and light zone GC B cells (CXCR4lowCD86high; Bonami et al., 2014) (B) Cumulative data for the GFP+ cell fraction within the B cell lineage in the spleen. Analyzed as in (A). (C) Cumulative data for the GFP+ cell fraction in additional B cell lineage and non-B cell lineage populations in the spleen. Analyzed as in (A). (D) Gating strategy by flow-cytometry for the B cell lineage in the bone marrow. Mice carrying the JchaincreERT2 and R26lslRFP alleles were immunized with sheep red blood cells (SRBC) intravenously (i.v.) at day 0 and spleens were analyzed at day 12. Mice did not receive tamoxifen treatment. Cells were pre-gated on live singlets and gated for CD138 and B220 expression. CD138+B220low cells were defined as plasma cells (PCs). Non-PCs positive for the CD19 and B220 markers were examined and further delineated to immature B cells (IgM+CD43neg), Pre-B cells (fraction D; IgMnegCD43neg), and Pro-B cells (IgMnegCD43+). Pro B cells were further sub-divided into Hardy fraction A (BP1negCD24neg), fraction B (BP1negCD24+), fraction C (BP1+CD24neg) and fraction C’ (BP1+CD24+). (E) Cumulative data for the GFP+ cell fraction in the B cell lineage and in plasma cells in the bone marrow. Analyzed as in (D). Each symbol (B: n = 5, C: n = 12, E: n = 5) represents an individual mouse; small horizontal lines indicate median, minimum, and maximum values. Data are representative of three independent experiments (B, C, E).
-
Figure 2—figure supplement 2—source data 1
Frequency of GFP+ cells within the various immune populations in the spleen and bone marrow.
- https://cdn.elifesciences.org/articles/59850/elife-59850-fig2-figsupp2-data1-v2.xlsx
Figure 3 with 1 supplement
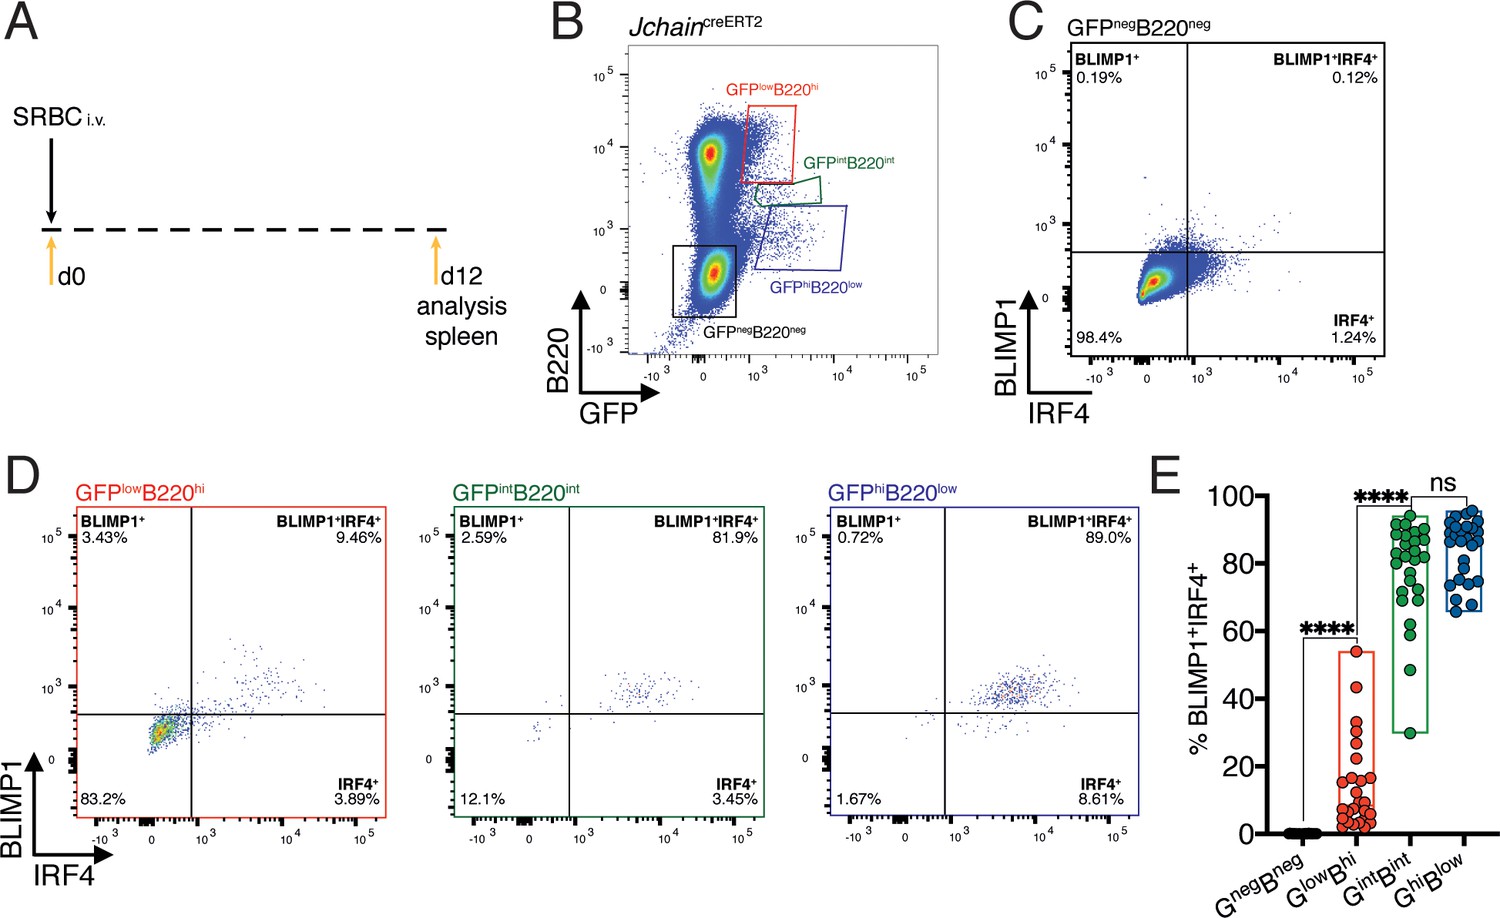
Jchain expression correlates with that of IRF4 and BLIMP1.
(A) Schematic of experimental procedure protocol. Mice carrying the JchaincreERT2 allele were immunized with sheep red blood cells (SRBC) intravenously (i.v.) on day 0 and spleens of mice were analyzed at day 12 post-immunization. (B) Gating strategy of populations by flow-cytometry according to the expression of GFP and B220 in mice carrying the JchaincreERT2 allele. (C) Gating strategy for IRF4 and BLIMP1 expression by flow-cytometry within the GFPnegB220neg population. (D) Gating strategy for IRF4 and BLIMP1 expression by flow-cytometry within GFPlowB220hi, GFPintB220int, and GFPhiB220low populations, defined as in (B). (E) Cumulative data for the frequency of BLIMP1+IRF4+ cells within the four populations defined as in (B). Each symbol in (E: n = 26) represents an individual mouse; small horizontal lines indicate median, minimum, and maximum values. ns = not significant, ***=p ≤ 0.001, ****=p ≤ 0.0001 (unpaired Student’s t-test). Data are representative of three independent experiments (E).
-
Figure 3—source data 1
Frequency of BLIMP1+IRF4+ cells within the populations defined by GFP and B220 expression.
- https://cdn.elifesciences.org/articles/59850/elife-59850-fig3-data1-v2.xlsx
Figure 3—figure supplement 1
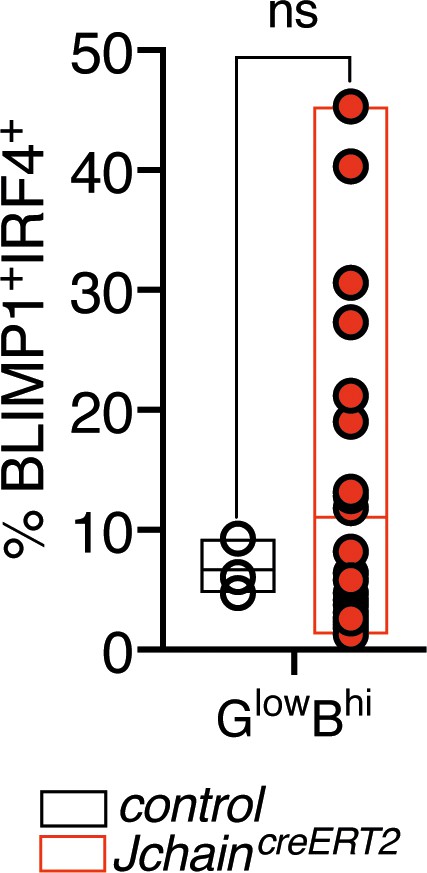
BLIMP1+IRF4+ cells within the GFPlowB220hi population.
Cumulative data for the frequency of BLIMP1+IRF4+ cells within GFPlowB220hi cells. Each symbol (n = 26) represents an individual mouse; small horizontal lines indicate median, minimum, and maximum values. ns = not significant (unpaired Student’s t-test). Data are representative of three independent experiments.
-
Figure 3—figure supplement 1—source data 1
Frequency of BLIMP1+IRF4+ cells within the GFPlowB220hi population.
- https://cdn.elifesciences.org/articles/59850/elife-59850-fig3-figsupp1-data1-v2.xlsx
Figure 4 with 2 supplements
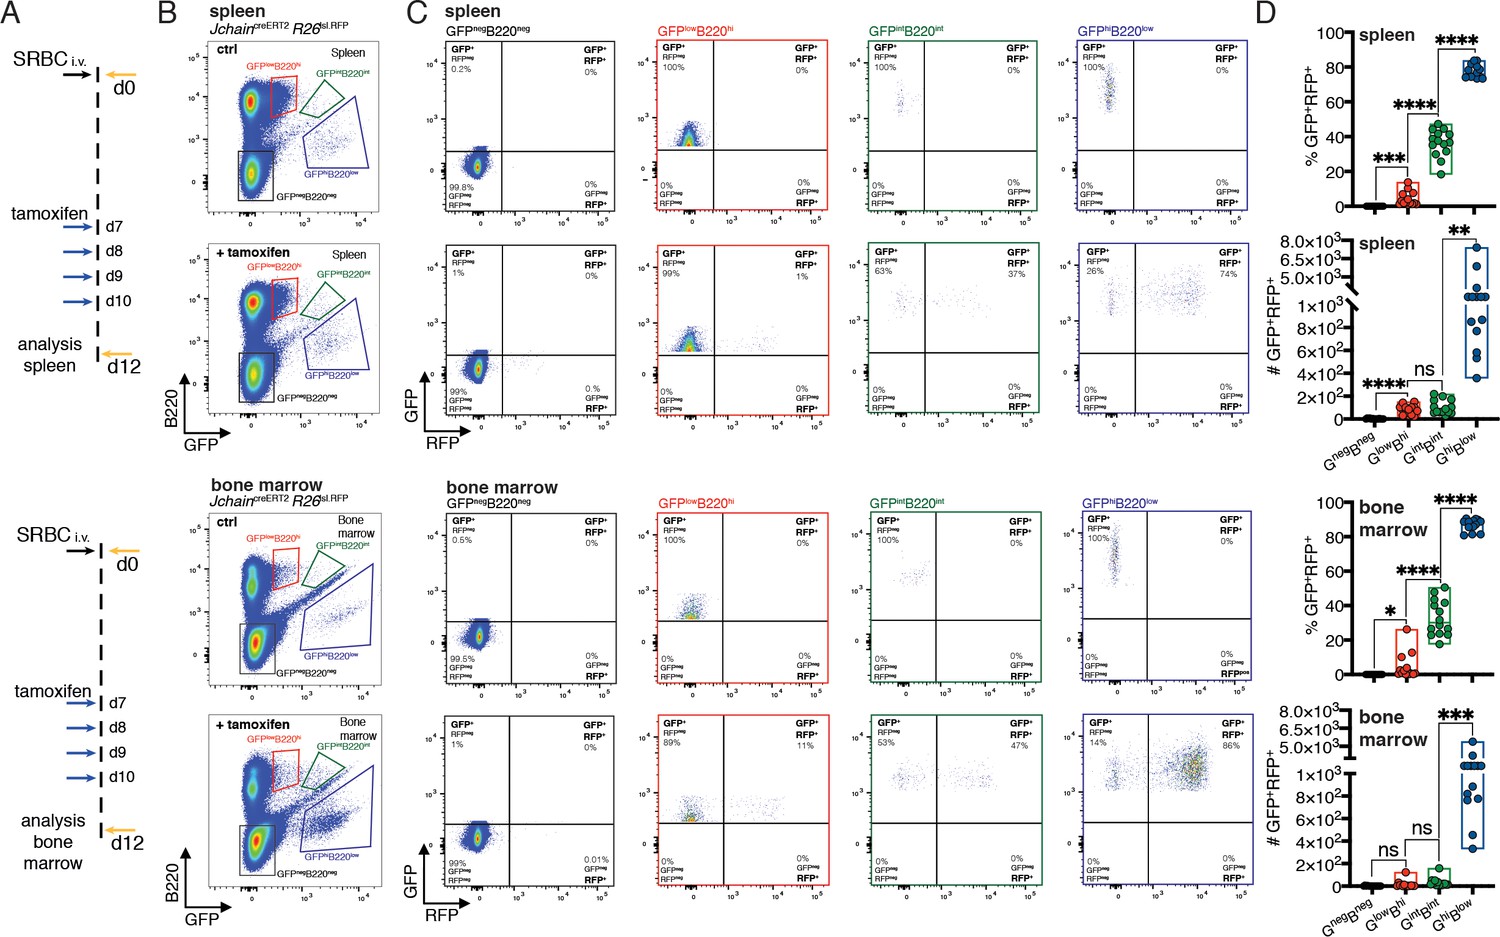
JchaincreERT2 mediated genetic manipulation is effective only in plasma cells.
(A) Schematic of experimental procedure protocol. Mice carrying the JchaincreERT2 and R26lslRFP alleles were immunized with sheep red blood cells (SRBC) intravenously (i.v.) on day 0 and spleens (top) and bone marrow (bottom) of mice were analyzed at day 12 post-immunization. A group of mice received tamoxifen treatment for four consecutive days from day 7 to day 10 after immunization. (B) Gating strategy of populations by flow-cytometry in the spleen (top) and bone marrow (bottom) according to the expression of GFP and B220 in mice carrying the JchaincreERT2 allele. (C) Gating strategy for GFP and RFP expression by flow-cytometry in the four populations defined as in (B). Top: spleen; bottom: bone marrow. (D) Cumulative data for the frequency and number of GFP+RFP+ cells within GFPnegB220neg, GFPlowB220hi, GFPintB220int, and GFPhiB220low populations, defined as in (B). Top: spleen; bottom: bone marrow. Each symbol (D: n = 14) represents an individual mouse; small horizontal lines indicate median, minimum, and maximum values. ns = not significant, *=p ≤ 0.05, **=p ≤ 0.01, ***=p ≤ 0.001, ****=p ≤ 0.0001 (unpaired Student’s t-test). Data are representative of three independent experiments (D).
-
Figure 4—source data 1
Frequency and number of GFP+RFP+ cells within the populations defined by GFP and B220 expression.
- https://cdn.elifesciences.org/articles/59850/elife-59850-fig4-data1-v2.xlsx
Figure 4—figure supplement 1

JchaincreERT2 mediated genetic manipulation in vitro.
(A) Gating strategy by flow-cytometry for GFP and RFP expression within CD19+B220+ B cells and B220lowCD138+ plasmablasts. Splenic B cells from unmanipulated mice carrying the JchaincreERT2 and R26lslRFP alleles were enriched using CD43 negative depletion (MACS) and cultured in vitro in the presence of LPS and 4-hydroxytamoxifen (4-OH-TAM). Cells were analyzed 48, 72, and 96 hr time-points for GFP and RFP expression by flow-cytometry. Data from 96 hr analysis of a B cell culture with LPS and 1 μM 4-OH-TAM is shown as example. (B) Cumulative data for fractions of GFPnegRFPneg, GFP+RFPneg, GFP+RFP+ cells within B cells. Analyzed as in (A). (C) Cumulative data for fractions of GFPnegRFPneg, GFP+RFPneg, GFP+RFP+ cells within plasmablasts. Analyzed as in (A).
-
Figure 4—figure supplement 1—source data 1
Fractions of populations defined by GFP and RFP expression within B cells or plasmablasts in vitro.
- https://cdn.elifesciences.org/articles/59850/elife-59850-fig4-figsupp1-data1-v2.xlsx
Figure 4—figure supplement 2
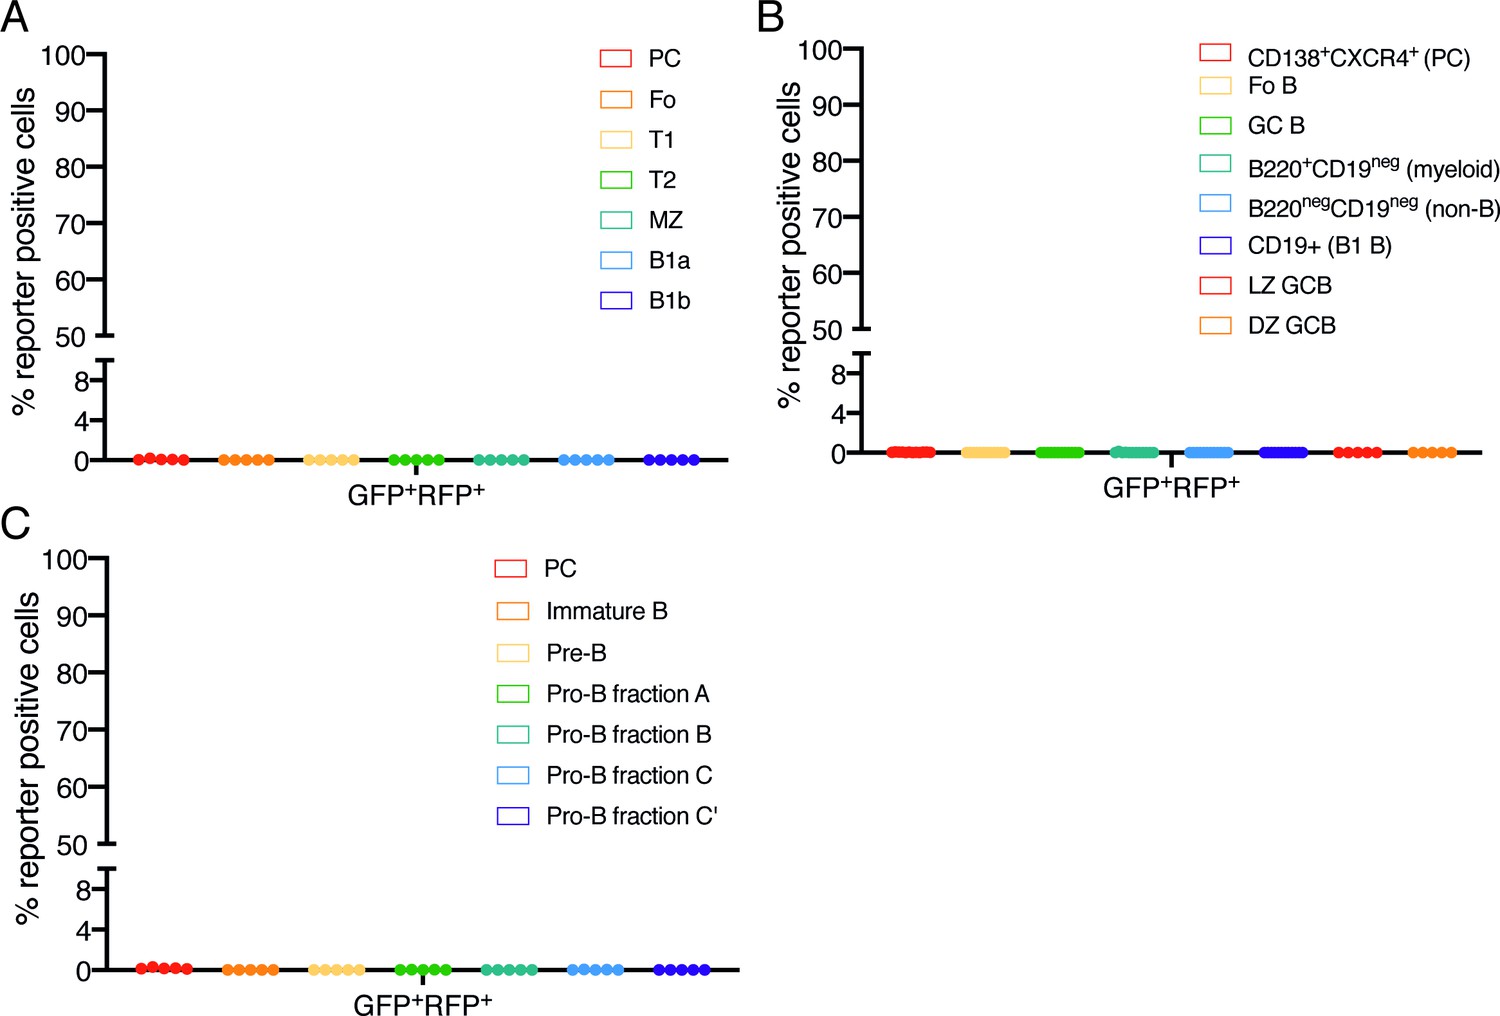
The cre activity of the JchaincreERT2 allele is tightly regulated.
(A) Cumulative data for fraction of GFP+RFP+ cells within the B cell lineage in the spleen. Analyzed as in Figure 2—figure supplement 2 panel (A). (B) Cumulative data for fraction of GFP+RFP+ cells in additional B cell lineage and non-B cell lineage populations in the spleen. Analyzed as in Figure 2—figure supplement 2 panel (A). (C) Cumulative data for fraction of GFP+RFP+ cells in the B cell lineage and in plasma cells in the bone marrow. Analyzed as in Figure 2—figure supplement 2 panel (D). Each symbol (A: n = 5, B: n = 12, C: n = 5) represents an individual mouse; small horizontal lines indicate median, minimum, and maximum values. Data are representative of three independent experiments (A, B, C).
-
Figure 4—figure supplement 2—source data 1
Frequency of GFP+RFP+ cells within the various immune populations in the spleen and bone marrow.
- https://cdn.elifesciences.org/articles/59850/elife-59850-fig4-figsupp2-data1-v2.xlsx
Figure 5
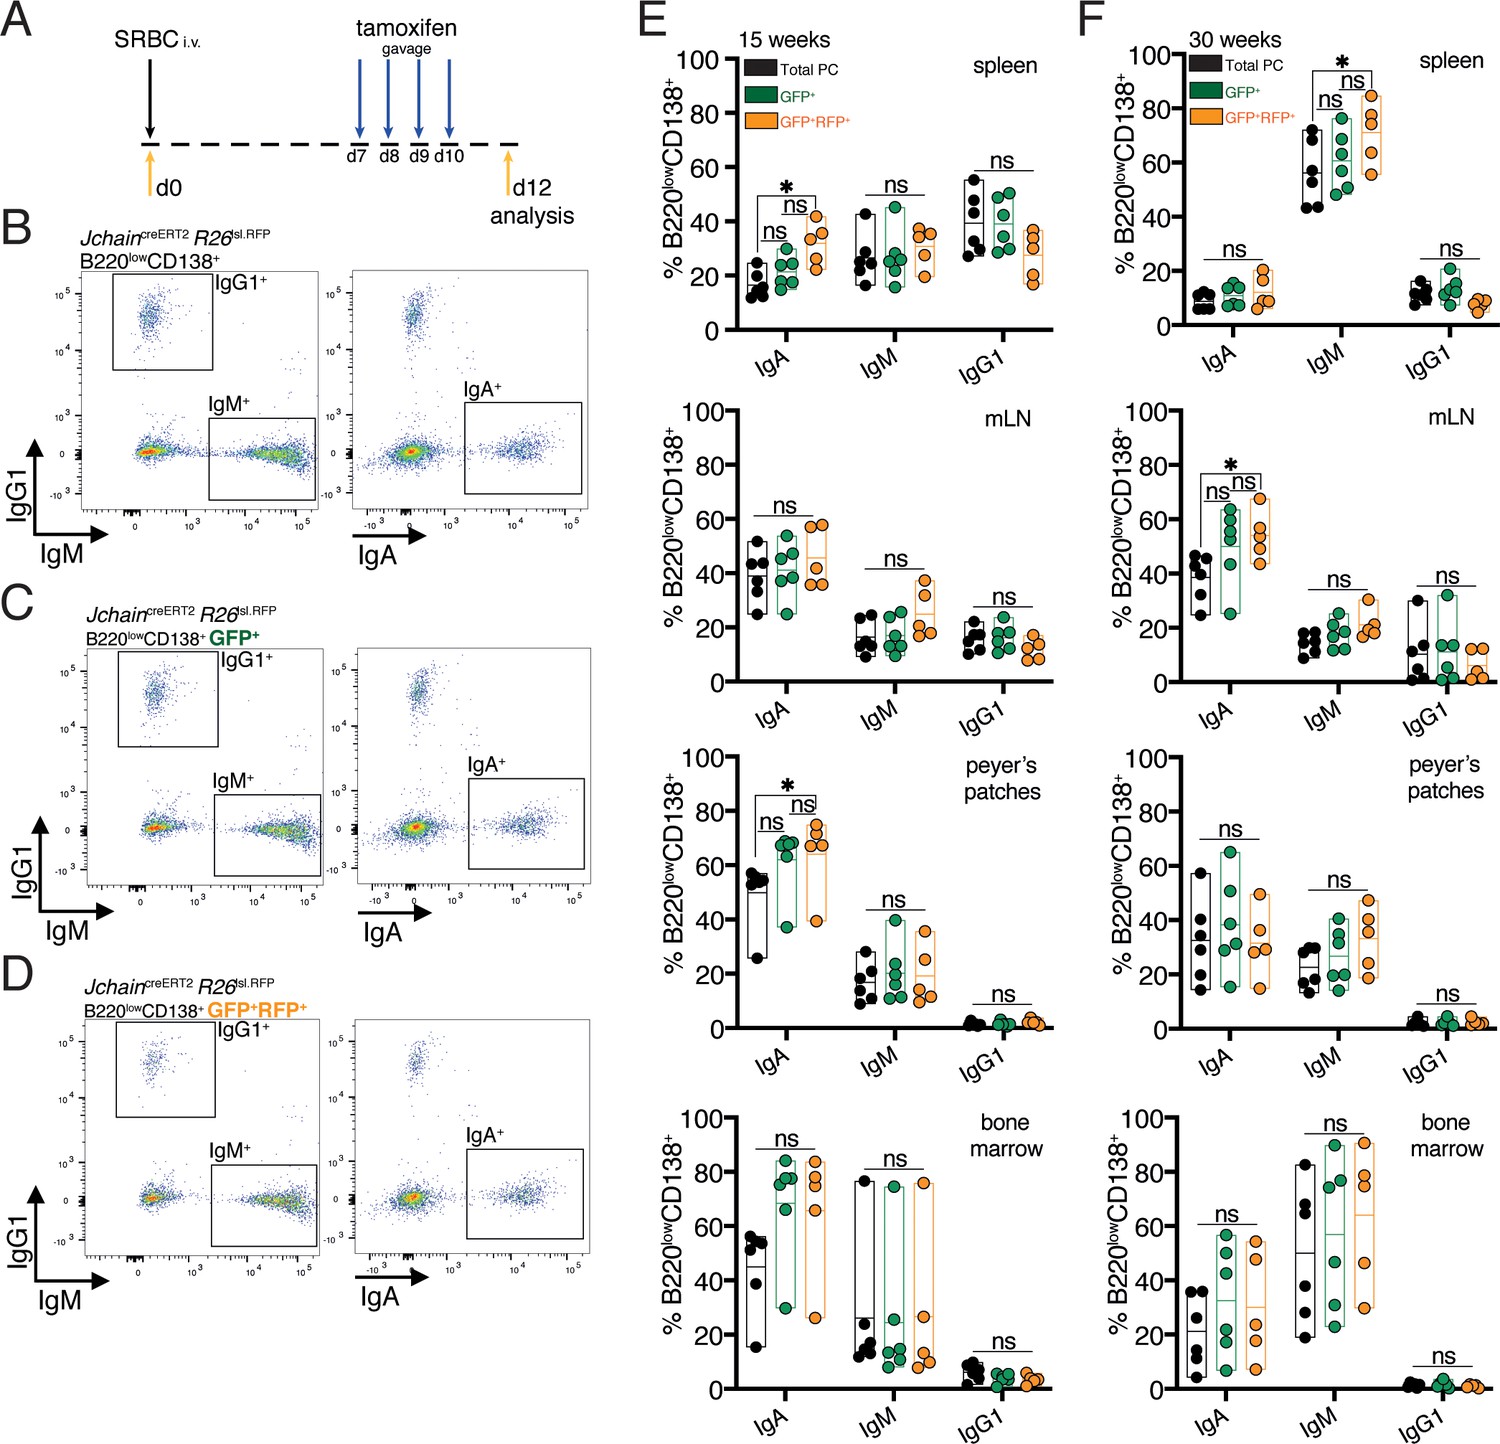
Genetic manipulation using JchaincreERT2 occurs across immunoglobulin isotypes.
(A) Schematic of experimental procedure protocol. Mice carrying the JchaincreERT2 and R26lslRFP alleles were immunized with sheep red blood cells (SRBC) intravenously (i.v.) on day 0 and spleens, mesenteric lymph nodes (mLN), Peyer’s patches, and bone marrows of mice were analyzed at day 12 post-immunization. Mice received tamoxifen treatment for four consecutive days from day 7 to day 10 after immunization. (B) Gating strategy by flow-cytometry for intracellular and extracellular expression of IgG1, IgM and IgA within total B220lowCD138+plasma cells. Analysis in the spleen is provided as example. (C) Gating strategy by flow-cytometry for intracellular and extracellular expression of IgG1, IgM, and IgA within B220lowCD138+GFP+ (RFP+ and RFPneg) plasma cells. Analysis in the spleen is provided as example. (D) Gating strategy by flow-cytometry for intracellular and extracellular expression of IgG1, IgM, and IgA within B220lowCD138+GFP+RFP+plasma cells. Analysis in the spleen is provided as example. (E) Cumulative data for the fractions of IgA, IgM or IgG1 expressing cells within total plasma cells (PC) (black, B220lowCD138+), GFP+ (RFP+ and RFPneg) plasma cells (green, B220lowCD138+GFP+), and GFP+RFP+plasma cells (orange, B220lowCD138+GFP+RFP+) at 15 weeks of age. (F) Cumulative data for the fractions of IgA, IgM, or IgG1 expressing cells within total plasma cells (PC) (black, B220lowCD138+), GFP+ (RFP+ and RFPneg) plasma cells (green, B220lowCD138+GFP+), and GFP+RFP+plasma cells (orange, B220lowCD138+GFP+RFP+) at 30 weeks of age. Each symbol (E: n = 5–6, F: n = 5–6) represents an individual mouse; small horizontal lines indicate median, minimum, and maximum values. ns = not significant, *=p ≤ 0.05 (unpaired Student’s t-test). Data are representative of three independent experiments (E, F).
-
Figure 5—source data 1
Fractions of IgA, IgM or IgG1-expressing cells within populations of plasma cells defined by GFP and RFP expression at various immune sites.
- https://cdn.elifesciences.org/articles/59850/elife-59850-fig5-data1-v2.xlsx
Figure 6
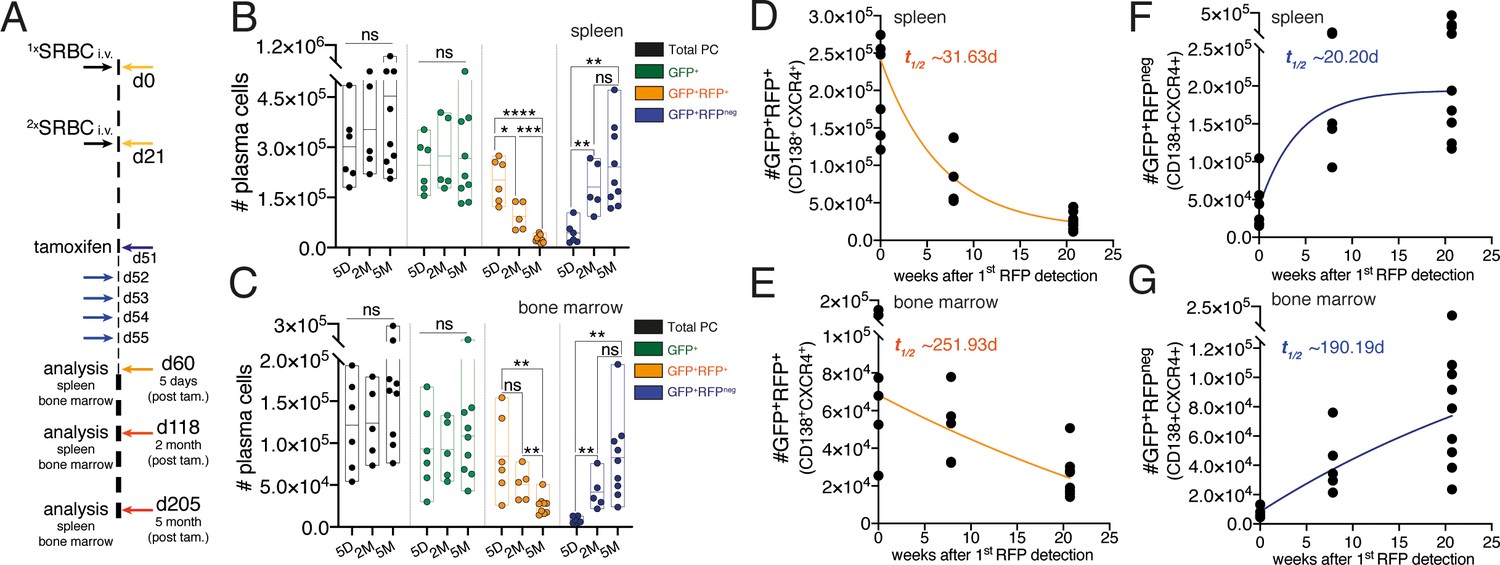
Inclusive analysis of plasma cell dynamics reveals tissue-specific homeostatic population turnover.
(A) Schematic of the experimental procedure protocol. Mice carrying the JchaincreERT2 and R26lslRFP alleles were immunized twice with sheep red blood cells (SRBC) intravenously (i.v.) on day 0 and day 21. Mice received tamoxifen treatment for five consecutive days from day 51 to 55 after the first immunization. Spleens and bone marrow of mice were analyzed at day 5, 2-month, and 5-month timepoints after the last tamoxifen administration. (B) Cumulative data for the absolute cell numbers of total PCs, of GFP+ cells (RFP+ and RFPneg), GFP+RFP+ cells (cre recombined), and GFP+RFPneg cells (not cre recombined) in the spleen. (C) Cumulative data for the absolute cell numbers of total PCs, of GFP+ cells (RFP+ and RFPneg), GFP+RFP+ cells (cre recombined), and GFP+RFPneg cells (not cre recombined) in the bone marrow. (D) Graphical representation of half-life (t1/2) of GFP+RFP+CD138+CXCR4+plasma cells in the spleen using the data presented in (B). Graphing of the best-fit curve was performed using the GraphPad Prism eight software. (E) Graphical representation of half-life (t1/2) of GFP+RFP+CD138+CXCR4+plasma cells in the bone marrow using the data presented in (C). Graphing of the best-fit curve was performed using the GraphPad Prism eight software. (F) Graphical representation of half-life (t1/2) of GFP+RFPnegCD138+CXCR4+plasma cells in the spleen using the data presented in (B). Graphing of the best-fit curve was performed using the GraphPad Prism eight software. (G) Graphical representation of half-life (t1/2) of GFP+RFPnegCD138+CXCR4+plasma cells in the bone marrow using the data presented in (C). Graphing of the best-fit curve was performed using the GraphPad Prism eight software. Each symbol (B-G: 5D n = 6; 2M n = 5; 5M n = 9) represents an individual mouse; small horizontal lines indicate median, minimum, and maximum values. ns = not significant, *=p ≤ 0.05 **=p ≤ 0.01, ***=p ≤ 0.001, ****=p ≤ 0.0001 (unpaired Student’s t-test). Data are representative of three independent experiments (B, C).
-
Figure 6—source data 1
Absolute cell numbers of plasma cell populations defined by GFP and RFP expression in the spleen and bone marrow over time.
- https://cdn.elifesciences.org/articles/59850/elife-59850-fig6-data1-v2.xlsx
Tables
Key resources table
| Reagent type (species) or resource | Designation | Source or reference | Identifiers | Additional information |
|---|---|---|---|---|
| Genetic reagent (Mus musculus, C57BL/6) | JchaincreERT2; Jchaintm1(EGFP/cre/ERT2)Wtsi | Wellcome Trust Sanger Institute (WTSI) | MGI: 5633773 | The allele was purchased from EMMA mouse repository in agreement with WTSI, mice were rederived at the Francis Crick Institute. |
| Antibody | Anti-mouse Blimp1(host species: rat, clone: 6D3) | BD Biosciences | Cat#: 565002 | FACS (1:100) |
| Antibody | Anti-mouse CD16/32 Fc Block (host species: rat, clone: 2.4G2) | BD Biosciences | Cat#: 553141 | FACS (1:200) |
| Antibody | Anti-mouse CD19 (host species: rat, clone: 1D3) | BD Biosciences | Cat#: 563557 | FACS (1:200) |
| Antibody | Anti-mouse CD23 (host species: rat, clone: B3B4) | BD Biosciences | Cat#: 563986 | FACS (1:200) |
| Antibody | Anti-mouse CD38 (host species: rat, clone: 90) | BD Biosciences | Cat#: 760361 | FACS (1:200) |
| Antibody | Anti-mouse CD95 (host species: hamster, clone: Jo2) | BD Biosciences | Cat#: 562633 | FACS (1:200) |
| Antibody | Anti-mouse IgG1 (host species: rat, clone: A85-1) | BD Biosciences | Cat#: 560089 | FACS (1:200) |
| Antibody | Anti-mouse CD138 (host species: rat, clone: 281–2) | BD Biosciences | Cat#: 740880 | FACS (1:200) |
| Antibody | Anti-mouse B220 (host species: rat, clone: RA3-6B2) | BioLegend | Cat#: 103247 | FACS (1:200) |
| Antibody | Anti-mouse CD11c (host species: hamster, clone: N418) | BioLegend | Cat#: 117333 | FACS (1:200) |
| Antibody | Anti-mouse CD19 (host species: rat, clone: 6D5) | BioLegend | Cat#: 115543 | FACS (1:200) |
| Antibody | Anti-mouse CD21/35 (host species: Rat, clone: 7E9) | BioLegend | Cat#: 123421 | FACS (1:200) |
| Antibody | Anti-mouse CD43 (host species: rat, clone: 1B11) | BioLegend | Cat#: 121223 | FACS (1:200) |
| Antibody | Anti-mouse CD86 (host species: rat, clone: GL1) | BioLegend | Cat#: 105013 | FACS (1:200) |
| Antibody | Anti-mouse BP1 (host species: rat, clone: 6C3) | Ebioscience | Cat#: 13–5891 | FACS (1:200) |
| Antibody | Anti-mouse CD5 (host species: rat, clone: 53–7.3) | Ebioscience | Cat#: 13-0051-82 | FACS (1:200) |
| Antibody | Anti-mouse CXCR4 (host species: rat, clone: 2B11) | Ebioscience | Cat#: 46-9991-82 | FACS (1:200) |
| Antibody | Anti-mouse IgA (host species: rat, clone: 11-44-2) | Ebioscience | Cat#: 13–5994 | FACS (1:200) |
| Antibody | Anti-mouse IgM (host species: rat, clone: II/41) | Ebioscience | Cat#: 25–5790 | FACS (1:300) |
| Antibody | Anti-mouse IRF4 (host species: rat, clone: 3E4) | Ebioscience | Cat#: 25-9858-80 | FACS (1:200) |
| Commercial assay or kit | BD Cytofix/CytoPerm Fixation/Permeabilization Kit | BD Biosciences | Cat#: 554714 | |
| Commercial assay or kit | Zombie NIR Fixable Viability Kit | BioLegend | Cat#: 423106 | (1:200) |
| Commercial assay or kit | CD43 (Ly-48) MicroBeads, mouse | Miltenyi Biotec | Cat#: 130-049-801 | |
| Chemical compound, drug | (Z) 4-hydroxytamoxifen | Sigma-Aldrich | CAS: 68047-06-3 | |
| Chemical compound, drug | Tamoxifen | Sigma | Cat#: T5648-5G | |
| Chemical compound, drug | Sunflower seed oil from Helianthus annuus | Sigma-Aldrich | Cat#: S5007-250ml | |
| Software, algorithm | FACSDiva software | BD | V9.0 | |
| Software, algorithm | FlowJo | BD | V10 | |
| Software, algorithm | Prism | GraphPad | V7, V8 | |
| Other | Sheep red blood cells (SRBCs) | TCS Biosciences Ltd | Cat#: SB054 |
Additional files
Download links
A two-part list of links to download the article, or parts of the article, in various formats.
Downloads (link to download the article as PDF)
Open citations (links to open the citations from this article in various online reference manager services)
Cite this article (links to download the citations from this article in formats compatible with various reference manager tools)
Genetic timestamping of plasma cells in vivo reveals tissue-specific homeostatic population turnover
eLife 9:e59850.
https://doi.org/10.7554/eLife.59850


