Alcohol potentiates a pheromone signal in flies
- Department of Neuroscience and Waggoner Center for Alcohol and Addiction Research, The University of Texas at Austin, United States
- Department of Pharmacology and Neuroscience, University of Texas Southwestern Medical Center, United States
Figures
Figure 1
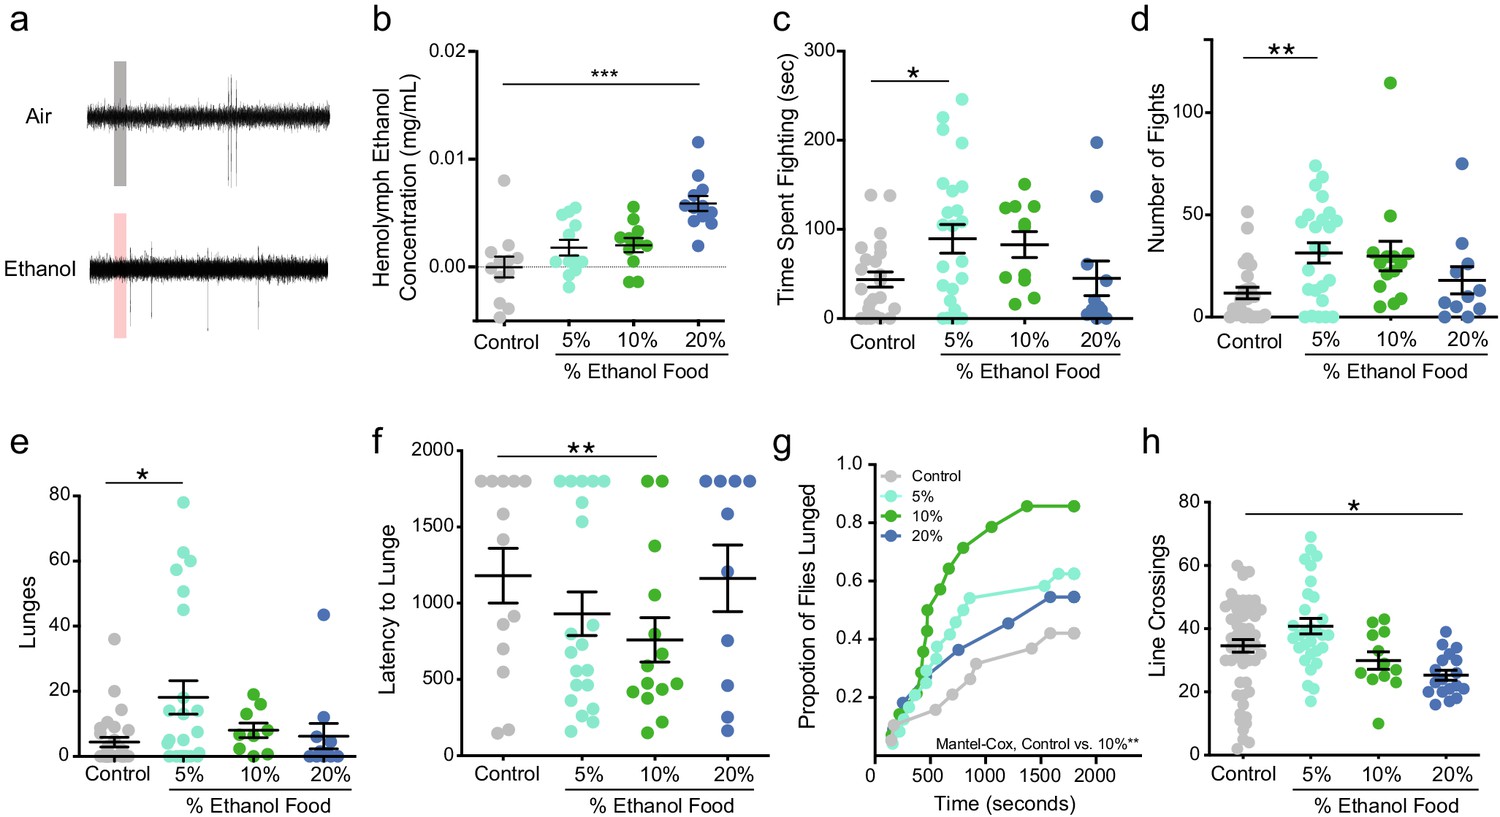
Alcohol odor increases aggression in male flies.
(a) Traces of T1 sensilla recordings with a 300 ms exposure to air or vapor from 30% ethanol. (b) Hemolymph ethanol concentration (mg/mL) in flies in aggression arenas for 30 mins show no significant increases except with 20% ethanol (one-way ANOVA with Dunnett’s p<0.0001, n = 11–12). (c) Time spent fighting on ethanol-containing food (Control vs. 5% p=0.038 Kruskal-Wallis test with Dunn’s correction, n = 10–20). (d) Number of fights on ethanol-containing food (Control vs. 5% p=0.0012, statistical tests as in c). (e) Lunges on ethanol-containing food (Control vs. 5% p=0.0225, statistical tests as in c). (f) Latency to lunge (p=0.009, Log-rank Mantel-Cox with Bonferroni correction). (g) Cumulative latency of flies that lunged during the test (Control vs. 10% p=0.009, Log-rank Mantel-Cox with Bonferroni correction). (h) Locomotion as measured by line crossings during the test (Control vs. 20% p=0.0048, statistical tests as in 1 c). p<0.05 *; p<0.01 **; p<0.001 ***. Error bars denote SEM.
Figure 2
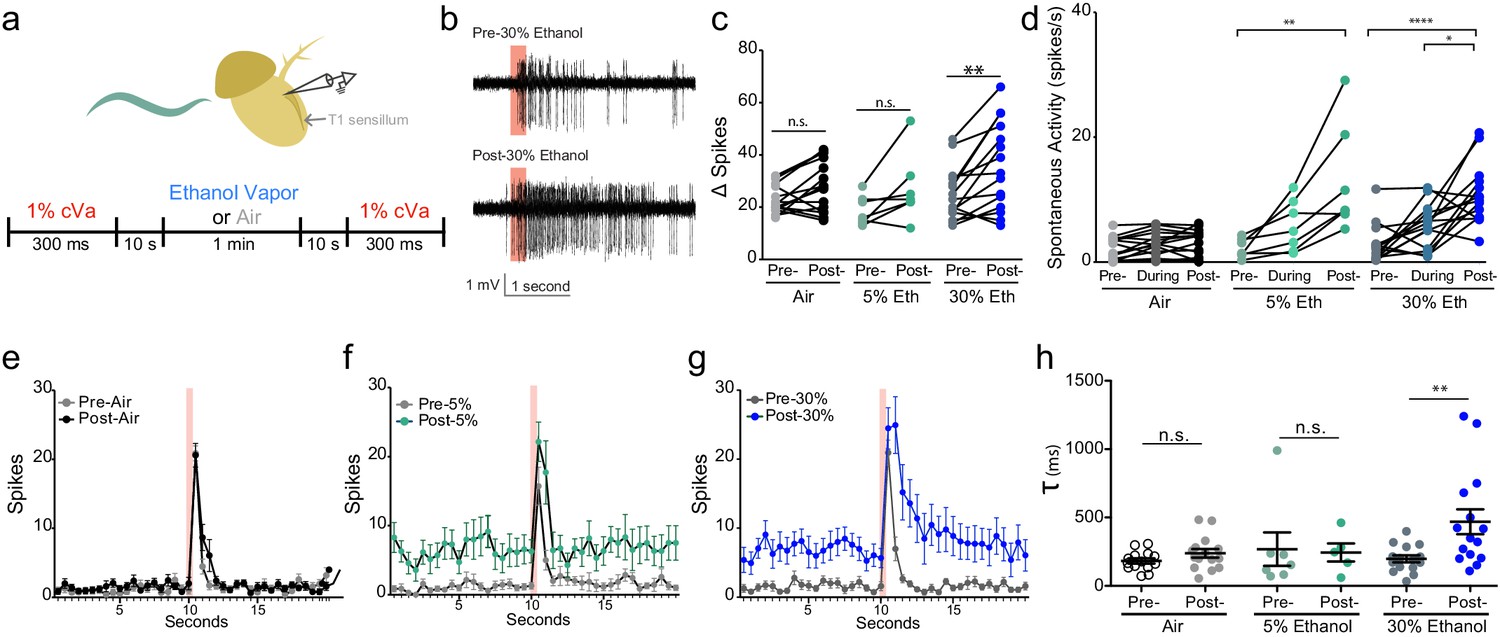
Alcohol odor potentiates the response to cVa.
(a) Experimental timeline and diagram of recording site on fly antenna. (b) Traces of cVa-sensing T1 neurons. The red bar denotes 300 ms cVa exposure. (c) Δ Spikes calculated as cVa-induced activity (1 s during and after cVa) – spontaneous activity (paired two-tailed t-test, p=0.002, n = 7,15,15). (d) Spontaneous activity before, during, and after ethanol exposure. Spontaneous activity calculated as the total number of spikes 10 s prior to cVa delivery/10 s (Pre- vs. Post-5% p=0.002, Pre- vs. Post-30% p<0.0001, During vs. Post-30% p=0.0152, Kruskal-Wallis test with Dunn’s correction). (e), (f), (g) Averaged spikes over time for air, 5% ethanol, and 30% ethanol, respectively. Red bar denotes 300 ms cVa exposure (h) Time constant (τ) of decay of the cVa-induced spikes (Mann-Whitney test, p=0.0043). p>0.05, n.s. (not significant); p<0.05 *; p<0.01 **; p<0.0001 ****. Error bars denote SEM.
Figure 3
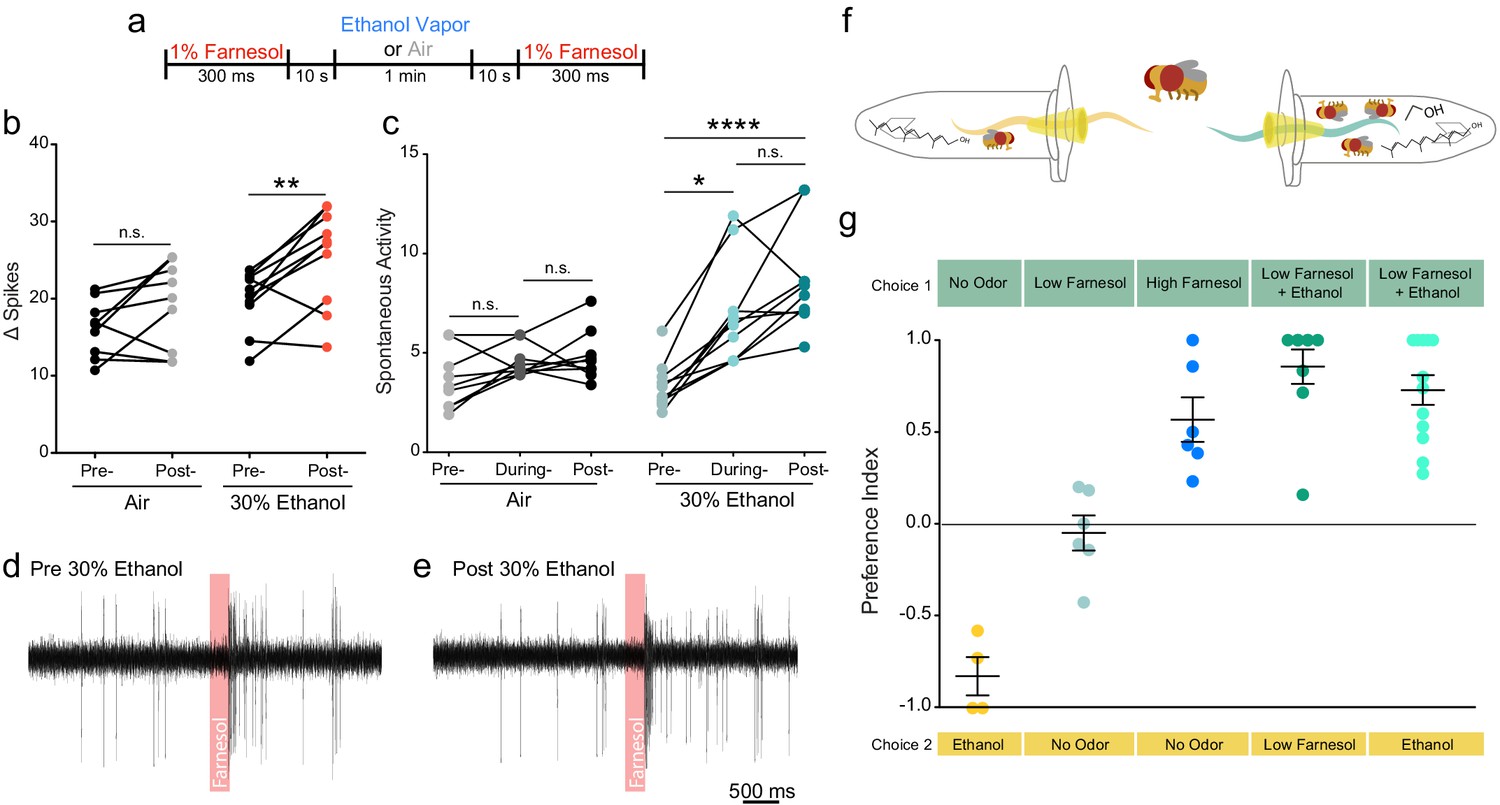
Ethanol increases attraction to and potentiates the neuronal response of a food related odor.
(a) Paradigm used to evaluate farnesol responses pre- and post-ethanol treatment. Responses are shown in panels b-e. (b) Δ Spikes of farnesol-induced activity in ai2 sensilla, calculated as in 2b (paired two-tailed t-test, p=0.0059, n = 9–10). (c) Spontaneous activity before, during, and after ethanol exposure, calculated as in 2 c (Pre- vs. During Ethanol p=0.017, Pre- vs. Post-Ethanol p<0.0001, Kruskal-Wallis test with Dunn’s correction). (d, e) Traces from ai2 farnesol-sensing neurons. The red bar denotes a 300 ms farnesol exposure. (f) Graphic of the two-choice olfactory trap assay used to measure relative attraction to odors. (g) Preference Indices calculated as Number of flies in Choice 1-Number of flies in Choice 2/Total Number of flies. p>0.05, n.s. (not significant); p<0.05 *; p<0.01 **; p<0.0001 ****. Error bars denote SEM.
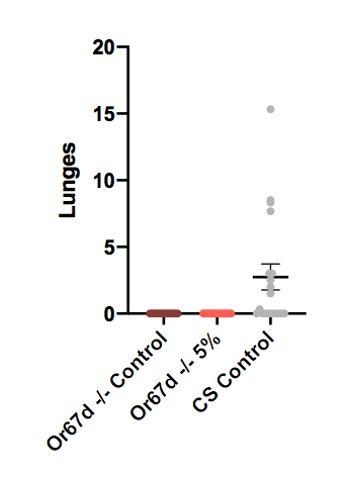
Author response image 1

Author response image 2
Additional files
-
Source data 1
Source Data for Figures.
- https://cdn.elifesciences.org/articles/59853/elife-59853-data1-v2.xlsx
-
Transparent reporting form
- https://cdn.elifesciences.org/articles/59853/elife-59853-transrepform-v2.docx
Download links
A two-part list of links to download the article, or parts of the article, in various formats.
Downloads (link to download the article as PDF)
Open citations (links to open the citations from this article in various online reference manager services)
Cite this article (links to download the citations from this article in formats compatible with various reference manager tools)
Alcohol potentiates a pheromone signal in flies
eLife 9:e59853.
https://doi.org/10.7554/eLife.59853


