Microtubules regulate pancreatic β-cell heterogeneity via spatiotemporal control of insulin secretion hot spots
- Department of Cell and Developmental Biology and Program in Developmental Biology, Vanderbilt University, United States
- Department of Medicine, Vanderbilt University, United States
- Department of Mechanical Engineering, Vanderbilt University, United States
- Department of Molecular Physiology and Biophysics, Vanderbilt University, United States
- Center for Stem Cell Biology, Vanderbilt University, United States
- Department of Chemical and Biomolecular Engineering, Vanderbilt University, United States
- Department of Biochemistry, Vanderbilt University, United States
- Department of Physics and Astronomy, Vanderbilt University, United States
- Department of Mathematics, Vanderbilt University, United States
- Quantitative Systems Biology Center, Vanderbilt University, United States
Figures
Figure 1 with 1 supplement

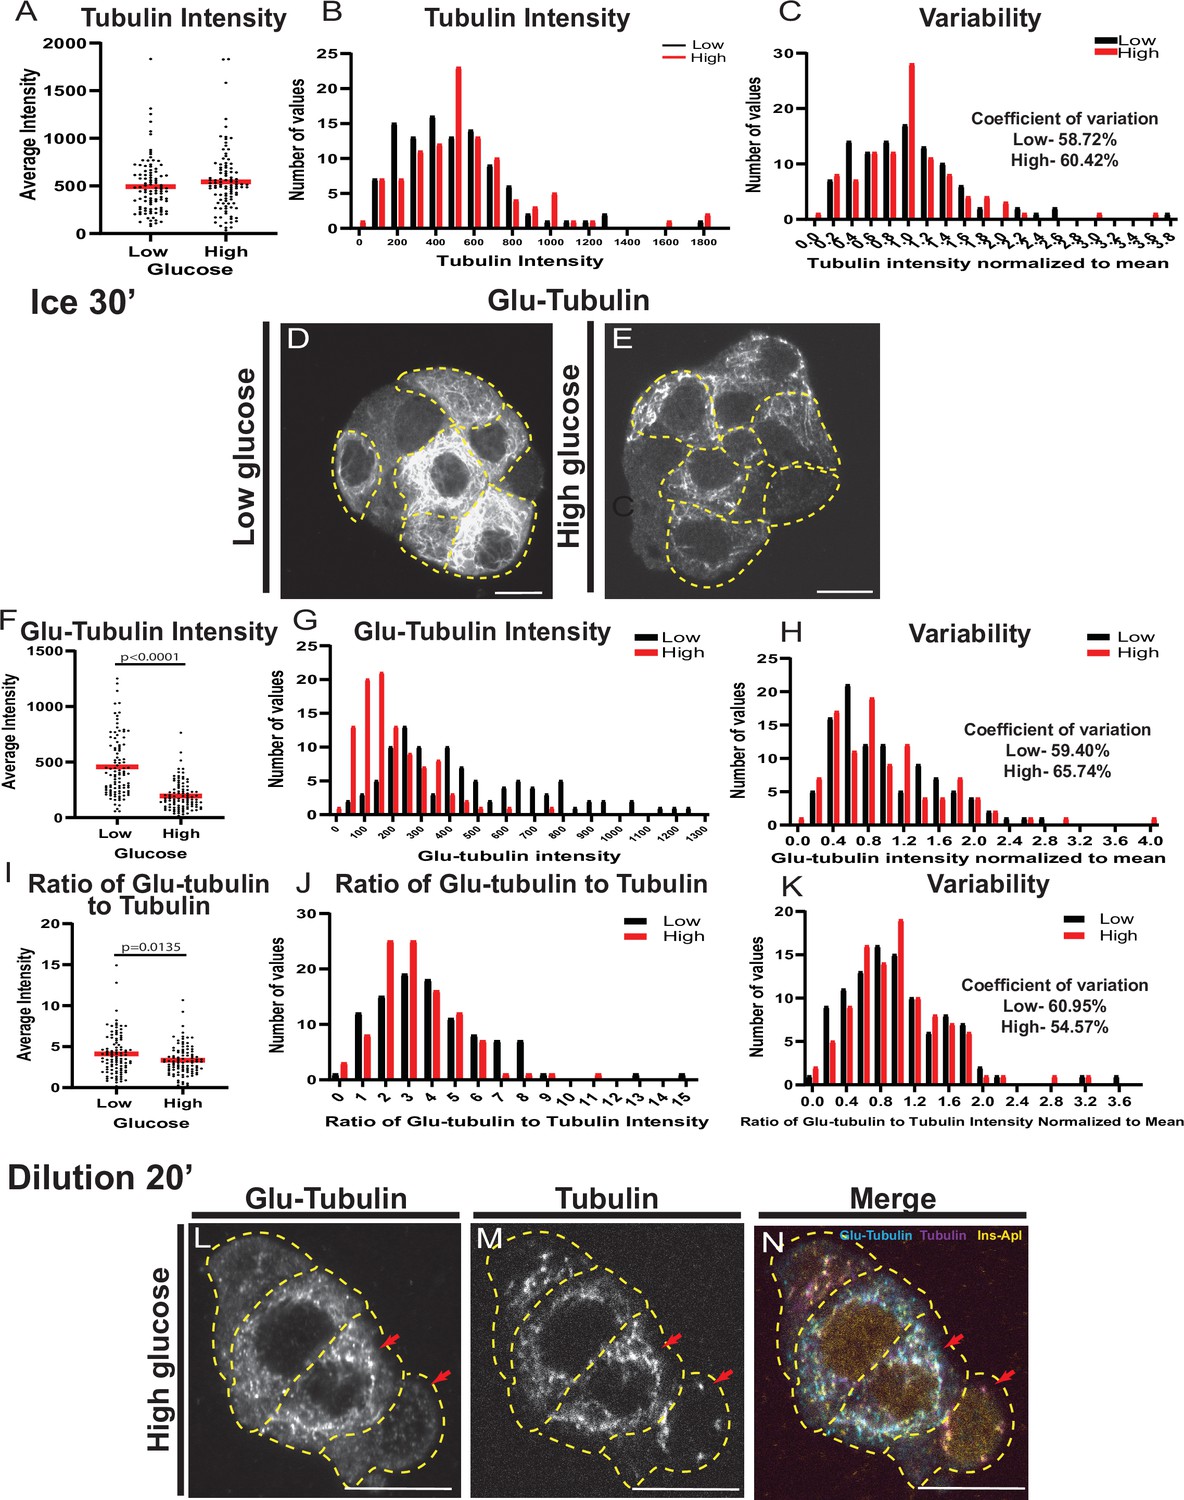
MT stability decreases in high glucose but remains heterogenous.
(A–F) Disseminated islets treated with low (A–C) and high (D–F) glucose stained for Glu-tubulin (A, D) and tubulin (B, E). β-cells (dashed yellow line) were identified using Ins-Apl red nuclei (yellow, C, F). Red arrows point to differences between cells. Merge (C, F) shows Glu-tubulin (cyan), tubulin (magenta), and red nuclear expression of Ins-Apl (yellow). Single slice from the bottom of the cells. Scale bars: 10 µm. (G) Scatterplot of Glu-tubulin average intensity for each cell. Mean, red bar. Student’s t-test, p<0.0001. n=101 cells per condition. (H) Histogram of Glu-tubulin average intensity in low (black) and high (red) glucose. Bin=100. n=101 cells per condition. (I) Histogram of Glu-tubulin average intensity normalized to the mean of each low (black) and high (glucose). Bin=0.2. Coefficient of variation=standard deviation/mean. n=101 cells per condition. (J) Scatterplot of Glu-tubulin to tubulin ratio of average intensity for each cell. Mean, red bar. Student’s t-test, p<0.0001. n=101 cells per condition. (K) Histogram of Glu-tubulin to tubulin ratio of average intensity in low (black) and high (red) glucose. Bin=0.5, overflow bin of >6. n=101 cells per condition. (L) Histogram of Glu-tubulin to tubulin ratio of average intensity normalized to the mean of each low (black) and high (glucose). Bin=0.2. Coefficient of variation=standard deviation/mean. n=101 cells per condition. (M–O) Disseminated islets placed on ice for 30 min in low (M, N) and high glucose (O, P) and stained for tubulin (M, O). β-cells (dashed yellow line) were identified using red nuclear expression of Ins-Apl (yellow, N, P), merged with tubulin (magenta N, P). Red arrows point to differences between cells. Single slice from the bottom of the cells. Scale bars: 10 µm. (Q) Scatterplot of tubulin average intensity for each cell after 30 min in high glucose. Mean, red bar. Student’s t-test, p<0.0001. n=100–101 cells per condition. (R) Histogram of tubulin average intensity in low (black) and high (red) glucose after 30 min on ice. Bin=50. n=100–101 cells per condition. (S) Histogram of tubulin average intensity normalized to the mean of each low (black) and high (glucose) after 30 min on ice. Bin=0.2. Coefficient of variation=standard deviation/mean. n=100–101 cells per condition. MT, microtubule.
-
Figure 1—source data 1
Data for graphs depicted in Figure 1G,H,J,K,L,Q,R,S and Figure 1A,B,C,F,G,H,I,J,K.
Each data set is a separate sheet.
- https://cdn.elifesciences.org/articles/59912/elife-59912-fig1-data1-v3.xlsx
Figure 1—figure supplement 1
MT stability is regulated by glucose stimulation.
(A) Scatterplot of tubulin average intensity for each cell in low or high glucose. Mean, red bar. n=101 cells per condition. (B) Histogram of tubulin average intensity in low (black) and high (red) glucose. Bin=100. n=101 cells per condition. (C) Histogram of tubulin average intensity normalized to the mean of each low (black) and high (glucose). Bin=0.2. Coefficient of variation=standard deviation/mean. n=101 cells per condition. (D, E) Glu-tubulin staining in disseminated islets after 30 min on ice (corresponds to Figure 1M–O). β-cells outlined in dashed yellow lines. Single slice from the bottom of the cell. Scale bars: 10 µm. (F) Scatterplot of Glu-tubulin average intensity for each cell after 30 min on ice in low or high glucose. Mean, red bar. Student’s t-test, p<0.0001. n=100–101 cells per condition. (G) Histogram of Glu-tubulin average intensity in low (black) and high (red) glucose after 30 min on ice. Bin=100. n=100–101 cells per condition. (H) Histogram of Glu-tubulin average intensity normalized to the mean of each low (black) and high (glucose) after 30 min on ice. Bin=0.2. Coefficient of variation=standard deviation/mean. n=100–101 cells per condition. (I) Scatterplot of Glu-tubulin to tubulin ratio of average intensity for each cell after 30 min on ice. Mean, red bar. Student’s t-test, p=0.135. n=100–101 cells per condition. (J) Histogram of Glu-tubulin to tubulin ratio of average intensity in low (black) and high (red) glucose after 30 min on ice. Bin=1.0. n=100–101 cells per condition. (K) Histogram of Glu-tubulin to tubulin ratio of average intensity normalized to the mean of each low (black) and high (glucose) after 30 min on ice. Bin=0.2. Coefficient of variation=standard deviation/mean. n=100–101 cells per condition. (L–N) Disseminated islets extracted for 1 min and placed in buffer for 20 min. Stained for Glu-tubulin (L) and tubulin (M). β-cells were identified by red nuclear Ins-Apl expression (N, yellow), merged with Glu-tubulin (cyan) and tubulin (magenta). Red arrows pointing to differences between cells. Single slice from the bottom of the cells. Scale bars: 10 µm. MT, microtubule.
Figure 2 with 5 supplements
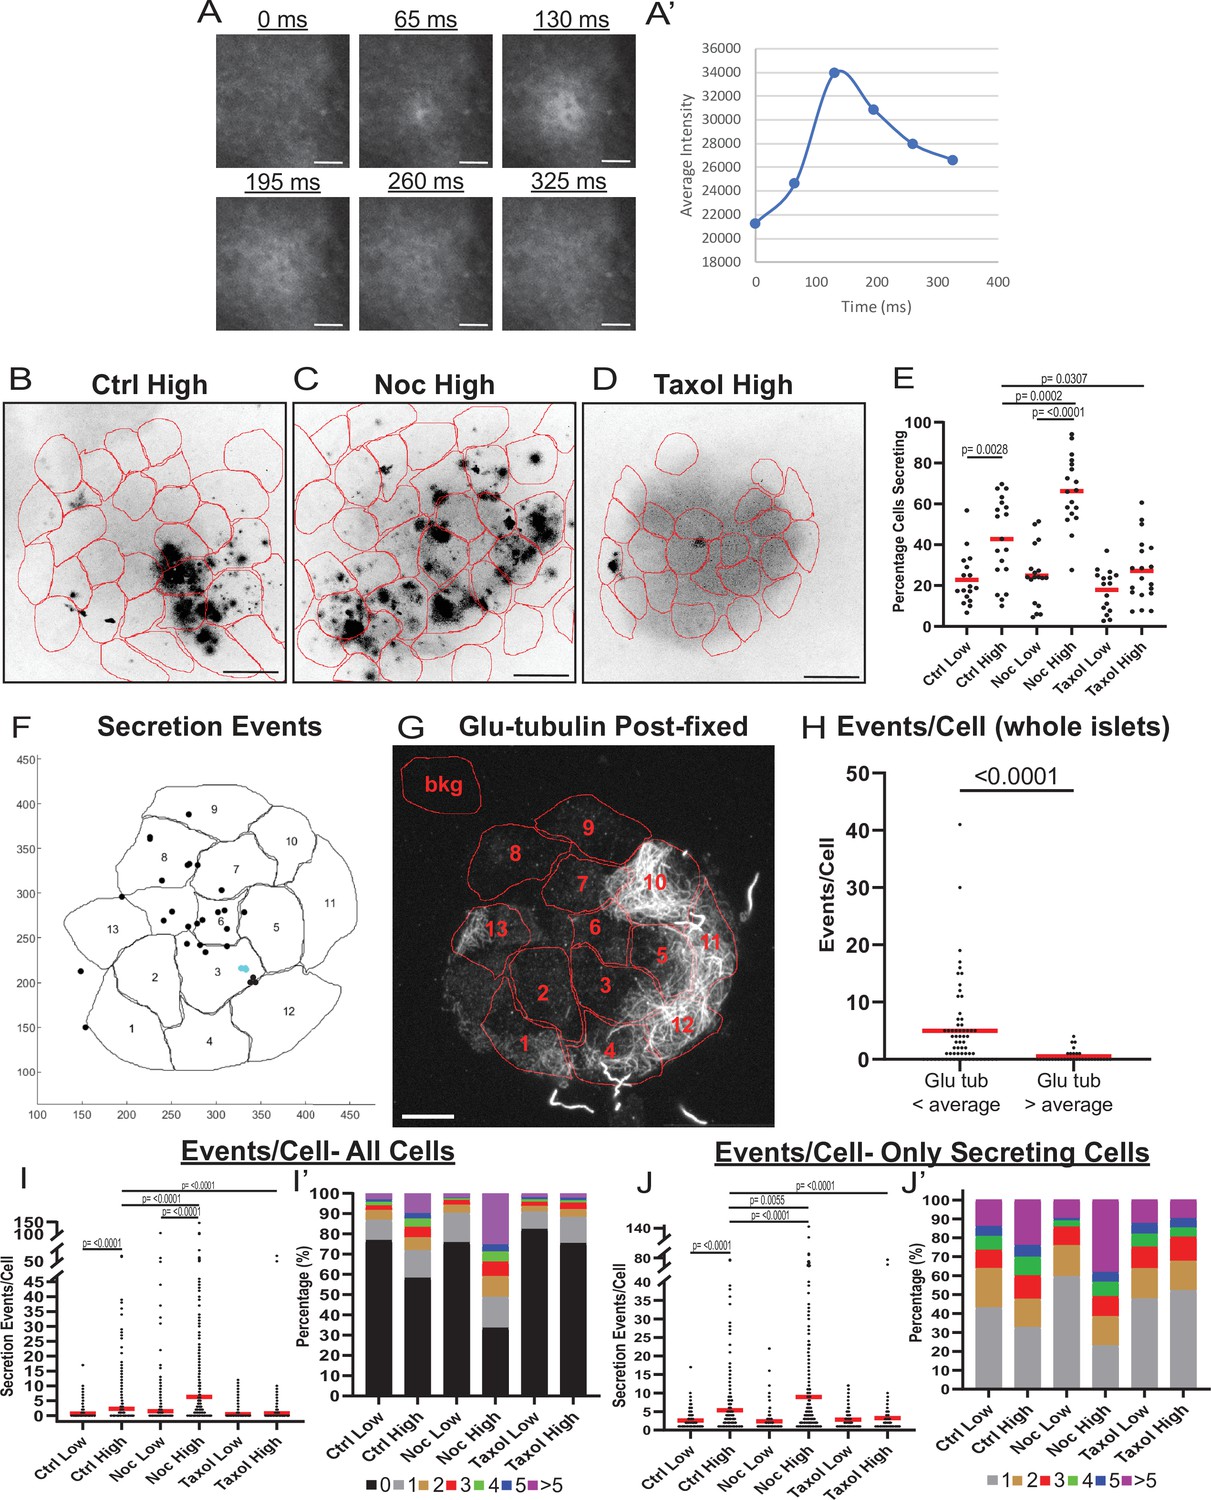
MT instability increases β-cell activation and insulin secretion.
(A) Example images of a single secretion event pre-processing. Secretion signal starts at 65 ms and dissipates out. (A’) Graph of the average intensities of a circular ROI from images in panel (A). (B–D) Time projections of islets from Figure 2—videos 1–3 inverted. Fluozin-3 flashes are represented as black areas. Cell borders identified via pre-assay imaging (see Materials and methods) overlaid in red. Islets were preincubated in DMSO (control, B), nocodazole (C), or taxol (D) and stimulated with 20 mM glucose. Scale bars: 100 µm. (E) Graph of the percentage of cells in each field of view with at least one secretion event. Red bars, mean. One-way ANOVA and multiple comparison tests, p-value as indicated. N=16–19 islets. Here and below, islets derived from three or more independent isolations per each condition. (F) Glucose-stimulated secretion as detected by FluoZin-3 assay in islets. A representative output image from Matlab script (see Materials and methods) shows cell outlines (black lines) and secretion events (dots). Black dots are non-clustered secretion events, colored dots are clustered secretion events. (G) The same islet as in (F) fixed after the assay and stained for Glu-tubulin (grayscale). Cell outlines within which Glu-tubulin intensity was measured are shown in red. Numbers correspond to cells in (F) with the same number. The outline ‘bkg’ indicates background measurement area. Maximum intensity projection over 1.2 µm at the bottom of the islet. Bar: 10 µm. (H) Correlative analysis between data as in (F) and (G). The number of secretion events per cell with Glu-tubulin intensity below islet average and those above islet average is compared in the graph. Mann-Whitney nonparametric comparison test p-value is shown. N=98 cells from five islets. The same data set as in Figure 2—figure supplement 2A. (I) Graph of secretion events per cell detected by FluoZin-3 assay. All cells in a field of view are analyzed, whether activated during the movie or not. Red bar, mean. Kruskal-Wallis test nonparametric and multiple comparison tests, p-value as indicated, N=495–637 cells from 16 to 19 islets. (I’) Cells from panel (H), graphed as a stacked histogram of the percentage of total cells per condition that had each number of secretion events. (J) Graph of secretion events per cell only including cells with at least one event during the duration of the movie. Red bar, mean. Kruskal-Wallis test nonparametric and multiple comparison tests, p-value as indicated, N=88–407 cells from 16 to 19 islets. (J’) Cells from panel (I), graphed as a stacked histogram of the percentage of cells that had each number of secretion events. MT, microtubule; ROI, region of interest.
-
Figure 2—source data 1
Data for graphs depicted in Figure 2E, H,I,I',J,J' and Figure 2—figure supplement 2A, B, C.
Each data set is a separate sheet.
- https://cdn.elifesciences.org/articles/59912/elife-59912-fig2-data1-v3.xlsx
-
Figure 2—source data 2
Matlab script to identify secretion events and clusters.
Script is annotated.
- https://cdn.elifesciences.org/articles/59912/elife-59912-fig2-data2-v3.pdf
-
Figure 2—source data 3
Matlab script to identify secretion events and clusters for correlative microscopy.
Script is annotated.
- https://cdn.elifesciences.org/articles/59912/elife-59912-fig2-data3-v3.pdf
Figure 2—figure supplement 1
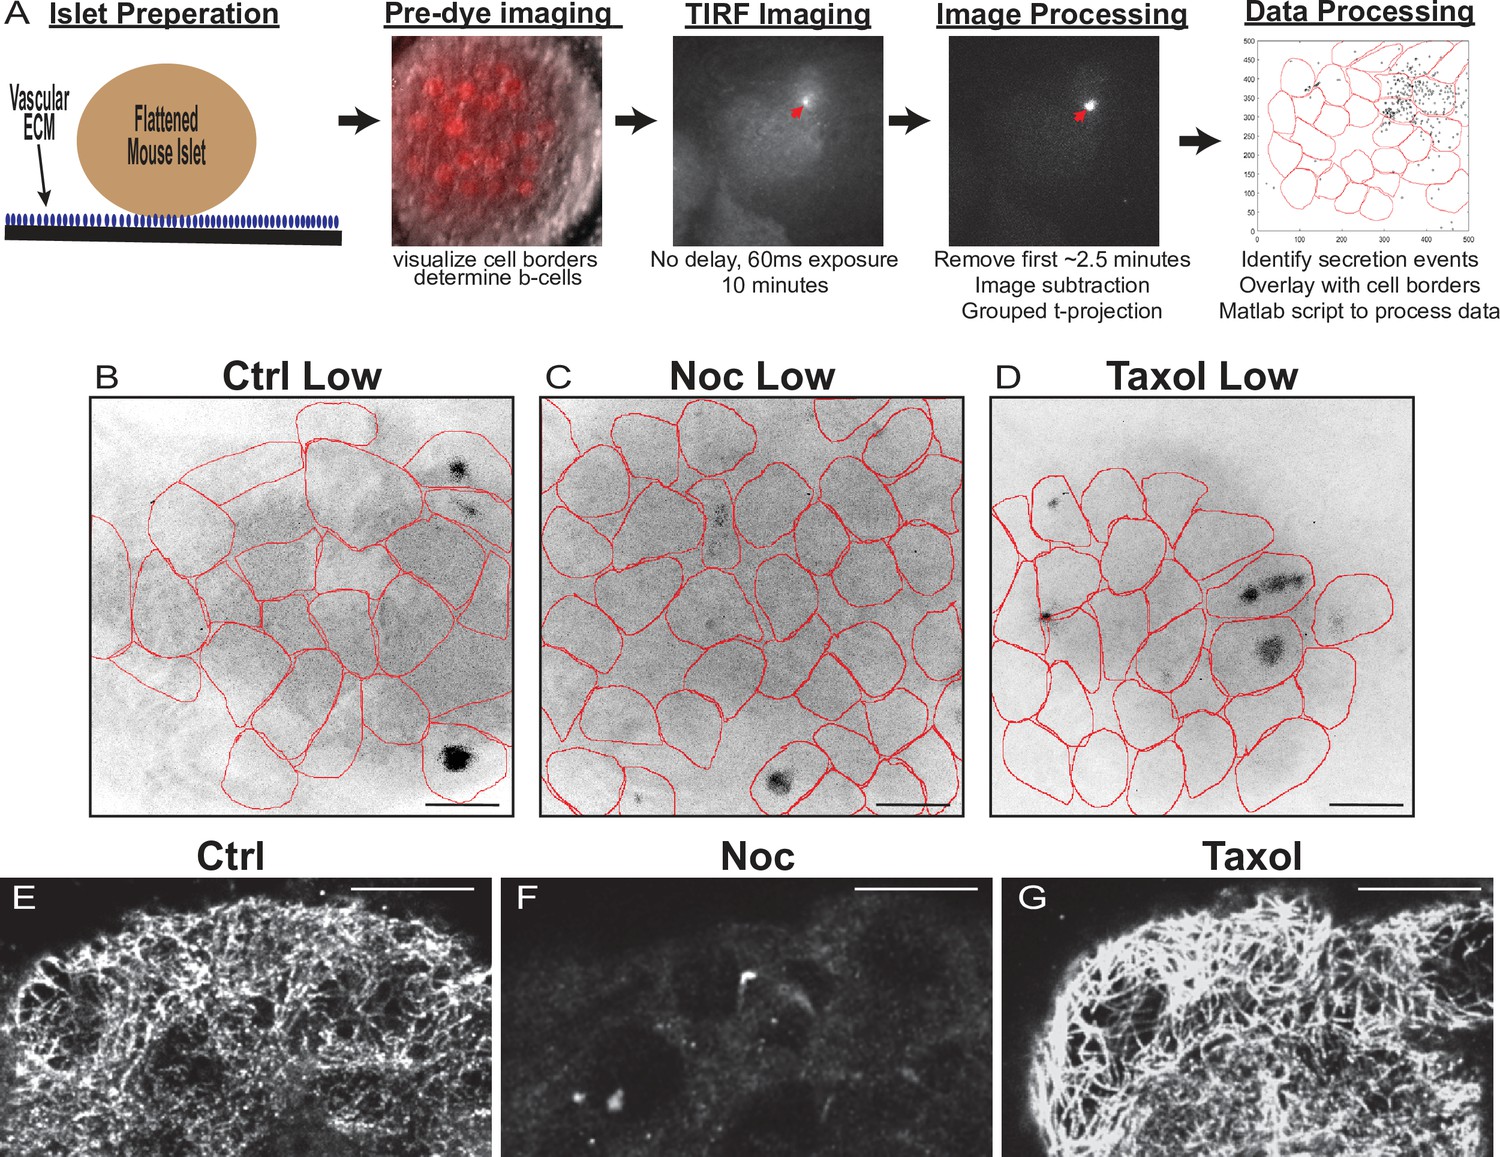
Assay protocol and basal glucose conditions are not affected by MT stability.
(A) Overview of Fluozin-3 assays. For more information, see Materials and methods. (B–D) Time projections of islets from Figure 2—videos 1–3 inverted. Fluozin-3 flashes are represented as black areas. Cell borders overlaid in red. Islets were preincubated in DMSO (control, B), nocodazole (C), or taxol (D) and incubated in 2.8 mM glucose. Scale bars: 100 µm. (E–G) Representative images of tubulin following Fluozin-3 imaging as shown in (A). Islets were preincubated in DMSO (control, E), nocodazole (F), or taxol (G) and stimulated with 20 mM glucose. Three-image max projection of the bottom of the islet. Scale bars: 10 µm. MT, microtubule.
Figure 2—figure supplement 2
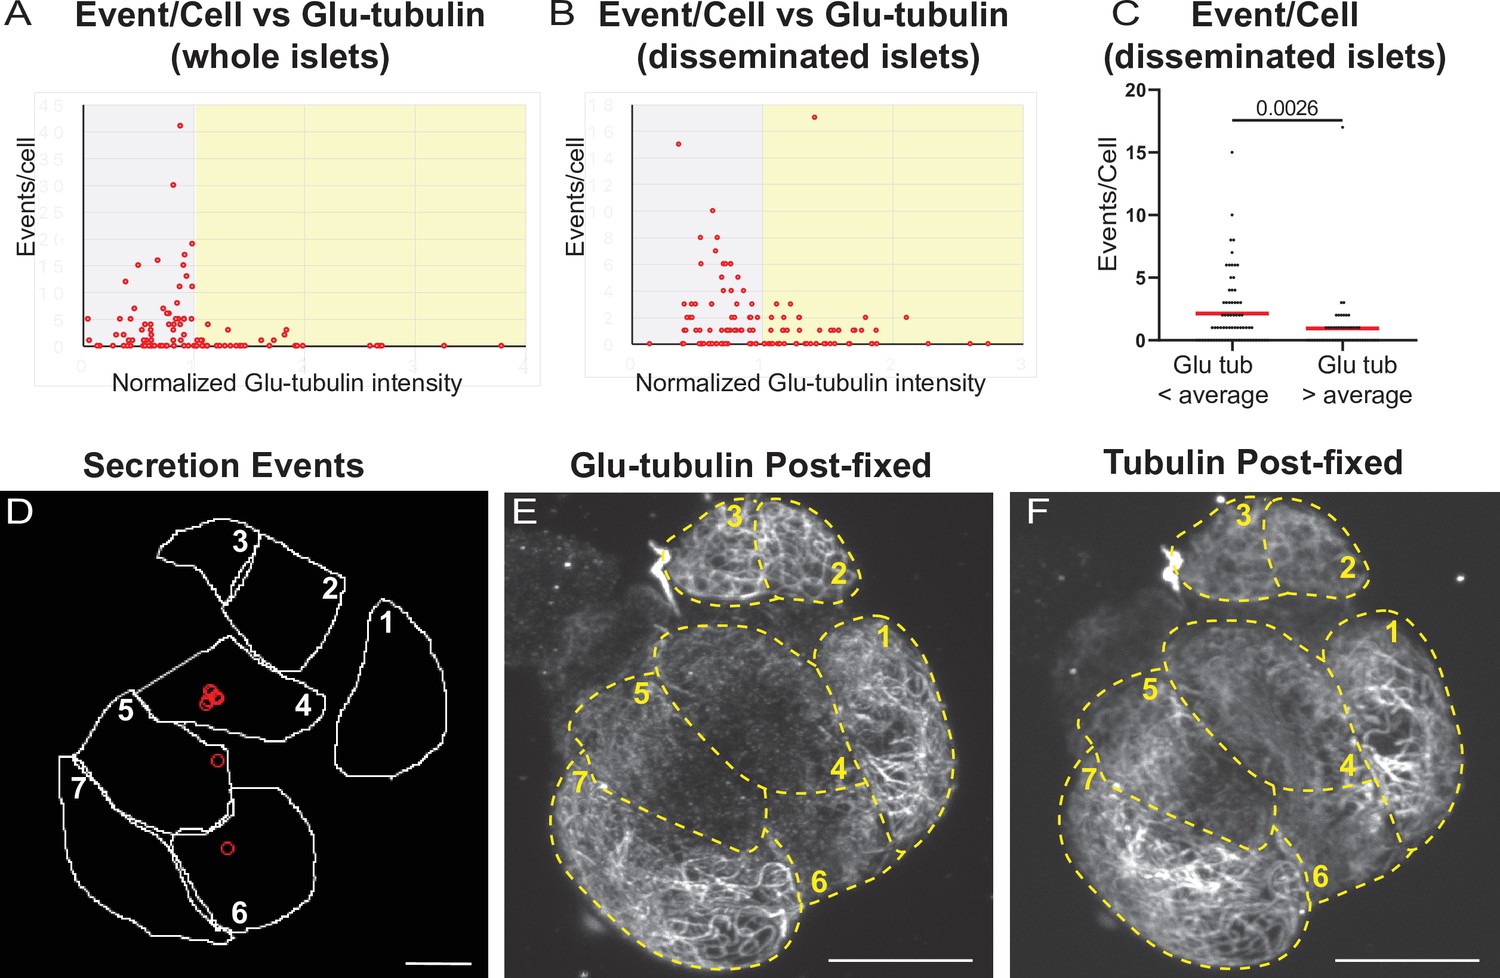
Correlation of insulin secretion and MT stability.
(A) Correlation of Glu-tubulin intensity (normalized to islet average) to the number of secretion events per cell in whole islets. Gray field, intensity below islet average (<1). Yellow field, intensityabove islet average (>1). The same data set as in Figure 2F–H. (B) Correlation of Glu-tubulin intensity (normalized to the field of view average) to the number of secretion events per cell in disseminated islets. Correlative analysis between data as in (D) and (E). Gray field, intensity below field average (<1). Yellow field, intensity above field average (>1). (C). The number of secretion events per cell in disseminated islets with Glu-tubulin intensity below field average and those above field average is compared in the graph. The same data set as in (B). Mann-Whitney nonparametric comparison test p-value is shown. N=124 cells. (D) Cell outlines (white line) and secretion events (red circles) from a disseminated islet after 10 min in 20 mM glucose and Fluozin-3 dye. Scale bars: 10 µm. (E, F) Disseminated islet from (E) post-fixed following TIRF imaging for Glu-tubulin (E) and tubulin (F). Cells (yellow dashed lines) correspond to cells in (E) with the same number. Single slice from the bottom of the cells. Scale bars: 10 µm. MT, microtubule; TIRF, Total internal reflection fluorescent.
Figure 2—video 1
Control islet insulin secretion in low and high glucose.
DMSO treated islets in low glucose (left) and high glucose (right). Five-frame projection through time, each slice is 325 ms over about 8.5 min. FluoZin-3 dye creates flashes upon zinc binding, representing a single insulin secretion event.
Figure 2—video 2
Nocodazole islet insulin secretion in low and high glucose.
Nocodazole treated islets in low glucose (left) and high glucose (right). Five frame projection through time, each slice is 325 ms over about 8.5 min. FluoZin-3 dye creates flashes upon zinc binding, representing a single insulin secretion event.
Figure 2—video 3
Taxol islet insulin secretion in low and high glucose.
Figure 2 Taxol treated islets in low glucose (left) and high glucose (right). Five frame projection through time, each slice is 325 ms over about 8.5 min. FluoZin-3 dye creates flashes upon zinc binding, representing a single insulin secretion event.
Figure 3 with 1 supplement
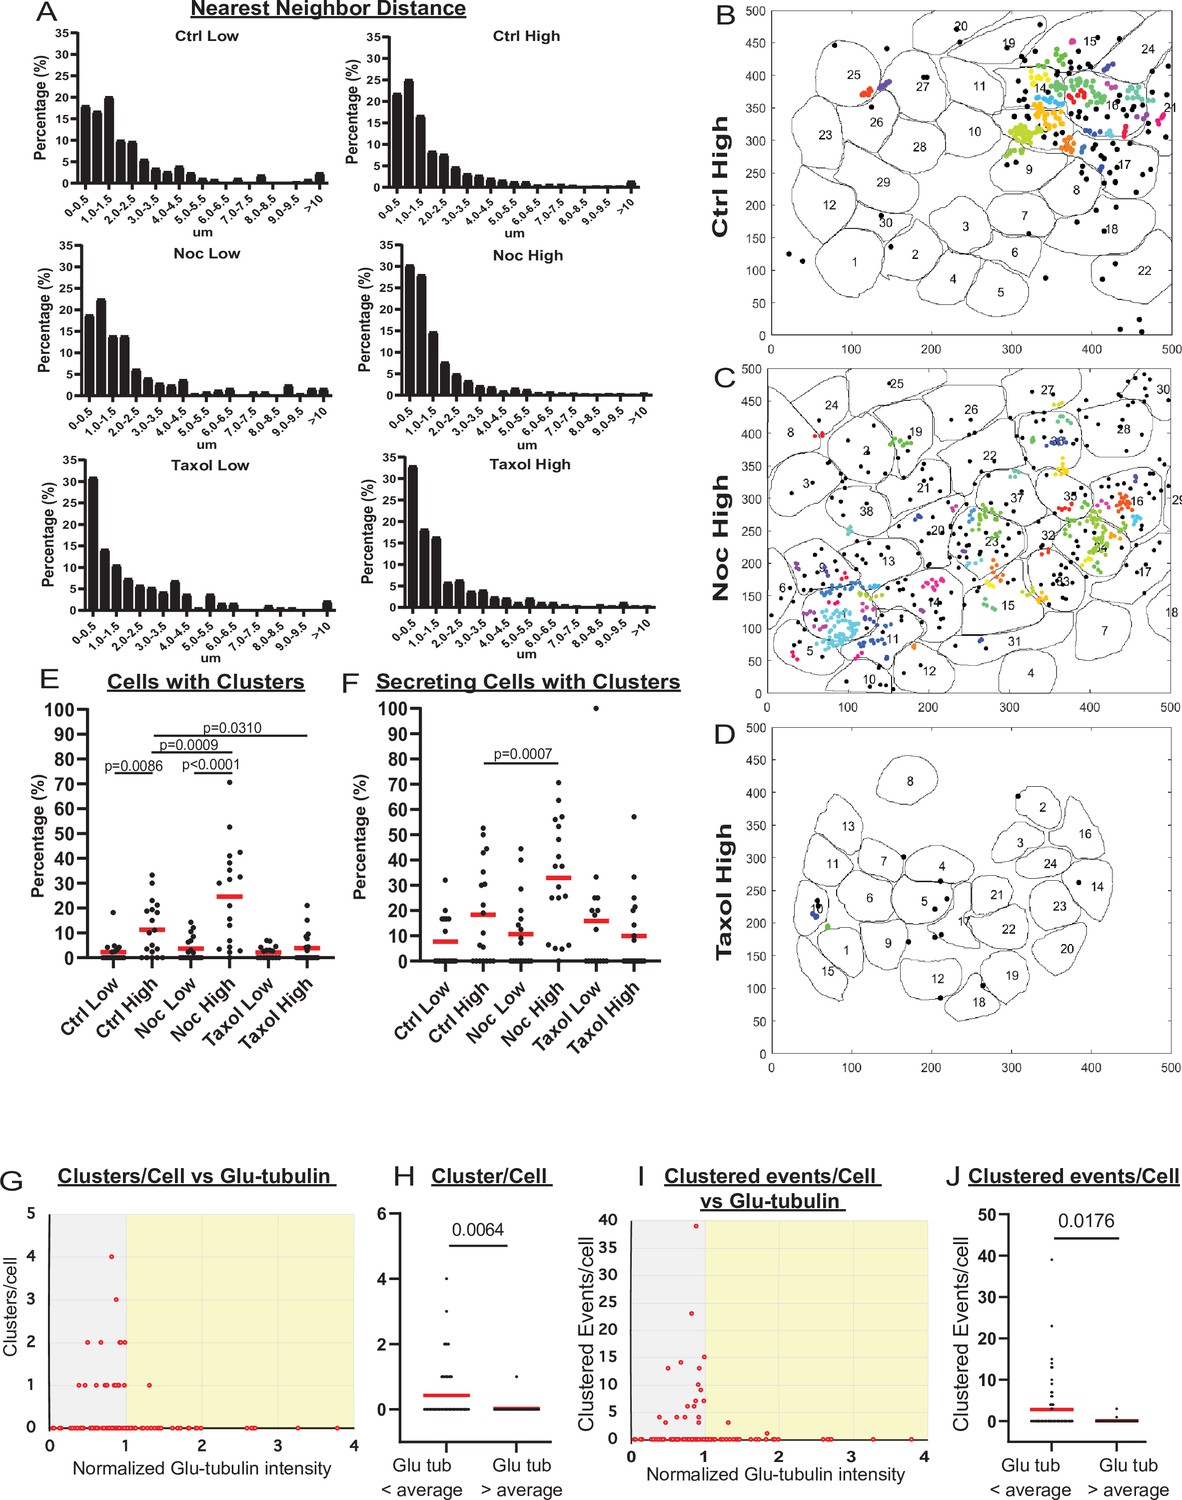
MT stability suppresses formation of insulin secretion hot spots.
(A) Histogram of nearest neighbor distances obtained by measuring the distance between secretion events in cells with more than one secretion event during the movie. Graphed as the percentage of events within each bin per condition. Bin=0.5 µm. N=91–3255 distances from 16 to 19 islets. (B–D) Representative images of output from Matlab script (see Materials and methods) showing cell outlines (black lines) and secretion events (dots). Black dots are non-clustered secretion events, colored dots are clustered secretion events, each different color denotes a different cluster. Clusters were defined as 3+ secretion events occurring within nine pixels (1.44 µm) by density-based scanning. Islets were pre-treated with DMSO (control, B), nocodazole (C), or taxol (D) and were stimulated with 20 µm glucose. (E) Graph of the percentage of cells in each field of view with at least one cluster. Red bars, mean. One-way ANOVA and multiple comparison tests, p-value as indicated. N=16–19 islets. (F) Graph of the percentage of cells in each field of view with at least one cluster out of cells with at least one secretion event. Red bars, mean. One-way ANOVA and multiple comparison tests, p-value as indicated. N=16–19 islets. (G) Correlation of Glu-tubulin intensity (normalized to islet average) to the number of secretion clusters per cell in whole islets. Gray field, intensity below islet average (<1). Yellow field, intensity above islet average (>1). The same data set as in Figure 2F–H. (H) The number of clusters in cells with Glu-tubulin intensity below islet average and those above islet average is compared in the graph. Mann-Whitney nonparametric comparison test p-value is shown. N=98 cells from five islets. The same data set as in Figure 2F–H. (I) Correlation of Glu-tubulin intensity (normalized to islet average) to the number of clustered secretion events per cell in whole islets. Gray field, intensity below islet average (<1). Yellow field, intensity above islet average (>1). The same data set as in Figure 2F–H. (J) The number of clustered events in cells with Glu-tubulin intensity below islet average and those above islet average is compared in the graph. Mann-Whitney nonparametric comparison test p-value is shown. N=98 cells from five islets. The same data set as in Figure 2F–H. MT, microtubule.
-
Figure 3—source data 1
Data for graphs depicted in Figure 3A,E,F,G,H,J,I.
Each data set is a separate sheet.
- https://cdn.elifesciences.org/articles/59912/elife-59912-fig3-data1-v3.xlsx
Figure 3—figure supplement 1
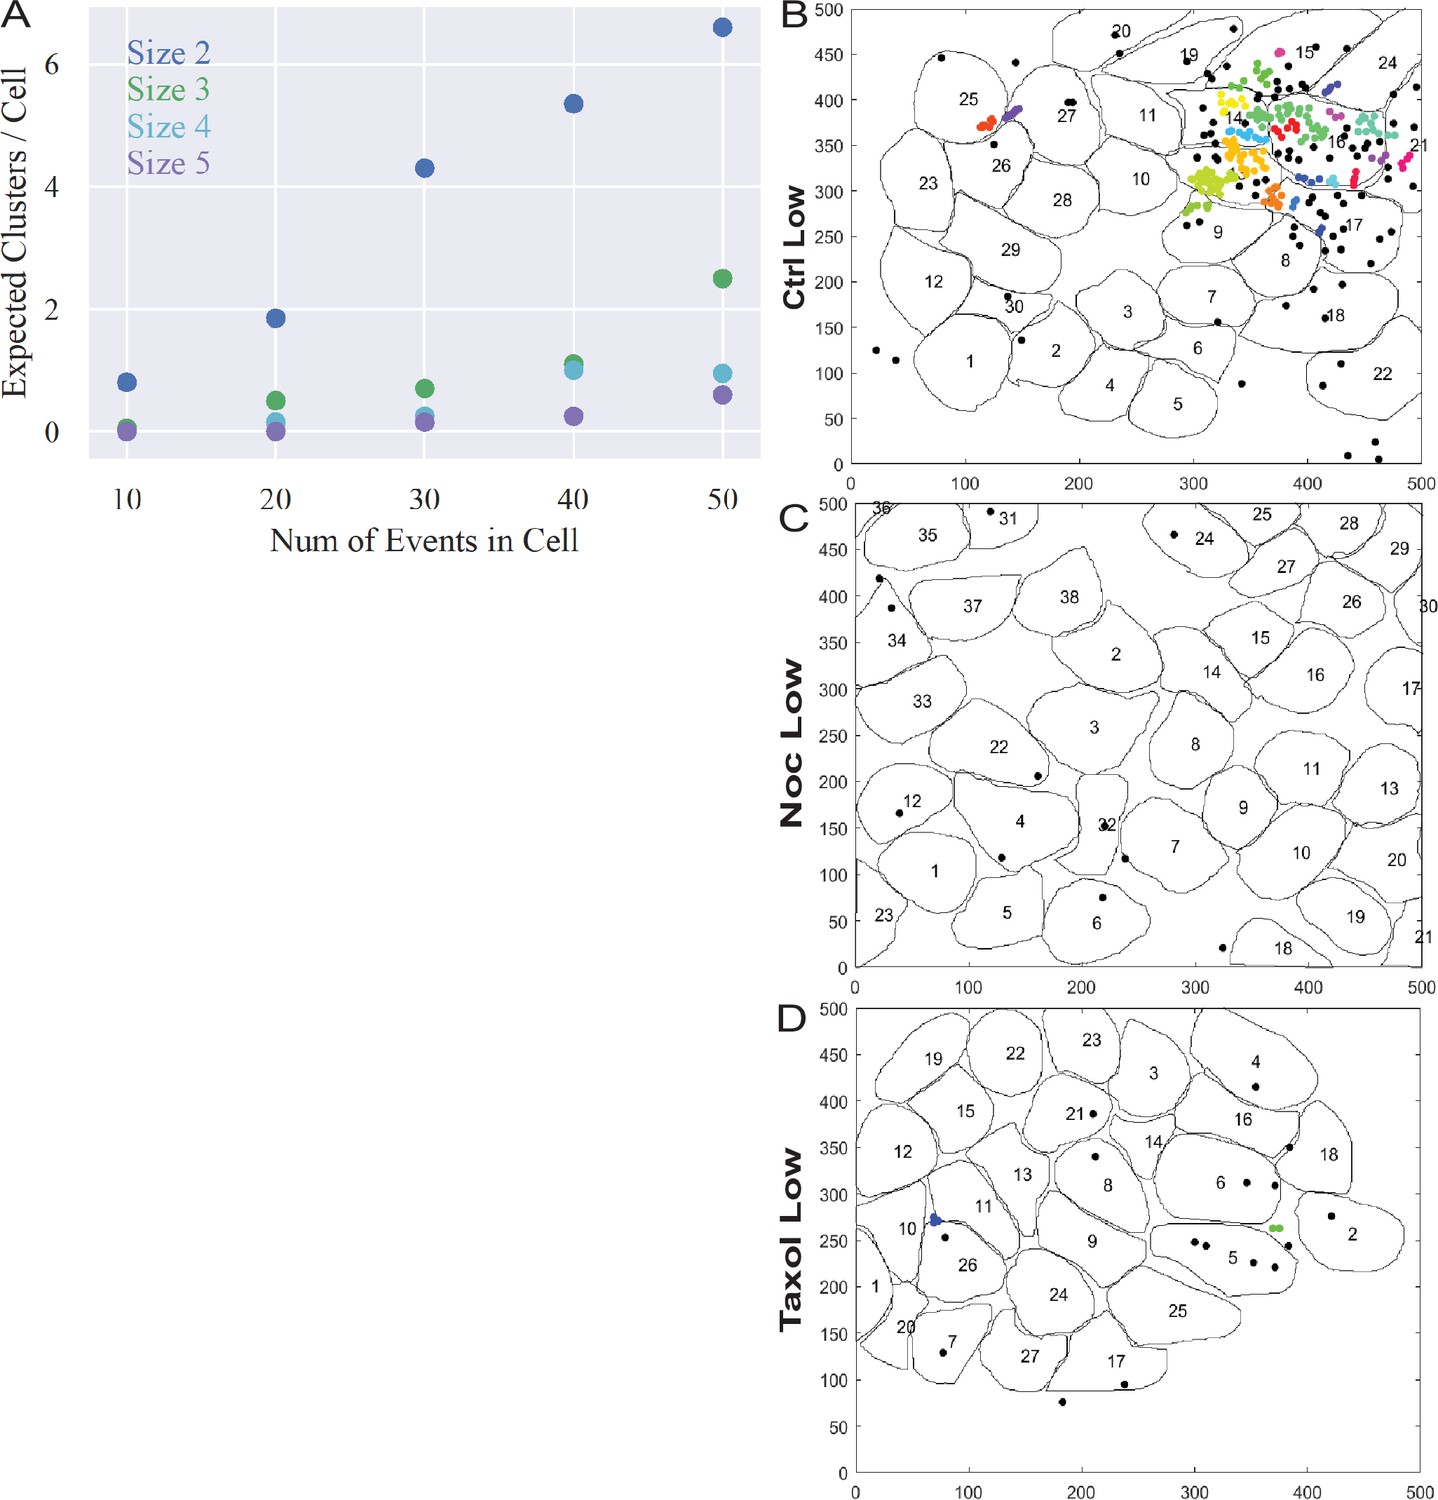
3+ event clusters are not spurious and a very rare in basal glucose conditions.
(A) Computationally simulated random secretion events in in silico cells using the mean area of the cells analyzed. (B–D) Representative images of output from Matlab script (see Materials and methods) showing cell outlines (black lines) and secretion events (dots). Black dots are non-clustered secretion events, colored dots are clustered secretion events, each different color denotes a different cluster. Clusters were defined as 3+ secretion events occurring with nine pixels (1.44 µm) by density-based scanning. Islets were pre-treated with DMSO (control, B), nocodazole (C), or taxol (D) and were incubated in 2.8 µm glucose.
Figure 4 with 2 supplements
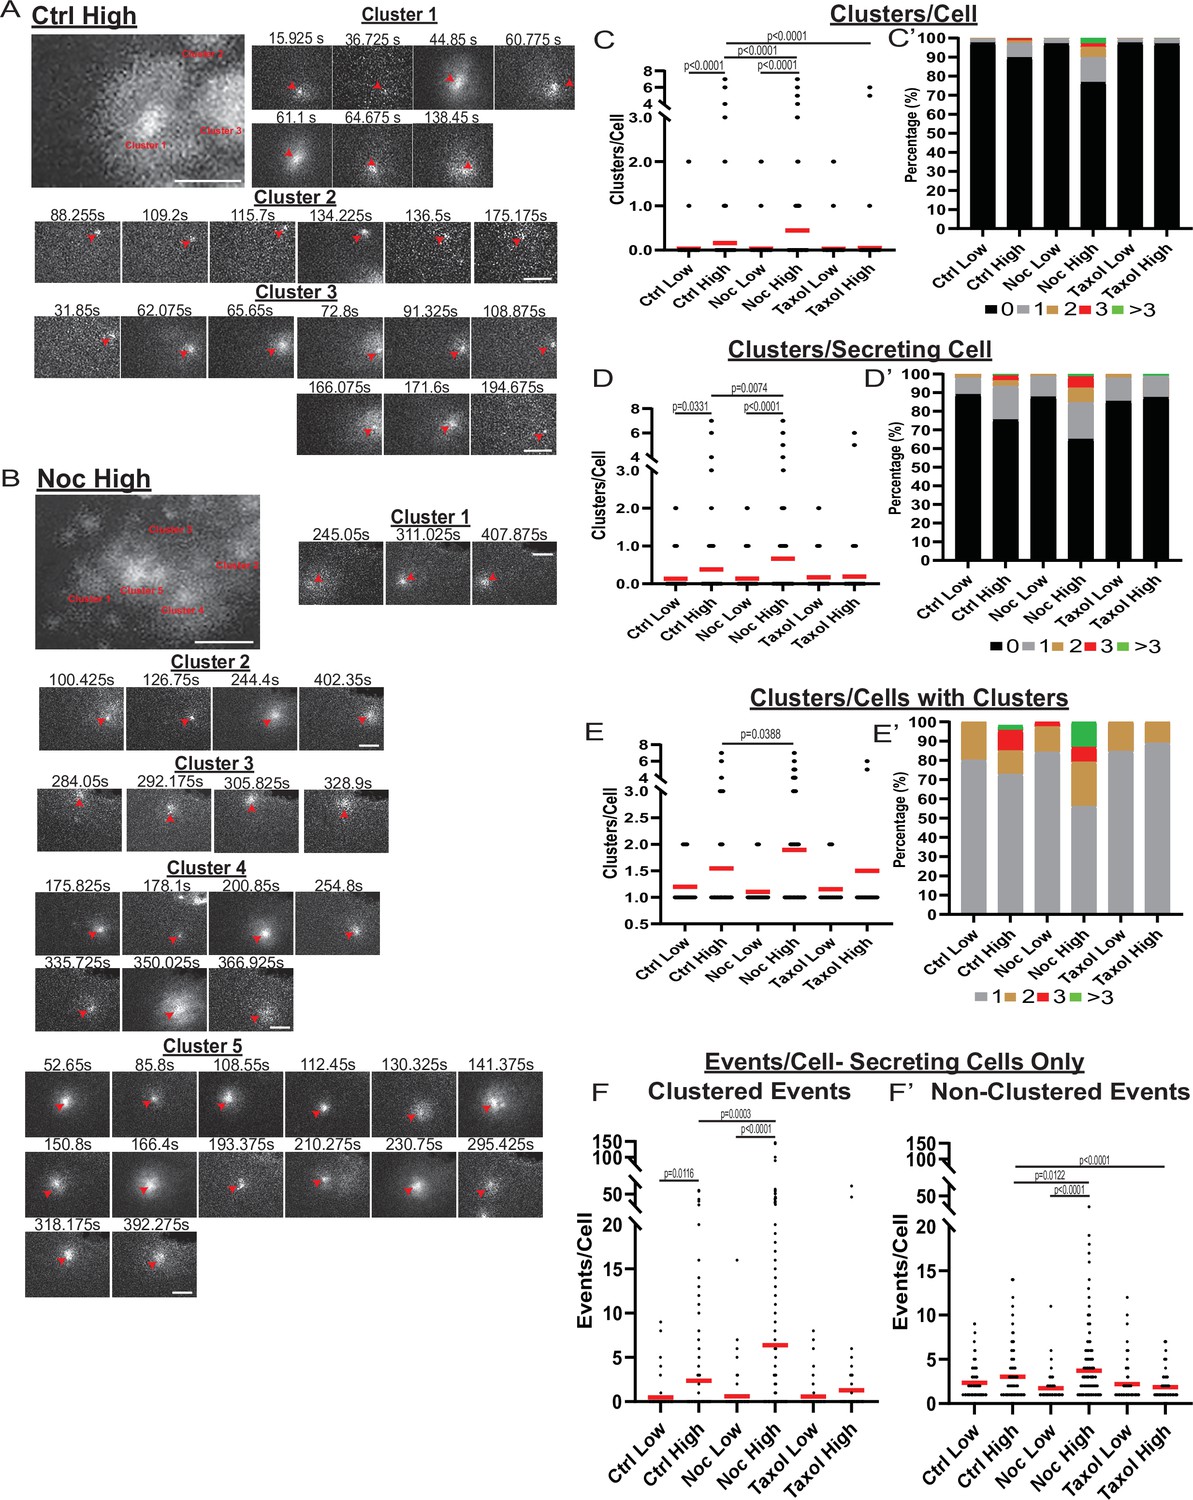
MT-disruption increases the number of hot spots per cell, increasing clustered secretion.
(A) Representative images of clusters from one cell in a control islet stimulated with 20 mM glucose. Clusters were identified by Matlab script (see Materials and methods). First image is time projection through all clusters in the cell 15.925–194.675 s of the movie, clusters are identified by red text. Time in seconds of each event in the cluster above, red arrowheads identify the secretion event. Scale bars: 5 µm. (B) Representative images of clusters from one cell in a nocodazole pre-treated islet stimulated with 20 mM glucose. Clusters were identified by Matlab script (see Materials and methods). First image is time projection through all clusters in the cell 54.65–407.875 s of the movie, clusters are identified by red text. Time in seconds of each event in each cluster above, red arrowheads identify the secretion event. Scale bars: 5 µm. (C) Graph of clusters per cell in the field of view, with all cells whether activated during the movie or not. Red bar, mean. Kruskal-Wallis test nonparametric and multiple comparison tests, p-value as indicated, N=495–637 cells from 16 to 19 islets. (C’) Cells from panel (C), graphed as a stacked histogram of the percentage of total cells per condition that had each number of clusters. (D) Graph of clusters per cell only including cells with at least one secretion event during the duration of the movie. Red bar, mean. Kruskal-Wallis test nonparametric and multiple comparison tests, p-value as indicated, N=88–407 cells from 16 to 19 islets. (D’) Cells from panel (D), graphed as a stacked histogram of the percentage of cells with secretion events per condition that had each number of clusters. (E) Graph of clusters per cell, only cells with at least cluster during the duration of the movie were included. Red bar, mean. Kruskal-Wallis test nonparametric and multiple comparison tests, p-value as indicated, N=13–143 cells from 16 to 19 islets. (E’) Cells from panel (E), graphed as a stacked histogram of the percentage of cells with clusters per condition that had each number of clusters. (F) Graph of events per cell with at least one secretion event during the movie that were in a cluster. Red bar, mean. Kruskal-Wallis test nonparametric and multiple comparison tests, N=88–407 cells from 16 to 19 islets. (F’) Graph of events per cell with at least one secretion event during the movie that were not in a cluster. Red bar, mean. Kruskal-Wallis test nonparametric and multiple comparison tests, N=88–407 cells from 16 to 19 islets. MT, microtubule.
-
Figure 4—source data 1
Data for graphs depicted in Figure 4C, C’, D, D’, E, E’, F and F’.
Each data set is a separate sheet.
- https://cdn.elifesciences.org/articles/59912/elife-59912-fig4-data1-v3.xlsx
Figure 4—video 1
Clusters in a single cell in control islet in high glucose.
A single cell from Figure 2—video 1 high glucose. Projection through time of five frames, each slice is 325 ms. Movie is 15.925–194.675 s of the movie.
Figure 4—video 2
Clusters in a single cell in nocodazole treated islet in high glucose.
A single cell from Figure 2—video 2 high glucose. Projection through time of five frames, each slice is 325 ms. Movie is 54.65–407.875 s of the movie.
Figure 5

Increased secretion from clusters leads to faster secretion at that site.
(A) Graph of events per cluster (cluster size), Red bar, mean. Kruskal-Wallis test nonparametric and multiple comparison tests found no statistical differences between conditions. N=14–290 clusters from 16 to 19 islets. (A’) Clusters from panel (F), graphed as a stacked histogram of the percentage of clusters with each number of events per condition. (B) Histogram of the time between successively (in time) occurring non-clustered events with the best fit exponential overlaid (KS-statistic is provided for quality of fit). (C) Histogram of the time between successively occurring clustered events with the best fit exponential overlaid (KS-statistic is provided for quality of fit). (D) Graph of time (seconds) between successive events (wait time). Distribution for clusters of different sizes (Red bar=mean). Some conditions lack clusters of particular size (e.g., no clusters with six secretion events in Ctrl low), as indicated by no data. (E) Each distribution in (D) is fit separately to an exponential distribution and the quality of fit is assessed with a KS-test (as in panels (B, C)). The resulting p-value for every test is plotted, with the black line indicating p=0.05. (F) Results of fitting a general linear model to the data from (D) (see Materials and methods for further details) with the assumption that ‘secretion rate=α+β* Cluster Size.’ Bayesian credible intervals for β are plotted for each condition. This model is also compared to a null model where ‘secretion rate=α’ (i.e., lacking size dependence), with model comparison results reported as the difference of WAIC scores (positive indicates the full model provides a better accounting of the data).
-
Figure 5—source data 1
Data for graph depicted in Figure 5A.
- https://cdn.elifesciences.org/articles/59912/elife-59912-fig5-data1-v3.xlsx
-
Figure 5—source data 2
Python scripts that produce the statistical analysis and plots in Figure 5B, C, D, E and F.
- https://cdn.elifesciences.org/articles/59912/elife-59912-fig5-data2-v3.zip
Figure 6 with 1 supplement
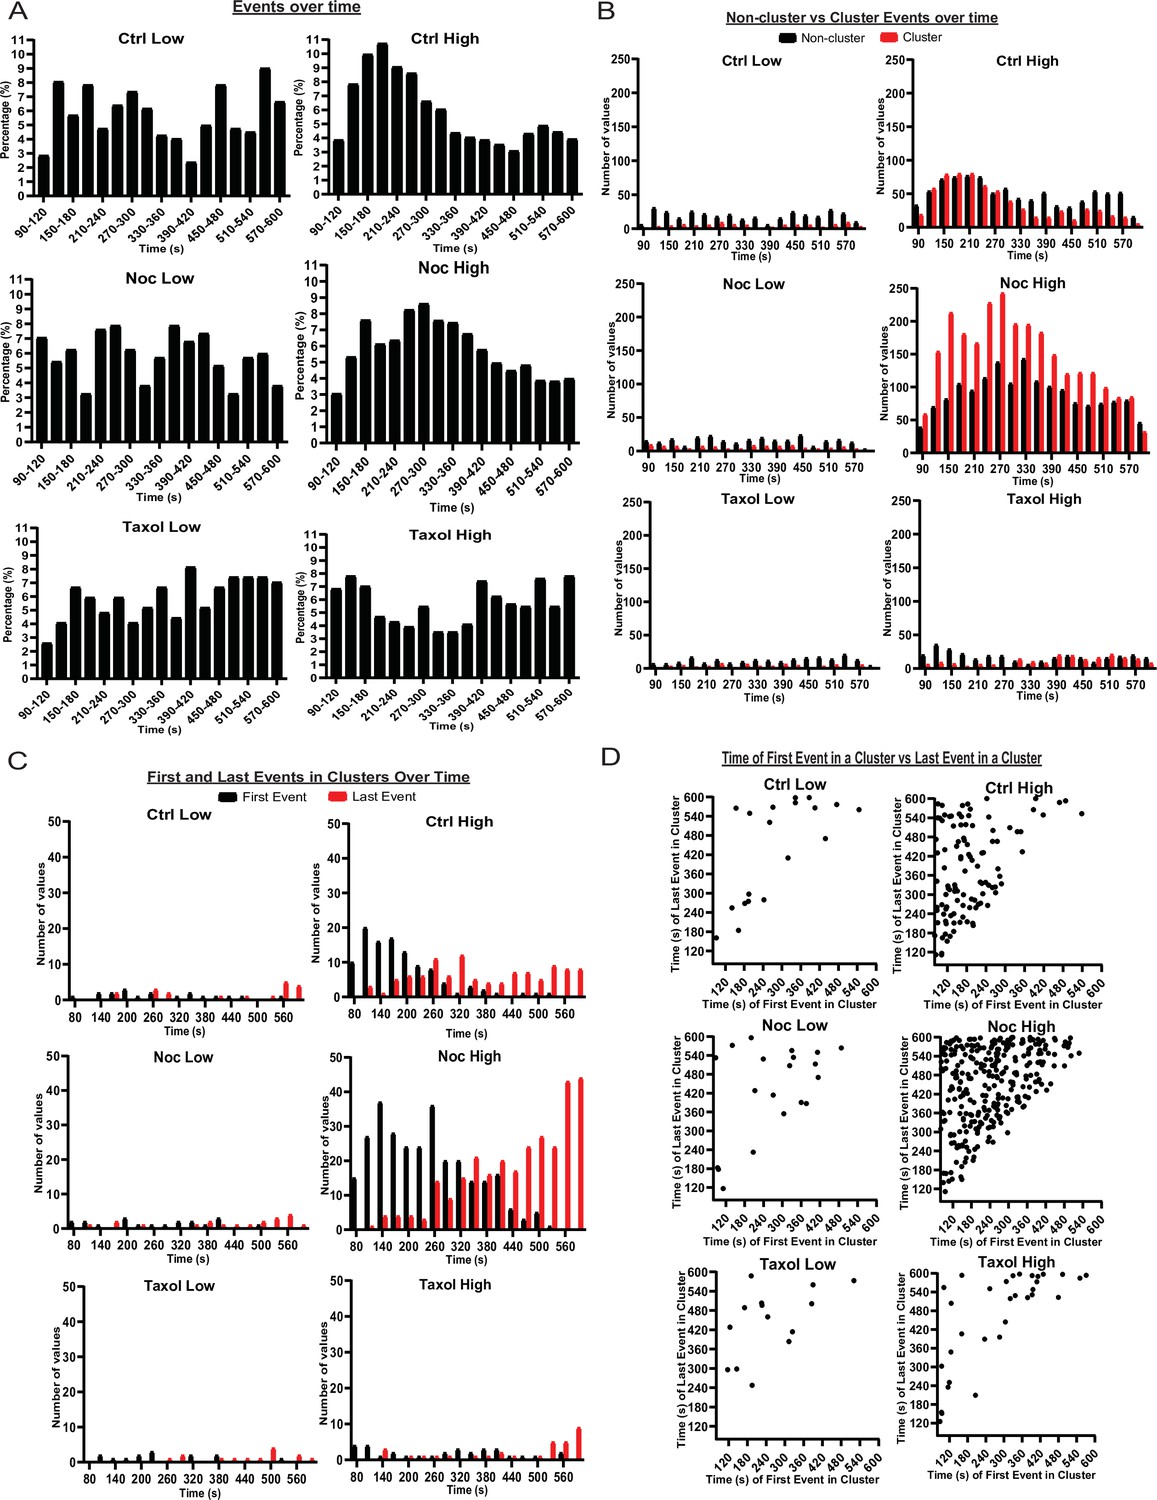
MTs restrict secretion from hot spots to the first phase of secretion, loss of MTs lengthen this phase.
(A) Histogram of basal and glucose-stimulated secretion events over time. Graphed as the percentage of events within each bin per condition. Time (seconds) since dye and either high (20 mM) or low (2.8 mM) glucose addition. Bin=30 s. N=16–19 islets. (B) Histogram of secretion events over time separated into secretion events not in clusters (black) and in clusters (red). Absolute numer of events is shown. Time (seconds) since dye and either high (20 mM) or low (2.8 mM) glucose addition. Bin=30 s. N=16–19 islets. (C) Histogram of the first event in a cluster (black) and last event in a cluster (red) over time. Absolute numer of events is shown. Time (seconds) since dye and either high (20 mM) or low (2.8 mM) glucose addition. Bin=30 s. N=16–19 islets. (D) Scatterplot of each cluster in each condition with the timing of the first event in a cluster on the x-axis and the timing of the last event in a cluster on the y-axis. Time (seconds) since dye and either high (20 mM) or low (2.8 mM) glucose addition. Bin=30 s. N=16–19 islets. MT, microtubule.
-
Figure 6—source data 1
Data for graphs depicted in Figure 6A, B, C and D and Figure 1A.
Each data set is a separate sheet.
- https://cdn.elifesciences.org/articles/59912/elife-59912-fig6-data1-v3.xlsx
Figure 6—figure supplement 1
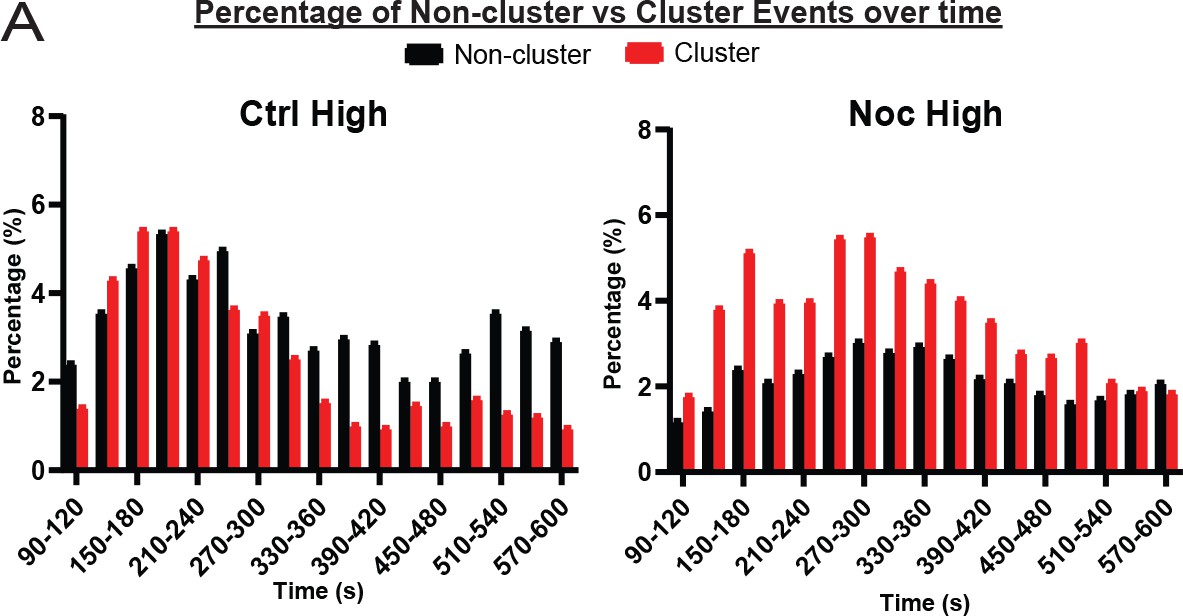
Clustered secretion is mostly restricted to the first phase of secretion in control islets.
(A) Histogram of secretion events over time separated into secretion events not in clusters (black) and in clusters (red). Graphed as percentage of events within each bin per condition. Time (seconds) since dye and either high (20 mM) or low (2.8 mM) glucose. Bin=30 seconds. N=16-19 islets.
Figure 7 with 3 supplements

Calcium signaling is essential for secretion regardless of MT presence.
(A) GSIS as detected by ELISA. Secretion over 30 min upon 20 mM glucose stimulation is shown for DMSO control and nocodazole pre-treated cells in the presence and absence of 5 µM Diazoxide. Tukey’s multiple comparisons test p-values are shown. (B, C) Time frames from attached islets treated with DMSO (B) and nocodazole (C) and incubated with Calbryte 520 (cyan). Time after 20 MM glucose stimulation, seconds. Red, mApple (β-cell marker). Single plane spinning disk confocal microscopy images. Dotted line outlines indicate representative β-cells with detectable concentration of Calbryte 520 used for analyses. Scale bars: 10 µm. (D) Graph of highest amplitudes of Calbryte 520 intensity fluctuation per cell, measured in data as in Figure 7—figure supplement 1. Mann-Whitney nonparametric comparison test p-value is shown. N=78–102 cells from 8 to 12 islets. (E) Summarized increase of Calbryte 520 intensity over the first minute of glucose stimulation per cell, measured in data as in Figure 7—figure supplement 1. Mann-Whitney nonparametric comparison test p-value is shown. N=78–102 cells from 8 to 12 islets. GSIS, glucose-stimulated insulin secretion; MT, microtubule.
-
Figure 7—source data 1
Data for graphs depicted in Figure 7A, D, E, Figure 7—figure supplement 1A, B.
Each data set is a separate sheet.
- https://cdn.elifesciences.org/articles/59912/elife-59912-fig7-data1-v3.xlsx
Figure 7—figure supplement 1
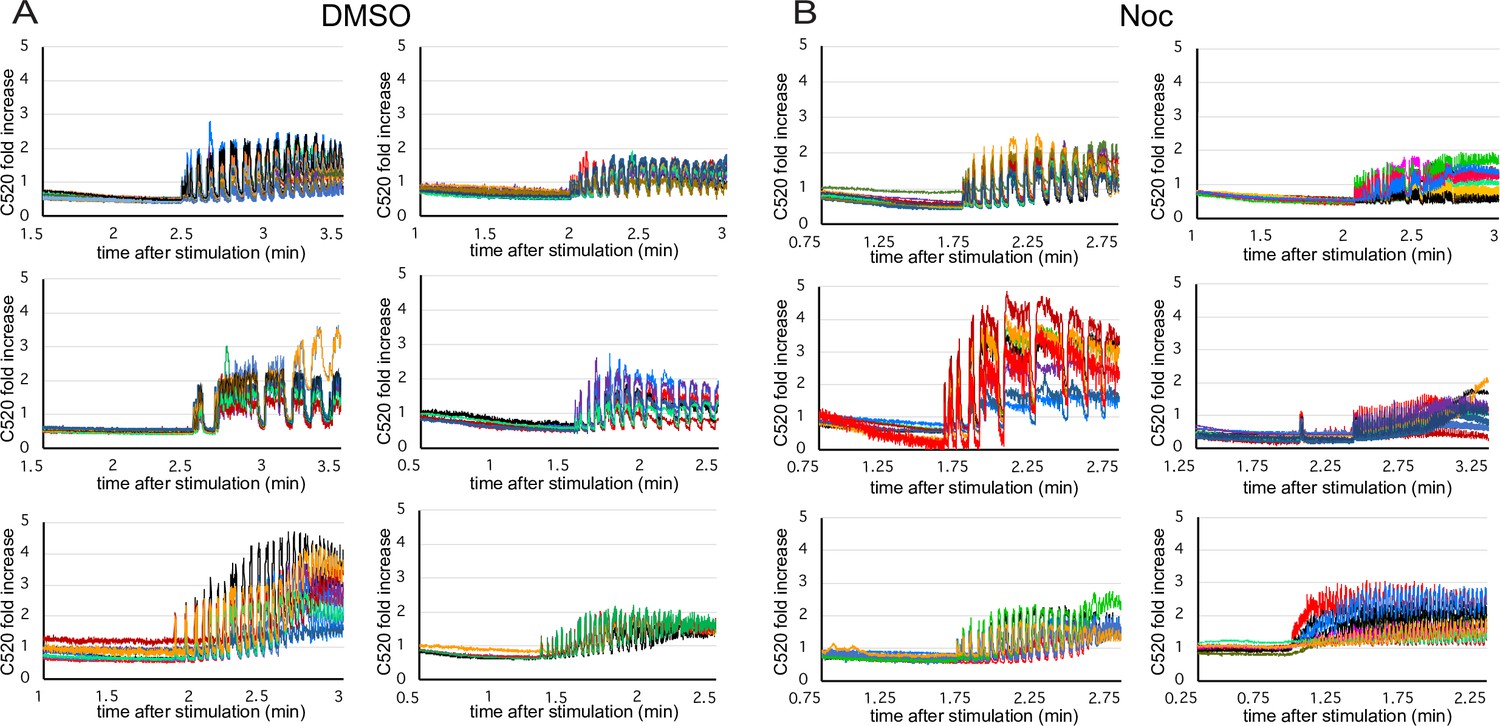
Calcium influx over time in glucose-stimulated islets.
(A, B) Analysis of a representative experiment (one islet isolation) summarized in Figure 7D and E. Each curve represents Calbryte 520 intensity dynamics of a single β-cell, 1 min before and 1 min after the fluctuations start. Each graph combines cells from one islet, either control DMSO- (A) or nocodazole-pretreated (B). Fold increase over mean intensity at the time of stimulation is shown. Time after stimulation is shown. Time, minutes.
Figure 7—video 1
Glucose-dependent Ca2+ influx in control detected by Calbryte 520.
An edge of DMSO-treated islet, preincubated with Calbryte 520 dye. Single-plane spinning disk confocal imaging with each 10 time frames averaged. The sequence within 1 min 33 s – 2 min 22 s after 20 mM glucose stimulation shows the onset of Ca2+ oscillations. Cyan, Calbryte 520. Red, mApple nuclei to mark β-cells.
Figure 7—video 2
Glucose-dependent Ca2+ influx in the absence of MTs detected by Calbryte 520.
An edge of nocodazole-treated islet, preincubated with Calbryte 520 dye. Single-plane spinning disk confocal imaging with each 10 time frames averaged. The sequence within 1 min 23 s – 2 min 12 s after 20 mM glucose stimulation shows the onset of Ca2+ oscillations. Cyan, Calbryte 520. Red, mApple nuclei to mark β-cells.
Figure 8 with 4 supplements
MTs regulate glucose-stimulated secretion in addition to calcium-dependent mechanisms.
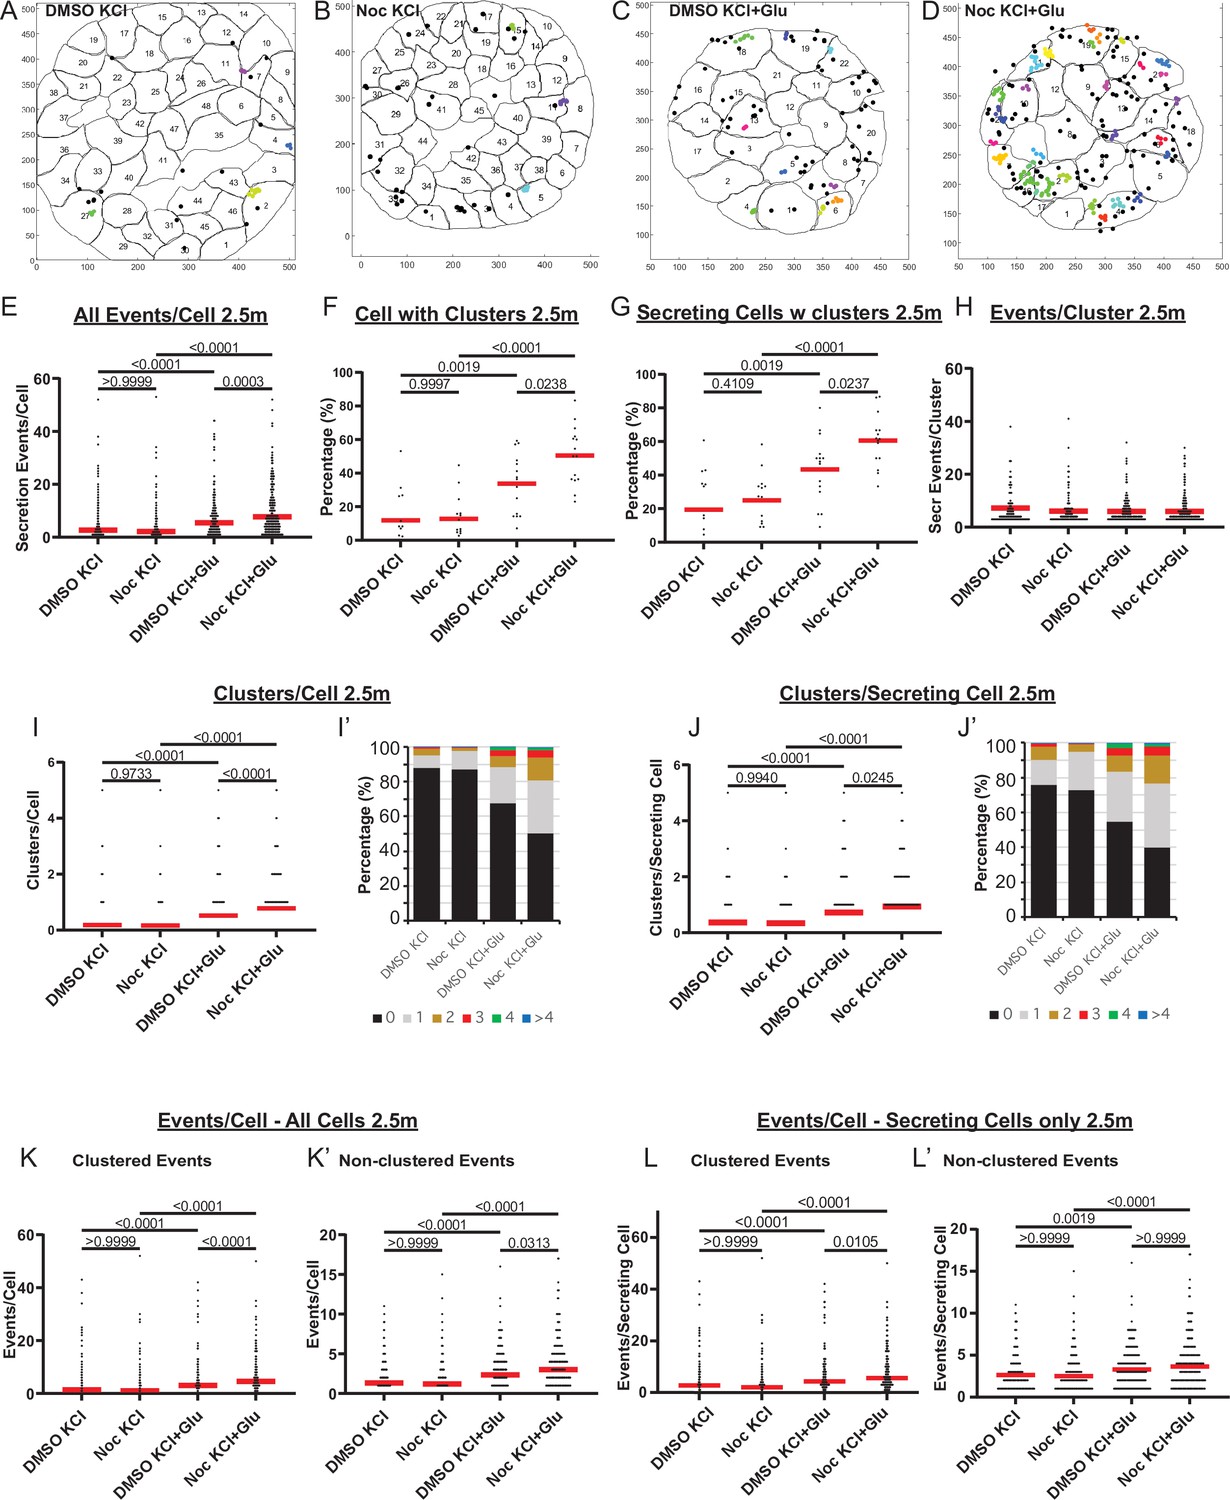
(A–D) KCl− (A, B) and KCl+ Glucose-stimulated (C, D) secretion as detected by FluoZin-3 assay in DMSO- (A, C) and nocodazole (B, D) pre-treated islets. Representative output images from Matlab script (see Materials and methods) shows cell outlines (black lines) and secretion events (dots) over 2.5 min after stimulation. Black dots are non-clustered secretion events, colored dots are clustered secretion events. (E) Graph of KCl-induced secretion events per cell over 2.5 min detected by FluoZin-3 assay (data as in (A–D)). Red bar, mean. Kruskal-Wallis test nonparametric and multiple comparison tests, p-value as indicated, N=306–708 cells from 15 to 17 islets. (F) Graph of the percentage of cells in each field of view with at least one cluster in KCl-induced secretion over 2.5 min. Red bar, mean. One-way ANOVA and multiple comparison tests, p-value as indicated, N=15–17 islets. (G) Graph of the percentage of cells in each field of view with at least one cluster out of cells with at least one secretion event. KCl-induced secretion over 2.5 min. Red bar, mean. One-way ANOVA and multiple comparison tests, p-value as indicated, N=15–17 islets. (H) Number of secretion events per cluster (cluster size). KCl-induced secretion over 2.5 min. Red bar, mean. Kruskal-Wallis test nonparametric and multiple comparison tests, no significant difference, N=109–269 clusters from 306 to 708 cells/15–17 islets. (I) Graph of clusters per cell in each condition. KCl-induced secretion over 2.5 min. Red bar, mean. Kruskal-Wallis test nonparametric and multiple comparison tests, p-value as indicated, N=306–708 cells from 15 to 17 islets. (I’) Cells from panel (I), graphed as a stacked histogram of the percentage of total cells per condition that had each number of clusters. (J) Graph of clusters per cell only including cells with at least one secretion event. KCl-induced secretion over 2.5 min. Red bar, mean. Kruskal-Wallis test nonparametric and multiple comparison tests, p-values as indicated, N=218–334 cells from 15 to 17 islets. (J’) Cells from panel J, graphed as a stacked histogram of the percentage of cell with secretion events per condition that had each number of clusters. (K) Graph of clustered events per cell. KCl-induced secretion over 2.5 min. Red bar, mean. Kruskal-Wallis test non-parametric and multiple comparison tests, p values as indicated, N=306–708 cells from 15 to 17 islets. (K’) Graph of non-clustered events per cell. KCl-induced secretion over 2.5 min. Red bar, mean. Kruskal-Wallis test nonparametric and multiple comparison tests, p-values as indicated, N=306–708 cells from 15 to 17 islets. (L) Graph of clustered events per cell out of cells with at least one secretion event. Red bar, mean. Kruskal-Wallis test nonparametric and multiple comparison tests, p-values as indicated, N=218–334 cells from 15 to 17 islets. (L’) Graph of non-clustered events per cell out of cells with at least one secretion event. Red bar, mean. Kruskal-Wallis test nonparametric and multiple comparison tests, p-values as indicated, N=218–334 cells from 15 to 17 islets. MT, microtubule.
-
Figure 8—source data 1
Data for graphs depicted in Figure 8E, F, G, H,I,I',J,J',K,K',L,L'.
- https://cdn.elifesciences.org/articles/59912/elife-59912-fig8-data1-v3.xlsx
Figure 8—figure supplement 1
Rapid secretion induction by KCL as compared to glucose.
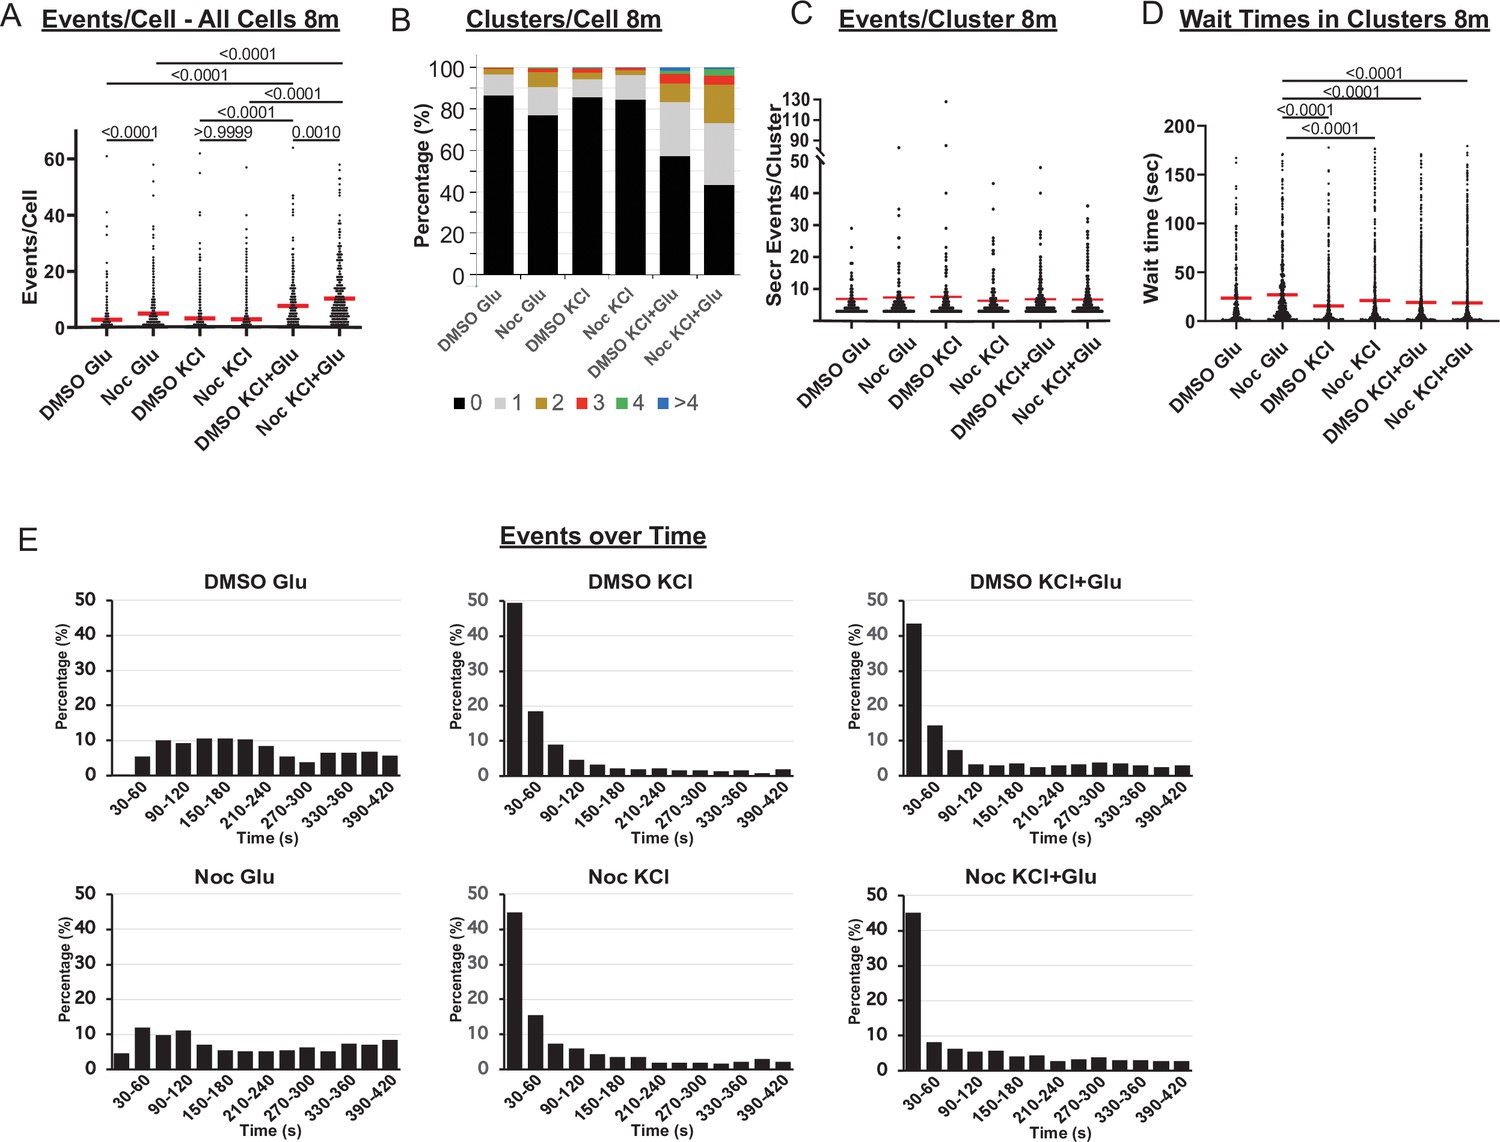
(A) Graph of glucose, KCl− and KCl+ Glucose-stimulated secretion events per cell over 8 min in DMSO- and nocodazole pre-treated islets. Red bar, mean. Kruskal-Wallis test nonparametric and multiple comparison tests, p-value as indicated, N=306–708 cells from 13 to 17 islets. (B) Graph of clusters per cell shown as a stacked histogram of the percentage of total cells per condition that had each number of clusters. Secretion over 8 min. N=306–708 cells from 13 to 17 islets. (C) Number of secretion events per cluster over 8 min (cluster size). Red bar, mean. Kruskal-Wallis test nonparametric and multiple comparison tests, no significant difference, N=72–342 clusters from 306 to 708 cells/13–17 islets. (D) Graph of time between successive events (wait time) in clusters over 8 min (Red bar=mean). Kruskal-Wallis test nonparametric and multiple comparison tests, p-value as indicated, N=72–342 clusters from 306 to 708 cells/13–17 islets. (E) Histogram of secretion events over time (8 min). Graphed as the percentage of events within each bin per condition. Time (seconds) after stimulation (20 mM glucose, 25 mM KCl, or combination of both, as indicated). Bin=30 s. N=13–17 islets.
-
Figure 8—figure supplement 1—source data 1
Data for graphs depicted in Figure 8—figure supplement 1A, B, C, D, E.
- https://cdn.elifesciences.org/articles/59912/elife-59912-fig8-figsupp1-data1-v3.xlsx
Figure 8—video 1
KCl-induced insulin secretion in DMSO and nocodazole.
DMSO-treated (left) and nocodazole-treated (right) islets stimulated by 10 mM KCl. Five-frame projection through time, each slice is 500 ms over 2.5 min after stimulation. Fluozin-3 dye creates flashes upon zinc binding, representing a single insulin secretion event.
Figure 8—video 2
KCl- and glucose-induced insulin secretion in DMSO and nocodazole.
Examples of big DMSO-treated (left) and nocodazole-treated (right) islets stimulated by a mixture of KCl and glucose. Five-frame projection through time, each slice is 500 ms over 2.5 min after stimulation. Fluozin-3 dye creates flashes upon zinc binding, representing a single insulin secretion event.
Figure 8—video 3
KCl- and glucose-induced insulin secretion in DMSO and nocodazole.
Examples of small DMSO-treated (left) and nocodazole-treated (right) islets stimulated by a mixture of KCl and glucose. Five-frame projection through time, each slice is 500 ms over 2.5 min after stimulation. Fluozin-3 dye creates flashes upon zinc binding, representing a single insulin secretion event.
Figure 9
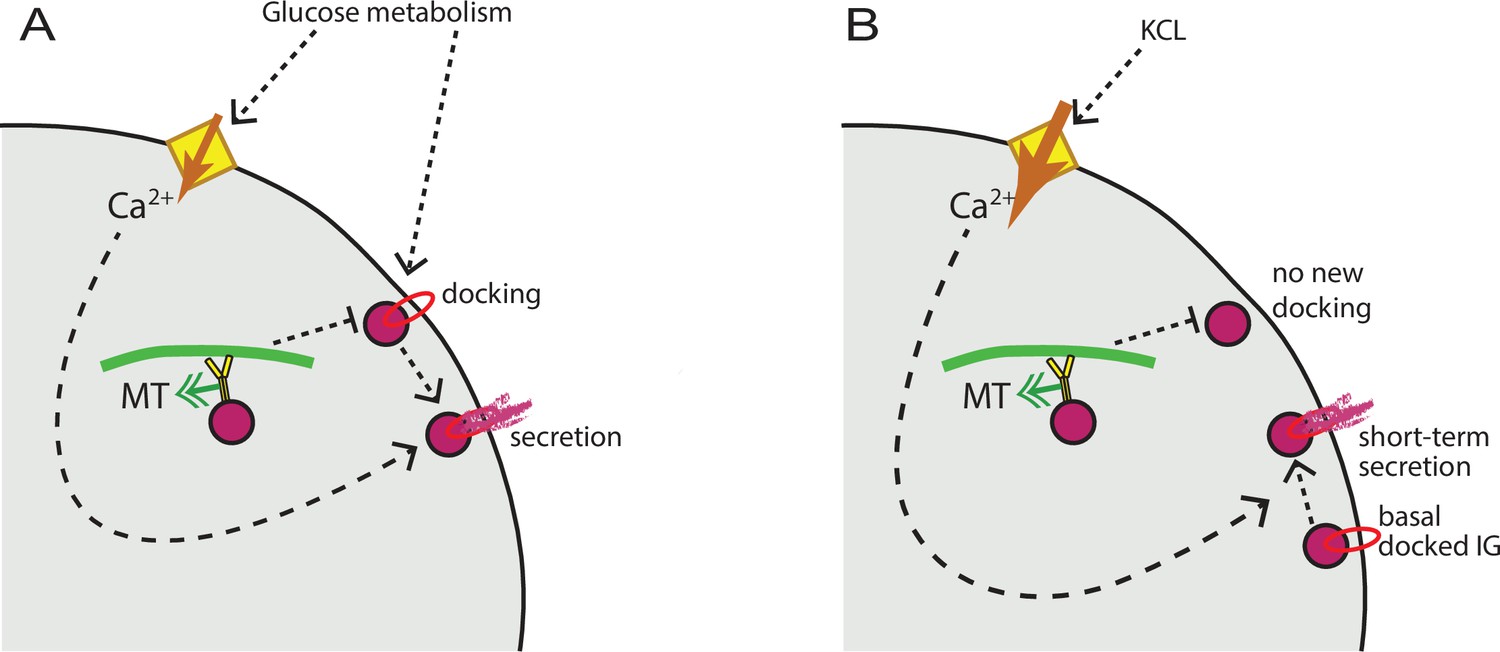
MT regulation of insulin secretion at a hot spot.
(A) Glucose signaling stimulates both insulin granule docking and calcium influx; calcium influx, in turn, promotes secretion of docked graules. MT-dependent transport negatively regulates the process of docking, restricting the number of readily releasable granules and secretion outcome. (B) KCl treatment causes extreme acute calcium influx, which in turn facilitates secretion of pre-docked granules. No additional docking occurs in the absence of glucose stimulation, and MT regulation does not influence the number of pre-docked granules and secretion levels. MT, microtubule.
Tables
Key resources table
| Reagent type (species) or resource | Designation | Source or reference | Identifiers | Additional information |
|---|---|---|---|---|
| Genetic reagent (Mus musculus) | Ins-Apl mice | Stancill et al., 2019 | Histone 2B-mApple knocked into the Ins2 locus | |
| Cell line (Homo sapiens) | RPE1-hTert | ATCC, Cat# CRL-4000, | RRID:CVCL_4388 | |
| Antibody | Anti-α-tubulin (DM1A clone) Mouse monoclonal | Sigma-Aldrich, Cat#: T9026 | (1:500) dilution | |
| Antibody | Anti-detyrosinated tubulin, rabbit polyclonal | Millipore, Cat#: AB3201 | (1:500) dilution | |
| Chemical compound, drug | FluoZin-3, Tetrapotassium Salt, cell impermeant | Thermo Fisher Scientific, Cat#: F24194 | Final concentration (20 µM) | |
| Peptide, recombinant protein | Human ECM | Corning, Cat#: 354237 | Placenta-derived vascular ECM |
Additional files
Download links
A two-part list of links to download the article, or parts of the article, in various formats.
Downloads (link to download the article as PDF)
Open citations (links to open the citations from this article in various online reference manager services)
Cite this article (links to download the citations from this article in formats compatible with various reference manager tools)
Microtubules regulate pancreatic β-cell heterogeneity via spatiotemporal control of insulin secretion hot spots
eLife 10:e59912.
https://doi.org/10.7554/eLife.59912


