A lung-on-chip model of early Mycobacterium tuberculosis infection reveals an essential role for alveolar epithelial cells in controlling bacterial growth
- School of Life Sciences, Swiss Federal Institute of Technology Lausanne (EPFL), Switzerland
- Emulate Inc, United States
Figures
Figure 1 with 3 supplements

Direct observation of the role of pulmonary surfactant in a lung-on-chip (LoC) model for tuberculosis.
Freshly isolated murine alveolar epithelial cells (ATs) are a mixture of (A) type I Pdpn-immunostained cells and (B) type II pro-SPC-immunostained cells containing lamellar bodies (white arrows). (C) In vitro passaged ATs have fewer and smaller lamellar bodies. (D) Schematic of the LoC model of early tuberculosis. Confluent layers of ATs and endothelial cells populate the top and bottom faces of the porous membrane that separates the air-filled 'alveolar' (upper) and liquid-filled 'vascular' (lower) compartments, creating an air-liquid interface. GFP-expressing macrophages (magenta) are added to the alveolar compartment to mimic the natural route of infection. h1 = 1 mm, h2 = 250 µm, h3 = 800 µm. (E-F) Confocal microscope images of an uninfected LoC stained to visualize nuclei (blue), actin (gray), and surfactant (green, anti-pro-SPC antibody) verifies that confluency of epithelial (E) and endothelial (F) layers is maintained at the air-liquid interface over 7 days. 3D imaging reveals occupancy of some pores by macrophages (G). Maximum intensity projection of a Z stack from representative field of view on an LoC reconstituted with normal surfactant (NS) (H) or deficient surfactant (DS) (I) ATs shows that these phenotypes are maintained at the air-liquid interface. Data from independent 155 × 155 μm2 fields of view from NS and DS LoCs (n=5 for NS and n=6 for DS) show that DS LoCs have fewer (J) and smaller (K) lamellar bodies. Mean and median values are represented by black and red bars, respectively. Whiskers represent the standard deviation in (J) and the 1–99 percentile interval in (K), (p = 0.045 and 6.6E-5, respectively). DS LoCs also have reduced expression of type II AT markers relative to NS LoCs (L), error bars represent the standard deviation for two technical repeats. (M-R) Widefield microscope images of LoCs reconstituted with NS (M-O) or DS (P-R) ATs and infected with a low dose of Mtb expressing td-Tomato (green). Images taken at 1 day post-infection (dpi) show that ATs (yellow boxes (M, P) and zooms (N, Q)) as well as macrophages (white boxes (M, P) and zooms (O, R)) can be sites of first contact. p-Values were calculated using the Kruskal-Wallis one-way ANOVA test.
Figure 1—figure supplement 1
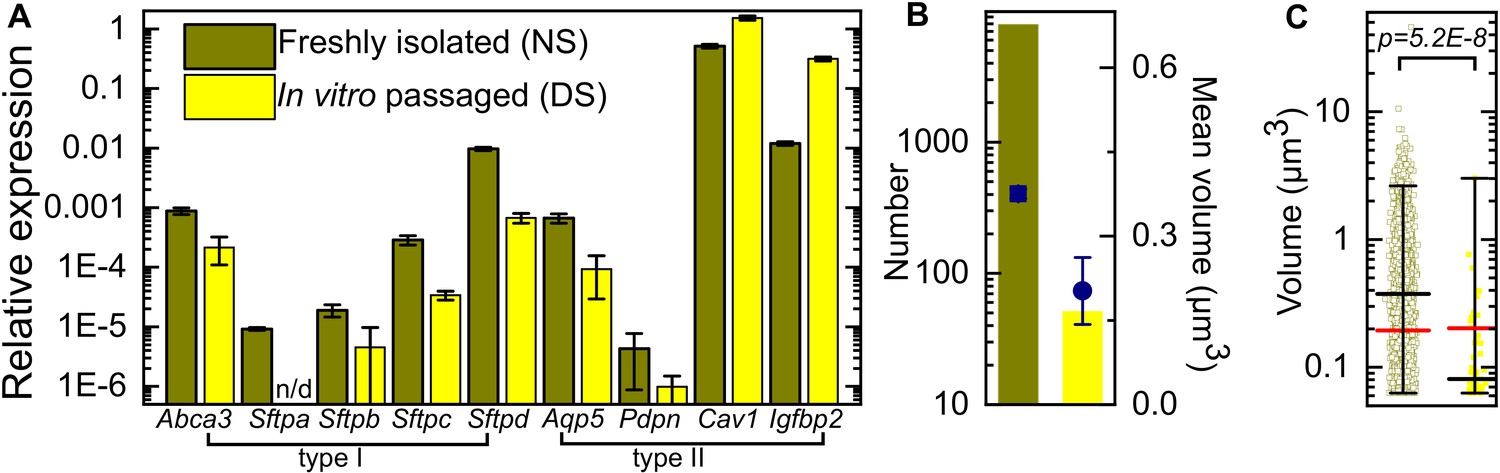
qRT-PCR characterization of expression of AT markers in freshly isolated and in vitro passaged murine alveolar epithelial cells relative to Gapdh.
(A) In vitro passage results in a reduction in expression of type II AT markers (Abca3, Sftpa, Sftpb, Sftpc, Sftpd) and type I AT makers (Aqp5 and Pdpn), whereas other type I AT markers corresponding to terminal differentiation (Cav1 and Igfpb2) are upregulated. Error bars represent the standard deviation for two technical repeats. (B) In vitro passage also reduces the number and mean volume of pro-SPC+ lamellar bodies. (C) Lamellar body volume is also significantly reduced. Mean and median volumes are represented by black and red bars, respectively. Whiskers represent the 1–99 percentile interval. (p = 5.2E-8) Based on these characteristics, we classify these populations as expressing normal surfactant (NS) or deficient surfactant (DS) levels, respectively. p-Values are calculated using the Kruskal-Wallis one-way ANOVA test.
Figure 1—figure supplement 2
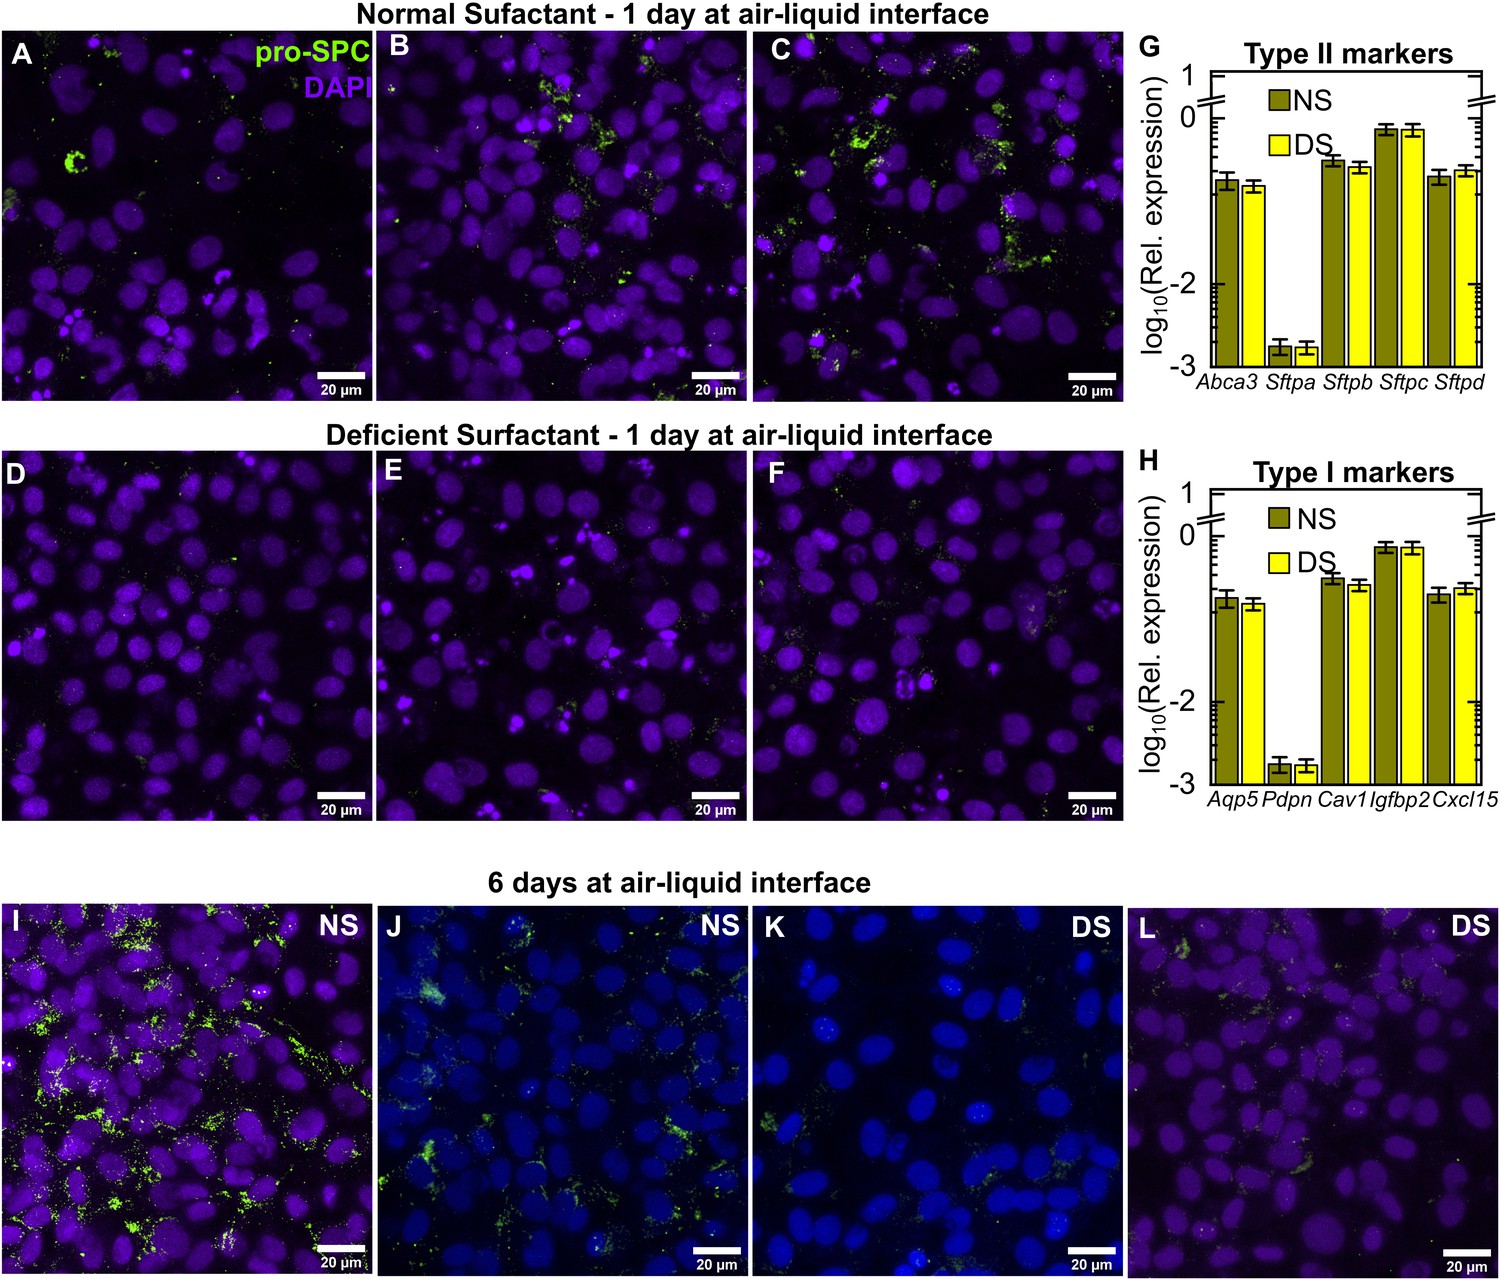
Additional characterization of AT phentype on-chip.
Additional examples for characterization of surfactant expression in lung-on-chips (LoCs) reconstituted with ATs with normal surfactant (NS) (A-C) or deficient surfactant (DS) levels (D-F), respectively. Each image is a maximum intensity projection of a stack obtained from the epithelial face of the LoC maintained for 24 hr at air-liquid interface (ALI) and immunostained for pro-SPC (chartreuse LUT) and DAPI (electric indigo LUT). Expression of type II (G) and type I (H) markers for the dataset shown in Figure 1L relative to Gapdh. Error bars represent the standard deviation for two technical repeats. Maximum intensity projections of a stack from the epithelial face of an NS LoC (I, J) and DS LoC (K, L) maintained for 6 days at ALI and immunostained for pro-SPC.
Figure 1—figure supplement 3
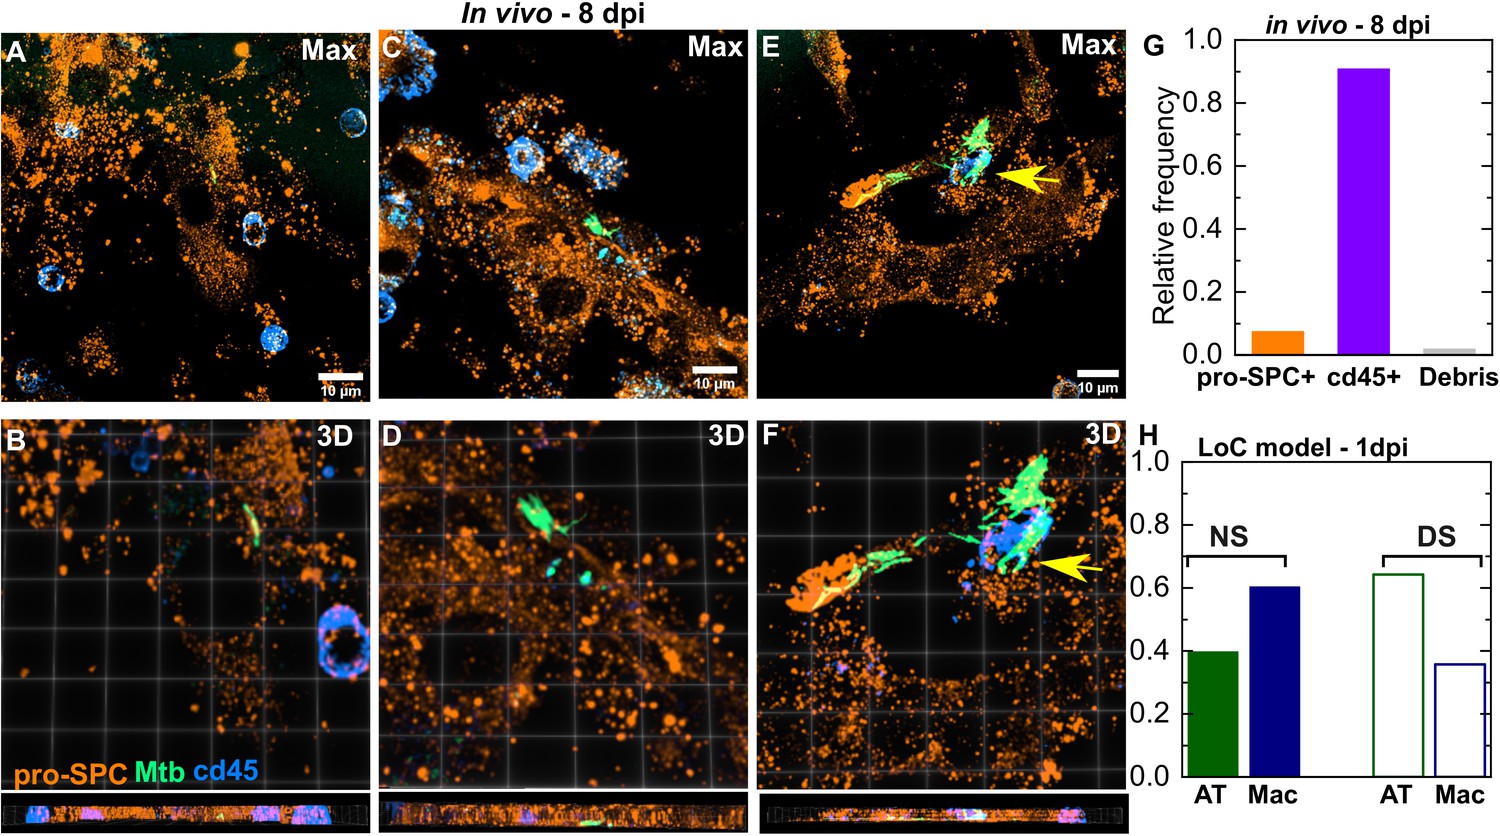
Mtb infection of ATs in vivo in the mouse model at 8 dpi.
Three examples of infected lung cells from a C57BL/6 mouse at 8 days post-infection. Immune cells(azure LUT, anti-CD45 antibody) and type II ATs (amber LUT, anti-proSP-C antibody) are identified via immunofluorescence, fluorescent Mtb are shown in spring green LUT. In each case, the maximum intensity Z projection is shown (A, C, E), and zooms (B, D, F) show a 3D projection viewed from the top (above) and side (below). Both lightly infected (A-D) and heavily infected (E, F) ATs are observed, an infected immune cell is indicated with a yellow arrow in (E, F). (G) Bar plots of the relative frequency of Mtb observed intracellularly in type II ATs, immune cells, or within host cell debris from a total of n=163 infected cells as analyzed by confocal microscopy. (H) A bar plot of the relative frequency of AT and macrophage infections at 1-day post-infection in the LoC model under NS or DS conditions.
Figure 2 with 7 supplements

Surfactant deficiency results in uncontrolled intracellular growth of Mtb.
Snapshots from live-cell imaging at 1.5–2.0 hr intervals between 3 and 5 days post-infection (dpi) in normal surfactant (NS) (A-D) and deficient surfactant (DS) (E-H) lung-on-chip (LoCs). Macrophages are false-colored magenta; Mtb is false-colored green. The calibration bar (inset in A, D, E, H) indicates the absolute intensities in the Mtb channel, the scales were chosen to achieve a similar saturation level in the images across surfactant conditions. Representative examples of infected AT (yellow boxes) and macrophage (white boxes) are highlighted, and zooms (B, C, F, G) reveal growth in both cell types over this period. Scale bar, 10 µm. (I, J) Plots of the logarithm of total fluorescence intensity over time confirm exponential Mtb growth for representative infections in ATs (I, K) and macrophages (J, L) under NS and DS conditions, respectively. In each case, an intracellular microcolony with growth rate close to the population maximum (red), median (yellow), and minimum (blue) is shown. The growth rate is the gradient of the linear fit. (M) Scatter plots of Mtb growth rates in ATs (n=122 for NS, n=219 for DS) and macrophages (n=185 for NS, n=122 for DS). Growth is significantly slower in macrophages than ATs in NS conditions (p = 7.8E-8) but not in DS conditions (p = 0.64), and is more heterogenous in both conditions compared to single-cell Mtb growth rate data from axenic microfluidic cultures. The green- and red-shaded regions indicate the growing bacteria and the non-growing fraction (NGF), respectively. (N) Uncontrolled growth in DS conditions can be rescued by exogenous administration of Curosurf. Scatter plots represent Mtb growth rates in macrophages in a DS LoC treated with Curosurf (‘Chiptreat’) or infected with Mtb preincubated with Curosurf (‘Mtbtreat’). Data from DS and NS LoC infections (no Curosurf) are included for comparison. Growth attenuation for both treatments is significant relative to DS conditions as reflected by the average growth rate and the size of the NGF (n = 122 for DS and n = 121 for Chiptreat; p = 2.5E-12 and n = 63 for Mtbtreat; p = 2.2E-12 and n = 122 for DS). p-Values were calculated using the Kruskal-Wallis one-way ANOVA test.
Figure 2—figure supplement 1
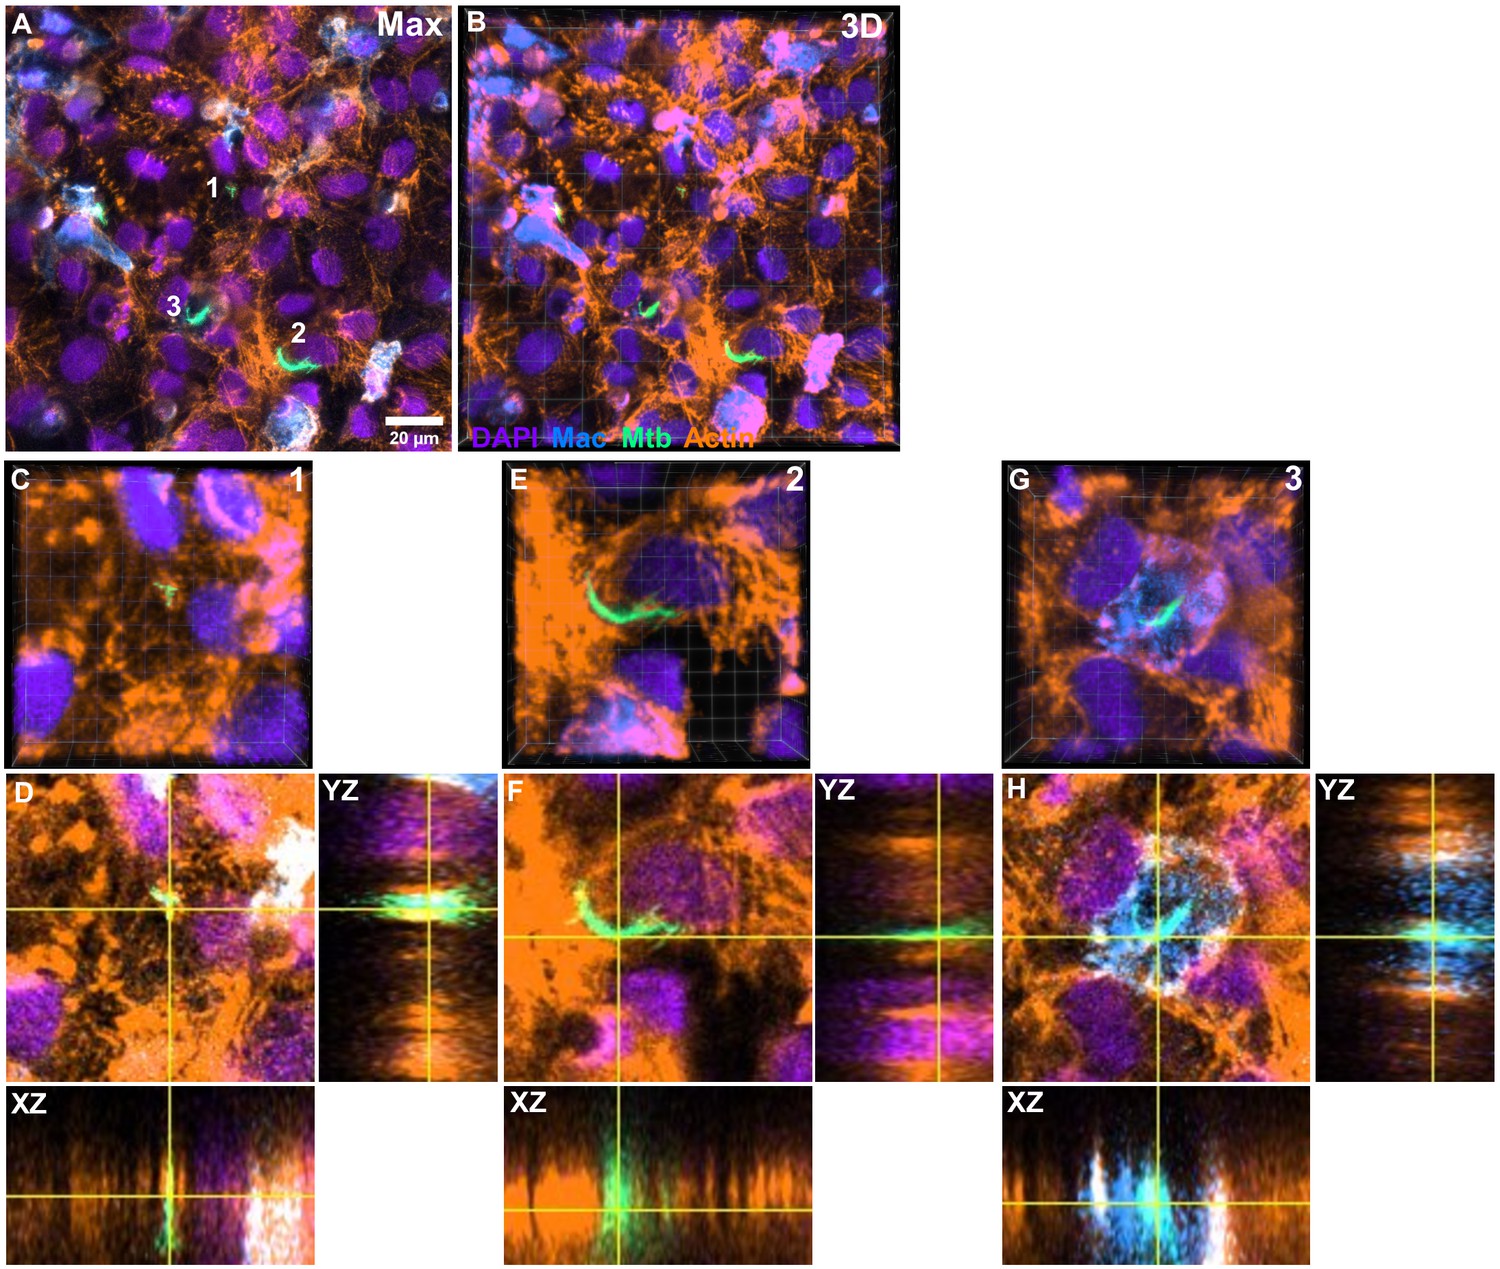
Characterization of intracellular Mtb growth in a lung-on-chip (LoC) treated with surfactant (chiptreat) at 4 days post-infection.
(A) A maximum intensity projection of a Z stack and (B) a 3D projection of a 155 × 155 μm2 field of view on the epithelial face of the LoC. Three areas marked in (A) are expanded in (C-H). In each case, 3D view is shown (C, E, G), followed by an individual slice from the stack (D, F, H) together with YZ and XZ orthogonal views for the entire stack at the positions indicated by the horizontal and vertical lines. Examples are chosen to highlight slow intracellular Mtb growth (C, D), rapid intracellular Mtb growth (E, F) and growth within macrophages (G, H). In all panels, cell nuclei are shown in indigo, fluorescent macrophages are shown in azure, fluorescent Mtb are shown in spring green, and actin is shown in amber LUTs, respectively.
Figure 2—figure supplement 2
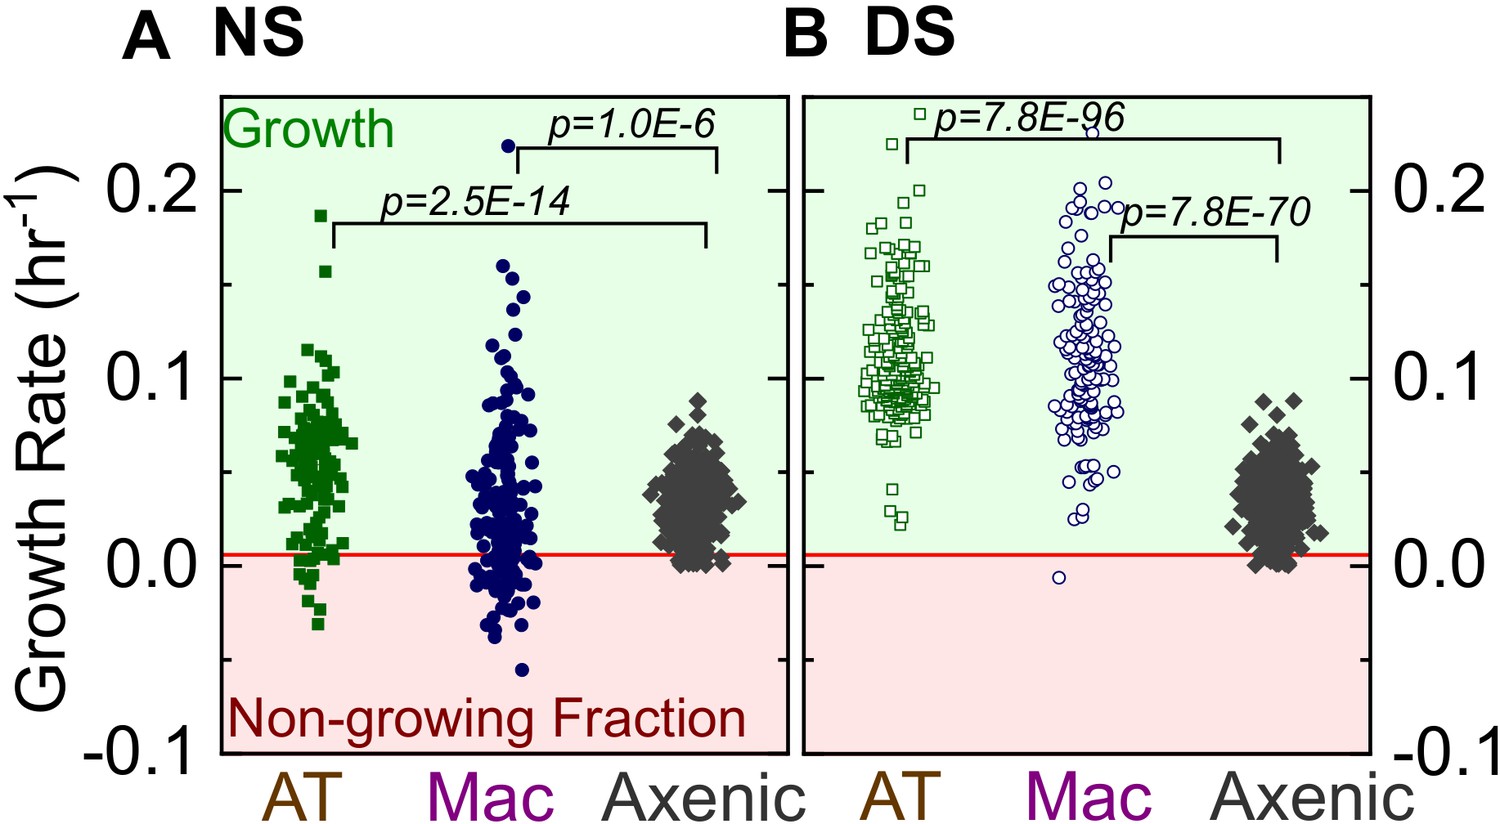
Comparison of Mtb growth rates on-chip vs. single-cell growth rates in axenic conditions.
Scatter plots of bacterial intracellular growth rates for infected ATs (n = 122 for NS, n = 219 for DS) or macrophages (n = 185 for NS, n = 122 for DS) in normal surfactant (NS) conditions (A) or deficient surfactant (DS) conditions (B). These measurements reveal greater cell-to-cell heterogeneity in both conditions (NS and DS) when compared to single-cell Mtb growth rates from axenic cultures grown in microfluidic devices. p-Values for comparisons of distributions were calculated using the Kruskal-Wallis one-way ANOVA test.
Figure 2—figure supplement 3
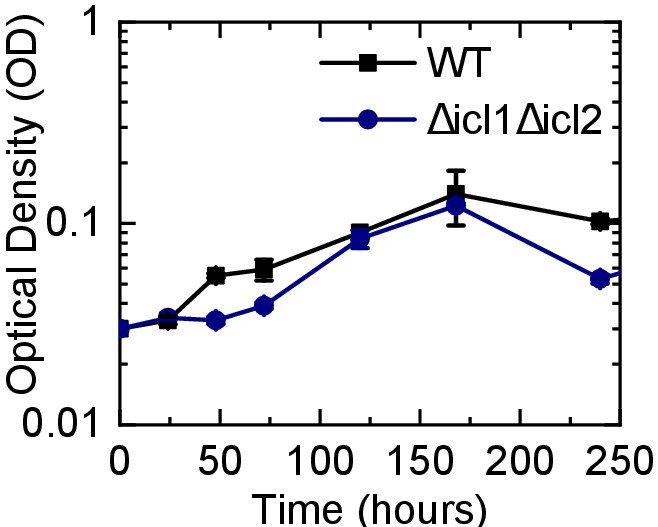
Characterization of the growth characteristics of WT and the Δicl1Δicl2 Mtb strain in ALI media.
Growth curves for WT Mtb and the Δicl1Δicl2 strain grown to exponential phase in 7H9 media and then sub-cultured in the ALI media used in the lung-on-chip experiments.
Figure 2—figure supplement 4
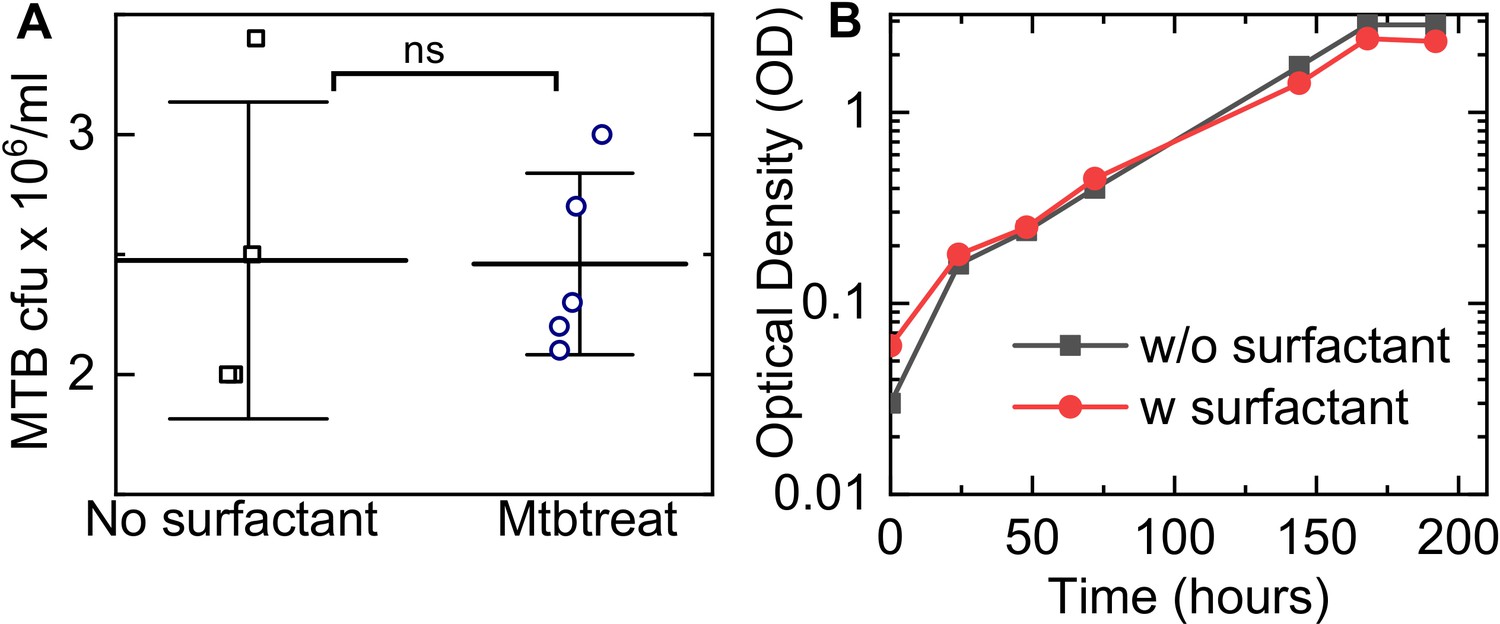
Curosurf does not affect Mtb viability or growth in vitro.
Figure 2—figure supplement 5
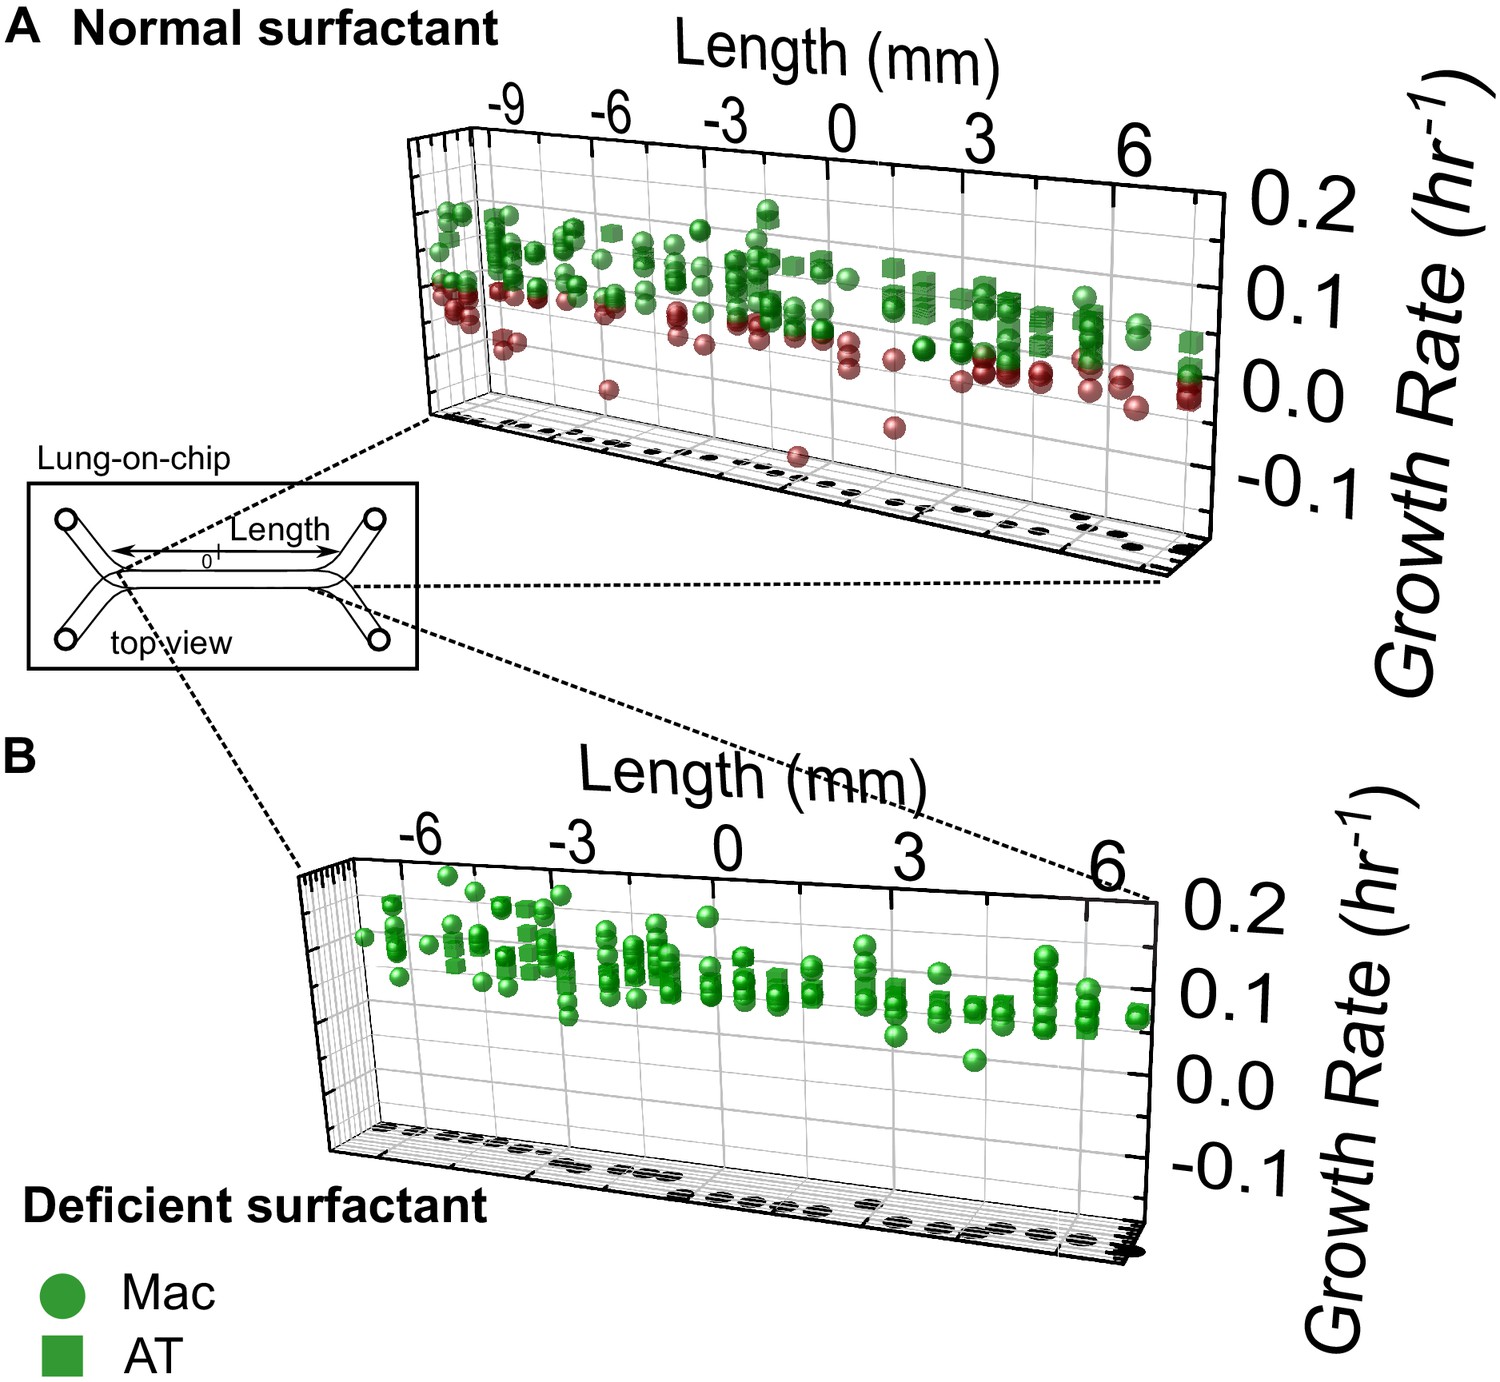
Heterogenous host-Mtb interactions are not restricted to a particular spatial niche on-chip.
3D scatter plots of growth rates of individual microcolonies of intracellular bacteria vs. their spatial coordinates on a representative LoC for normal surfactant (A) and deficient surfactant (B) conditions for infected ATs (cubes) and infected macrophages (spheres). Growing microcolonies are colored green and non-growing fraction (NGF) microcolonies are colored red, as in Figure 2. In both examples shown, heterogenous growth is observed throughout the chip, with no discernable spatial pattern. The X-axis refers to position along the length of the chip, with the approximate position of the origin (0 mm) set roughly in the middle of the chip, as indicated in the schematic.
Figure 2—video 1
Live-cell imaging over 3-5 days post-infection at the ALI for an LoC infected with WT Mtb in normal surfactant conditions and corresponding to snapshots in Figure 2A-D.
Imaging frequency is 1.5 hr. Macrophages are false-colored magenta, Mtb is false-colored green.
Figure 2—video 2
Live-cell imaging over 3-5 days post-infection at the ALI for an LoC infected with WT Mtb in deficient surfactant conditions and corresponding to snapshots in Figure 2E-H.
Imaging frequency is 2 hr. Macrophages are false-colored magenta, Mtb is false-colored green.
Figure 3 with 2 supplements
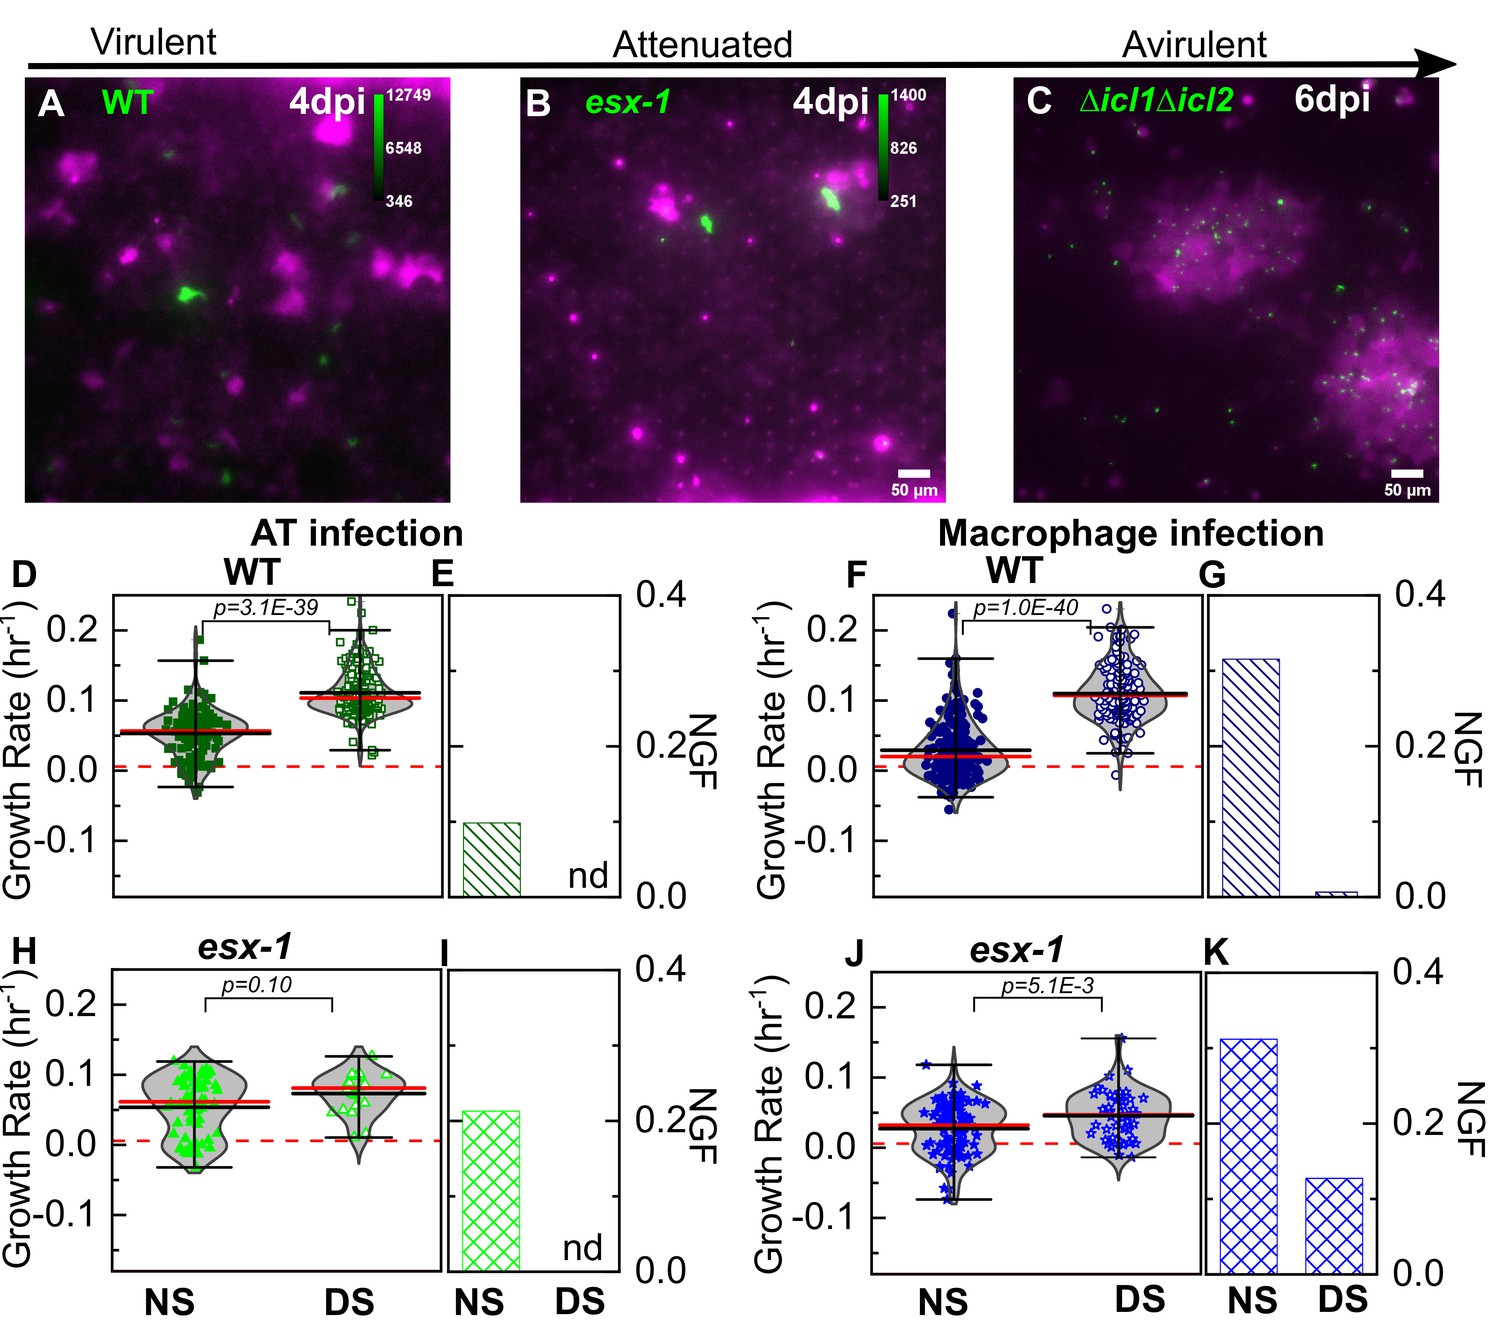
Attenuation of ESX-1-deficient strain is surfactant independent.
Snapshots from live-cell imaging in deficient surfactant (DS) conditions at 4 days post-infection for (A) wild-type Mtb, (B) an attenuated ESX-1-deficient strain (esx-1), and (C) at 6 days post-infection for the avirulent Δicl1Δicl2 strain infected at a higher inoculum. The calibration bar (inset in A-C) indicates the corresponding absolute intensities in the Mtb channel for a direct comparison across strains. Growth of the ESX-1-deficient strain is attenuated relative to wild-type Mtb (~10-fold decrease in intensity) and the Δicl1Δicl2 strain is unable to grow. Scatter plots indicate Mtb growth rate in individual ATs (D, H) and macrophages (F, J) and bar graphs indicate the non-growing fraction (NGF) of bacteria for infected ATs (E, I) and macrophages (G, K) in normal surfactant (NS) and DS conditions for wild-type and ESX-1-deficient strains. ‘nd’, not detected. Each dataset was fitted with a non-parametric kernel density estimation characterized by the mean (black) and median (red) values and whiskers represent the 1-99 percentile interval. For wild-type Mtb, DS conditions significantly increase growth rates and lower the NGF in both ATs (D, E) (n=122 for NS, n=219 for DS, p=3.1E-39) and macrophages (F, G) (n=185 for NS, n=122 for DS, p=1.0E-40). For the ESX-1-deficient strain, differences between NS and DS conditions are not significant in ATs (E) (n=61 for NS, n=25 for DS, p=0.10); for macrophage infection, differences are statistically significant (J) (n=93 for NS, n=55 for DS, p=5.1E-3), but a significant number of bacteria remain non-growing in DS conditions (K).
Figure 3—figure supplement 1
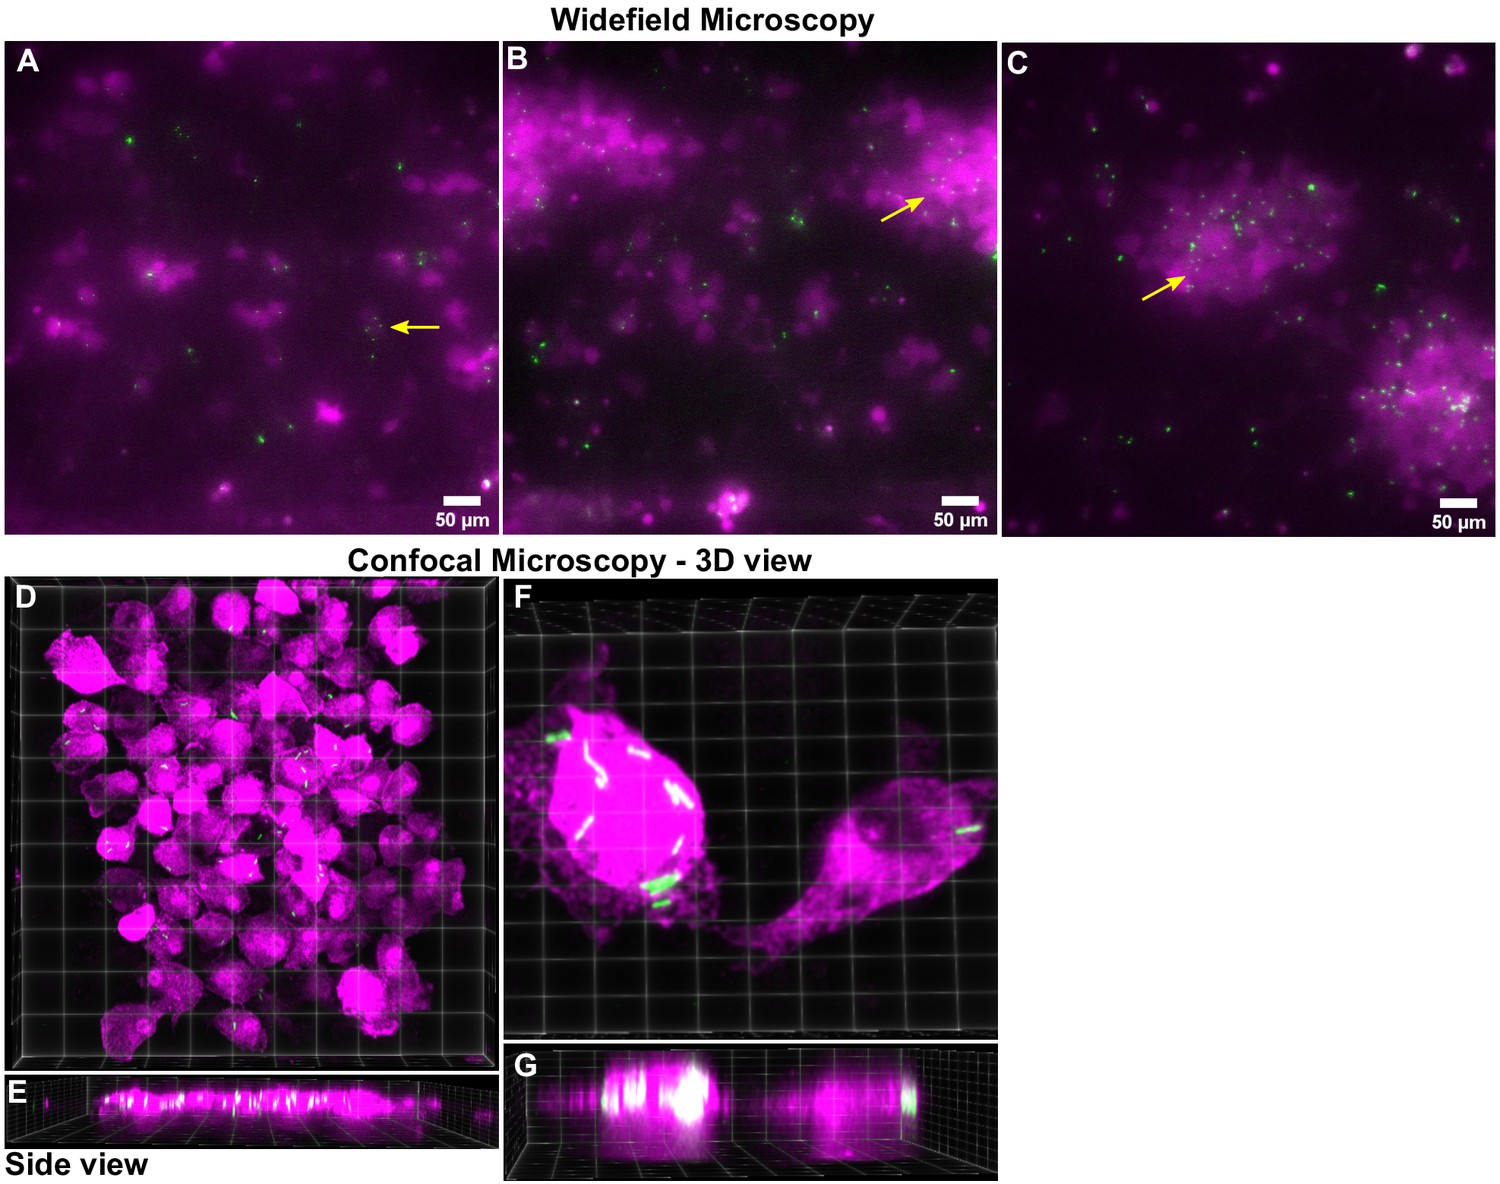
Additional characterization of a DS LoC infected with the Δicl1Δicl2 Mtb strain at 6 dpi.
(A, B, C) Snapshots from three representative fields of view taken with a widefield microscope at 6 days post-infection from a DS LoC infected with a high dose of the Δicl1Δicl2 strain of Mtb. An overwhelming majority of macrophages (false-colored magenta) remain infected with multiple single Δicl1Δicl2 Mtb bacteria (false-colored green, indicated with yellow arrows) despite the absence of net bacterial growth over time. Confocal microscopy provides higher resolution images. (D) A 3D projected view from the top and side (E) of a field of view on the LoC confirms the presence of single Δicl1Δicl2 Mtb bacteria in multiple macrophages. (F) A zoomed-in 3D projection view from the top and side (G) of a macrophage infected by multiple (left) and a single (right) Δicl1Δicl2 bacteria. The underlying AT layer is not shown.
Figure 3—figure supplement 2
Additional characterization of the Mtb growth rates in ATs vs. macrophages under DS and NS conditions.
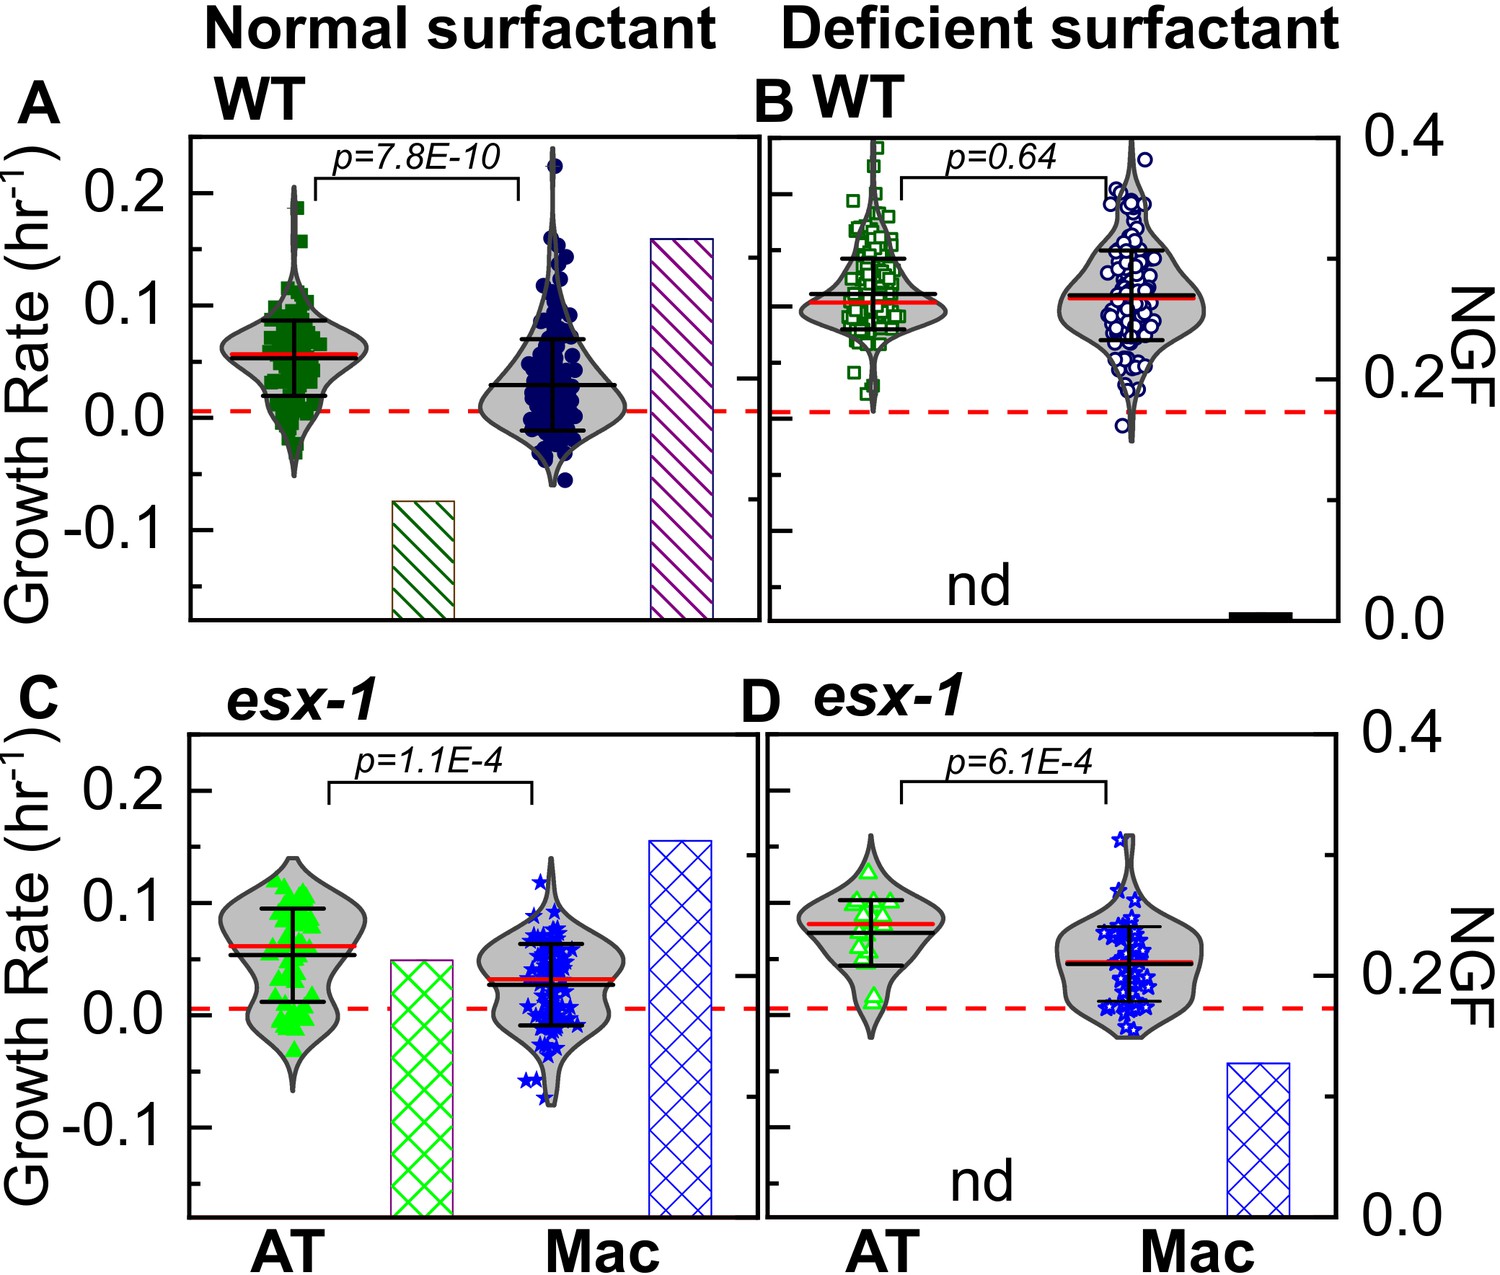
Scatter plots of growth rates of intracellular bacterial microcolonies and bar charts for the corresponding non-growing fraction (NGF) from Figure 3 for infected ATs and macrophages under normal surfactant (NS) conditions (A, C) and deficient surfactant (DS) conditions (B, D) for wild-type and ESX-1-deficient strains of Mtb, respectively. Under NS conditions, ATs are a more permissive niche than macrophages for both strains (A, C). Under DS conditions, macrophages are equally permissive as ATs for Mtb growth for wild-type Mtb (B) but not for ESX-1-deficient Mtb (D). The number of samples for each strain and condition is given in Table 1. p-Values were calculated using the Kruskal Wallis one-way ANOVA test.
Figure 4 with 1 supplement
LoC model under normal surfactant (NS) conditions accurately reflects in vivo dynamics.
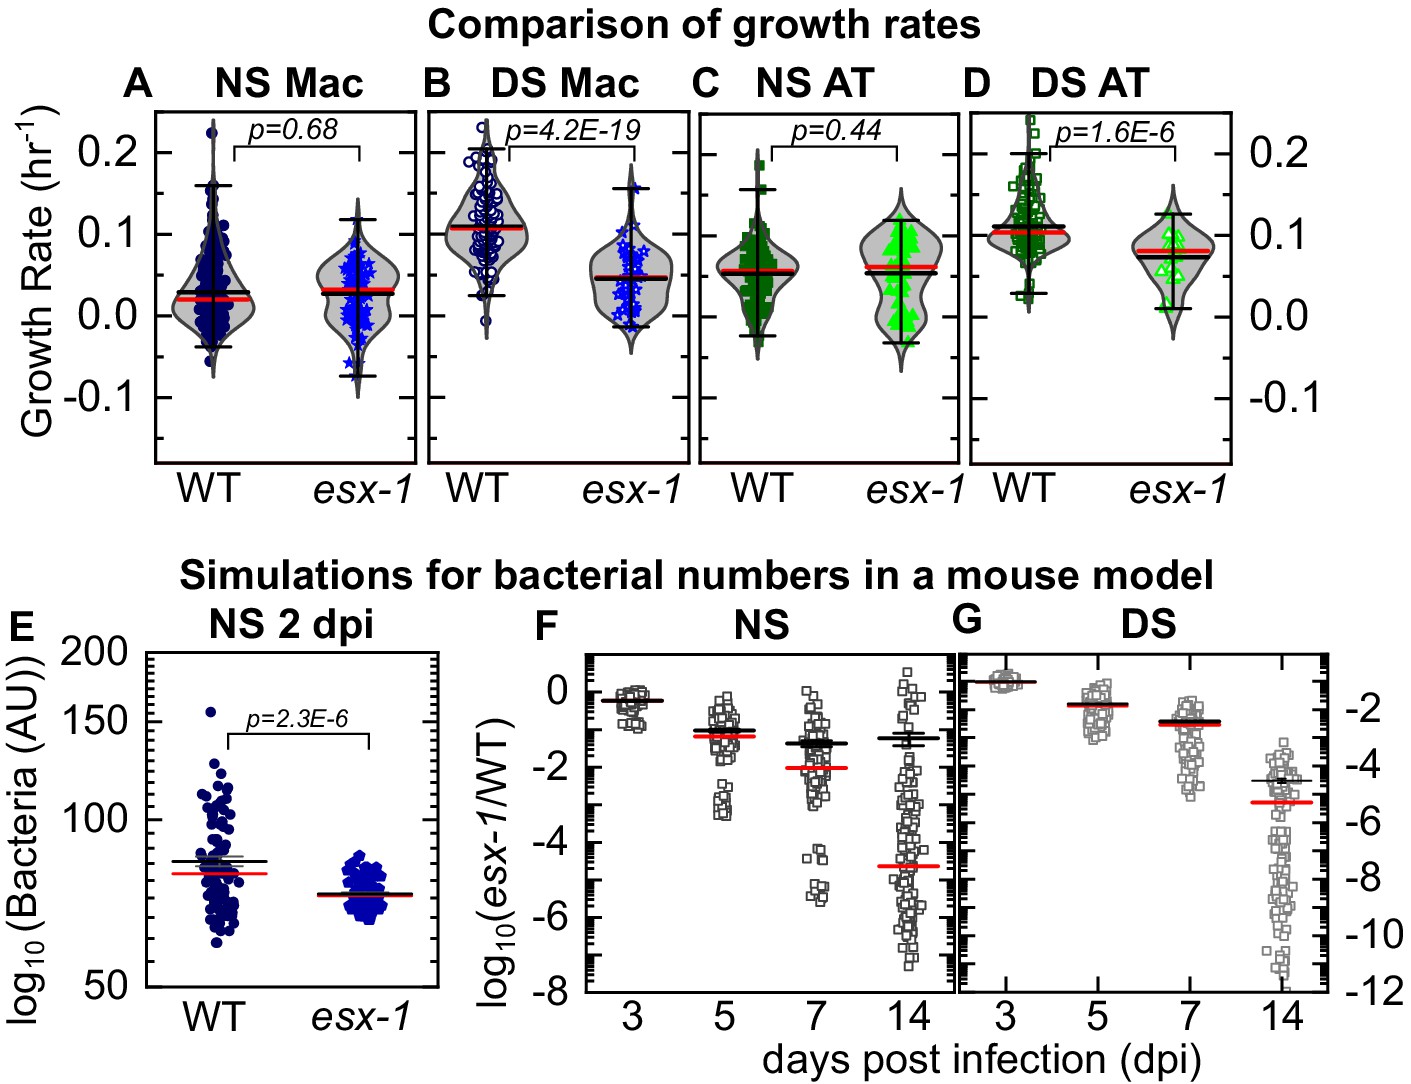
Experimental data: Scatter plots of growth rates of intracellular bacteria from Figure 3 compared between infected macrophages (A, B) and ATs (C,D) under NS conditions (A, C) and deficient surfactant (DS) conditions (B, D) for wild-type and ESX-1-deficient strains (esx-1) of Mtb. The number of samples for each bacterial strain and LoC condition is given in Table 2. Mean and median values are indicated by black and red lines, respectively, and whiskers indicate the 1–99 percentile interval. p-Values were calculated using the Kruskal-Wallis one-way ANOVA test. Simulations: Simulations of independent low-dose aerosol infections with 50 WT or esx-1 bacteria. Simulated bacteria grow at rates randomly chosen from the kernel density estimations for the respective populations in Figure 3F and J, respectively. (E) In NS conditions, mean bacterial numbers for wild-type Mtb are significantly higher (p = 2.3E-6, n = 100) than for ESX-1-deficient Mtb. (F, G) Plots of the logarithm of ESX-1-deficient population size relative to WT (esx-1/WT) at the indicated timepoints for NS (F) and DS (G) conditions. Each datapoint represents the mean (esx-1/WT) ratio from five mice bootstrapped from the larger population (n=1000) for each strain. The attenuation of the ESX-1-deficient strain initially increases but then levels off with a spread of (esx-1/WT) ratios by 14 days post-infection. Mean (black) and median (red) values are indicated, and whiskers indicate the standard error of the mean.
Figure 4—figure supplement 1
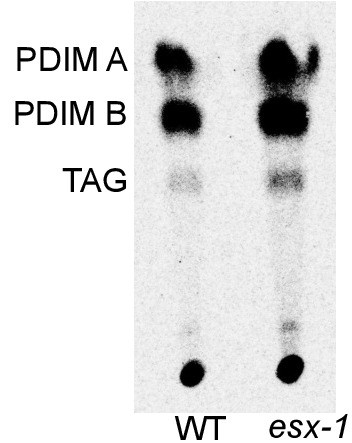
Characterization of the ESX-1 deficient strain for PDIM production.
Thin layer chromatography of lipids extracted from axenic cultures of wild-type Mtb (labeled WT) and the ESX-1-deficient strain. Running solvent was 9:1 petroleum ether: dimethyl ether, which identifies phthiocerol dimycocerosates (PDIM A and B) and triacylglycerol (TAG).
Figure 5 with 2 supplements
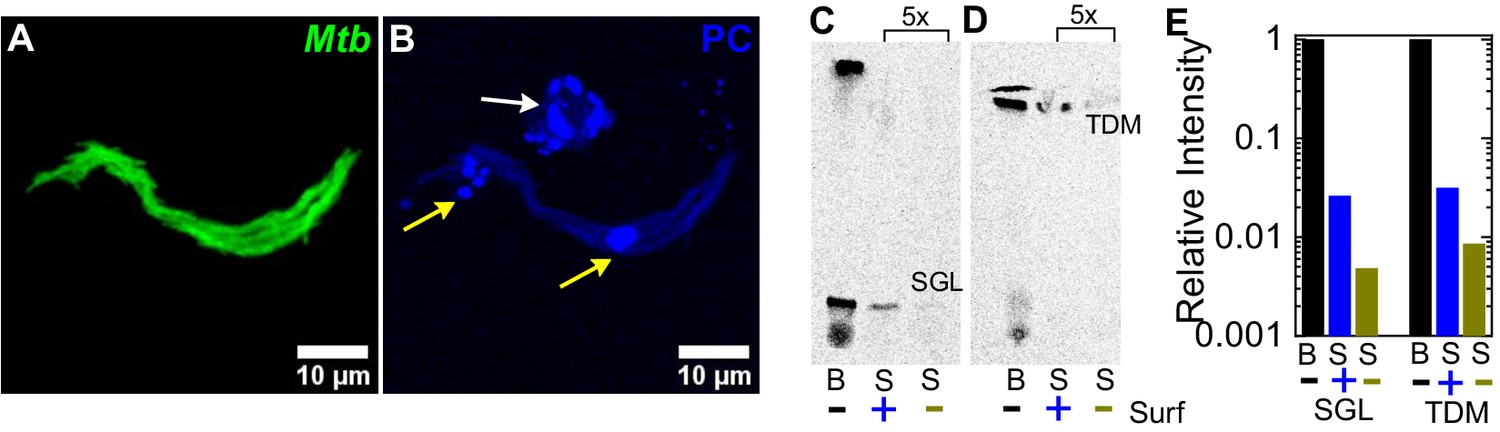
Surfactant depletes virulence factors on the bacterial cell surface.
(A, B) Maximum intensity projections of an aggregate of fluorescent Mtb (false-colored green, (A)) after incubation with a 1% solution of Curosurf labeled with 10% v/v TopFluor-Phosphatidylcholine (PC) (false-colored blue, (B)). PC is incorporated into surfactant micelles (indicated by arrows in (B)), which also associate with and coat the bacteria (yellow arrows). (C, D) Thin-layer chromatography of total free lipid extracted from wild-type Mtb (B) or bacterial culture supernatants (S) with (+) or without (-) Curosurf pre-treatment. The latter two samples were spotted 5x in excess. Running solvents are (C) 90:10:1 chloroform: methanol: water to identify sulfoglycolipids (SGL), and (D) 80:20:2 chloroform: methanol: ammonium hydroxide to identify trehalose dimycolate (TDM). (E) Intensities of the SGL and TDM bands for the three samples in (C, D) are plotted relative to that for the bacterial sample without surfactant treatment (labeled ‘B’). p-Values were calculated using the Kruskal-Wallis one-way ANOVA test.
Figure 5—figure supplement 1
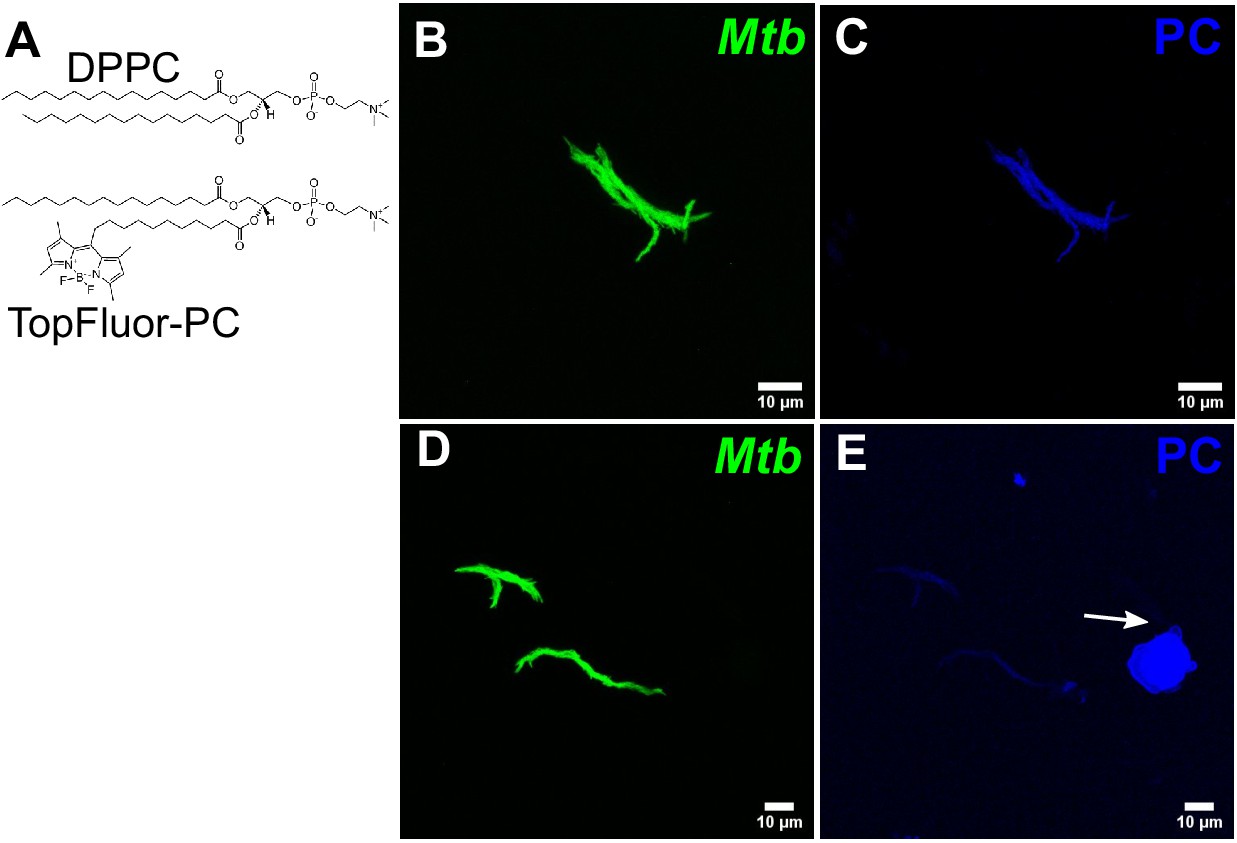
Additional characterization of Curosurf-Mtb surface interactions.
(A) Chemical structures of DPPC and fluorescently labeled analog (Top-Fluor PC). Additional examples highlighting the interaction of surfactant lipids with the bacterial cell surface. Maximum intensity projections of the bacterial (B, C) and surfactant (D, E) channels. A surfactant lipid vesicle is indicated by the white arrow. Intensities in the surfactant channel are normalized across (C and E) to highlight that surfactant coating of bacteria is heterogenous.
Figure 5—figure supplement 2
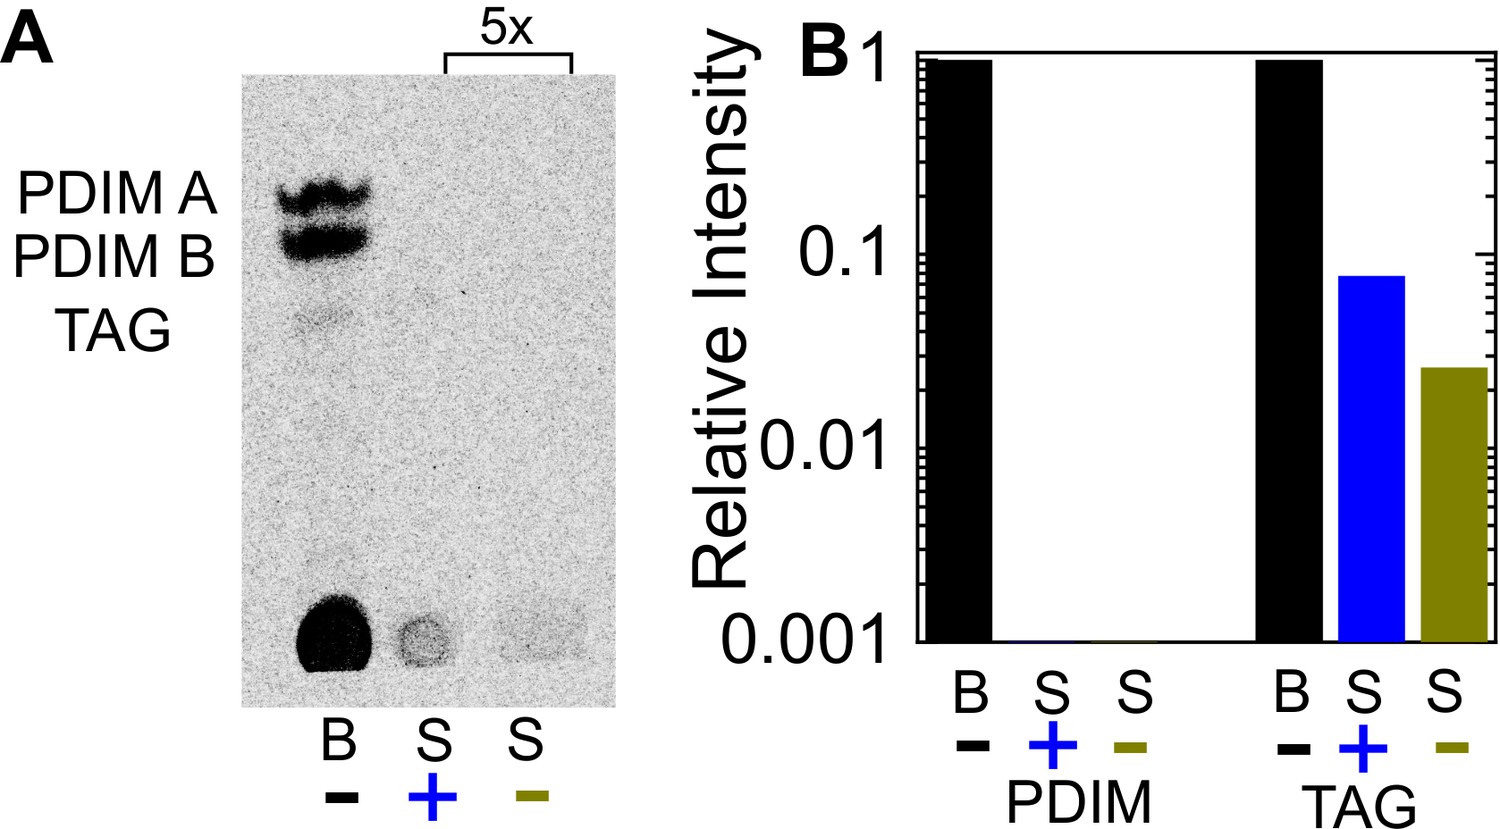
Curosurf treatment does not remove PDIM or TAG from the Mtb cell surface.
(A) Thin layer chromatography of total free lipid extracted from wild-type bacteria (labeled as ‘B’) or bacterial culture supernatants (labeled as ‘S’) with (+) or without (-) Curosurf pre-treatment. The latter two samples were spotted 5x in excess. Running solvent was 9:1 petroleum ether: dimethyl ether, which identifies phthiocerol dimycocerosates (PDIM) and triacylglycerol (TAG). (B) Intensities of the PDIM and TAG bands for the three samples in (A) are plotted relative to that for the bacterial sample without surfactant treatment (labeled ‘B’).
Videos
Video 1
3D rotation along the Y-axis of a Z-stack highlighting the intracellular localization of Mtb within a type II AT.
The field of view is 81.98 x 81.98 x 15.12 µm3. Colors: pro-SPC is labeled with the Amber LUT, Mtb is labeled with the Spring Green LUT, and CD45 is labeled with the Azure LUT.
Video 2
3D rotation along the Y-axis of a Z-stack highlighting the intracellular localization of Mtb within an infected AT on an LoC at 4 days post-infection.
The field of view is 40.30 × 40.30 × 23.40 µm3. Colors: Actin is labeled with the Amber LUT , Mtb with the Spring Green LUT, macrophages (identified via GFP expression are labeled with the Azure LUT), and nuclei stained by DAPI is labeled with the Electric Indigo LUT.
Video 3
Dynamic animation of the Z-stack highlighting the intracellular localization of Mtb within an infected AT on an LoC at 4 days post-infection.
The field of view is 40.30 × 40.30 × 23.40 µm3. Colors: Actin is labeled with the Amber LUT, Mtb with the Spring Green LUT, macrophages (identified via GFP expression are labeled with the Azure LUT), and nuclei stained by DAPI is labeled with the Electric Indigo LUT.
Tables
Table 1
Characterization of AT, endothelial cell, and macrophage densities in deficient surfactant (DS) and normal surfactant (NS) LoCs.
| Surfactant | Cell type | Cell density×104/ mm2 |
|---|---|---|
| DS | AT | 23.5±3.9 |
| NS | AT | 26.4±6 |
| DS | Macrophage | 3.3±1.5 |
| NS | Macrophage | 3.2±1.5 |
| n/a | Endothelial | 13.6±3.7 |
Table 2
Data for mean and median growth rates and total number of microcolonies (n) analyzed in the different experimental conditions outlined in Figures 2 and 3.
| Strain | Infection | Surfactant | Mean(h-1) | Median (h-1) | n |
|---|---|---|---|---|---|
| WT | AT | NS | 0.053 | 0.056 | 122 |
| WT | Mac | NS | 0.030 | 0.021 | 185 |
| WT | AT | DS | 0.111 | 0.103 | 219 |
| WT | Mac | DS | 0.109 | 0.107 | 122 |
| esx-1 | AT | NS | 0.054 | 0.062 | 61 |
| esx-1 | Mac | NS | 0.027 | 0.032 | 93 |
| esx-1 | AT | DS | 0.073 | 0.081 | 25 |
| esx-1 | Mac | DS | 0.045 | 0.047 | 55 |
| WT | Mac | DS-chiptreat | 0.073 | 0.079 | 121 |
| WT | Mac | DS-Mtbtreat | 0.055 | 0.061 | 63 |
Key resources table
| Reagent type (species) or resource | Designation | Source or reference | Identifiers | Additional information |
|---|---|---|---|---|
| Biological sample (Mus musculus) | C57BL/6 primary alveolar epithelial cells | Cell Biologics | Cat#: C57-6053 | |
| Biological sample (Mus musculus) | C57BL/6 primary lung microvascular endothelial cells | Cell Biologics | Cat#: C57-6011 | |
| Other | Epithelial cell culture medium with kit | Cell Biologics | Cat#: M6621 | |
| Other | Endothelial cell culture medium with kit | Cell Biologics | Cat#: M1168 | |
| Strain, strain background (Mus musculus, C57BL6) | Tg(act-EGFP) 131Osb/LeySopJ | Jackson Laboratory | Cat#: 006567; RRID:IMSR_JAX:006567 | Female, 6–8 weeks old |
| Peptide, recombinant protein | Murine recombinant M-CSF | ThermoFisherScientific | Cat#: PMC2044 | |
| Commercial assay or kit | Superscript IV First Strand Synthesis System | Thermo Fisher Scientific | Cat#: 18091050 | |
| Commercial assay or kit | Sybr Green PCR Master Mix | Thermo Fisher Scientific | Cat#: 4334973 | |
| Antibody | Anti-mouse proSPC (Rabbit polyclonal) | Abcam | Cat#: ab40879; RRID:AB_777473 | IF(1:100) |
| Antibody | Anti-mouse Podoplanin-488 (Syrian Hamster monoclonal) | Thermo Fisher Scientific | Cat#: 53-5381-82; RRID:AB_1106990 | IF(1:100) |
| Antibody | Anti-mouse CD45-647 (Rat monoclonal) | BioLegend | Cat#: 103124; RRID:AB_493533 | IF (1:100) |
| Commercial assay or kit | Lung dissociation kit - mouse | Miltenyi Biotec | Cat#: 130-095-927 | |
| Peptide, recombinant protein | Fibronectin from human plasma | Sigma-Aldrich | Cat#: F1056 | |
| Peptide recombinant protein | Native Collagen, Bovine dermis | AteloCell | Cat#: IAC-50 | 5 mg/ml |
| Software, algorithm | FIJI | RRID:SCR_002285 | ||
| Software, algorithm | MATLAB | RRID:SCR_001622 |
Table 3
Primers used for qPCR characterization of gene expression of the NS and DS AT cells in Figure 1, Figure 1—figure supplement 1, .
| qPCR primer list |
|---|
| 5′- CATCACTGCCACCCAGAAGACTG-3′ Gapdh forward |
| 5′- ATGCCAGTGAGCTTCCCGTTCAG-3′ Gapdh reverse |
| 5′- ACCTGGATGAGGAGCTTCAGAC-3′ Sftpa forward |
| 5′- CTGACTGCCCATTGGTGGAAAAG-3′ Sftpa reverse |
| 5′- TGTCCTCCGATGTTCCACTGAG-3′ Sftpb forward |
| 5′- AGCCTGTTCACTGGTGTTCCAG-3′ Sftpb reverse |
| 5′- GTCCTCGTTGTCGTGGTGATTG-3′ Sftpc forward |
| 5′- AAGGTAGCGATGGTGTCTGCTC-3′ Sftpc reverse |
| 5′- AGGTCCAGTTGGACCCAAAGGA-3′ Sftpd forward |
| 5′- CTGGTTTGCCTTGAGGTCCTATG-3′ Sftpd reverse |
| 5′- CTTCATGGACGAAGCTGACCTG-3′Abca3 forward |
| 5′- GTGCGGTTCTTTTACCAGCGTC-3′ Abca3 reverse |
| 5′-TCCATGAACCCAGCCCGATCTT-3′; Aqp5 forward |
| 5′-GAAGTAGAGGATTGCAGCCAGG-3′; Aqp5 reverse |
| 5′- CAAGAAAACAAGTCACCCCAATAG-3′; Pdpn forward |
| 5′- AACAATGAAGATCCCTCCGAC-3′; Pdpn reverse |
| 5′-CGAGGTGACTGAGAAGCAAG-3′; Cav1 forward |
| 5′-TCCCTTCTGGTTCTGCAATC-3′; Cav1 reverse |
| 5′-TGCCAAACACCTCAGTCTG-3′; Igfbp2 forward |
| 5′-AGGGAGTAGAGATGTTCCAGG-3′; Igfbp2 reverse |
| 5′-GGTGATATTCGAGACCATTTACTG-3′; Cxcl15 forward |
| 5′-GCCAACAGTAGCCTTCACCCAT-3′; Cxcl15 reverse |
Additional files
Download links
A two-part list of links to download the article, or parts of the article, in various formats.
Downloads (link to download the article as PDF)
Open citations (links to open the citations from this article in various online reference manager services)
Cite this article (links to download the citations from this article in formats compatible with various reference manager tools)
A lung-on-chip model of early Mycobacterium tuberculosis infection reveals an essential role for alveolar epithelial cells in controlling bacterial growth
eLife 9:e59961.
https://doi.org/10.7554/eLife.59961


