The nucleus serves as the pacemaker for the cell cycle
- Department of Chemical and Systems Biology, Stanford Medicine, United States
- Department of Molecular and Cellular Physiology, Stanford Medicine, United States
- Department of Biology, Stanford University, United States
- Department of Genetics, Stanford Medicine, United States
- Department of Biochemistry, Stanford Medicine, United States
Figures
Figure 1 with 3 supplements
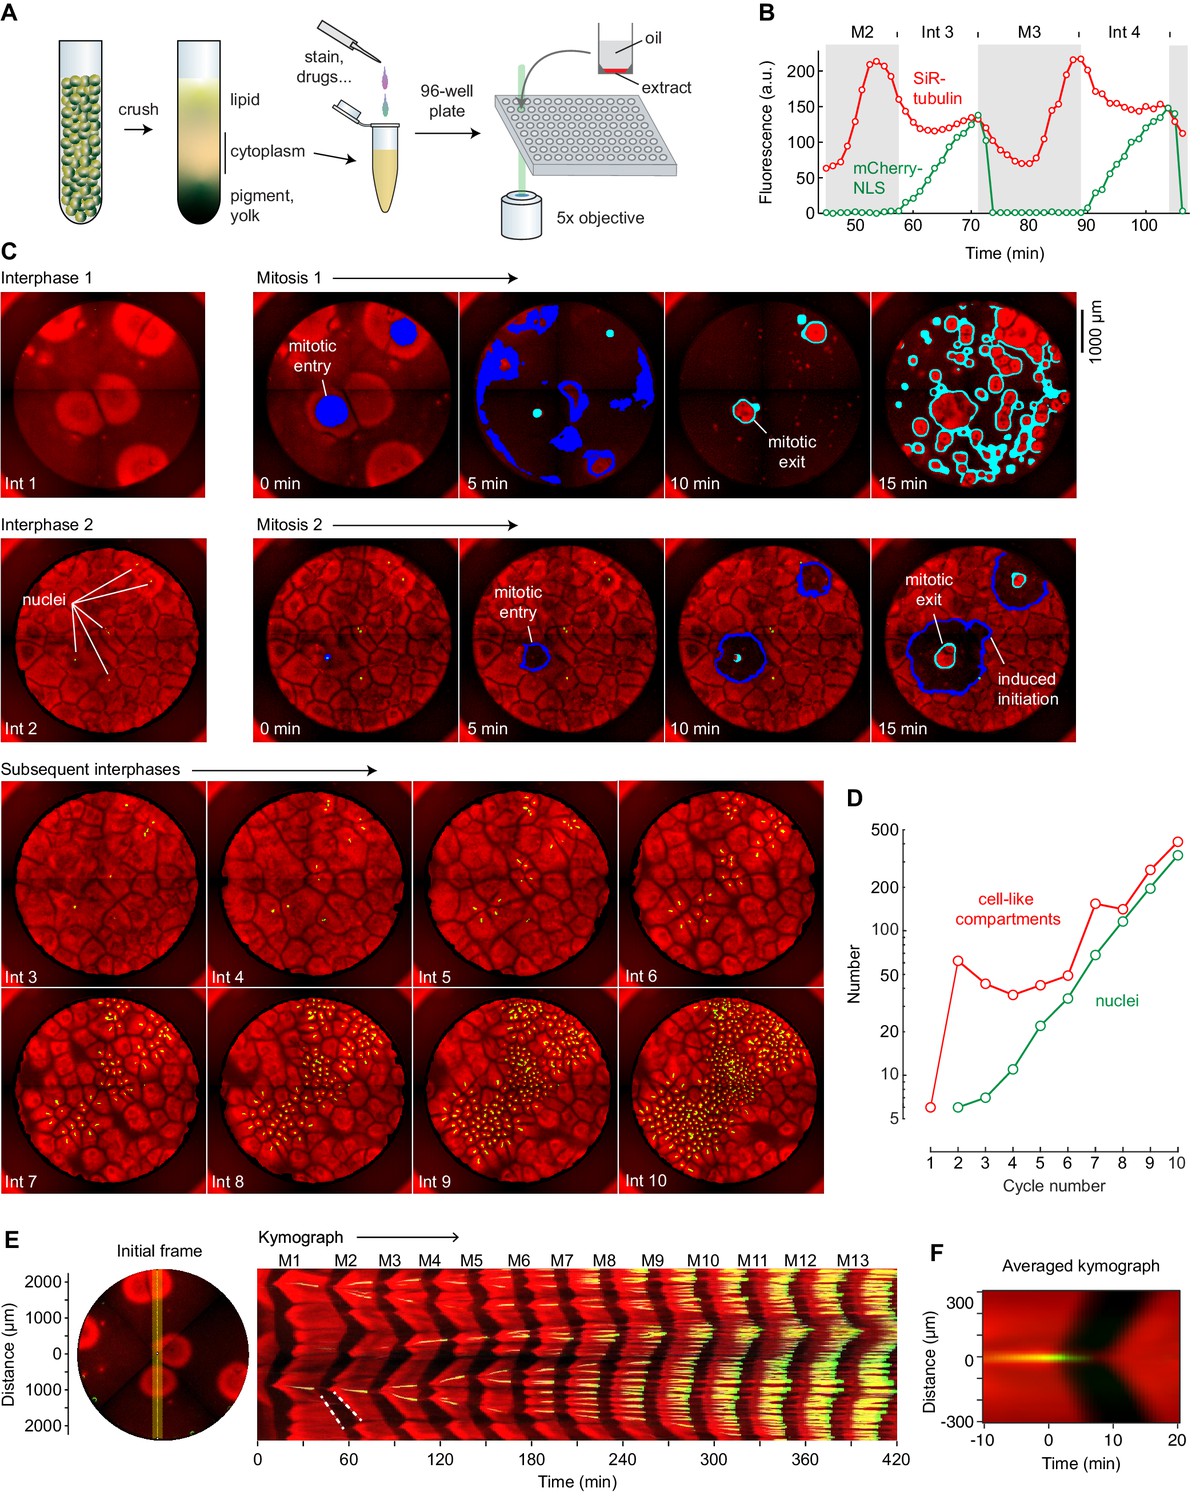
Cycling Xenopus egg extract resolved in two dimensions.
(A) Experimental scheme. (B–E) Analysis of a typical cycling extract. (B) Comparison of NLS-mCherry (green) and SiR-tubulin (red) fluorescence through two cycles. Fluorescence was measured in a small region centered on where mitosis 2 first initiated. (C) Time course of the cycling extract. Snapshots of the first 10 interphases are shown together with montages of mitosis 1 and mitosis 2. Nuclei (NLS-mCherry) are shown in green and microtubules (SiR-tubulin) in red. The advancing fronts of mitosis are depicted in blue and the advancing fronts of interphase in cyan. (D) The number of nuclei (green) and cell-like compartments (red) as a function of cycle number. For cycle 1, we have included only the six large cell-like compartments. (E) A kymograph (right) from a cross section of an extract over 14 mitotic cycles. The dashed white line shows linear spread of microtubule depolymerization at the onset of mitosis, with a speed of 65 µm/min, and aster growth during the transition back to interphase, with a speed of 40 µm/min. The snapshot on the left depicts the region where the kymograph was calculated (yellow vertical line). Note that the data for panels B–E all came from the same experiment. (F) Radial kymograph from 33 mitoses from different experiments. The average speed of the front of microtubule depolymerization at mitotic entry was 54 ± 13 μm/min, and speed of the front of microtubule polymerization during mitotic exit was 32 ± 6 μm/min (mean ± S.D).
Figure 1—figure supplement 1
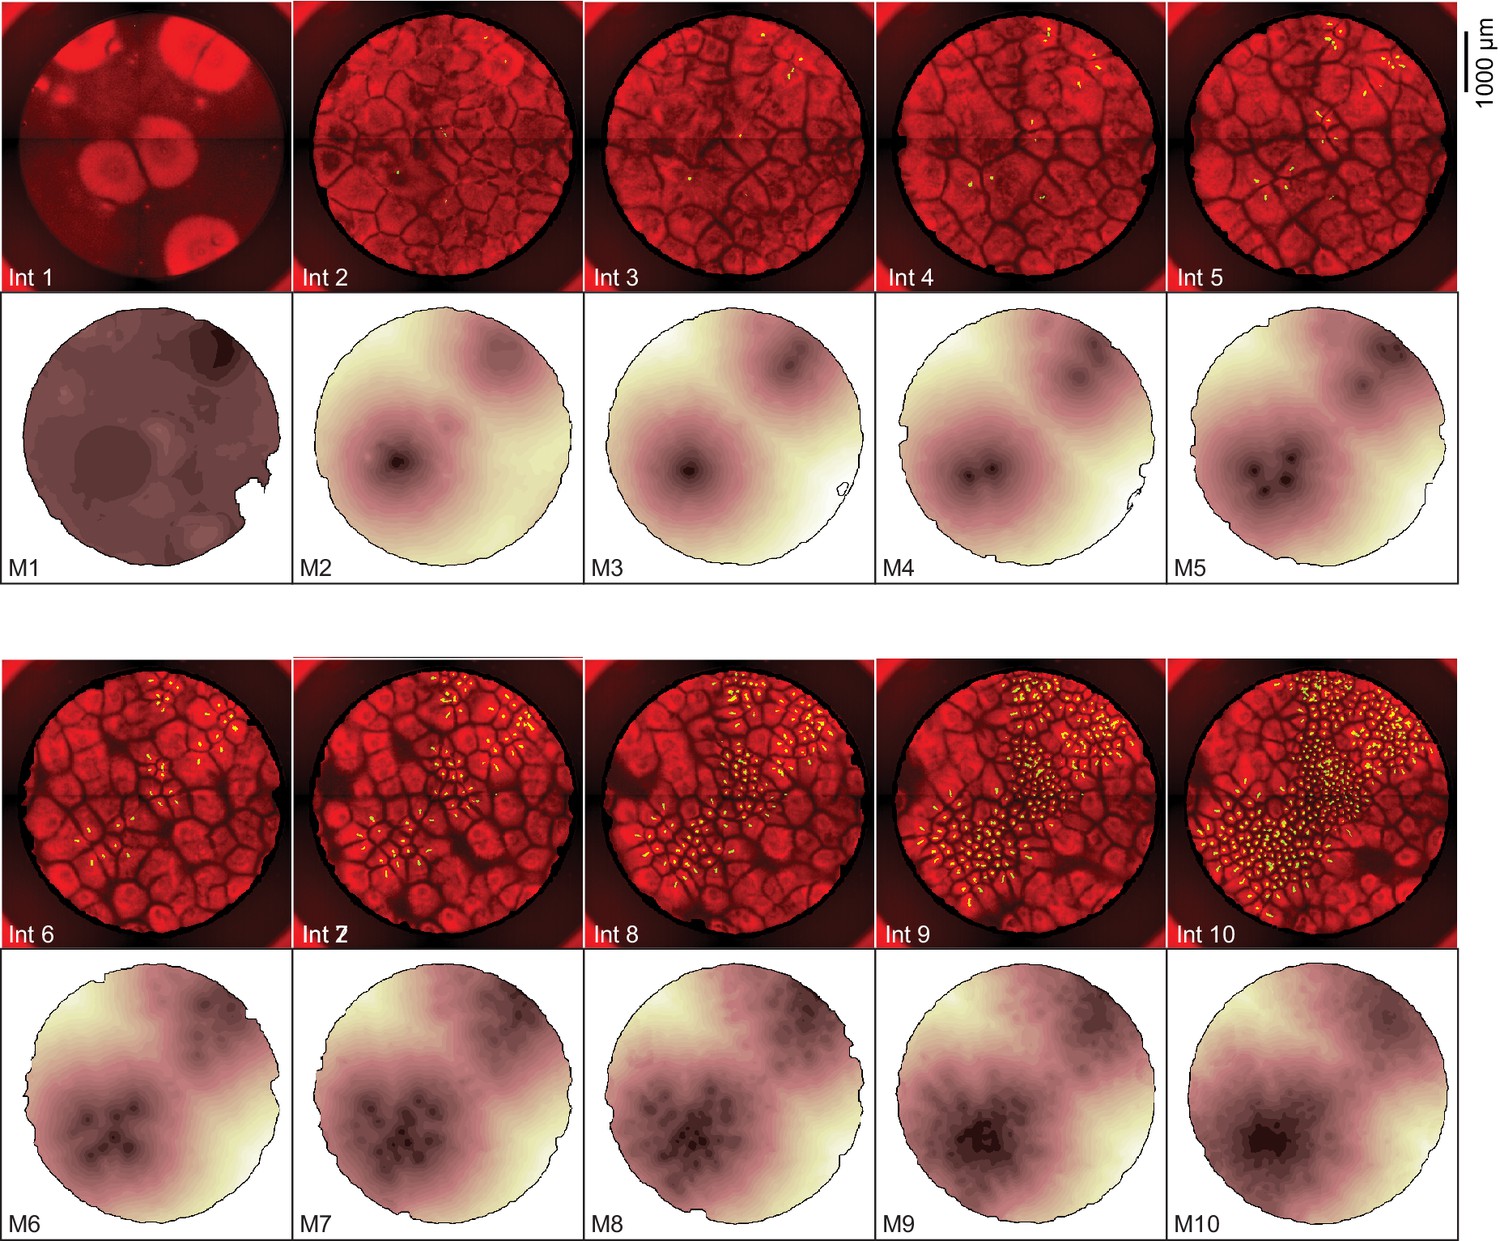
Heat maps showing the dynamics of mitosis for the experiment shown in Figure 1.
The fluorescence images are identical to the interphase snapshots shown in Figure 1C and are included for comparison. The dark regions in the heat maps are the areas where mitosis occurred earliest.
Figure 1—video 1
Trigger waves of tubulin depolymerization and polymerization in Xenopus extract supplemented with sperm.
Related to Figure 1.
Figure 1—video 2
Close up view of a dividing nuclear trigger wave source.
Related to Figure 1 and Figure 1—video 1.
Figure 2 with 3 supplements
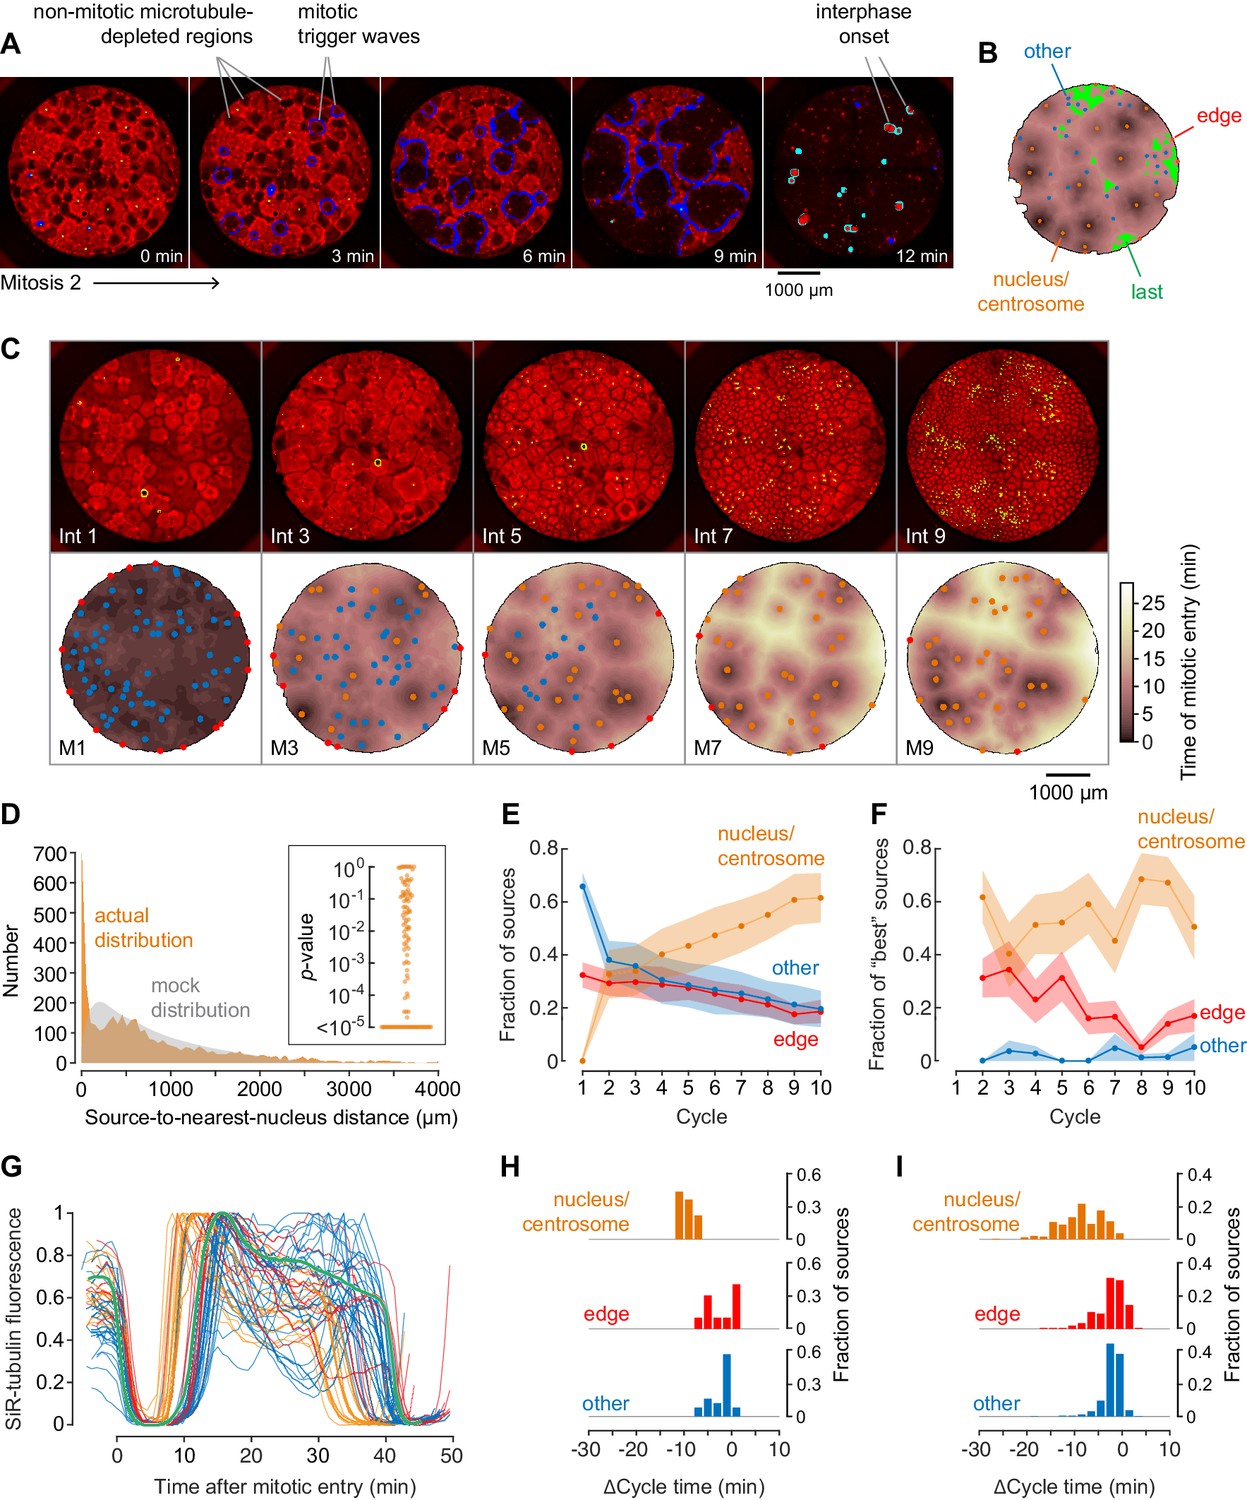
Demembranated sperm promotes mitotic initiation by shortening the cycle time.
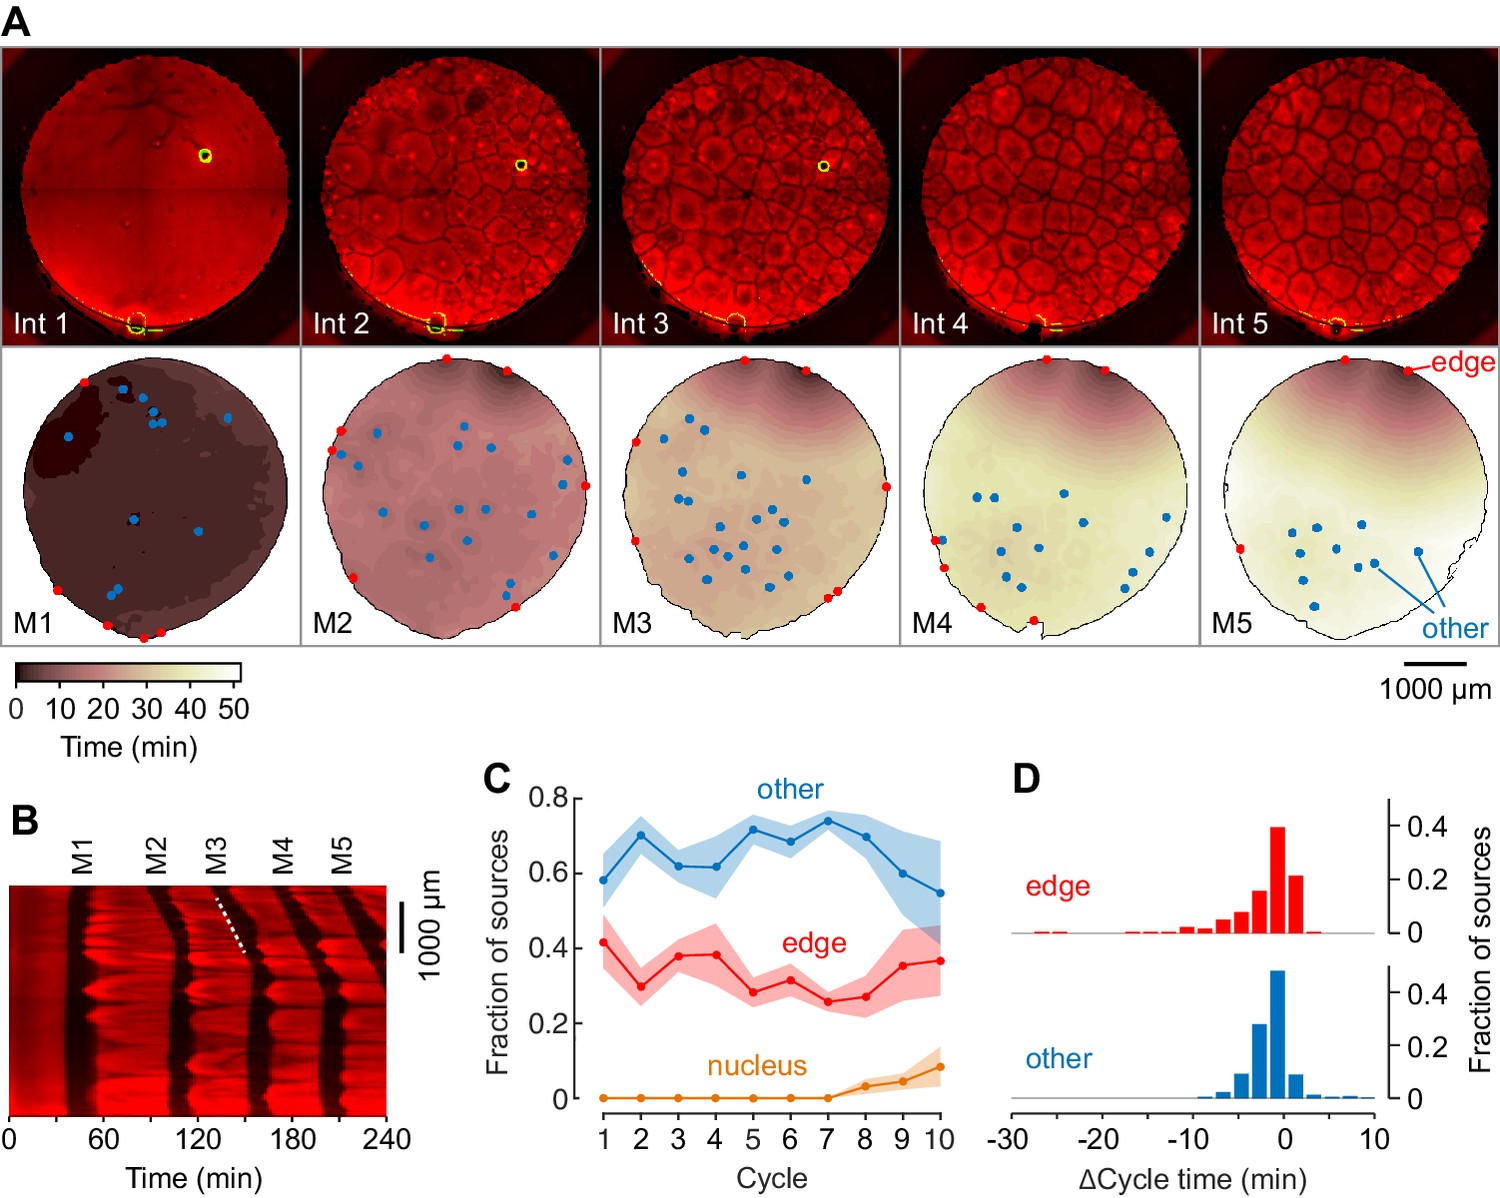
(A) Typical sperm-mediated mitotic trigger waves. Nuclei (NLS-mCherry) are shown in green and microtubules (SiR-tubulin) in red. The advancing fronts of mitosis are depicted in blue and the advancing fronts of interphase in cyan. (B) The trigger wave sources for the same cell cycle shown in (A), identified and characterized automatically. The time at which the various locations entered mitosis is depicted by a color scale, ranging from 46 min (dark) to 64 min (light). The latest 15% of the cytoplasm to enter mitosis is color-coded green. The trigger wave sources are plotted as filled circles of various colors: orange for sources associated with nuclei/centrosomes, red for sources at the edge of the well, and blue for others. (C) Montage showing changes in the pattern of mitotic sources from cycle 1 to 9. The coloring denotes the time at which each pixel entered mitosis relative to the earliest pixels in that cycle. (D) The distance of the trigger wave sources to the nearest nucleus (orange), compared to a mock distribution (gray). Data are from 107 cell cycles from 25 experiments and include 3140 sources. The inset shows the probabilities (p-values) of obtaining the observed number of mitotic sources (or more than the observed number) that are close (<100 µm) to nuclei for the 107 cell cycles analyzed individually. p-values were calculated by bootstrapping with 105 randomized source positions for each individual cycle. (E) The fraction of the mitotic sources classified as associated with nuclei/centrosomes (orange), edges (red), or others (blue) as a function of cycle number. The data points are mean fractions from 13 experiments where the extracts cycled at least 10 times, and the shaded regions show the ± SEM. (F) The average fraction of ‘best’ sources (the earliest 10% of the sources) that were associated with nuclei/centrosomes (orange), edges (red), or others (blue) as a function of cycle number for the same experiments shown in panel E. (G) Time courses of microtubule fluorescence intensity, normalized to the maximum and minimum fluorescence in that cycle and time-aligned to make mitotic initiation occur at t = 0. The initiation of mitosis was taken as the time when the microtubule fluorescence first showed a significant decline. (H) Acceleration of the cell cycle, as measured by Δcycle time, at the different cell-cycle sources relative to the slowest 15% of the pixels for the experiment shown in (G). The Δcycle times were calculated as the time between the onset of the mitosis after nuclei appeared and the onset of the preceding mitosis, relative to the slowest 15% of the well. (I) Histograms of Δcycle times relative to the slowest 15% of the pixels for mitotic sources from 22 experiments. The total numbers of sources are 195 nucleus/centrosome sources, 182 edge sources, and 367 others.
Figure 2—figure supplement 1
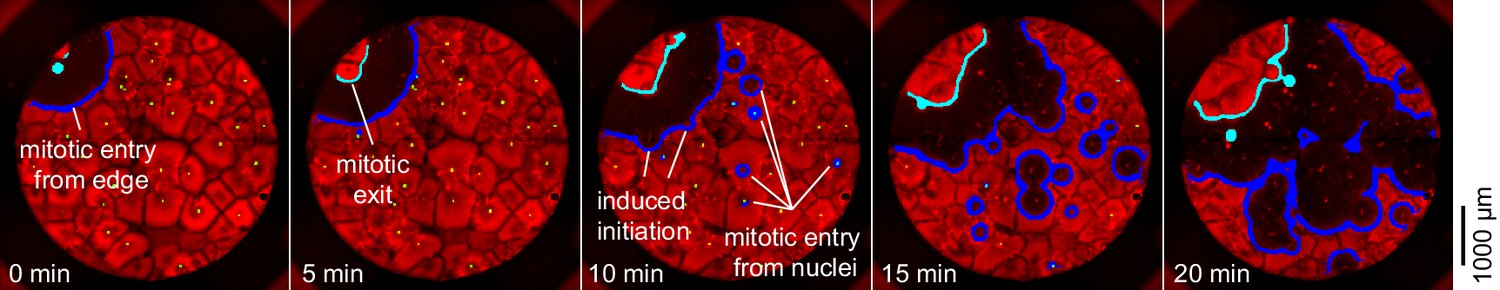
Mitosis initiating from a source at the edge of a well.
In this cycle, the first place at which mitosis occurred was a point on the edge of the well with no obvious nucleus nearby. Ten minutes later, mitosis began initiating at several nuclei at once.
Figure 2—video 1
Three classes of mitotic sources: others (left), nucleus-associated (center), and edge-associated (right).
Figure 2—video 2
Trigger waves of tubulin depolymerization and polymerization in a second Xenopus extract supplemented with sperm.
Related to Figure 2.
Figure 3 with 1 supplement
Mitotic waves in cycling extracts with no added sperm chromatin, DNA, or centrosomes.
(A) Montage from a typical experiment showing the microtubules (top) and the heat map representation of the mitotic dynamics (bottom) for the first five cycles. Edge-associated sources are shown in red; other sources—that is, those not associated with edges or nuclei—are shown in blue (other). The greenish circle in the upper right-hand quadrant of the first three frames of the microtubule montage is a bubble, not a nucleus. The coloring of the heat map representation denotes the time at which each pixel entered mitosis relative to the earliest pixels in that cycle. See also Figure 3—video 1. (B) Kymograph based on Figure 3—video 1. The kymograph was calculated for a slice beginning at the edge source at 1:00 in (A) and transecting the well. The trigger wave speed at the entrance to M3 was 60 µm/min (dashed white line). (C) Mean fraction of the mitotic sources originating from edges, nuclei, and other locations as a function of cycle number. Data are from six experiments. (D) Acceleration of the cell cycle at edge sources and other sources relative to the slowest 15% of the well. Data are from 24 experiments and include 176 edge sources and 393 other sources.
Figure 3—video 1
Trigger waves of tubulin depolymerization and polymerization in a Xenopus extract supplemented with no sperm, centrosomes, or nuclei added.
Related to Figure 3.
Figure 4 with 3 supplements
Centrosomes promote cytoplasmic organization and division of the cell-like compartments, but are not strong pacemaker sources.
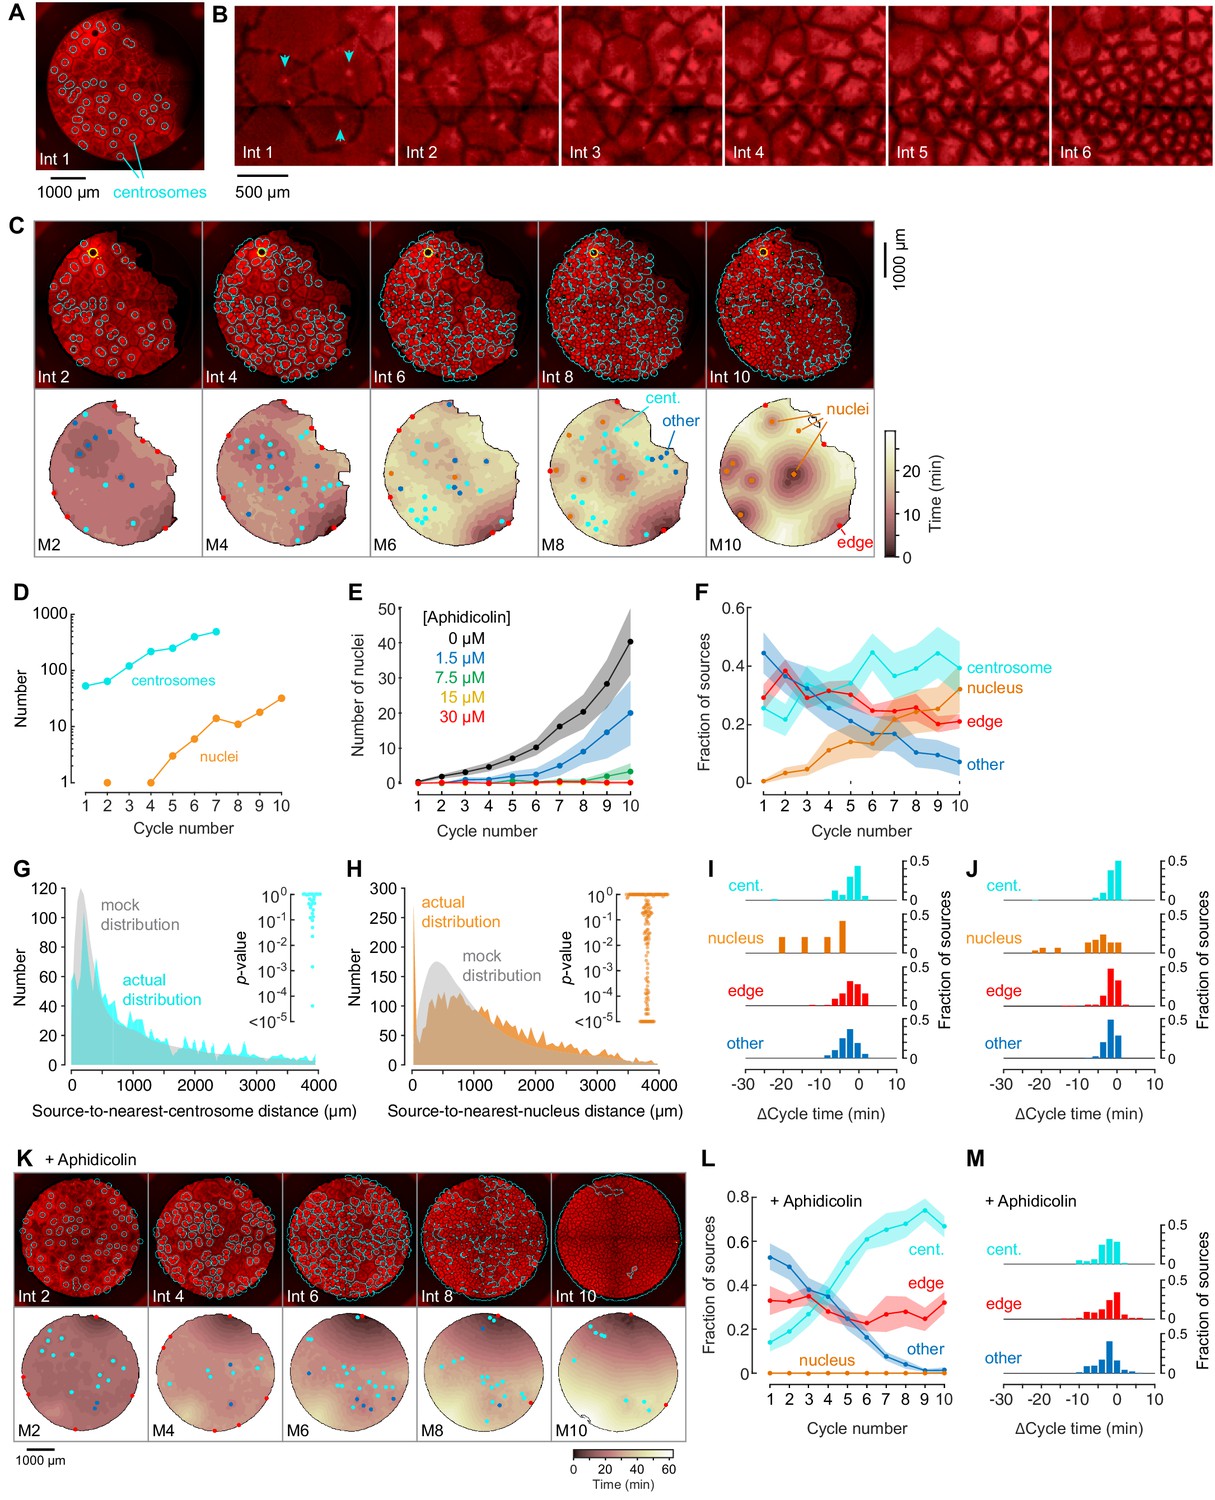
(A) Identification of centrosomes in an extract supplemented with purified HeLa cell centrosomes. (B) Montage showing that centrosomes duplicate and promote the division of cell-like compartments. SiR-Tubulin fluorescence is shown in red. (C) Montage showing SiR-tubulin fluorescence (red), NLS-mCherry fluorescence (green), and centrosome positions (cyan) (top), and heat maps of the mitotic sources (bottom), as a function of cycle number from a typical experiment. The coloring of the heat map denotes the time at which each pixel entered mitosis relative to the earliest pixels in that cycle. See also Figure 4—video 1. (D) The number of centrosomes and adventitiously-produced nuclei per cell cycle for the experiment shown in (C). (E) Suppression of nucleus formation by aphidicolin. (F) The fraction of the mitotic sources associated with nuclei/centrosomes (orange), edges (red), centrosomes (cyan) or others (blue) as a function of cycle number. The data points are mean fractions from 18 experiments where the extracts cycled at least 10 times, and the shaded regions show the ± SEM. (G, H) The distribution of distances from mitotic sources to the nearest centrosome (G, cyan), from 19 cycles, 11 experiments, and 494 sources, and from mitotic sources to the nearest nucleus (H, orange), from 149 cycles, 21 experiments, and 3993 sources. Only those cycles with fewer than 100 centrosomes or nuclei were included in G or H, respectively. The expected random distributions (mock distribution) of distances are shown in gray. The insets show probabilities (p-values) of obtaining the observed number of mitotic sources (or more than the observed number) that are close (<100 µm) to centrosomes (G) or nuclei for the individual analyzed cycles. p-values were calculated by bootstrapping with 105 randomized source positions for each individual cycle. (I) Acceleration of the cell cycle (measured as Δcycle times) relative to the slowest 15% of the cytoplasm. These Δcycle times were calculated for the first cell cycle after the appearance of centrosomes. Data are from 17 experiments and include 74 centrosome-, five nucleus-, 103 edge-associated sources and 167 other sources. (J) Acceleration of the cell cycle (measured as Δcycle times) relative to the slowest 15% of the cytoplasm, calculated for the first cell cycle after the appearance of nuclei (for those experiments where nuclei appeared). Data are from 19 experiments and include 369 centrosome-, 28 nucleus-, 132 edge-associated and 123 other sources. (K) Montage showing SiR-tubulin (red), NLS-mCherry (green), and centrosomes (cyan) for a centrosome-supplemented extract treated with 15 µM aphidicolin. (L) The fraction of the mitotic sources associated with centrosomes (cyan), edges (red) or others (blue) as a function of cycle number for aphidicolin-treated (15 to 60 µM), centrosome-supplemented extracts. From 11 experiments where the extracts cycled at least 10 times. (M) The Δcycle times for the three classes of mitotic sources. Data are from 14 experiments and include 82 centrosome-, 121 edge-associated sources and 169 other sources.
Figure 4—figure supplement 1
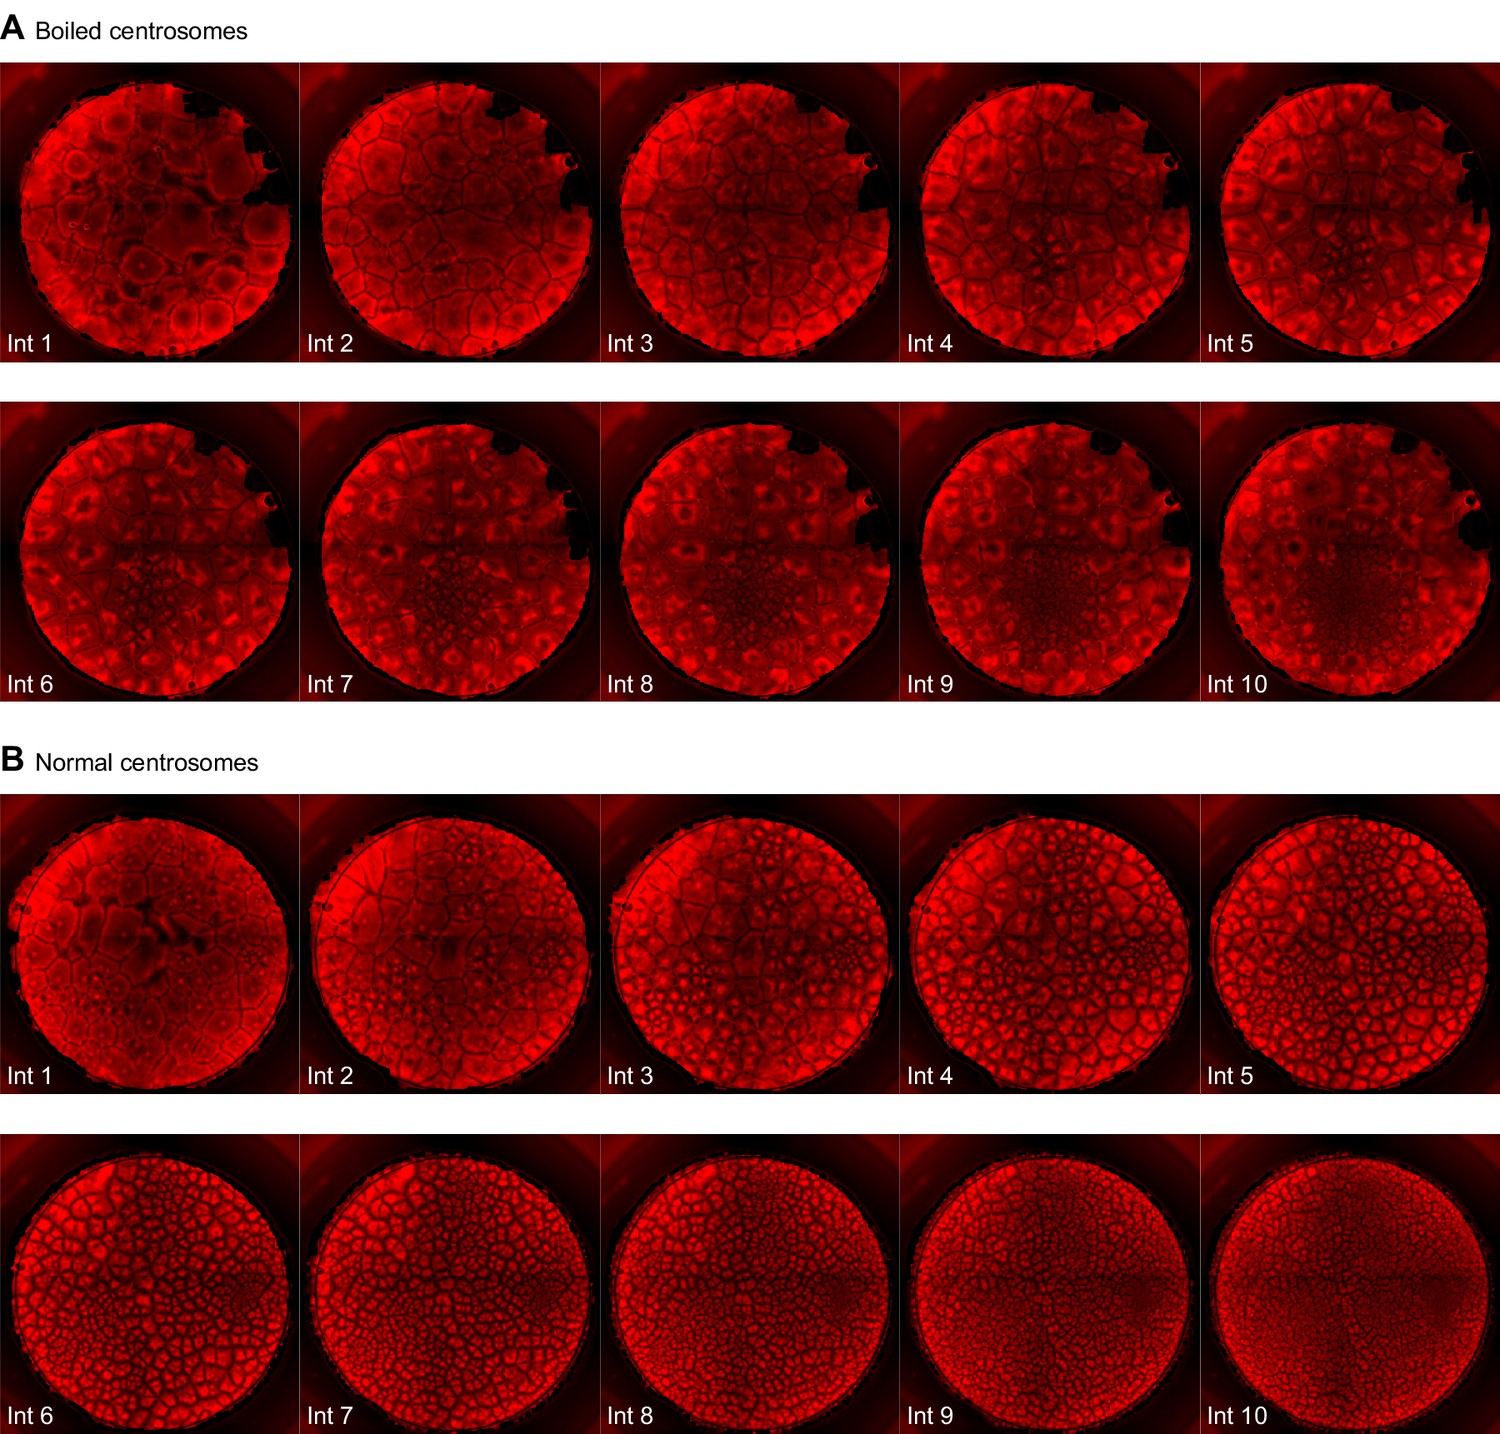
Montage of an extract with added boiled centrosomes (A) or normal centrosomes (B).
Note there appears to be one functional centrosome in interphase 1 in (A), which subsequently replicates and divides, versus numerous functional centrosomes in (B).
Figure 4—video 1
Trigger waves of tubulin depolymerization and polymerization in a Xenopus extract supplemented with purified HeLa cell centrosomes.
Related to Figure 4.
Figure 4—video 2
Trigger waves of tubulin depolymerization and polymerization in a Xenopus extract supplemented with purified HeLa cell centrosomes and aphidicolin (15 µM).
Related to Figure 4.
Figure 5 with 2 supplements
Phage DNA forms nuclei that can act as trigger wave sources.
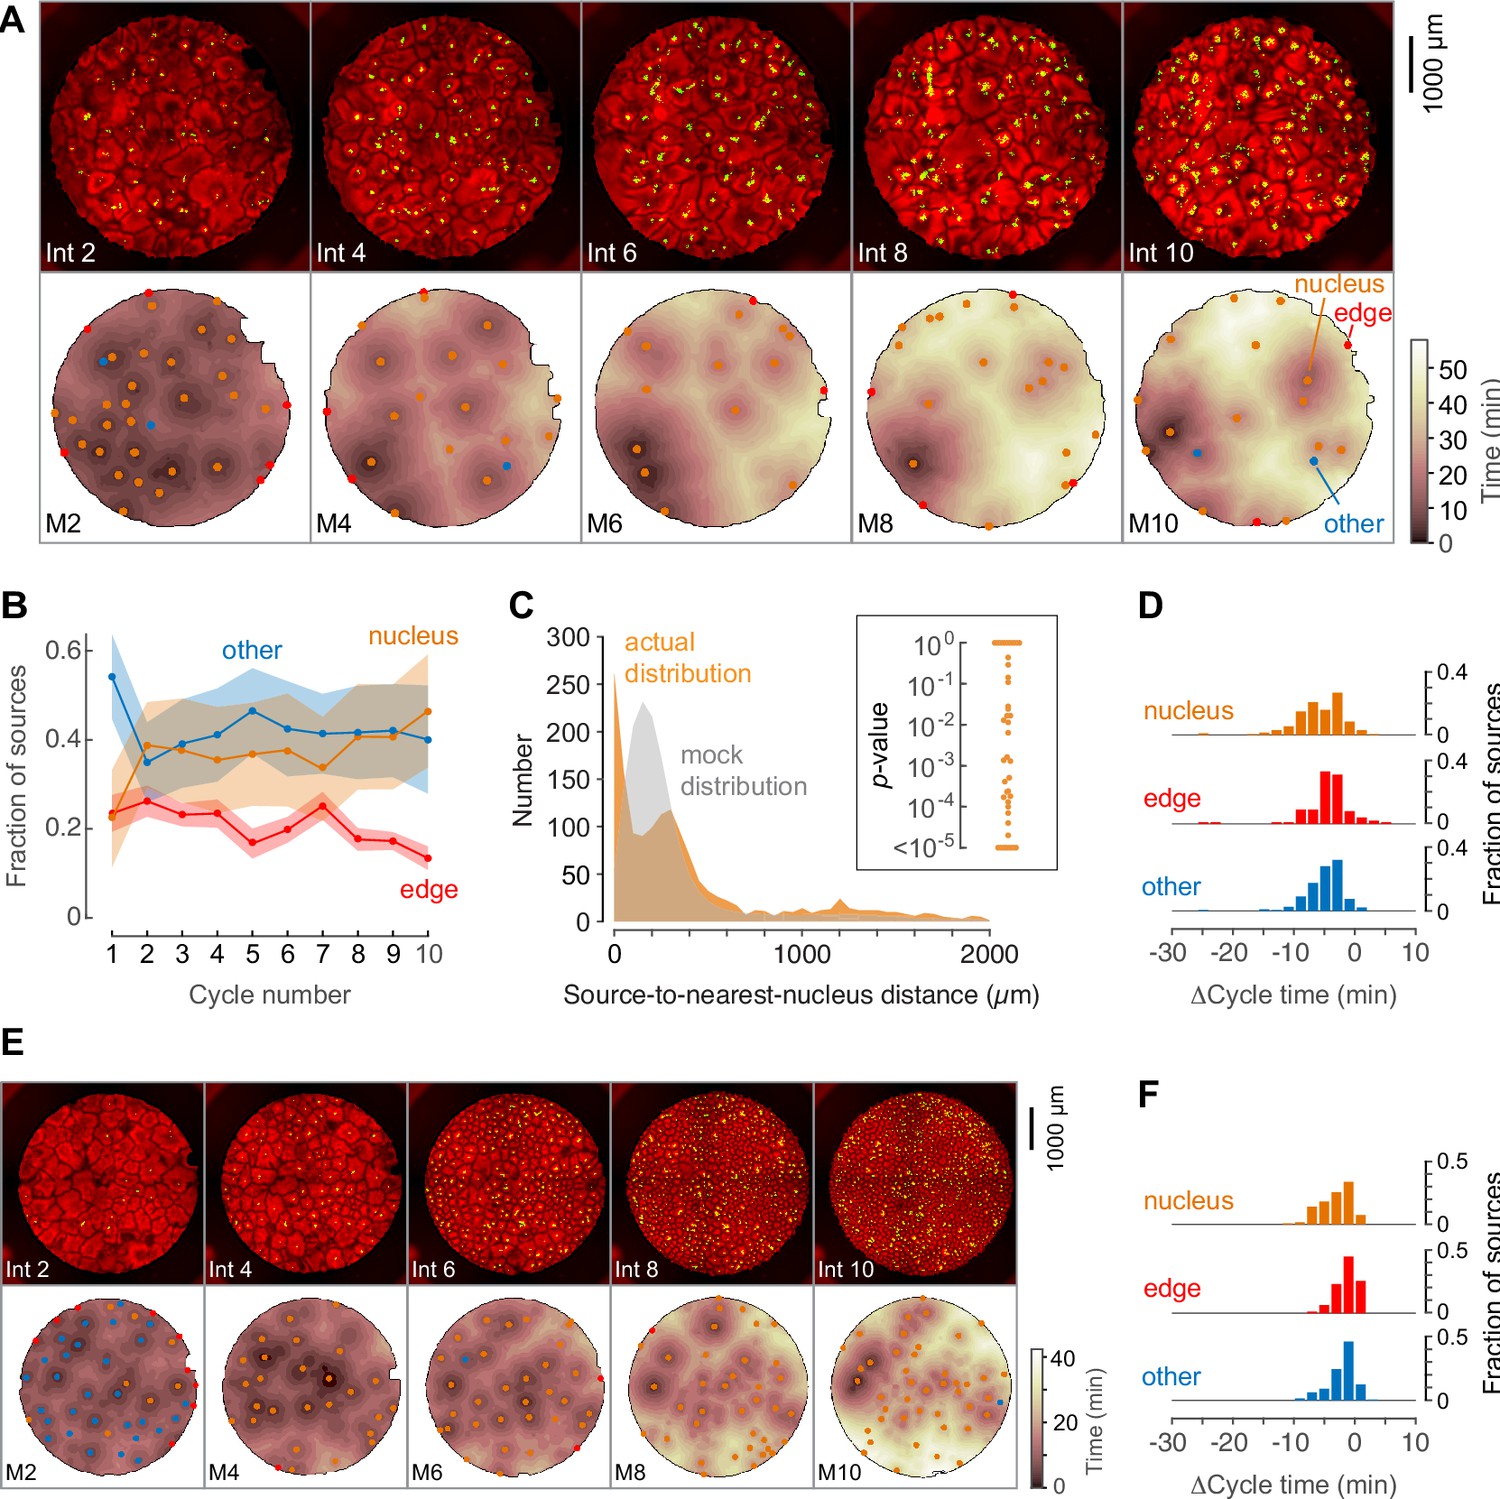
(A) Montage from a typical experiment showing the microtubules (top) and the heat map representation of the microtubule sources (bottom) for cycles 2, 4, 6, 8, and 10. Nucleus-associated sources are shown in orange; edge-associated sources are shown in red; and other sources—that is, those not associated with edges or nuclei—are shown in blue (other). The top panels show the extracts in interphase, with SiR-tubulin fluorescence in red and NLS-mCherry in green. The bottom panels are the heat maps of the mitotic sources. The coloring of the heat map denotes the time at which each pixel entered mitosis relative to the earliest pixels in that cycle. (B) Fraction of the mitotic sources associated with nuclei, edges, or no obvious structures as a function of cycle number. The data points are mean fractions from eight experiments where the extracts cycled at least 10 times, and the shaded regions show the means ± SEM. (C) The distance of the trigger wave sources to the nearest nucleus (orange), compared to a mock distribution (gray). Data are from 44 cell cycles from 11 experiments and include 419 sources. The inset shows probabilities (p-values) of obtaining the observed number of mitotic sources (or more than the observed number) that are close (<100 µm) to nuclei for the 44 cell cycles individually, calculated by bootstrapping with 105 randomized source positions for each individual cycle. (D) The duration of the cell cycle at nucleus-associated sources, edge sources, and other sources relative to the slowest 15% of the well. Data are from 15 experiments and include 205 nucleus-associated sources, 102 edge sources and 201 other sources. (E) Montage from an experiment with added phage DNA plus centrosomes. (F) The duration of the cell cycle at nucleus-associated sources, edge sources, and other sources relative to the slowest 15% of the well, for extracts with added phage DNA plus centrosomes. Data are from 12 experiments and include 123 nucleus-associated sources, 79 edge sources and 209 other sources.
Figure 5—video 1
Trigger waves of tubulin depolymerization and polymerization in a Xenopus extract supplemented with λ-bacteriophage DNA (5 µg/ml).
Related to Figure 5.
Figure 5—video 2
Trigger waves of tubulin depolymerization and polymerization in a Xenopus extract supplemented with purified HeLa cell centrosomes and λ-bacteriophage DNA (5 µg/ml).
Related to Figure 5.
Tables
Key resources table
| Reagent type (species) or resource | Designation | Source or reference | Identifiers | Additional information |
|---|---|---|---|---|
| Strain, strain background | Xenopus laevis | NASCO | LM00535MX | female |
| Cell line | HeLa centrin-GFP | Tsou and Stearns, 2006 | ||
| Peptide, recombinant protein | GST-NLS-mCherry | Chang and Ferrell, 2013 | ||
| Chemical compound, drug | SiR-tubulin | Spirochrome | CY-SC002 | |
| Chemical compound, drug | aphidicolin | Calbiochem | CAS 38966-21-1 | |
| Chemical compound, drug | λ-DNA | New England Biolabs | N3011S | |
| Software, algorithm | custom-made Matlab scripts | available at https://purl.stanford.edu/fm814ch0699 | ||
| Other | demembranated sperm | Murray, 1991 |
Additional files
Download links
A two-part list of links to download the article, or parts of the article, in various formats.
Downloads (link to download the article as PDF)
Open citations (links to open the citations from this article in various online reference manager services)
Cite this article (links to download the citations from this article in formats compatible with various reference manager tools)
The nucleus serves as the pacemaker for the cell cycle
eLife 9:e59989.
https://doi.org/10.7554/eLife.59989


