Telomerase biogenesis requires a novel Mex67 function and a cytoplasmic association with the Sm7 complex
- Department of Microbiology and Infectious Diseases, Faculty of Medicine and Health Sciences, Université de Sherbrooke, Canada
Figures
Figure 1
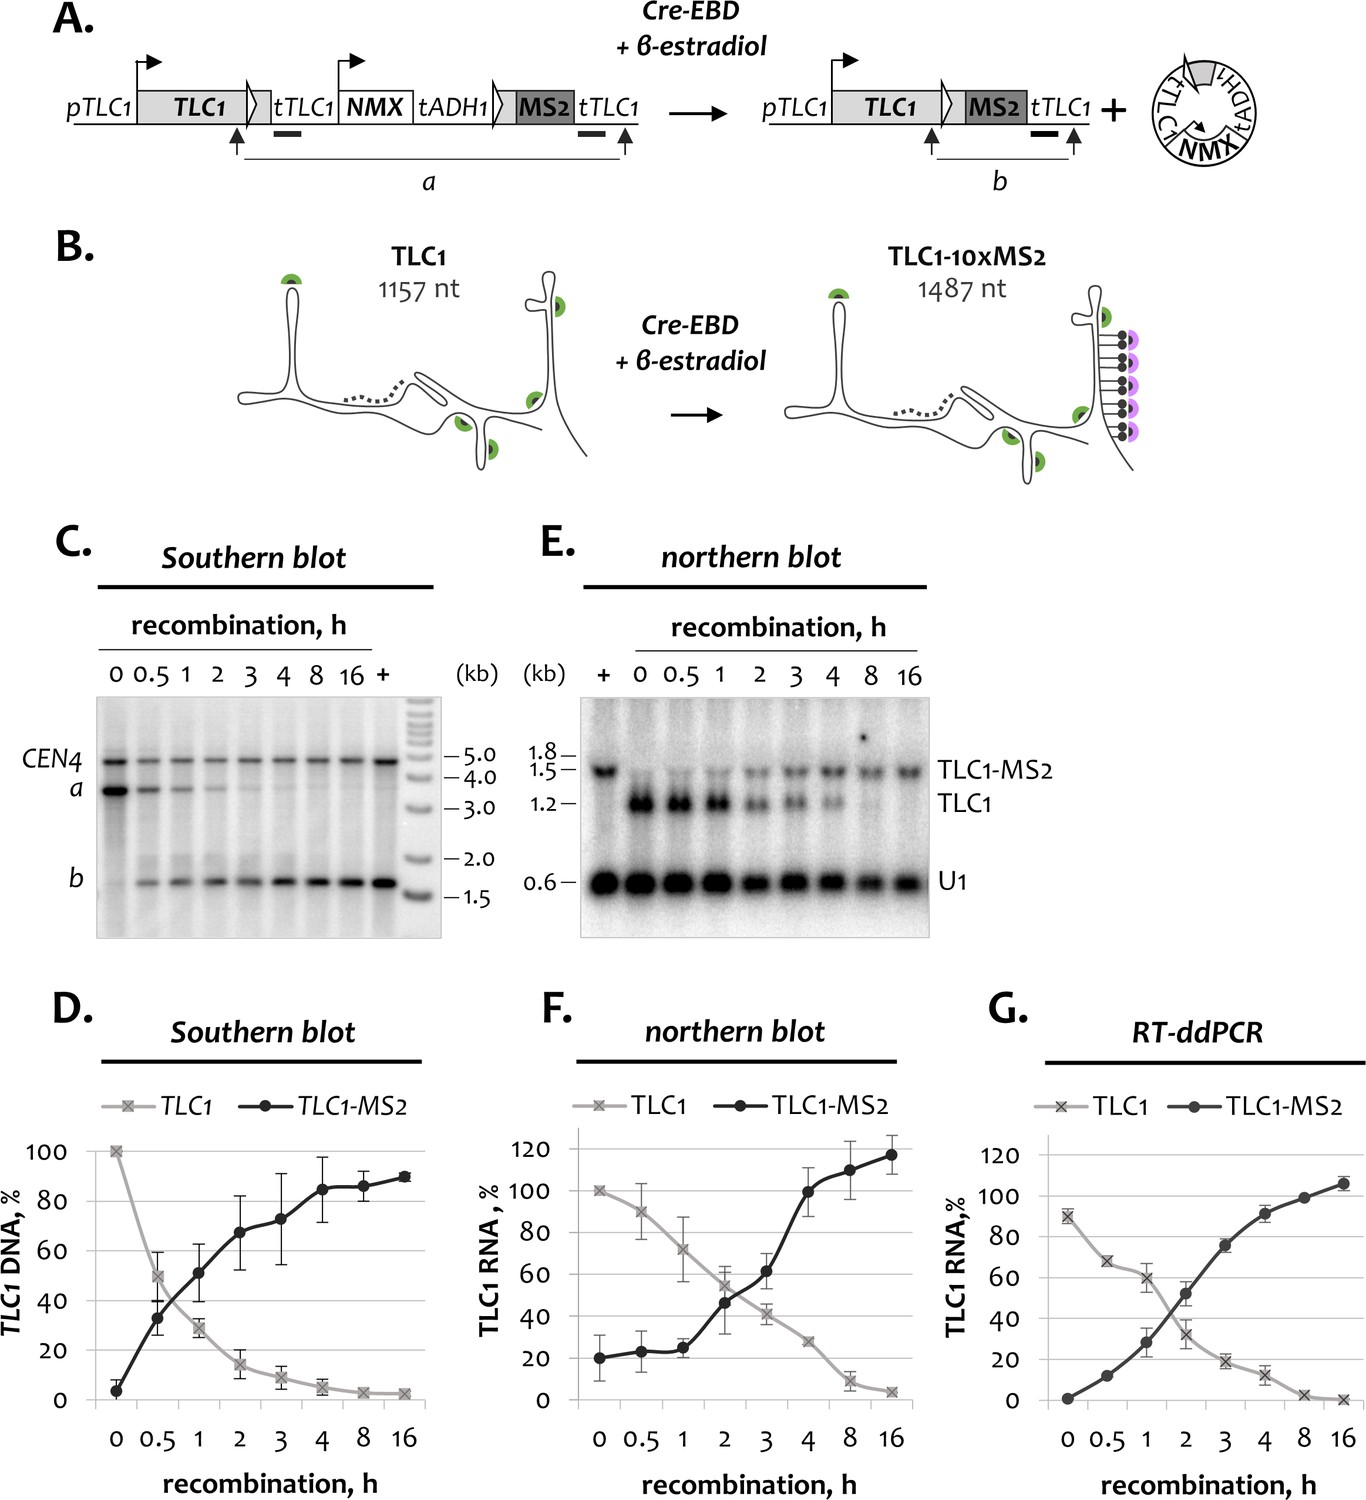
Kinetics of inducible TLC1-MS2 tagging.
(A) Schematic of the TLC1-[MS2-IN] DNA locus before and after recombination. Thick black bars indicate the TLC1 probe used for Southern blot analysis in C. Arrows mark restriction fragments (a and b) detected by the TLC1 probe. NMX – natMX4 cassette. (B) Schematic of tagged and untagged TLC1 RNA before and after recombination, respectively. Dotted line indicates the TLC1 probe used for northern blot analysis in E. Green and purple half-circles indicate TLC1- and MS2-specific smFISH probes, respectively. (C) Southern blot analysis of the TLC1-[MS2-IN] locus following induction of recombination. The position of the TLC1 probe hybridizing to restriction fragments a and b is depicted in A. CEN4 – loading control. ‘+’ - positive recombined control. DNA marker sizes are indicated on the right (kb). (D) Quantification of the Southern blot shown in C. Fractions relative to 0 hr (for unrecombined TLC1 locus) and to the positive recombined control (+) (for recombined TLC1-MS2 locus) are shown. Error bars indicate SD, n = 3. (E) Northern blot analysis of untagged TLC1 and tagged TLC1-MS2 RNA transcripts following induction of TLC1-[MS2-IN] recombination. Position of the TLC1 probe used to detect TLC1 species is shown in B. U1 – loading control. ‘+’ - positive recombined control. RNA sizes are indicated on the left (kb), 1.8 kb corresponds to 18S rRNA. (F). Quantification of the northern blot shown in E. Fractions relative to 0 hr (for untagged TLC1) and to the positive recombined control (+) (for tagged TLC1-MS2) are shown. Error bars indicate SD, n = 3. (G) RT-ddPCR quantification of untagged TLC1 and tagged TLC1-MS2 RNA transcripts following induction of recombination. Fractions relative to the positive recombined control are shown. Error bars indicate SD, n = 2.
-
Figure 1—source data 1
Numerical data used to generate Figure 1.
- https://cdn.elifesciences.org/articles/60000/elife-60000-fig1-data1-v2.xlsx
Figure 2 with 1 supplement
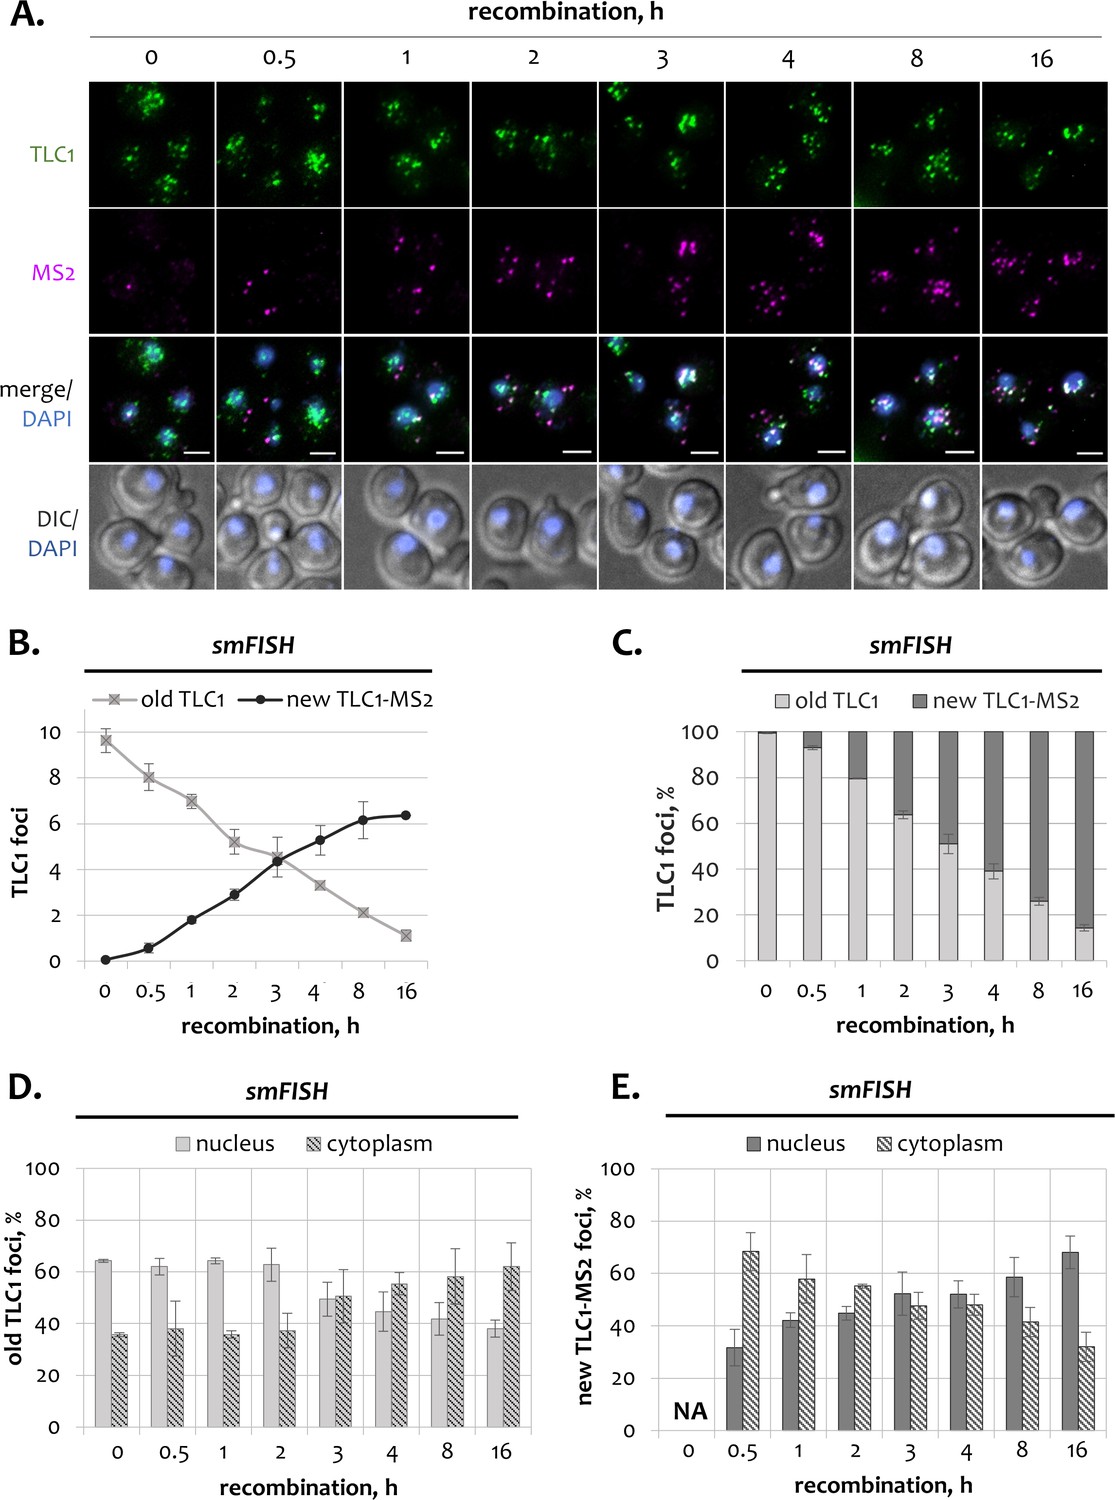
Subcellular distribution of telomerase RNA fractions in wild type cells.
(A) Two-color smFISH analysis of untagged old TLC1 (green) and tagged new TLC1-MS2 molecules (purple) in wild type cells following induction of recombination. TLC1-Cy3 and MS2-Cy5 probes were used. Scale bar, 2 μm. (B) Average number of old and new TLC1 foci observed by smFISH following recombination induction. 50–100 cells from three independent experiments were scored. Error bars indicate SD. (C) Relative fractions of old and new TLC1 foci observed by smFISH following recombination induction. 50–100 cells from three independent experiments were scored. Error bars indicate SD. (D, E). Relative nuclear and cytoplasmic fractions of old (D) and new (E) TLC1 foci observed by smFISH following recombination induction. NA – not applicable. 50–100 cells from three independent experiments were scored. Error bars indicate SD.
-
Figure 2—source data 1
Numerical data used to generate Figure 2.
- https://cdn.elifesciences.org/articles/60000/elife-60000-fig2-data1-v2.xlsx
Figure 2—figure supplement 1
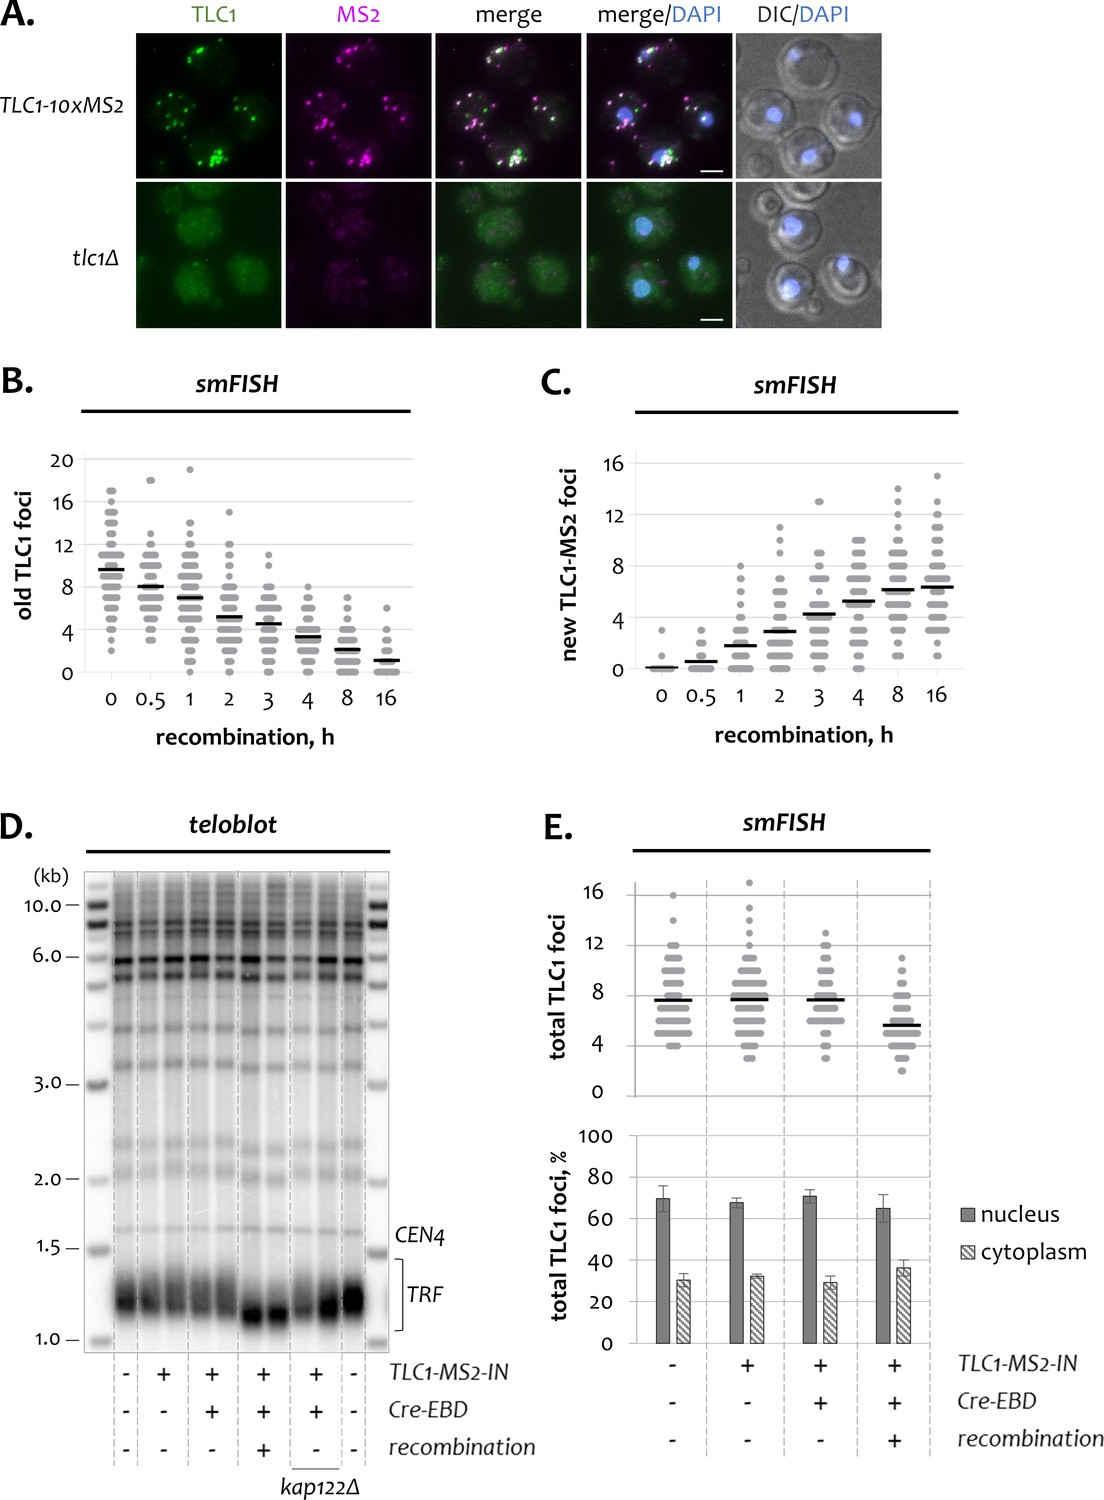
Additional characteristics of the TLC1-[MS2-IN] system.
(A) Two-color smFISH analysis of a recombined strain expressing TLC1-10xMS2 and a tlc1Δ negative control strain. TLC1-Cy3 and MS2-Cy5 probes were used. Scale bar, 2 μm. (B, C) The number of old (B) and new (C) TLC1 foci observed by smFISH in individual wild type cells after recombination induction. Horizontal black lines indicate average number of foci. 50–100 cells from three independent experiments were scored. (D) Telomere length analysis in strains with or without the TLC1-[MS2-IN] system. TRF – terminal restriction fragment, CEN4 – migration control. DNA marker sizes are indicated on the left (kb). (E) Total number of TLC1 foci (top) and relative nuclear and cytoplasmic TLC1 fractions (bottom) detected by smFISH in strains with or without TLC1-[MS2-IN]. Horizontal black lines (top) indicate average number of foci. 50–100 cells from three independent experiments were scored.
-
Figure 2—figure supplement 1—source data 1
Numerical data used to generate Figure 2—figure supplement 1.
- https://cdn.elifesciences.org/articles/60000/elife-60000-fig2-figsupp1-data1-v2.xlsx
Figure 3 with 1 supplement
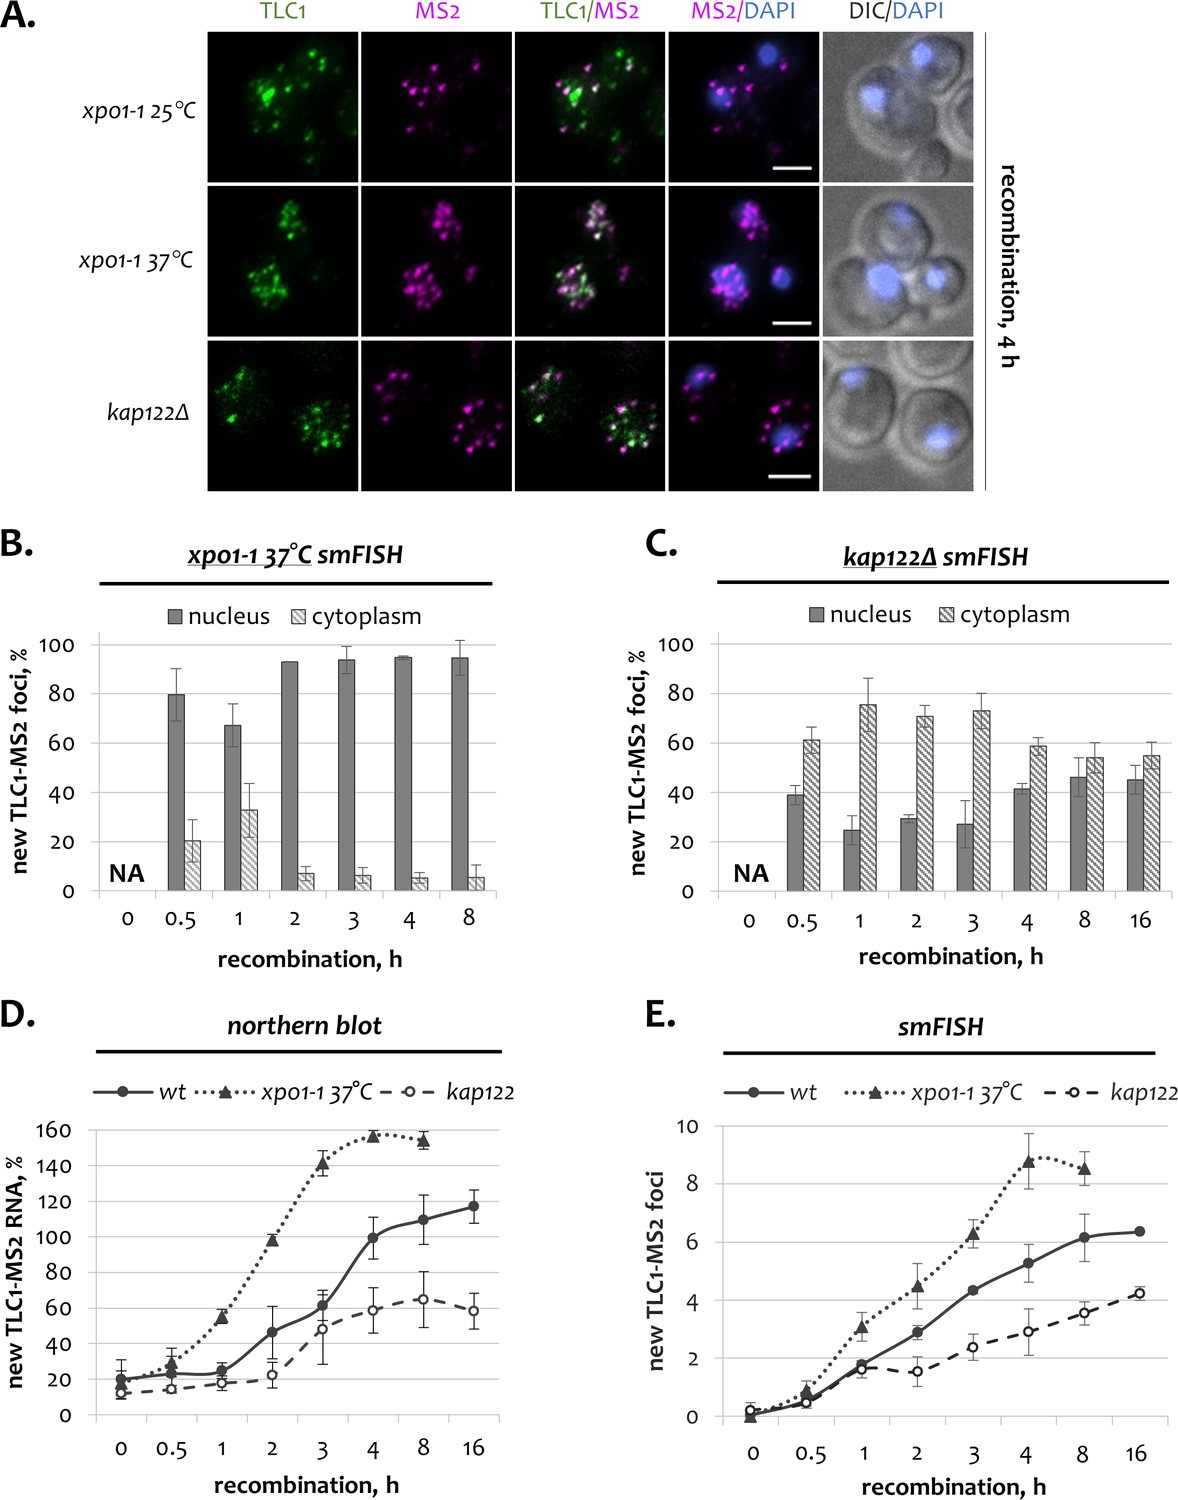
Dynamics of newly transcribed telomerase RNA in the absence of Xpo1 and Kap122.
(A) Two-color smFISH analysis of untagged TLC1 and tagged TLC1-MS2 molecules in xpo1-1 and kap122 mutants after 4 hr of recombination. TLC1-Cy3 and MS2-Cy5 probes were used. Scale bar, 2 μm. (B, C). Relative nuclear and cytoplasmic fractions of new TLC1 foci observed by smFISH following recombination induction in xpo1-1 (B) and kap122 (C) mutants. NA – not applicable. 50–100 cells from three independent experiments were scored. Error bars indicate SD. (D). Northern blot quantification of untagged TLC1 and tagged TLC1-MS2 RNA transcripts following recombination induction in wild type, xpo1-1 and kap122 cells. Fractions relative to the positive recombined control are shown. Error bars indicate SD, n = 3. (E) Average number of new TLC1 foci observed by FISH following recombination induction in wild type, xpo1-1 and kap122 cells. 50–100 cells from three independent experiments were scored. Error bars indicate SD.
-
Figure 3—source data 1
Numerical data used to generate Figure 3.
- https://cdn.elifesciences.org/articles/60000/elife-60000-fig3-data1-v2.xlsx
Figure 3—figure supplement 1
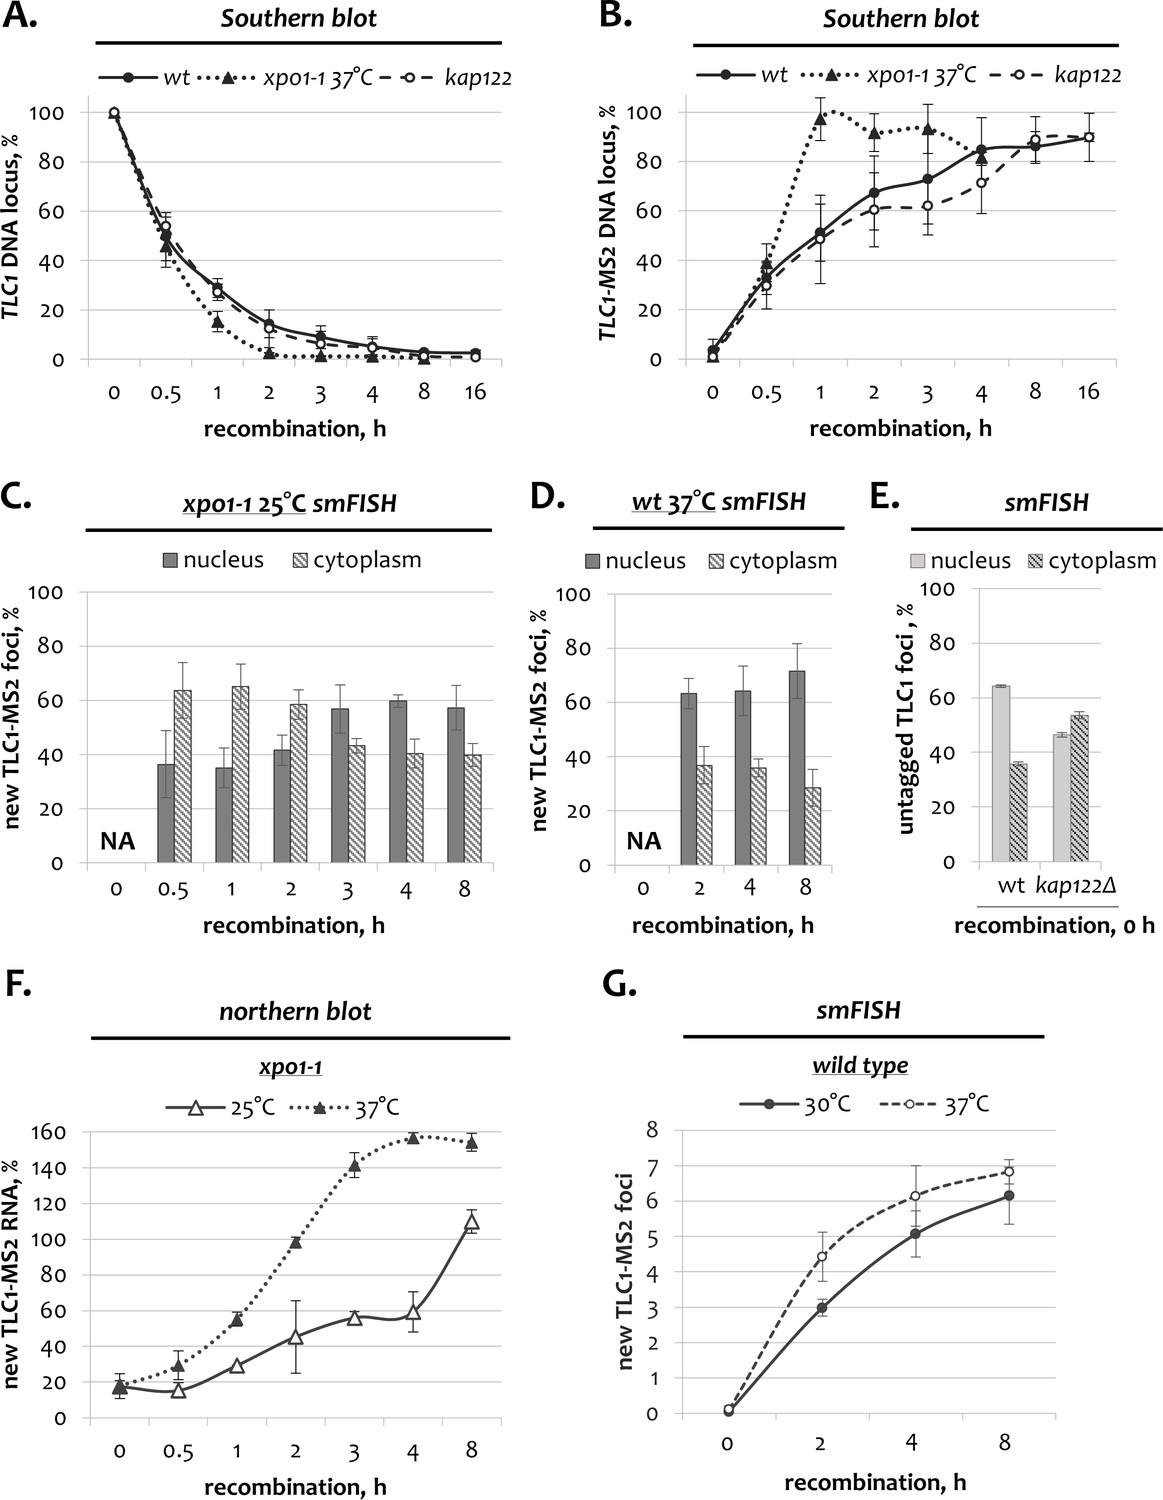
TLC1 dynamics in wild type, xpo1-1 and kap122 cells.
(A, B) Southern blot quantification of unrecombined TLC1 (A) and recombined TLC1-MS2 (B) genomic loci following induction of recombination in wild type, xpo1-1 and kap122 cells. Fractions relative to 0 hr (A, unrecombined TLC1 locus) and to the positive recombined control (+) (B, recombined TLC1-MS2 locus) are shown. Error bars indicate SD, n = 3. (C, D) Relative nuclear and cytoplasmic fractions of new TLC1 foci detected by smFISH after recombination induction in xpo1-1 mutants at the permissive temperature (C) and in wild type cells at the restrictive temperature (D). 50–100 cells from three independent experiments were scored. Error bars indicate SD. (E) Relative nuclear and cytoplasmic fractions of untagged TLC1 foci detected by smFISH before recombination induction (at the steady state) in wild type and kap122Δ cells. 50–100 cells from three independent experiments were scored. Error bars indicate SD. (F) Northern blot quantification of tagged TLC1-MS2 RNA transcripts following recombination induction in xpo1-1 cells grown at the permissive and restrictive temperatures. Fractions relative to the positive recombined control are shown. Error bars indicate SD, n = 3. (G) Average number of new TLC1-MS2 foci detected by smFISH after recombination induction in wild type cells grown at various temperatures. 50–100 cells from three independent experiments were scored. Error bars indicate SD.
-
Figure 3—figure supplement 1—source data 1
Numerical data used to generate Figure 3—figure supplement 1.
- https://cdn.elifesciences.org/articles/60000/elife-60000-fig3-figsupp1-data1-v2.xlsx
Figure 4 with 2 supplements
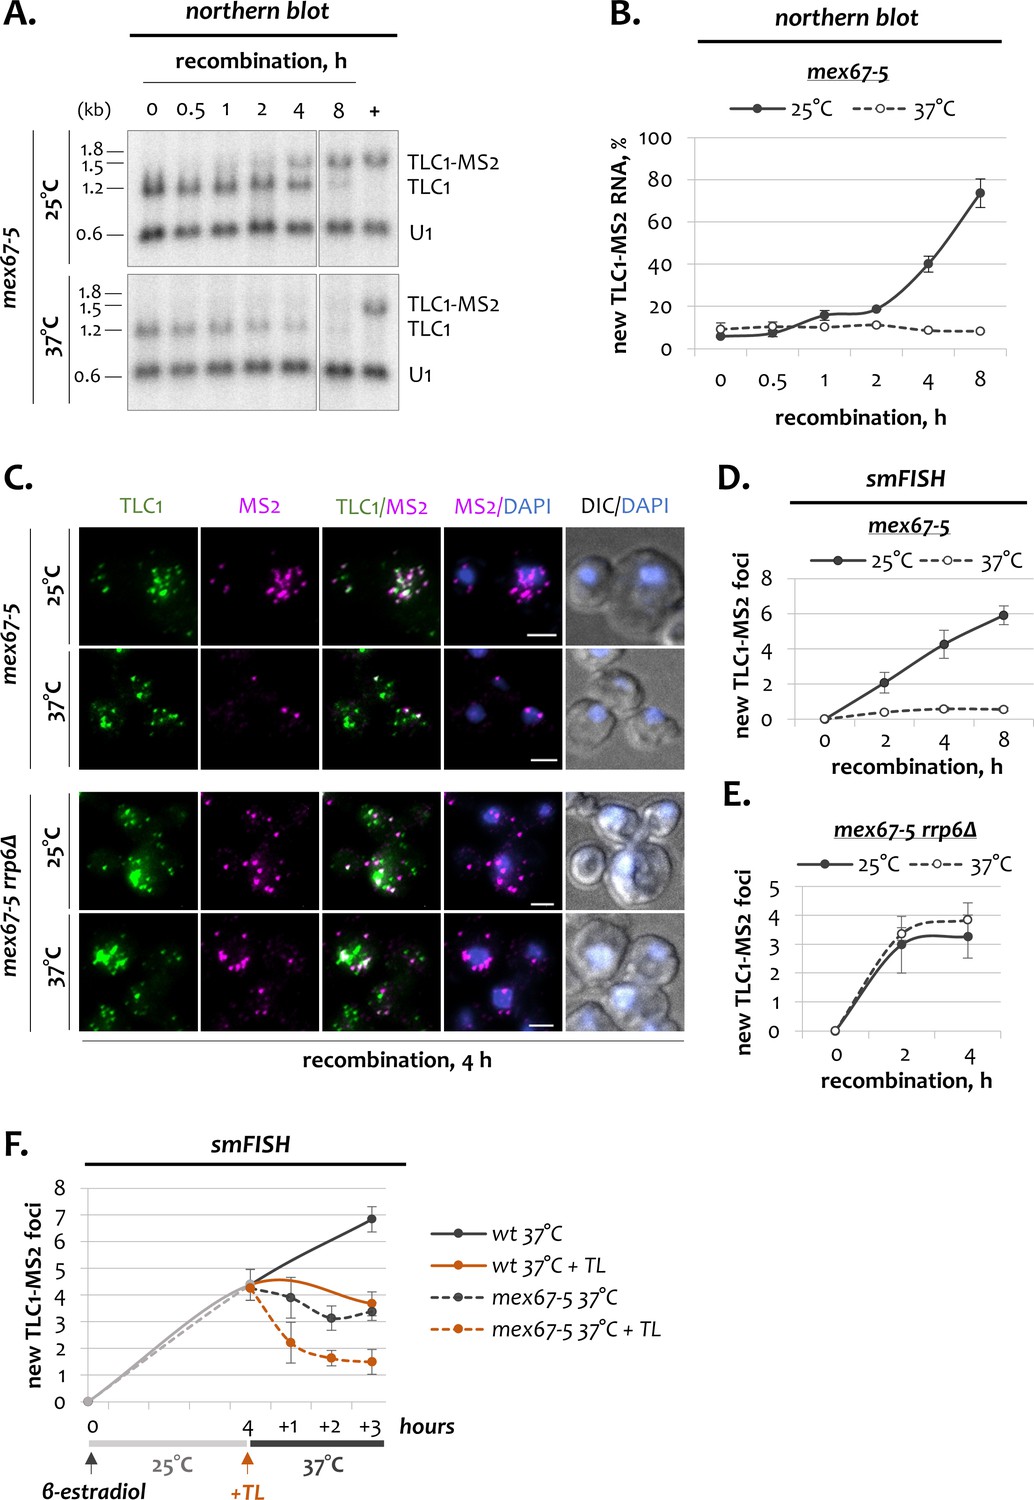
Dynamics of telomerase RNA fractions upon inactivation of Mex67.
(A) Northern blot analysis of untagged TLC1 and tagged TLC1-MS2 RNA transcripts following induction of recombination in mex67-5 cells grown at 25 and 37°C. Position of the TLC1 probe used to detect TLC1 species is shown in Figure 1B. U1 – loading control. ‘+’ - positive recombined control. RNA sizes are indicated on the left (kb), 1.8 kb corresponds to 18S rRNA. (B) Quantification of the northern blots shown in A. Fractions relative to the positive recombined control (+) are shown. Error bars indicate SD, n = 3. (C) Two-color smFISH analysis of untagged TLC1 and tagged TLC1-MS2 molecules in mex67-5 cells grown at 25 and 37°C after 4 hr of recombination. Scale bar, 2 μm. (D, E) Average number of new TLC1-MS2 foci detected by smFISH following recombination induction in mex67-5 (D) and mex67-5 rrp6Δ (E) cells grown at 25 and 37°C. 50–100 cells from three independent experiments were scored. Error bars indicate SD. (F). Average number of new TLC1-MS2 foci detected by smFISH in mex67-5 and wild type cells grown in the presence of thiolutin. After addition of β-estradiol, cells were grown for 4 hr at 25°C, followed by addition of thiolutin (TL) and temperature shift to 37°C. 50–100 cells from three (mex67-5) and two (wt) independent experiments were scored. Error bars indicate SD.
-
Figure 4—source data 1
Numerical data used to generate Figure 4.
- https://cdn.elifesciences.org/articles/60000/elife-60000-fig4-data1-v2.xlsx
Figure 4—figure supplement 1

TLC1 dynamics in mex67-5 cells.
(A) Southern blot analysis of the TLC1-[MS2-IN] locus following induction of recombination in mex67-5 cells grown at the permissive and restrictive temperatures. The position of the TLC1 probe hybridizing to restriction fragments a and b is depicted in Figure 1A. CEN4 – loading control. DNA marker sizes are indicated on the left (kb). (B) Northern blot quantification of old (untagged) TLC1 RNA following recombination induction in mex67-5 cells grown at the permissive and restrictive temperatures. Fractions relative to 0 hr are shown. Error bars indicate SD, n = 3. (C) Relative nuclear and cytoplasmic fractions of tagged TLC1-MS2 foci detected by smFISH after 4 hr of recombination in mex67-5 cells grown at 25 and 37°C. 50–100 cells from three independent experiments were scored. Error bars indicate SD. (D) Average number of new TLC1-MS2 foci detected by smFISH in wild type and mex67-5 cells. After addition of β-estradiol, cells were grown for 4 hr at 25°C, followed by temperature shift to 37°C. 50–100 cells from three (mex67-5) and two (wt) independent experiments were scored. Error bars indicate SD. (E) RNA Pol II ChIP (% of input) at the TLC1 locus normalized to the U1 locus in mex67-5 cells grown at 25 and 37°C. ‘+/-’ – with/without anti-RNA Pol II antibody. (F) Northern blot analysis of tagged TLC1-MS2 RNA transcripts following induction of recombination in mex67-5 rrp6Δ cells grown at 25 and 37°C. The blot was hybridized with the MS2-specific probe. U1 – loading control. ‘+’ - positive recombined control. RNA sizes are indicated on the left (kb), 1.8 kb corresponds to 18S rRNA. (G) Quantification of the northern blot shown in F. Fractions relative to the positive recombined control (+) are shown. Error bars indicate SD, n = 2. (H) Relative nuclear and cytoplasmic fractions of tagged TLC1-MS2 foci detected by smFISH after 4 hr of recombination in mex67-5 rrp6Δ cells grown at 25 and 37°C. 50–100 cells from three independent experiments were scored. Error bars indicate SD.
-
Figure 4—figure supplement 1—source data 1
Numerical data used to generate Figure 4—figure supplement 1.
- https://cdn.elifesciences.org/articles/60000/elife-60000-fig4-figsupp1-data1-v2.xlsx
Figure 4—figure supplement 2
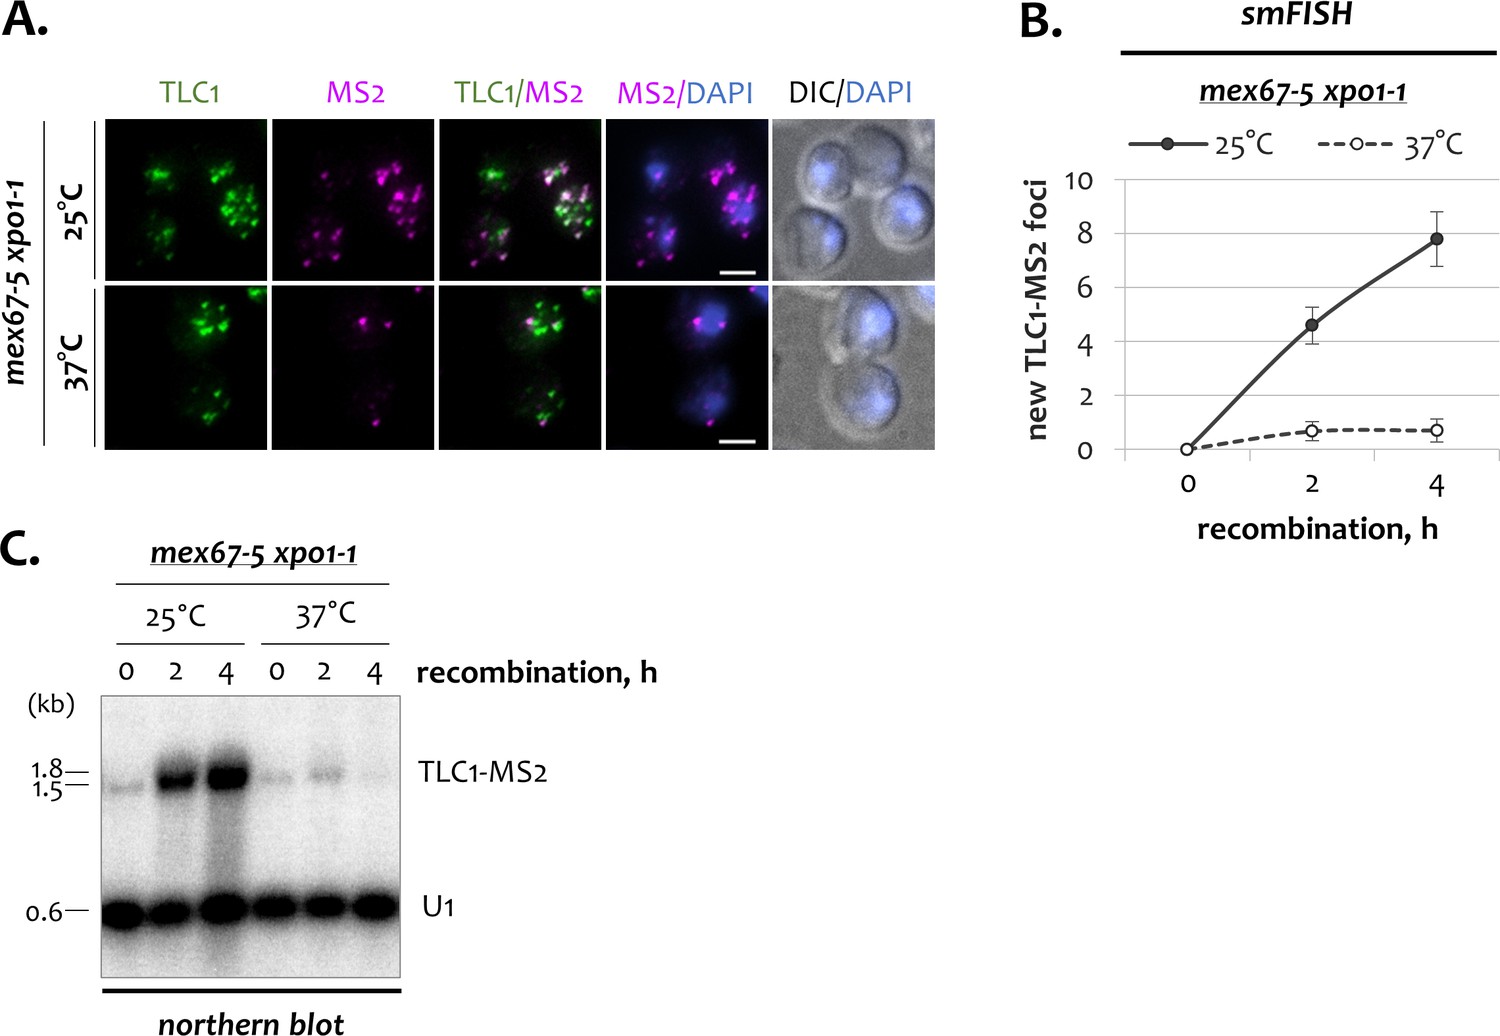
TLC1 dynamics in mex67-5 xpo1-1 cells.
(A) Two-color smFISH analysis of untagged TLC1 and tagged TLC1-MS2 molecules in cells with the double mex67-5 xpo1-1 mutations grown at 25 and 37°C after 4 hr of recombination. TLC1-Cy3 and MS2-Cy5 probes were used. Scale bar, 2 μm. (B) Average number of new TLC1-MS2 foci detected by smFISH following recombination induction in mex67-5 xpo1-1 cells grown at 25 and 37°C. 50–100 cells from three independent experiments were scored. Error bars indicate SD. (C) Northern blot analysis of tagged TLC1-MS2 RNA transcripts following induction of recombination in mex67-5 xpo1-1 cells grown at 25 and 37°C. The blot was hybridized with the MS2-specific probe. U1 – loading control. RNA sizes are indicated on the left (kb), 1.8 kb corresponds to 18S rRNA.
-
Figure 4—figure supplement 2—source data 1
Numerical data used to generate Figure 4—figure supplement 2.
- https://cdn.elifesciences.org/articles/60000/elife-60000-fig4-figsupp2-data1-v2.xlsx
Figure 5 with 1 supplement
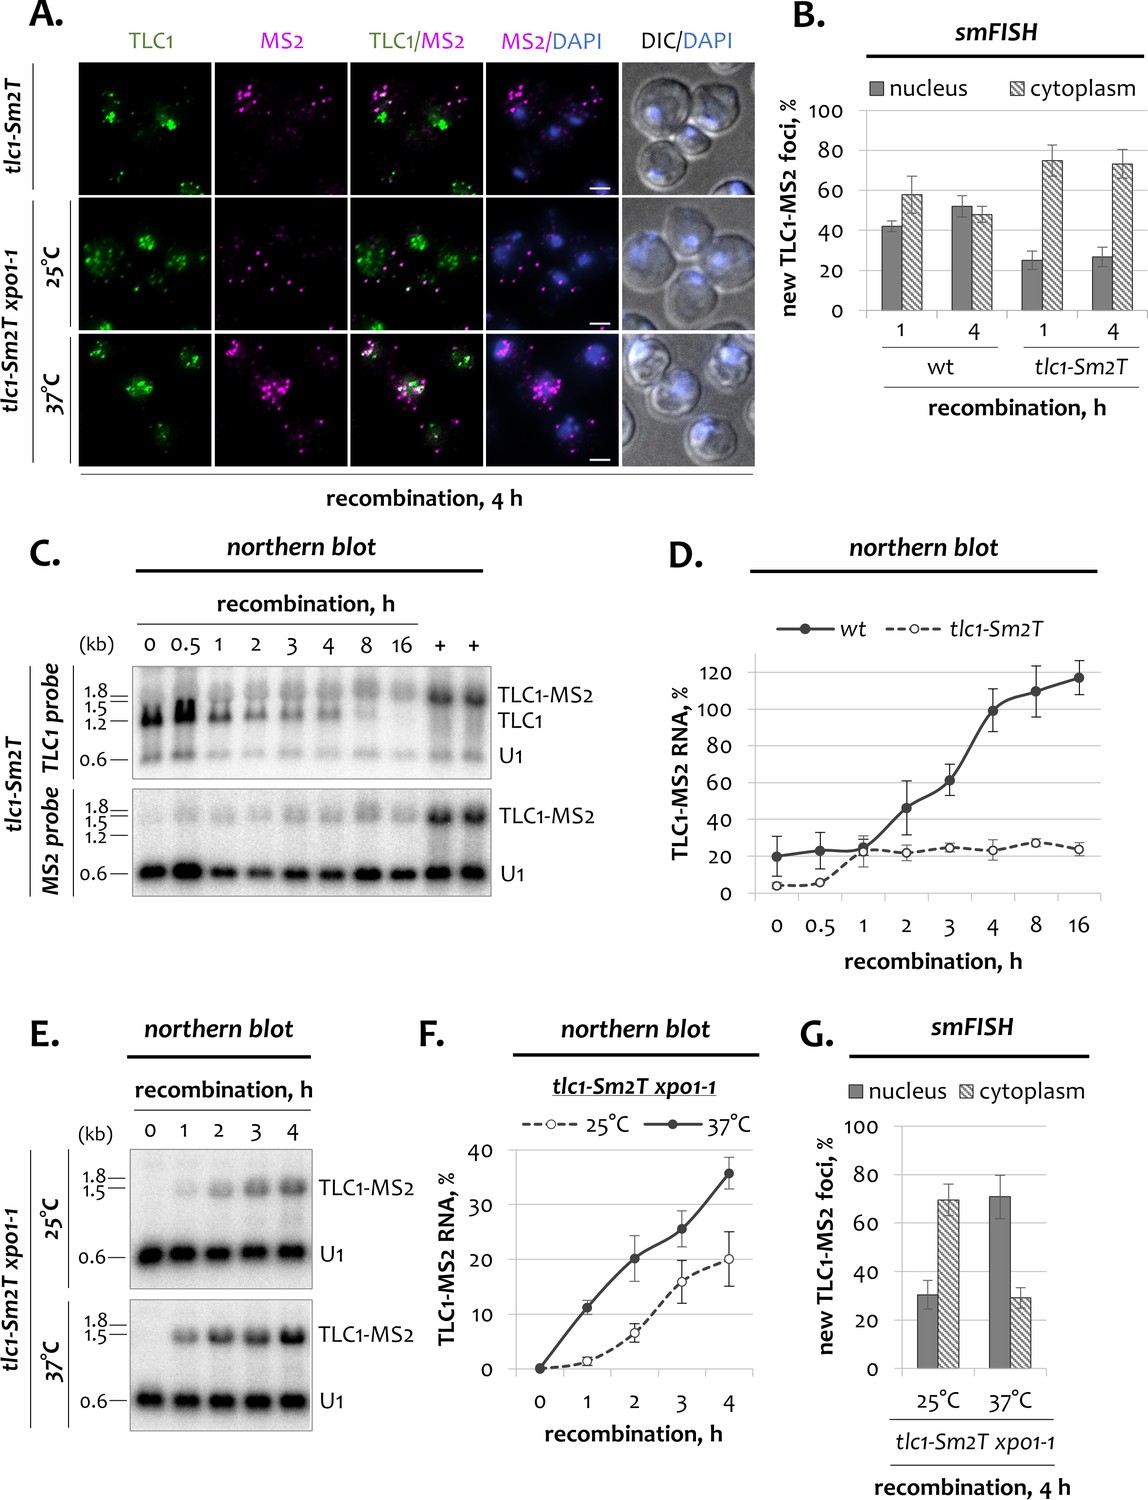
Dynamics of telomerase RNA fractions in tlc1-Sm2T mutants.
(A) Two-color smFISH analysis of untagged TLC1 and tagged TLC1-MS2 molecules in tlc1-Sm2T and tlc1-Sm2T xpo1-1 mutants after 4 hr of recombination. TLC1-Cy3 and MS2-Cy5 probes were used. Scale bar, 2 μm. (B) Relative nuclear and cytoplasmic fractions of tagged TLC1-MS2 foci detected by smFISH in wild type and tlc1-Sm2T cells after 1 hr and 4 hr of recombination. 50–100 cells from three independent experiments were scored. Error bars indicate SD. (C) Northern blot analysis of untagged TLC1 and tagged TLC1-MS2 RNA transcripts following induction of recombination in tlc1-Sm2T cells. The top blot was hybridized with the TLC1 probe depicted in Figure 1B. The bottom blot was hybridized with the MS2-specific probe. U1 – loading control. ‘+’ - positive recombined controls. RNA sizes are indicated on the left (kb), 1.8 kb corresponds to 18S rRNA. (D) Quantification of the tagged TLC1-MS2 RNA from the MS2-specific northern blot shown in C. Fractions relative to the positive recombined controls (+) are shown. Error bars indicate SD, n = 2. Quantification of the tagged TLC1-MS2 RNA in wild type cells from Figure 1E,F is shown as a reference. (E) Northern blot analysis of tagged TLC1-MS2 RNA transcripts following induction of recombination in tlc1-Sm2T xpo1-1 cells grown at 25 and 37°C. The blot was hybridized with the MS2-specific probe. U1 – loading control. RNA sizes are indicated on the left (kb), 1.8 kb corresponds to 18S rRNA. (F) Quantification of the northern blot shown in (E). Fractions relative to the positive recombined controls are shown. Error bars indicate SD, n = 2. (G) Relative nuclear and cytoplasmic fractions of tagged TLC1-MS2 foci detected by smFISH in tlc1-Sm2T xpo1-1 cells grown at 25 and 37°C after 4 hr of recombination. 50–100 cells from two independent experiments were scored. Error bars indicate SD.
-
Figure 5—source data 1
Numerical data used to generate Figure 5.
- https://cdn.elifesciences.org/articles/60000/elife-60000-fig5-data1-v2.xlsx
Figure 5—figure supplement 1
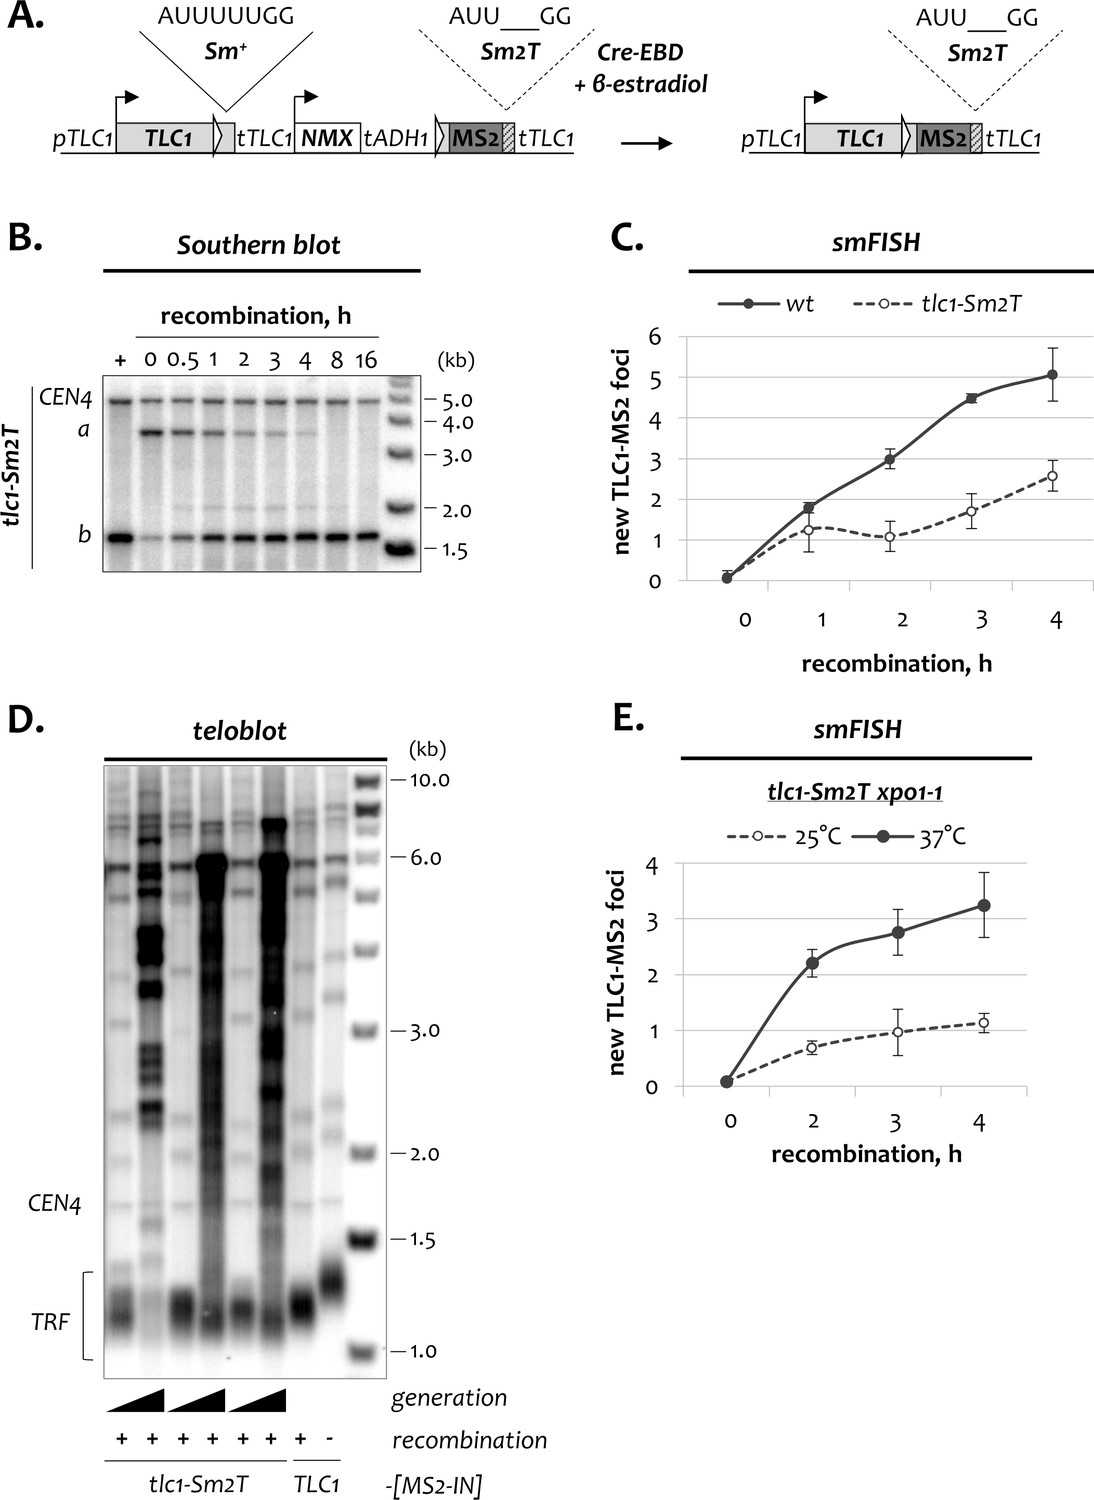
Dynamics of TLC1 fractions in tlc1-Sm2T and tlc1-Sm2T xpo1-1 cells.
(A) Schematic of the modified TLC1-[Sm2T-MS2-IN] DNA locus before and after recombination. Sequences indicate wild type (Sm+) and mutated (Sm2T) Sm7 binding sites in TLC1 RNA. (B) Southern blot analysis of the TLC1-[Sm2T-MS2-IN] locus following induction of recombination in tlc1-Sm2T cells. The position of the TLC1 probe hybridizing to restriction fragments a and b is depicted in Figure 1A. CEN4 – loading control. DNA marker sizes are indicated on the right (kb). (C) Average number of new TLC1-MS2 foci detected by smFISH in wild type and tlc1-Sm2T cells following induction of recombination. 50–100 cells from three independent experiments were scored. Error bars indicate SD. (D) Telomere length analysis in tlc1-Sm2T cells. TRF – terminal restriction fragment, CEN4 – migration control. Telomere length analysis was performed in recombined clones that were passaged for 20 and 120 generations. DNA marker sizes are indicated on the right (kb). (E) Average number of new TLC1-MS2 foci detected by smFISH in tlc1-Sm2T xpo1-1 cells grown at 25 and 37°C following induction of recombination.
-
Figure 5—figure supplement 1—source data 1
Numerical data used to generate Figure 5—figure supplement 1.
- https://cdn.elifesciences.org/articles/60000/elife-60000-fig5-figsupp1-data1-v2.xlsx
Figure 6
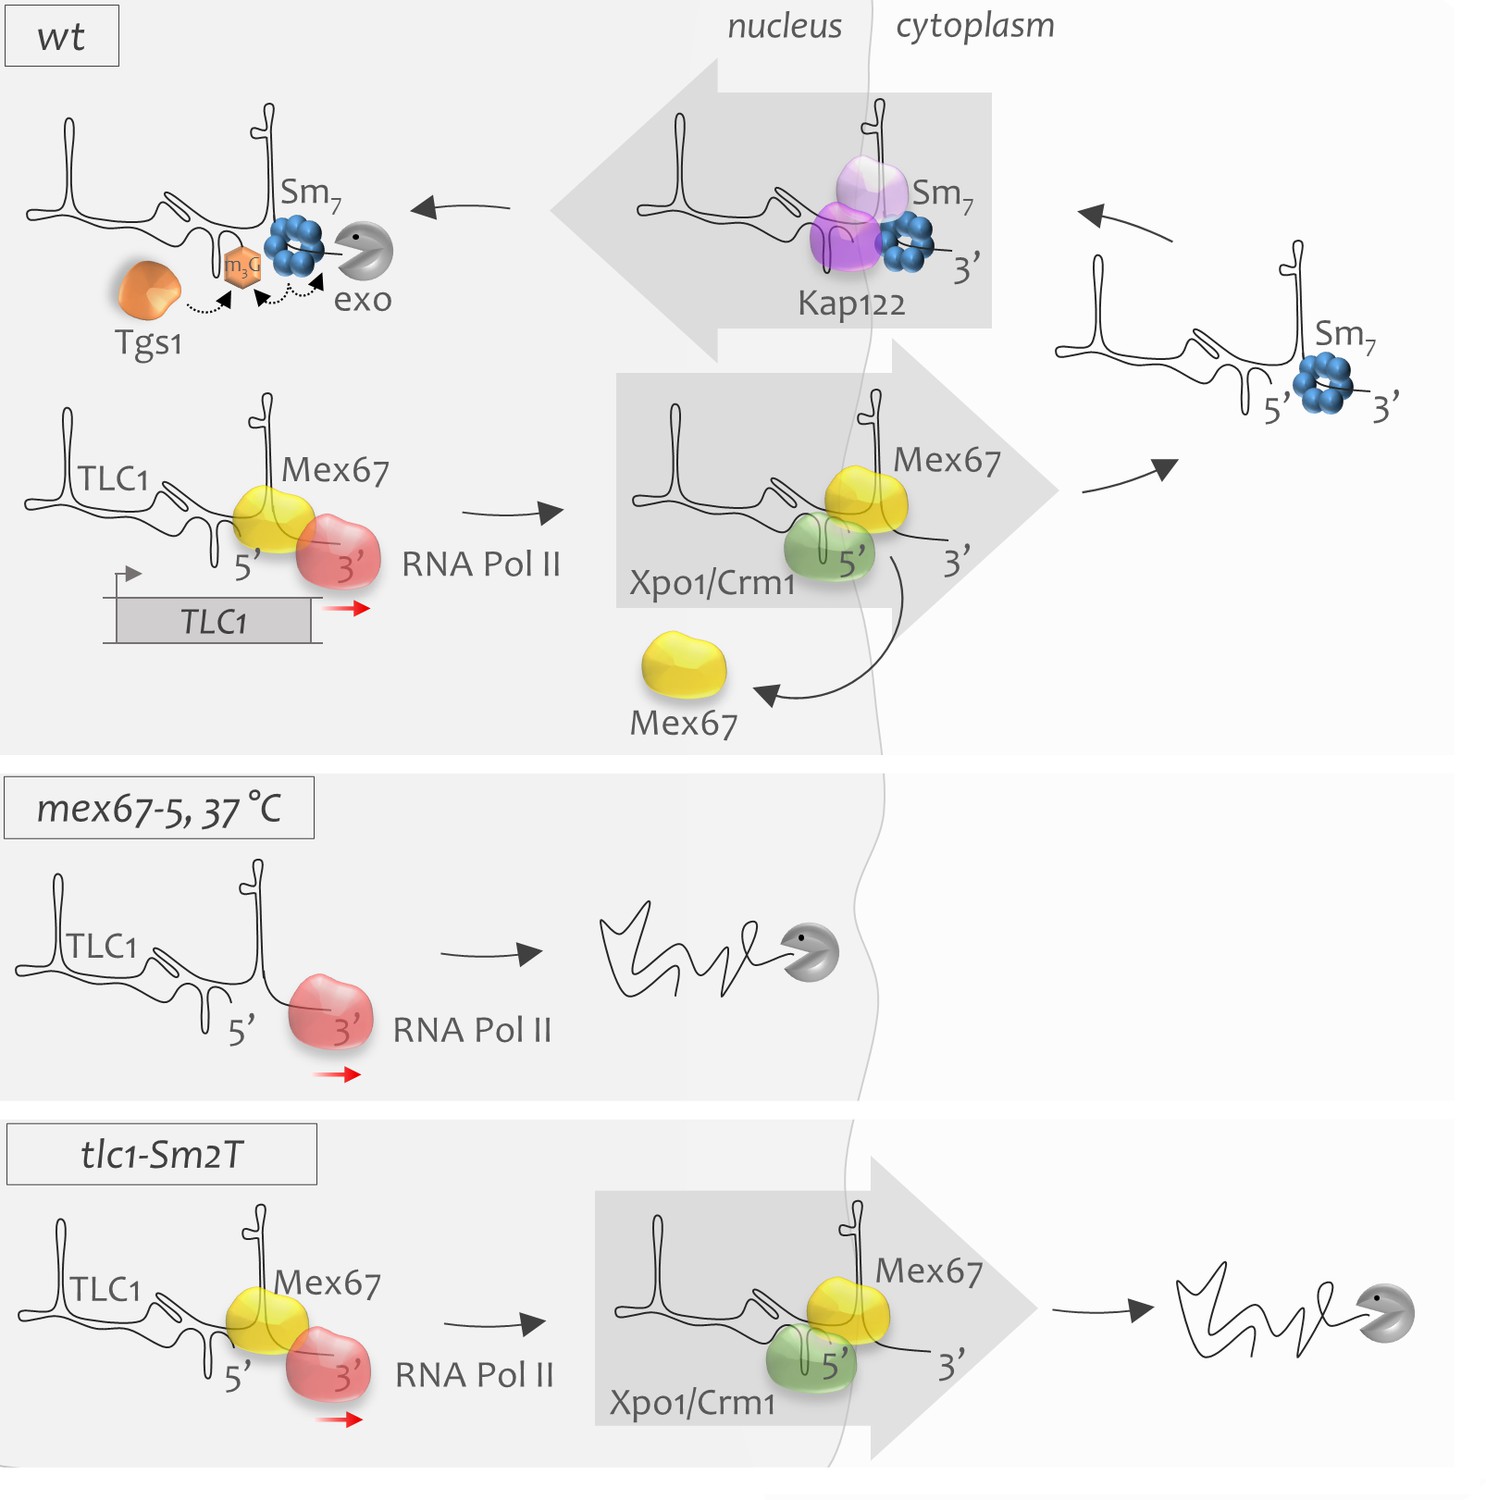
The model of early stages of telomerase RNA biogenesis.
WT: Telomerase RNA is transcribed by RNA polymerase II (red sphere). Mex67 possibly associates co-transcriptionally with telomerase RNA, ensures its stability and protects the RNA 3’-end. Mex67 might also deliver TLC1 to the nuclear pores where it may associate as an adaptor with the Xpo1 exportin. Xpo1 mediates cytoplasmic export of new telomerase RNA transcripts. Mex67 will disembark from TLC1 in the cytoplasm and is recycled back to the nucleus. During the cytoplasmic stage, the heptameric Sm7 complex binds the 3’-end of TLC1 which is required for stabilization of the RNA. Sm7 binding may also promote TLC1 re-import to the nucleus. Nuclear re-import of TLC1 is mediated by Kap122 and other importins. Upon re-entry to the nucleus, TLC1 undergoes Sm7-mediated 5’-TMG capping and 3’-end processing, which terminates the biogenesis cycle of telomerase RNA. mex67-5, 37°C: When Mex67 is dysfunctional, TLC1 is transcribed but is extremely unstable, which leads to rapid degradation of newly synthesized telomerase RNA transcripts in the nucleus. tlc1-Sm2T: Mutant TLC1 RNA that cannot associate with the Sm7 complex is stable in the nucleus. However, after export to the cytoplasm, it becomes unstable and undergoes quick degradation.
Tables
Key resources table
| Reagent type (species) or resource | Designation | Source or reference | Identifiers | Additional information |
|---|---|---|---|---|
| Strain, strain background (S. cerevisiae) | All strains (W303) | Supplementary file 1 | ||
| Gene (S. cerevisiae) | TLC1 | Saccharomyces Genome Database | TLC1; SGD:S000006657 | |
| Gene (S. cerevisiae) | tlc1-Sm2T | doi:10.1038/43694 | ||
| Gene (S. cerevisiae) | XPO1, CRM1 | Saccharomyces Genome Database | YGR218W; SGD:S000003450 | |
| Gene (S. cerevisiae) | xpo1-1 | gift from Pascal Chartrand doi:10.1016/s0092-8674(00)80370–0 | temperature-sensitive allele | |
| Gene (S. cerevisiae) | MEX67 | Saccharomyces Genome Database | YPL169C; SGD:S000006090 | |
| Gene (S. cerevisiae) | mex67-5 | gift from Marlene Oeffinger doi:10.1093/emboj/16.11.3256 doi:10.1038/nbt.1832 | temperature-sensitive allele | |
| Gene (S. cerevisiae) | KAP122 | Saccharomyces Genome Database | YGL016W; SGD:S000002984 | |
| Gene (S. cerevisiae) | RRP6 | Saccharomyces Genome Database | YOR001W; SGD:S000005527 | |
| Chemical compound, drug | β-estradiol | Sigma | Cat#: E8875 | Recombination induction, 12.5 μM final |
| Chemical compound, drug | ClonNAT, nourseothricin sulfate | BioShop | Cat#: NUR001 | Selection, 100 μg/ml final |
| Chemical compound, drug | Thiolutin | Abcam | Cat#: ab143556 | Transcription block, 3 μg/ml final |
| Chemical compound, drug | Para-formaldehyde solution, 32% | Electron Microscopy Sciences | Cat#: 15714 | FISH, 4% final |
| Chemical compound, drug | Ribonucleoside vanadyl complex, 200 mM | New England Biolabs | Cat#: S1402S | FISH, 20 mM final |
| Chemical compound, drug | Formamide | Sigma | Cat#: F9037 | FISH, 40% final |
| Chemical compound, drug | Salmon sperm DNA | Invitrogen | Cat#: 15632–011 | FISH, 0.4 mg/ml final |
| Chemical compound, drug | tRNA from E. coli | Roche | Cat#: 10109541001 | FISH, 0.4 mg/ml final |
| Chemical compound, drug | Poly-L-lysine, 0.01% | Sigma | Cat#: P4707 | |
| Chemical compound, drug | DAPI | Sigma | Cat#: D9542 | FISH, 0.5 µg/ml final |
| Chemical compound, drug | p-phenylenediamine | Sigma | Cat#: P6001 | |
| Commercial assay or kit | Cy3 Mono-Reactive dye | Cytiva | Cat#: PA23001 | |
| Commercial assay or kit | Cy5 Mono-Reactive dye | Cytiva | Cat#: PA25001 | |
| Commercial assay or kit | ThermoScientific Pierce Protein A/G Magnetic Beads | ThermoScientific | Cat#: 88802 | ChIP, 50 µl per sample |
| Antibody | Anti-RNA Polymerase II RPBI (mouse monoclonal antibody, clone 8WG16) | Cedarlane | Cat#: 664906 | ChIP (5 μl per sample) |
| Peptide, recombinant protein | XmnI (restriction enzyme) | New England Biolabs | Cat#: R0194L | |
| Peptide, recombinant protein | AleI-v2 (restriction enzyme) | New England Biolabs | Cat#: R0685L | |
| Peptide, recombinant protein | XhoI (restriction enzyme) | New England Biolabs | Cat#: R0146L | |
| Peptide, recombinant protein | Lyticase | Sigma | Cat#: L2524 | FISH, 5 U/ml final |
| Recombinant DNA reagent | All plasmids | Supplementary file 2 | ||
| Sequence-based reagent | All primers | Supplementary file 3 | ||
| Software, algorithm | SnapGene 2.1 | http://www.snapgene.com/ | RRID:SCR_015052 | |
| Software, algorithm | ImageQuant TL 8.2 (Cytiva) | https://www.cytivalifesciences.com/en/is/shop/protein-analysis/molecular-imaging-for-proteins/imaging-software/imagequant-tl-8-2-image-analysis-software-p-09518 | RRID:SCR_018374 | |
| Software, algorithm | GraphPad Prism 8 | http://www.graphpad.com/ | RRID:SCR_002798 | |
| Software, algorithm | ZEN 3.1 2019 (Zeiss) | https://www.zeiss.com/microscopy/int/products/microscope-software/zen.html | RRID:SCR_013672 |
Additional files
-
Supplementary file 1
Table of yeast strains used in the study.
The table includes the names, genotypes and sources of all yeast strains used in the study. The yeast strains are referred to in the text using the names provided in the table.
- https://cdn.elifesciences.org/articles/60000/elife-60000-supp1-v2.docx
-
Supplementary file 2
Table of plasmids used in the study.
The table includes the names, description and sources of all plasmids used in the study. The plasmids are referred to in the text using the names provided in the table.
- https://cdn.elifesciences.org/articles/60000/elife-60000-supp2-v2.docx
-
Supplementary file 3
Table of oligonucleotides used in the study.
The table includes the names, sequences and description of all oligonucleotides used in the study. The oligonucleotides are grouped in the table based on their application. The oligonucleotides are referred to in the text using the names provided in the table.
- https://cdn.elifesciences.org/articles/60000/elife-60000-supp3-v2.docx
-
Transparent reporting form
- https://cdn.elifesciences.org/articles/60000/elife-60000-transrepform-v2.docx
Download links
A two-part list of links to download the article, or parts of the article, in various formats.
Downloads (link to download the article as PDF)
Open citations (links to open the citations from this article in various online reference manager services)
Cite this article (links to download the citations from this article in formats compatible with various reference manager tools)
Telomerase biogenesis requires a novel Mex67 function and a cytoplasmic association with the Sm7 complex
eLife 9:e60000.
https://doi.org/10.7554/eLife.60000


