Elongation inhibitors do not prevent the release of puromycylated nascent polypeptide chains from ribosomes
- Department of Systems Biology, Columbia University Irving Medical Center, United States
- Medical Scientist Training Program, Columbia University Irving Medical Center, United States
- Department of Chemistry, Columbia University, United States
- Department of Biochemistry & Molecular Biophysics, Columbia University Irving Medical Center, United States
- Sulzberger Columbia Genome Center, Columbia University Irving Medical Center, United States
Figures
Figure 1 with 2 supplements
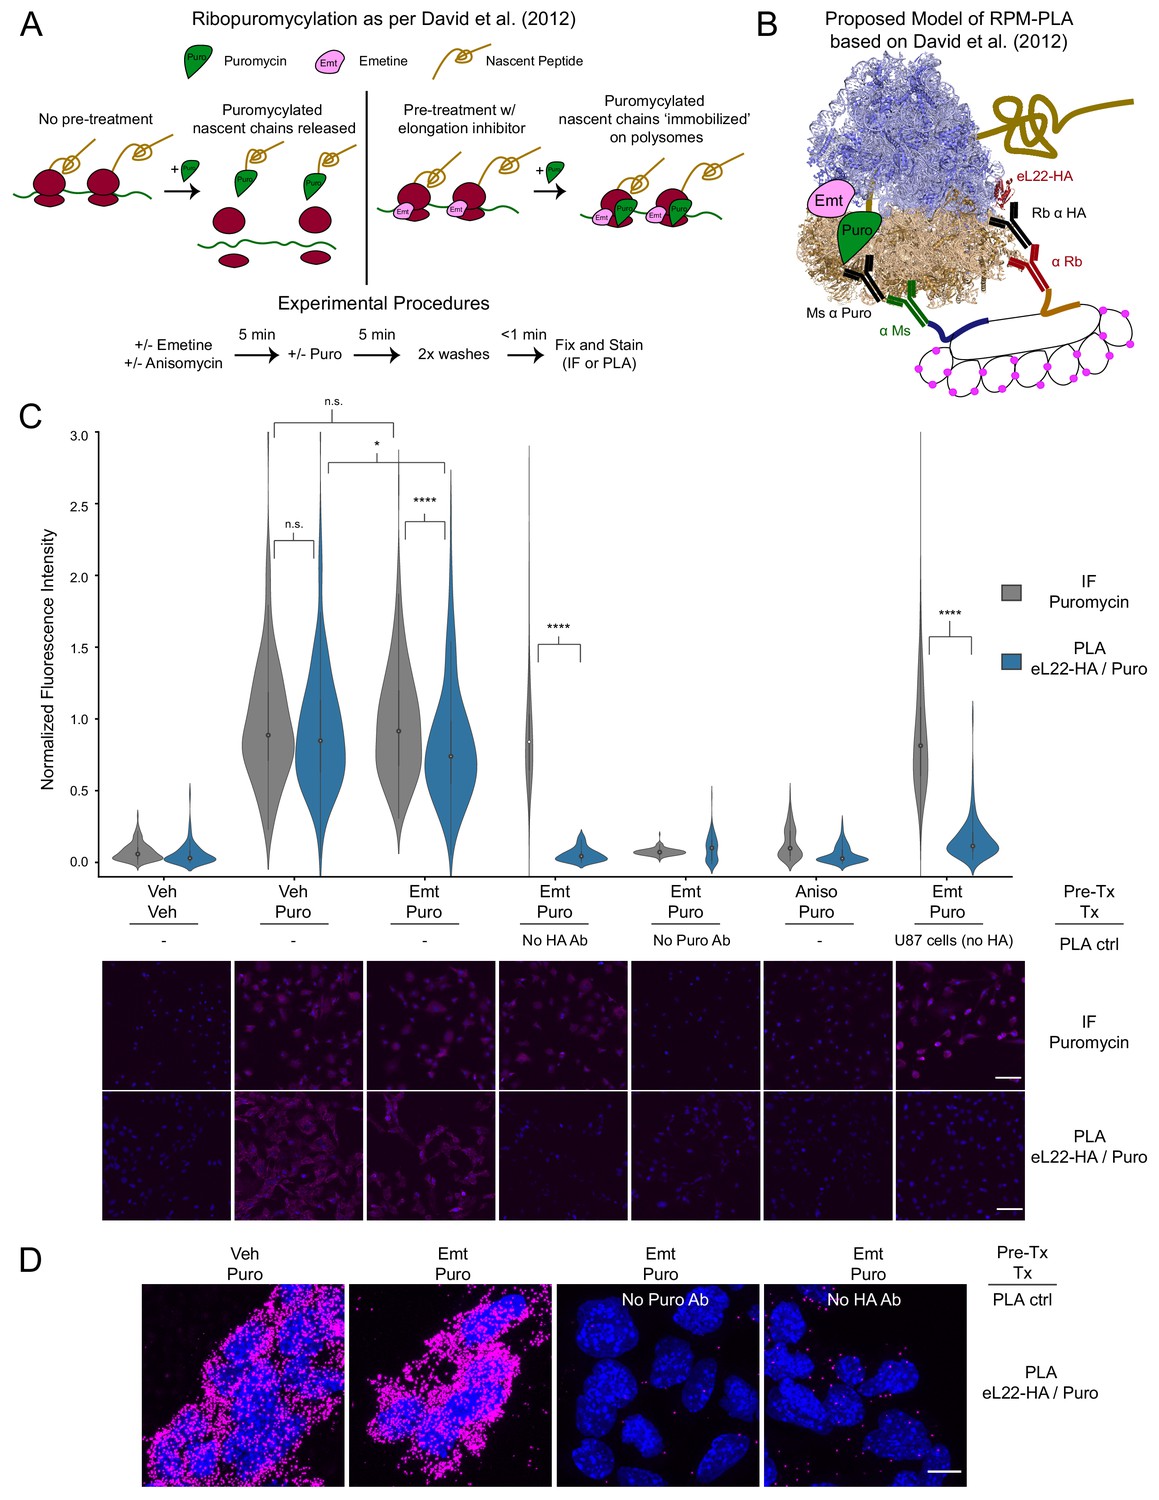
PLA targeting eL22-HA and puromycylated nascent chains produces translation- and antigen-dependent signal, but does not distinguish between emetine-stalled and untreated ribosomes.
(A) Schematic depicting the ribopuromycylation assay as described by David et al., 2012. Experimental procedures used in these studies are shown below. (B) Schematic depicting our intended model of combining ribopuromycylation with proximity ligation assay to enable cell type-specific visualization of translation, based on David et al., 2012. (C) Violin plots of normalized fluorescence intensity for puromycin IF or eL22-HA/Puro PLA signal in RiboTag glioma cells treated as indicated. Exceptions are noted below the plots for omission of primary antibodies or use of U87 glioma cells (lacking eL22-HA expression). Data are derived from 3 to 4 experiments and 112–288 cells per condition, and statistical comparisons indicated were conducted using Mann-Whitney U test. See Figure 1—source data 1 for details. * indicates p<0.05, **** indicates p<1e-4. Representative images (10x) are shown below; DAPI in blue, puromycin IF or eL22-HA/Puro PLA in magenta. Scale bar, 50 µm. (D) Representative confocal images (60x; Z-stack maximum projection) of eL22-HA/Puro PLA fluorescence for RiboTag glioma cells treated as indicated. Scale bar, 10 µm.
-
Figure 1—source data 1
Statistical information pertaining to Figure 1C and Figure 1—figure supplement 2C.
Summary of replicates, cells, and statistical testing (Mann-Whitney U) for indicated treatment groups.
- https://cdn.elifesciences.org/articles/60048/elife-60048-fig1-data1-v2.docx
-
Figure 1—source data 2
Raw source data for Figure 1C.
- https://cdn.elifesciences.org/articles/60048/elife-60048-fig1-data2-v2.xlsx
Figure 1—figure supplement 1
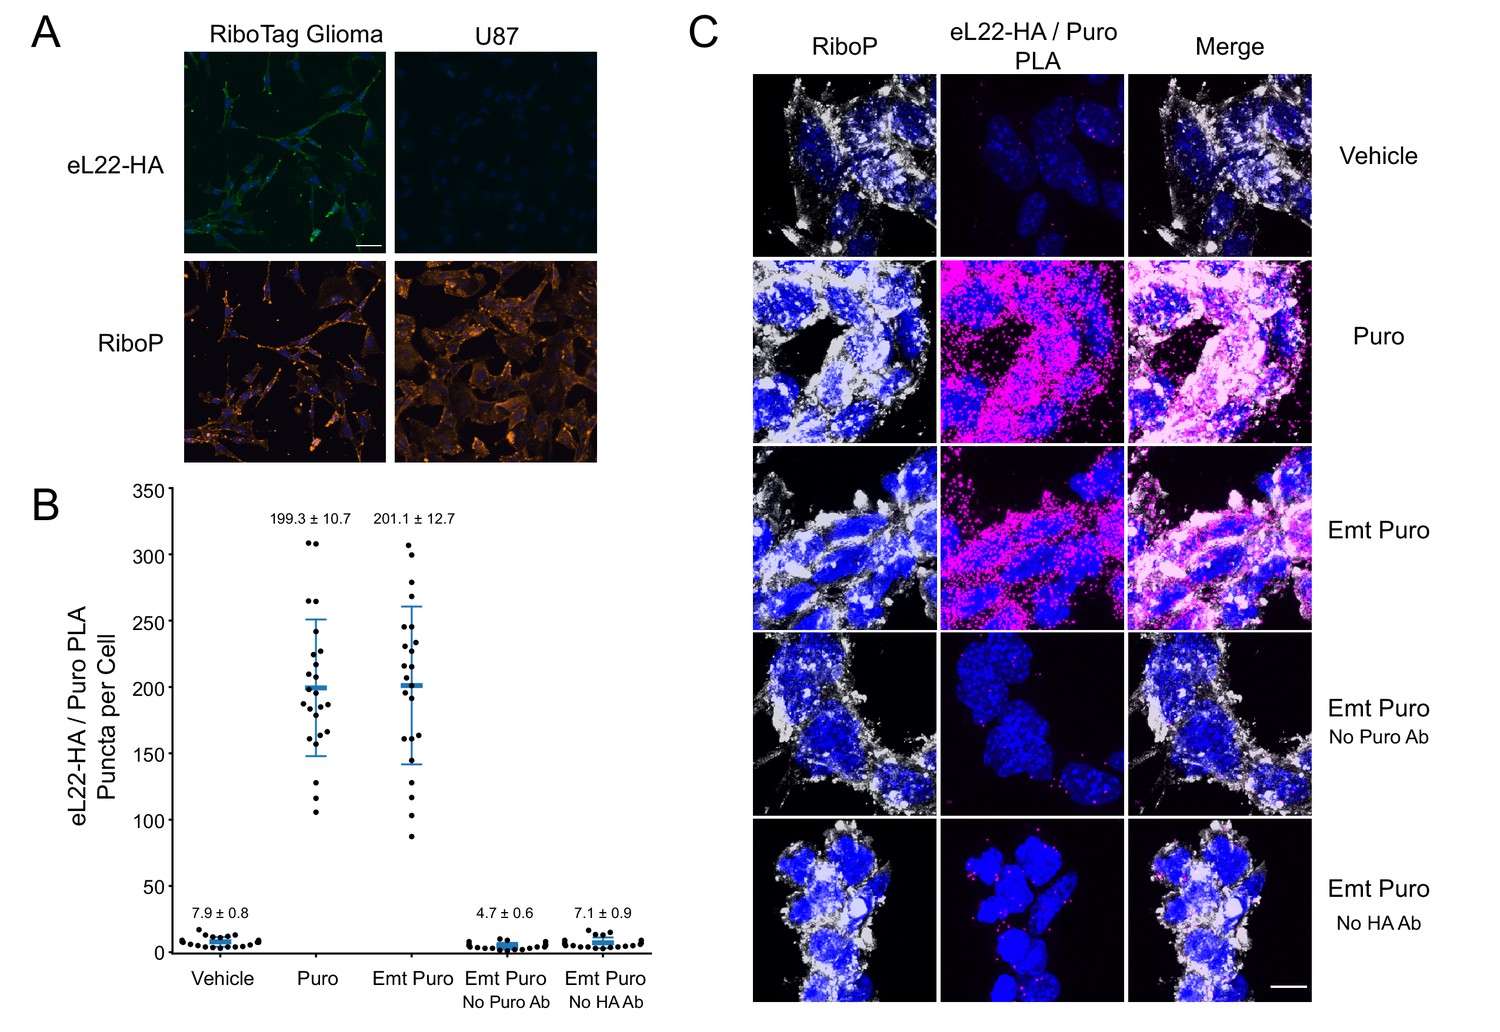
U87 glioma cells do not express eL22-HA, and eL22-HA/Puro PLA does not distinguish between emetine-treated and untreated cells at high resolution.
(A) Representative images (20x) of eL22-HA and RiboP immunofluorescence in RiboTag and U87 glioma cells. Scale bar, 50 µm. (B) Quantification of eL22-HA/Puro PLA puncta per cell. Each dot represents a cell; n = 20–24 cells per condition from 2 to 4 separate coverslips. Blue bars represent mean and standard deviation, with mean ± SEM indicated above. (C) Representative confocal images (60x) of eL22-HA/Puro PLA and RiboP immunofluorescence. DAPI in blue, RiboP in white, eL22-HA/Puro PLA in magenta. Scale bar, 10 µm.
-
Figure 1—figure supplement 1—source data 1
Raw source data for Figure 1—figure supplement 1B.
- https://cdn.elifesciences.org/articles/60048/elife-60048-fig1-figsupp1-data1-v2.xlsx
Figure 1—figure supplement 2
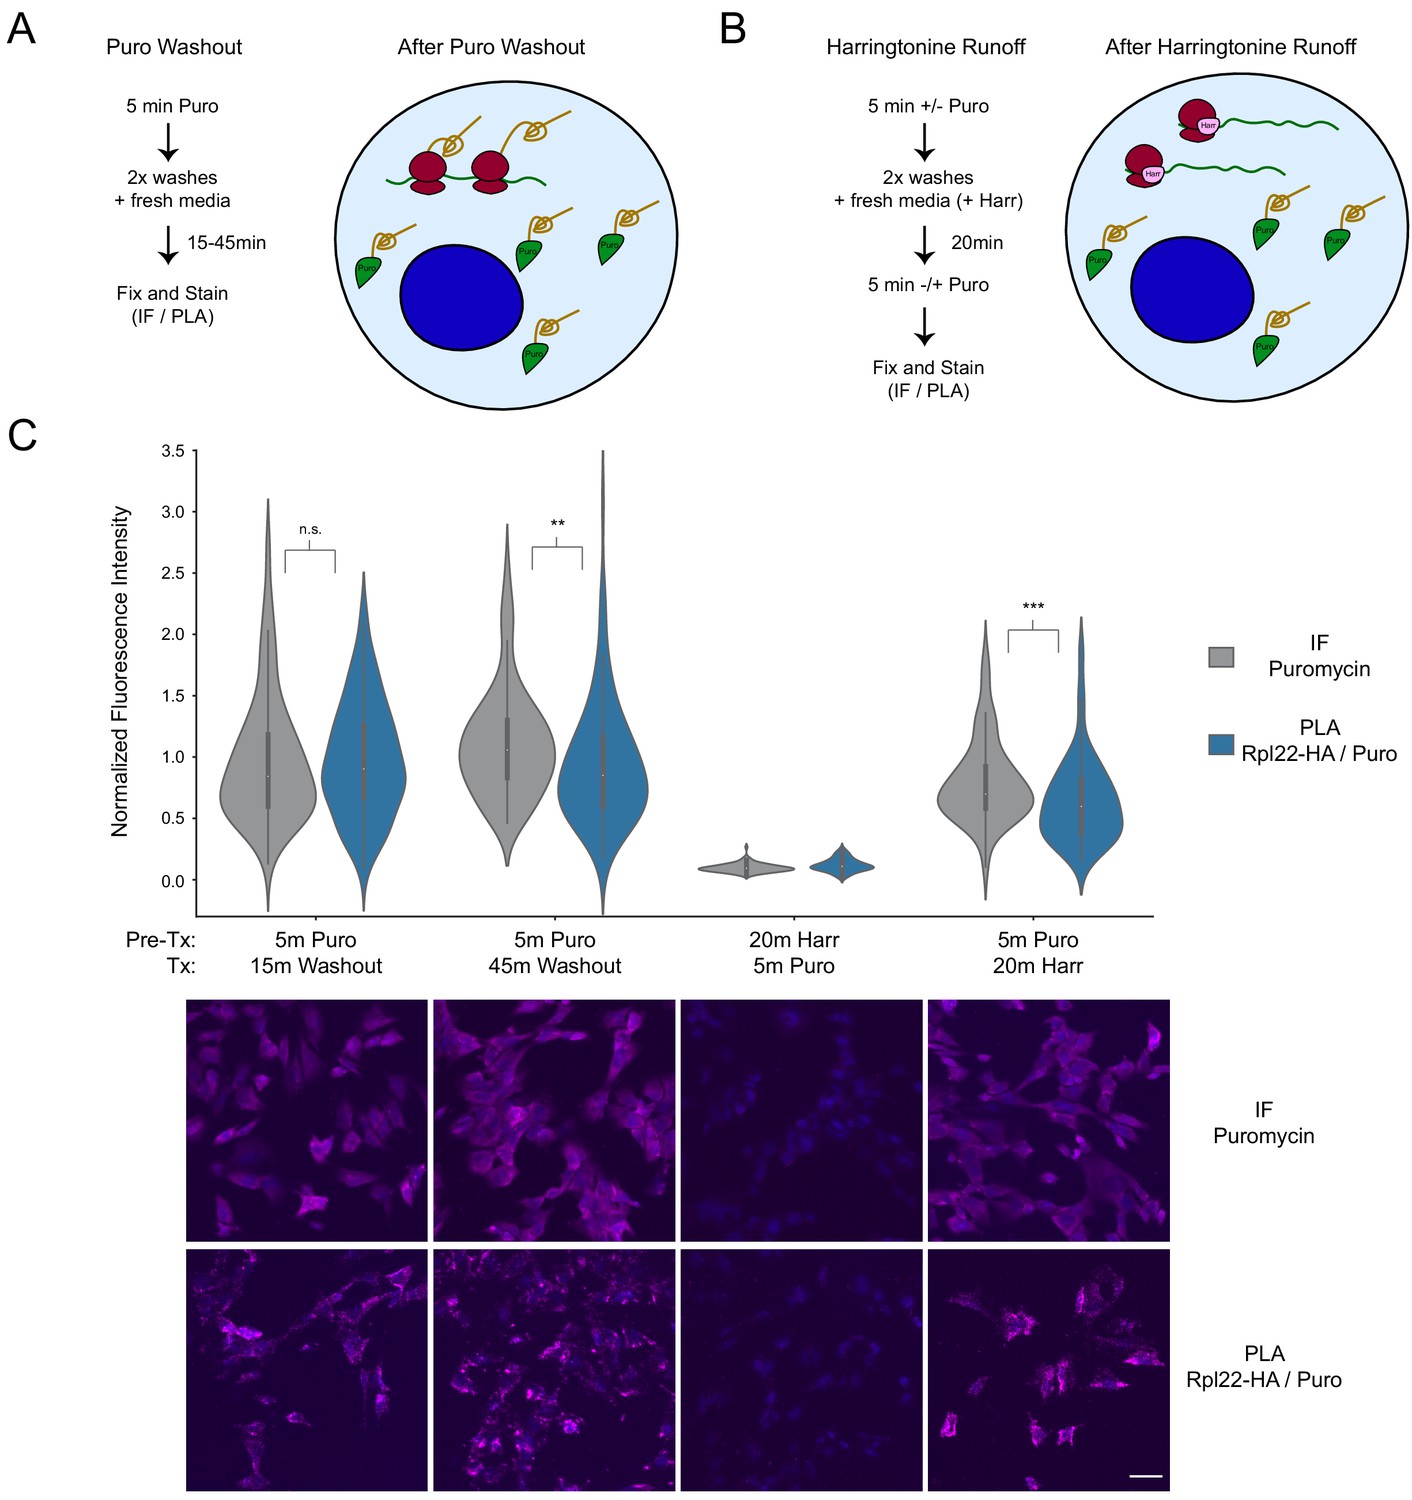
Puromycin washout and Harringtonine run-off confirm that eL22HA/Puro PLA signal does not report on proximity of ribosomes and puromycylated nascent chains.
(A) Schematic depicting state of cells after puromycin washout. Cells are briefly treated with puromycin, washed, and allowed to continue in fresh media for 15–45 min. The vast majority of puromycylated peptides should be released from ribosomes under these conditions. (B) Schematic depicting state of cells after harringtonine run-off. Harringtonine stalls newly initiating ribosomes without nascent chains, while elongating ribosomes complete. The vast majority of puromycylated nascent chains should be released, and no nascent chains should be present under these conditions. (C) Violin plots of normalized fluorescence intensity for puromycin IF or eL22-HA/Puro PLA signal RiboTag glioma cells treated as indicated. Data are derived from 3 experiments and 96 cells per condition, and statistical comparisons indicated were conducted using Mann-Whitney U test. See Figure 1—source data 1 for details. ** indicates p<0.01, *** indicates p<0.001. Representative images (10x) are shown below; DAPI in blue, puromycin IF or eL22-HA/Puro PLA in magenta. Scale bar, 50 µm.
-
Figure 1—figure supplement 2—source data 1
Raw source data for Figure 1—figure supplement 2C.
- https://cdn.elifesciences.org/articles/60048/elife-60048-fig1-figsupp2-data1-v2.xlsx
Figure 2 with 1 supplement
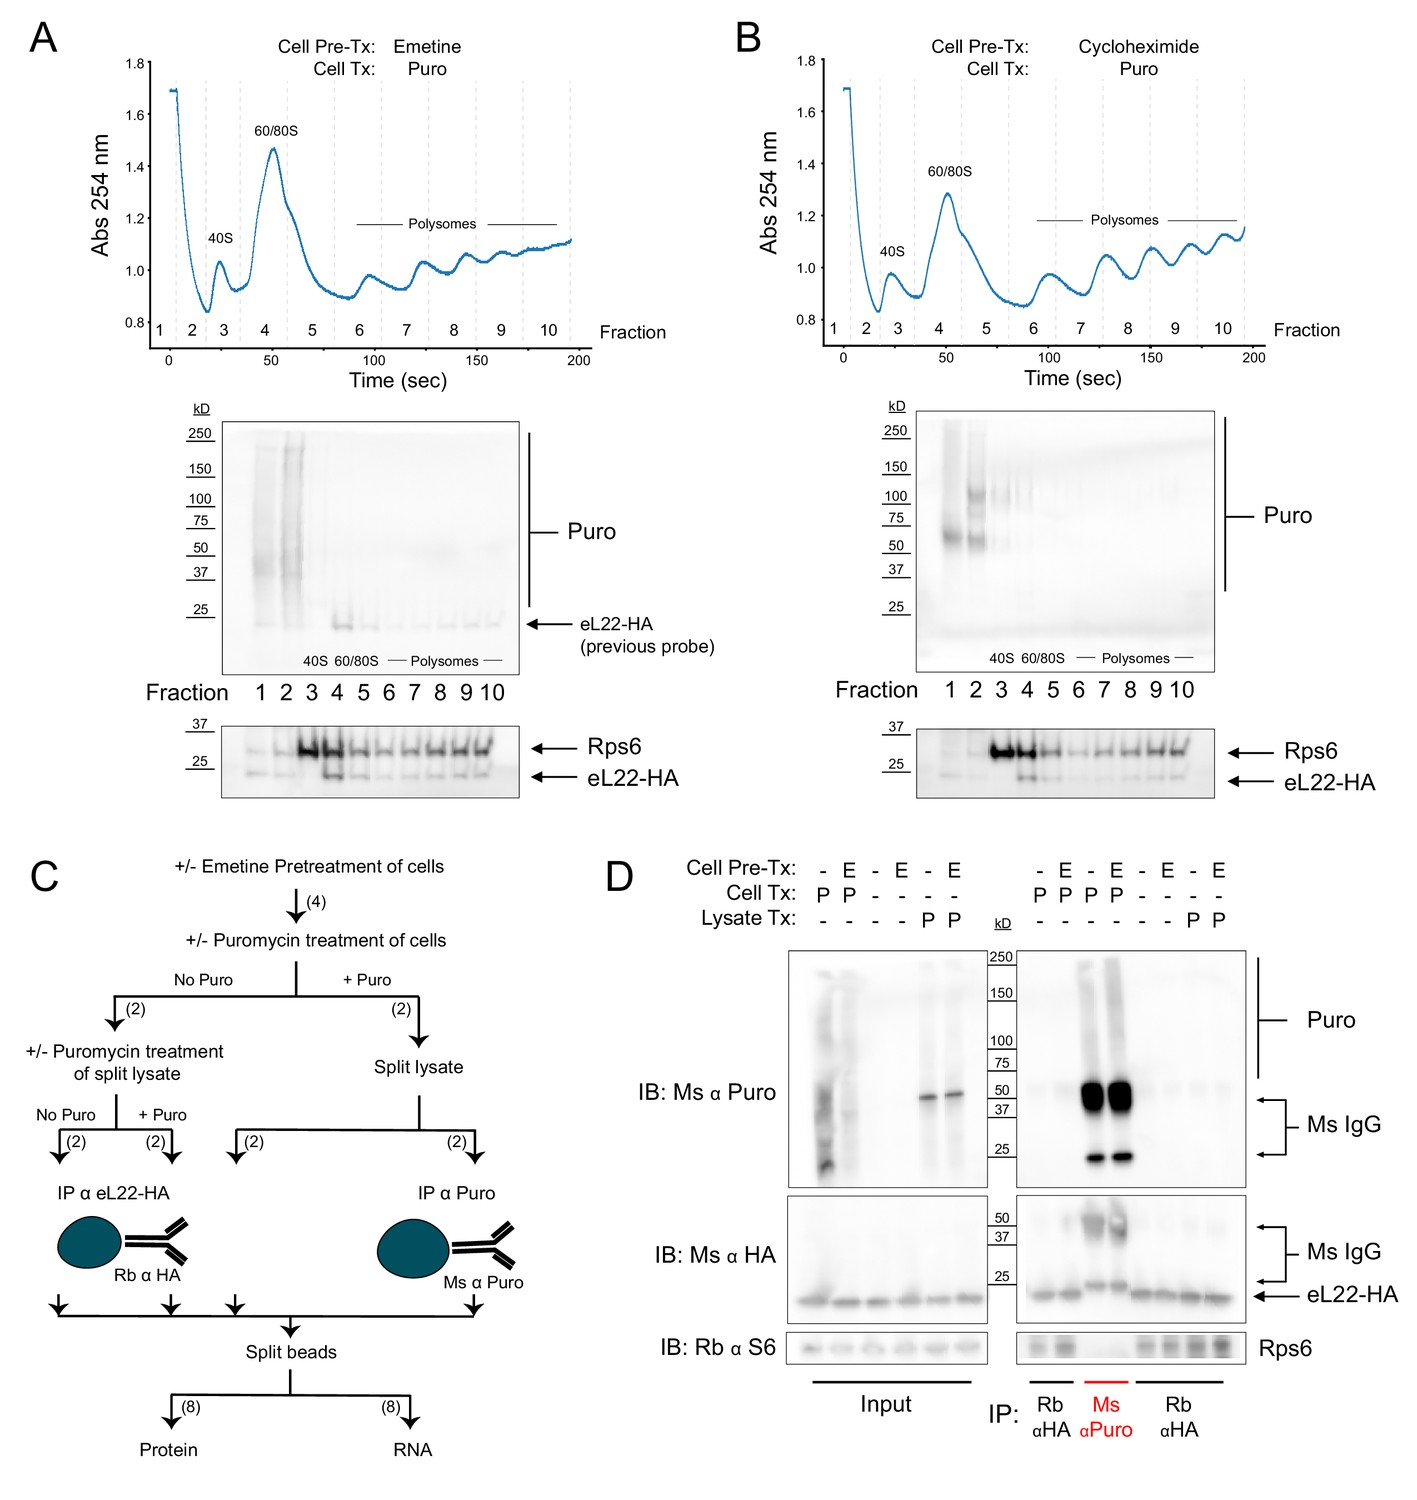
Regardless of pretreatment with elongation inhibitors, ribosomes and puromycylated nascent chains are not stable biochemical complexes.
(A) Sucrose gradient fractionation of polysomes from cells pretreated with emetine prior to puromycin. Top: Absorbance spectra from 15–50% linear sucrose gradient. Dashed lines indicate fractions collected, which correspond to western blots below. Bottom: Western blots for puromycin, Rps6, and eL22-HA. Note that Rb α S6 and Ms α HA were probed first, and some residual Ms anti-HA remained on the membrane during subsequent probing with Ms α Puromycin (see identical staining pattern below). (B) Same as (A), but with cycloheximide pretreatment. (C) Schematic depicting experimental workflow for eL22-HA and puromycin co-immunoprecipitation experiment. Numbers in parentheses indicate the number of samples along each branch of the workflow. All indicated splits of lysates and beads were equal, such that each RNA or protein sample represents an equal input of cell lysate. (D) Western blots of puromycin, eL22-HA, and Rps6 from input and IP samples as indicated. In blots using Ms α Puromycin or Ms α HA, strong bands corresponding to Ms IgG are present in the Ms α Puro lanes. Note that the Ms IgG light chain (~25 kD) is clearly resolved from eL22-HA (~23 kD, Sanz et al., 2009).
-
Figure 2—source data 1
Raw western blot images pertaining to Figures 2A, B and C.
- https://cdn.elifesciences.org/articles/60048/elife-60048-fig2-data1-v2.pdf
Figure 2—figure supplement 1
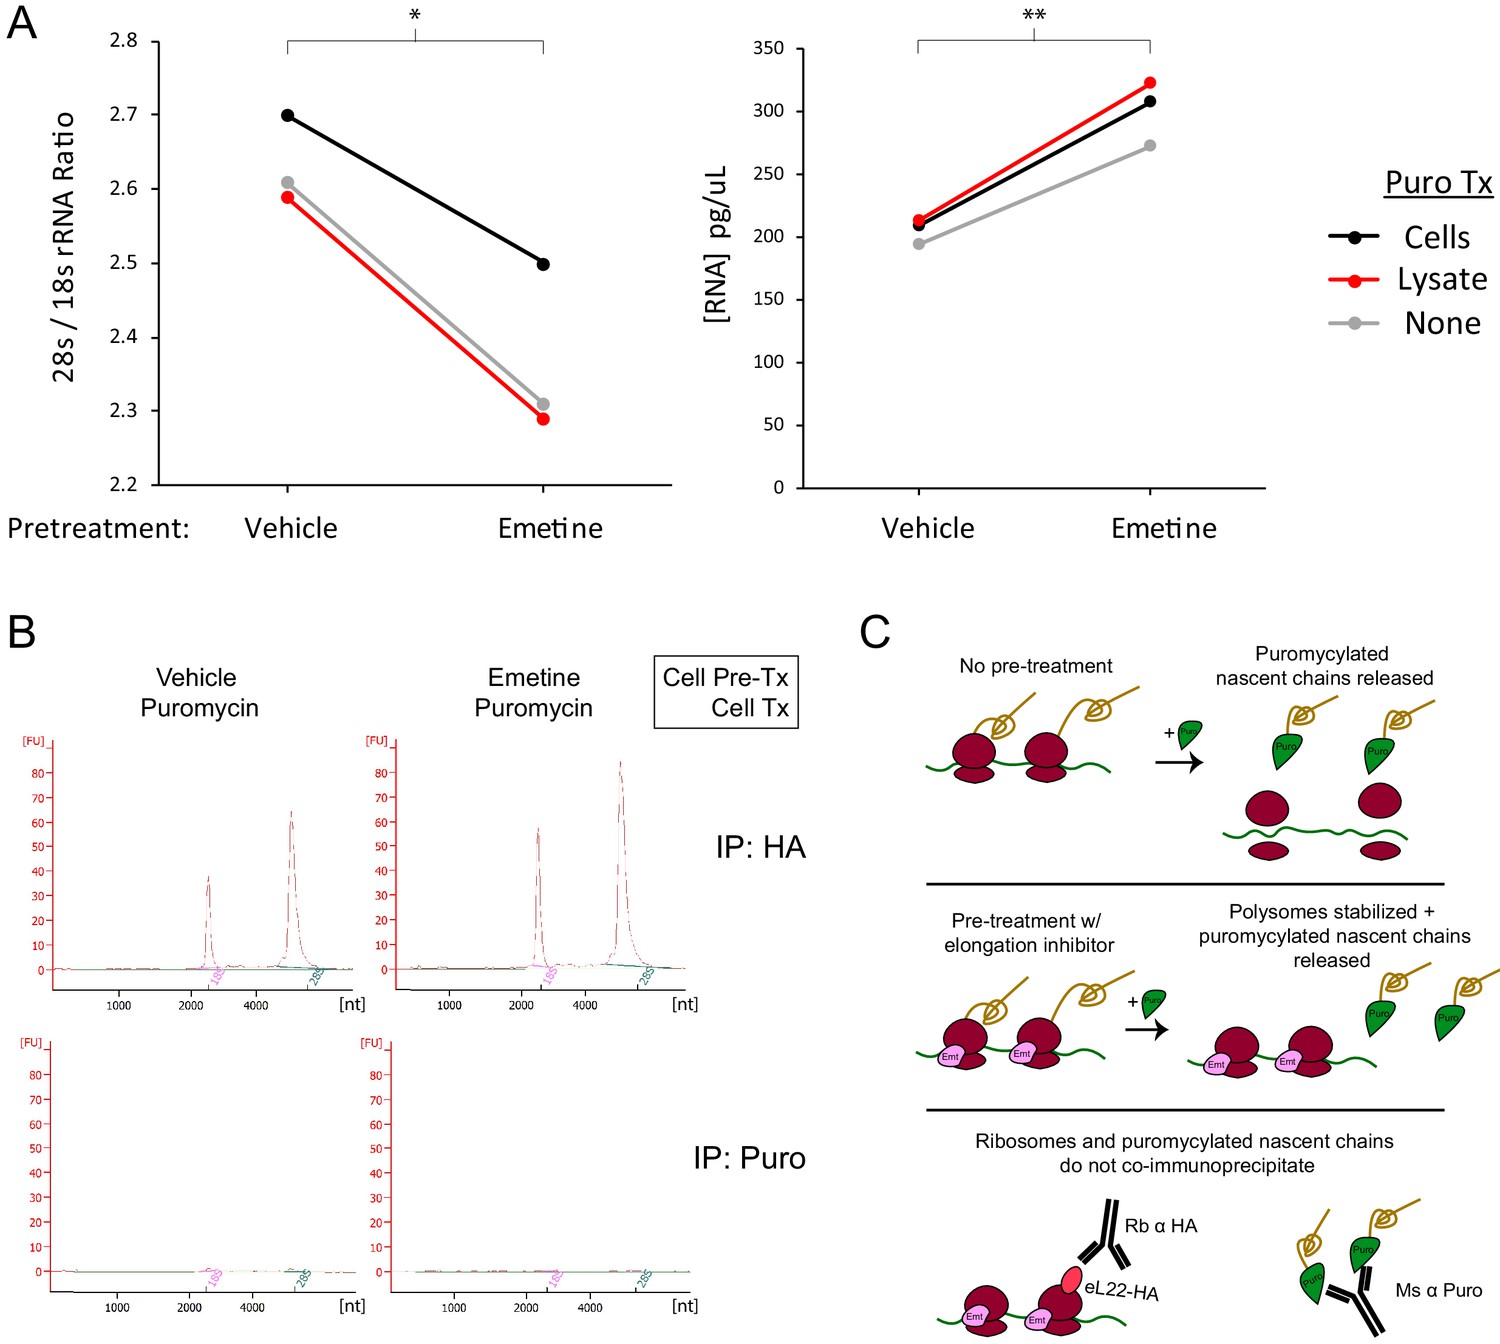
Pretreatment with emetine increases yield of intact ribosomes in eL22-HA immunoprecipitation, but does not enable capture of ribosomal RNA in puromycin immunoprecipitation.
(A) Regardless of puromycin treatment condition, emetine increases intact ribosome capture as shown by lower 28 s/18 s rRNA ratio (left; IP is against eL22-HA and therefore captures more free large subunits in the absence of emetine) and higher total RNA yield (right). * indicates p<0.05, ** indicates p<0.01 for paired t-test. Left: t(2) = 8.000, p=0.0153. Right: t(2) = 10.580, p=0.0088. (B) RNA Pico Bioanalyzer of total RNA eluted from immunoprecipitation of eL22-HA or puromycin. (C) Schematic summarizing results of co-immunoprecipitation experiments.
-
Figure 2—figure supplement 1—source data 1
Raw source data for Figure 2—figure supplement 1A.
- https://cdn.elifesciences.org/articles/60048/elife-60048-fig2-figsupp1-data1-v2.xlsx
Figure 3 with 3 supplements
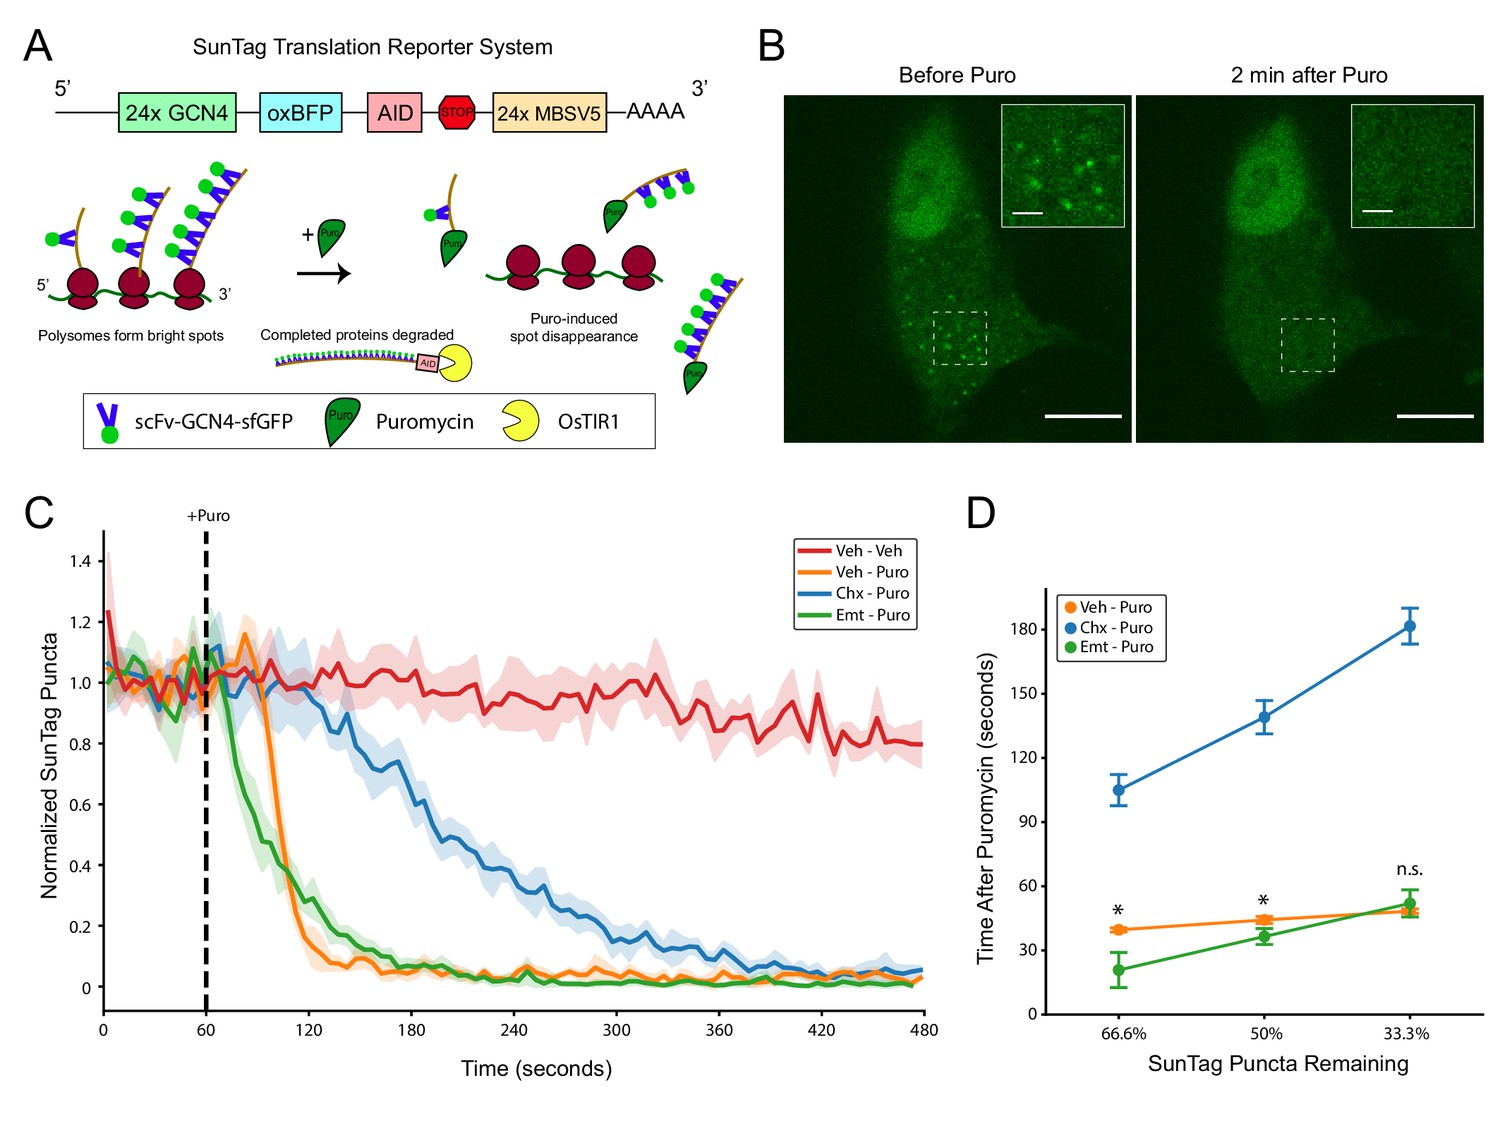
SunTag translation reporter imaging shows that elongation inhibitor pretreatment does not prevent puromycylated nascent chain release from polysomes.
(A) Schematic depicting the SunTag translation reporter system used in this study, as described by Wu et al., 2016. Note that although the SunTag reporter construct harbors MS Coat Protein Binding Sites (MBSV5) in the 3’ UTR, we did not employ RFP-labeled MS Coat Protein for mRNA tracking. (B) Representative spinning disk confocal images (100x) of a live HEK-293FT cell before and 2 min after addition of 220 µM puromycin. Regions depicted in white dashed lines are displayed in the inset. Scale bars: 10 µm for large field, 2 µm for inset. (C) Live imaging time course of SunTag puncta in cells with pretreatments as indicated (355 µM cycloheximide or 54 µM emetine), followed by treatment as indicated (220 µM puromycin). Puromycin was added at 60 s into the 8 min imaging trial (dashed black line). SunTag puncta for each cell were normalized to the average SunTag puncta in that cell during the initial 60 s. Data are comprised of 3–4 replicate imaging trials per treatment condition, with each replicate containing 7–12 cells (Veh-Veh: n = 27 cells from three replicates, Veh-Puro: n = 30 cells from three replicates, Chx-Puro: n = 27 cells from three replicates, Emt-Puro: n = 41 cells from four replicates). Plotted are the mean ± standard deviation of all cells, computed in five second time intervals (see Materials and methods). (D) The mean normalized SunTag puncta in each replicate imaging trial was used to determine the time after puromycin addition at which two thirds, half, and one third of SunTag puncta remain in each condition. Welch’s t-test was used to assess differences between Veh-Puro and Emt-Puro (for 66.6%: t(5) = 3.932, p=0.0271, for 50%: t(5) = 3.183, p=0.0294, for 33.3%: t(5) = 0.967, p=0.3996). * denotes p<0.05.
-
Figure 3—source data 1
Raw source data for Figure 3C and D.
- https://cdn.elifesciences.org/articles/60048/elife-60048-fig3-data1-v2.xlsx
Figure 3—figure supplement 1
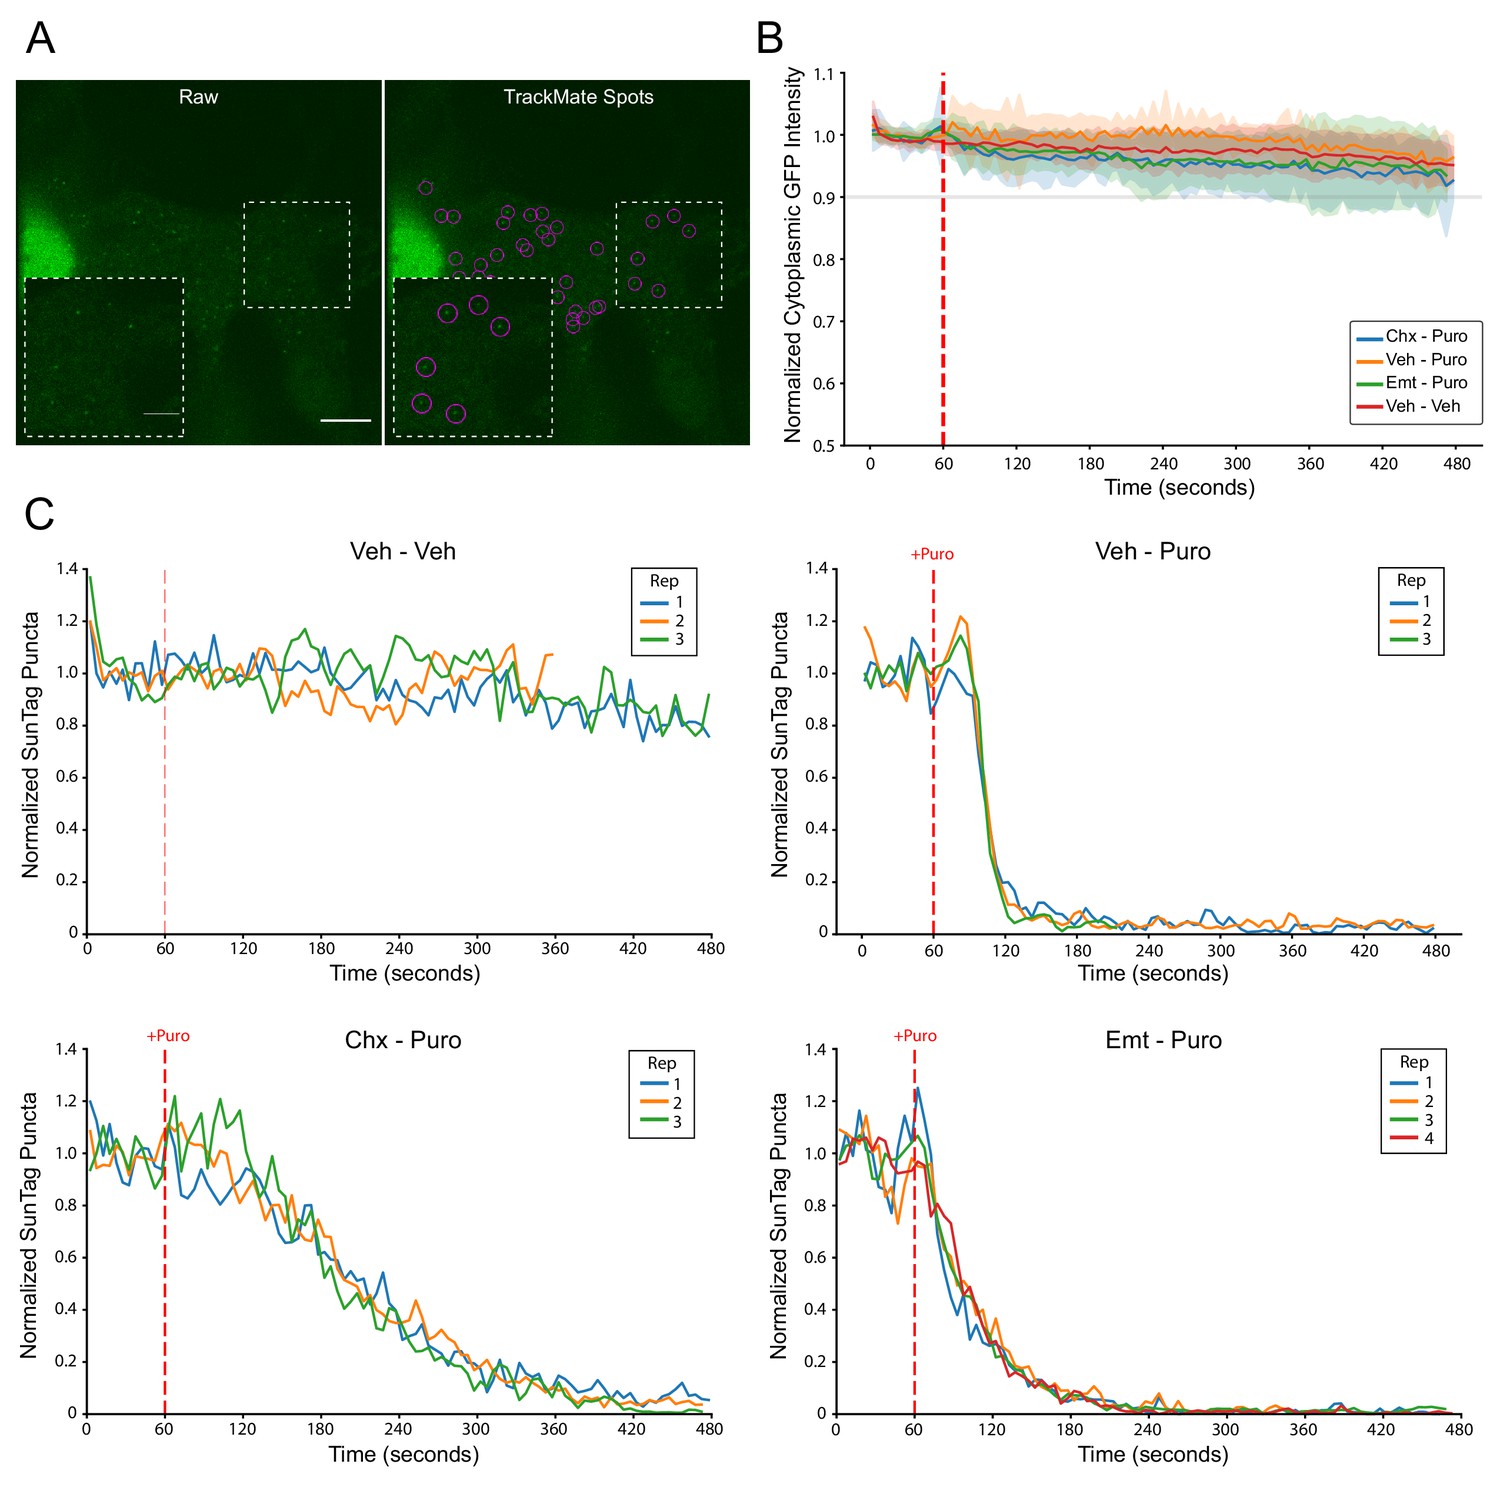
SunTag puncta detection, minimal photobleaching, and consistency of replicate imaging trials.
(A) Representative images of SunTag puncta quantification using TrackMate spot detection; registered spots are circled in purple. Scale bars: 10 µm for large field, 5 µm for inset. (B) Live imaging time course of background cytoplasmic GFP intensity from cells treated as indicated. Cytoplasmic ROIs for each cell were normalized to the average GFP intensity in that cell during the initial 10 frames. Data correspond to the exact cells presented in Figure 3C. Puromycin was added at 60 s into the 8 min imaging trial (dashed red line). Plotted are the mean ± standard deviation of all cells, computed in five second time intervals. (C) Live imaging time course of normalized SunTag puncta for the exact cells presented in Figure 3C. Plotted is the mean of all cells (n = 7–12) in each replicate imaging trial for each treatment condition as indicated. Puromycin was added at 60 s into the 8 min imaging trial (dashed red line).
Figure 3—figure supplement 2
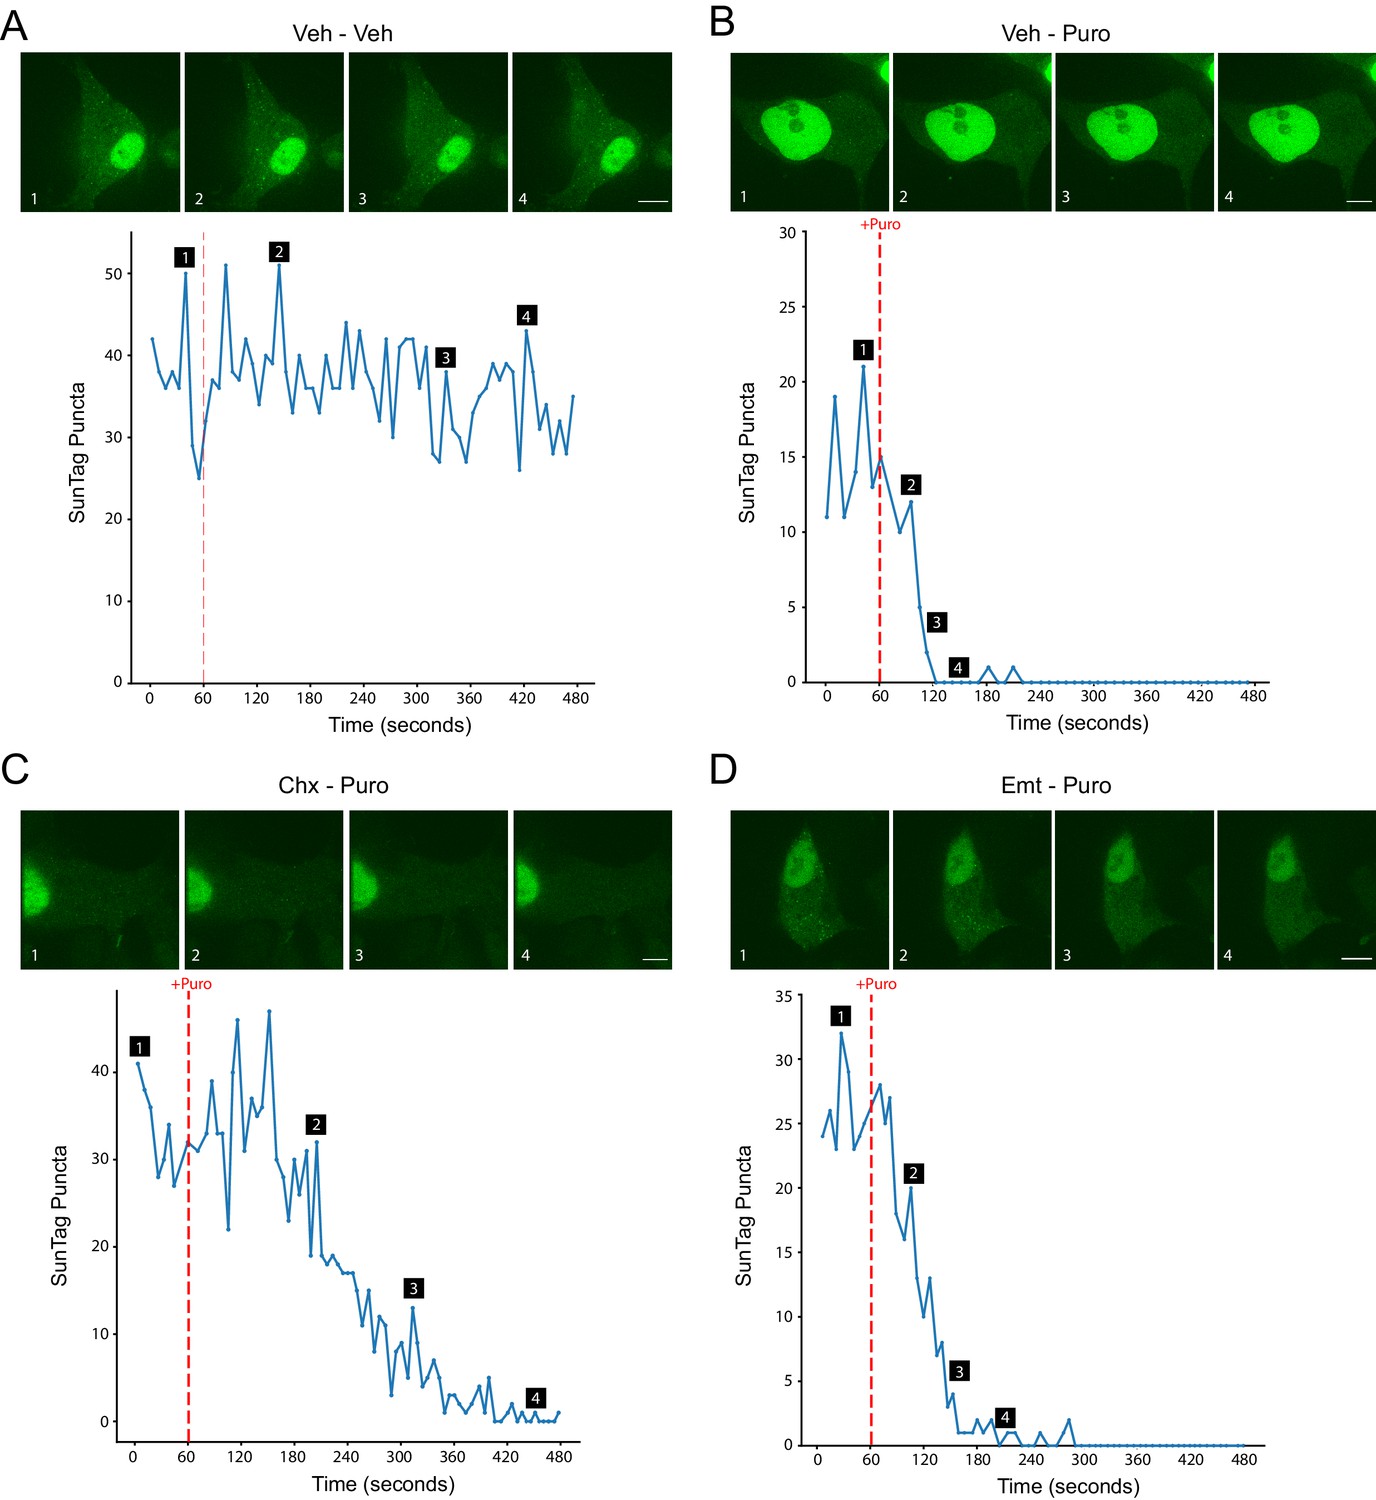
Representative images and traces of single cell SunTag imaging.
(A–D) Representative single cell raw puncta counts from each frame are plotted during live imaging with treatments as indicated. Puromycin was added at 60 s into the 8 min imaging trial (dashed red line). Images of cells are marked with labels 1–4, corresponding to the same labels on the time course of raw puncta counts plotted below. Scale bars: 10 µm.
Figure 3—video 1
Time lapse live imaging of puromycin-induced SunTag puncta disappearance.
Representative time lapse imaging of SunTag puncta disappearing upon puromycin treatment, corresponding to Figure 3C. Cycloheximide or emetine was added 4 min before the start of imaging (5 min pre-treatment), and puromycin was added 60 s into the 8 min imaging trial (red Puro text indicates when Puro is added in each trial). Frames for each trial were upscaled to the lowest common denominator, and subsequently down-sampled to 102 frames, which are streamed at eight frames per second (see Materials and methods). Playback is approximately ~40 x (~8 min in ~12 s). The exact timestamp of each image in each trial is indicated. Scale bar: 10 µm.
Figure 4

Structural analysis does not support a model of IgG antibodies directly contacting and recognizing puromycin within intact 80S ribosomal complexes.
(A) Schematic depicting structural modeling workflow: puromycin was positioned within the PTC of a stalled mammalian 80S ribosomal complex and the Fab fragment of a mouse IgG2a antibody was docked into the A site such that the antigen recognition loop could directly contact puromycin (see Materials and methods). Twelve such positions were analyzed by MolProbity. (B) MolProbity clashscores, the number of serious steric overlaps (>0.4 Å) per 1000 atoms, for the A Site Fab positions in which the Fab could contact puromycin (within ~6 Å), the IgG2a alone, the 80S alone, or the ‘best fit’ model of the Fab in the A site in which the Fab cannot contact puromycin (29.1 Å away). Mean ± standard deviation are plotted for the 12 models with puromycin contact. MolProbity clashscore percentiles (the percent of structures of comparable resolution in PDB with worse clashscores) are listed below. See Figure 4—source data 1 for detailed summary. (C) Representative positioning of IgG2a antibody manually docked in the A site of the 80S ribosomal complex. (D) One of the twelve representative models of the IgG2a Fab within the A site of the 80S ribosomal complex highlighting the numerous steric clashes with the 60S ribosomal proteins, 28S rRNA, and P-site tRNA.
-
Figure 4—source data 1
Summary of MolProbity analysis of IgG2a Fab alignments within 80S A site.
- https://cdn.elifesciences.org/articles/60048/elife-60048-fig4-data1-v2.docx
Additional files
Download links
A two-part list of links to download the article, or parts of the article, in various formats.
Downloads (link to download the article as PDF)
Open citations (links to open the citations from this article in various online reference manager services)
Cite this article (links to download the citations from this article in formats compatible with various reference manager tools)
Elongation inhibitors do not prevent the release of puromycylated nascent polypeptide chains from ribosomes
eLife 9:e60048.
https://doi.org/10.7554/eLife.60048


