A bacterial membrane sculpting protein with BAR domain-like activity
- U.S. Army DEVCOM Chemical Biological Center, BioSciences Division, BioChemistry Branch, United States
- Oak Ridge Institute for Science and Education, United States
- University of Southern California, Department of Physics and Astronomy, United States
- Materials and Manufacturing Directorate, Air Force Research Laboratory, Wright-Patterson Air Force Base, United States
- University of Southern California, Department of Biological Sciences, United States
- Center for Bio/Molecular Science and Engineering, Naval Research Laboratory, United States
- California Institute of Technology, Division of Biology and Biological Engineering, United States
- Department of Chemistry and Biochemistry, Brigham Young University, United States
- University of Southern California, Department of Chemistry, United States
Figures
Figure 1 with 1 supplement
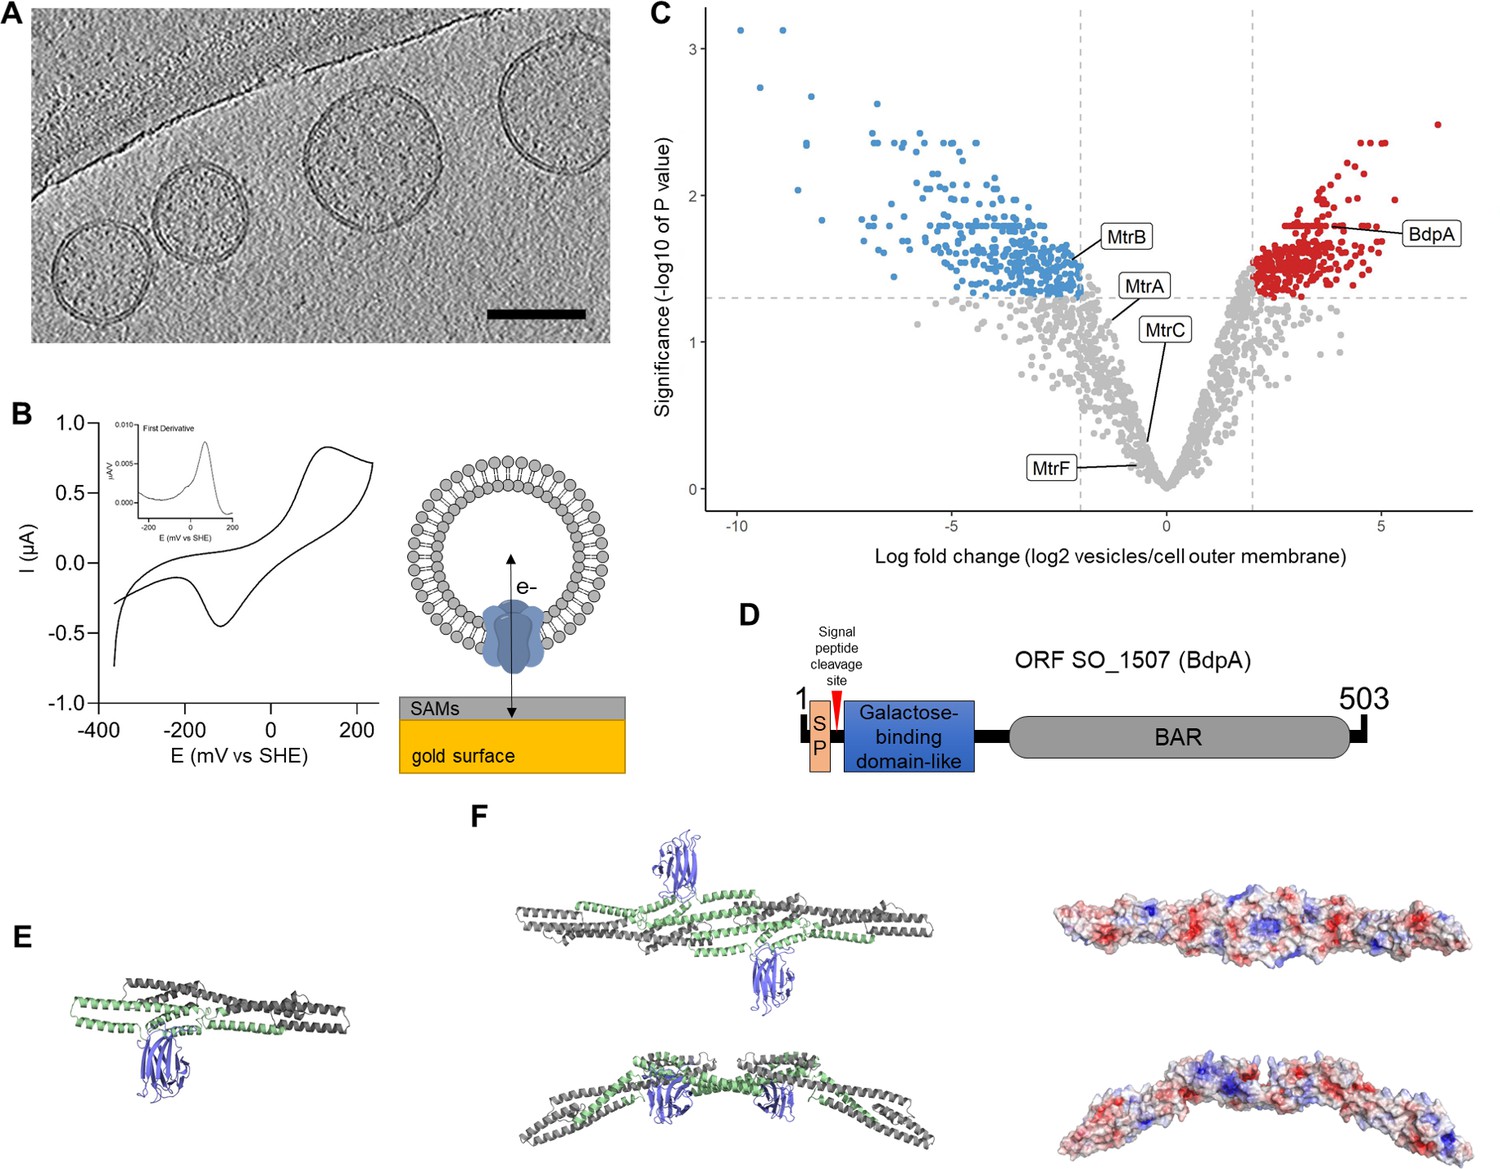
Redox active vesicles are enriched with Bin/Amphiphysin/RVS (BAR) domain-like protein BdpA.
(A) Representative cryoelectron tomography image of Shewanella oneidensis MR-1 outer membrane vesicles (OMVs) (scale = 200 nm). (B) Cyclic voltammetry (scan rate of 10 mV/s) of vesicles adhered to gold electrode via small self-assembled monolayers, as diagrammed. Inset shows first derivative of anodic scan. (C) Volcano plot of vesicle proteome compared to cell-associated outer membrane (red = enriched in vesicles, blue = enriched in cell-associated outer membrane). Plot is representative of outer membrane vesicles and outer membrane fractions collected from three independent biological replicates each. (D) Schematic of putative BdpA domains. BdpA has a predicted signal peptide (SP) and cleavage site within the first 22–23 amino acid residues. (E) Ab initio predicted structure of the mature BdpA protein after signal peptide cleavage. Colors correspond to predicted domains in (D). (F) Top-down (top) and side profile (bottom) views of the predicted homodimeric structure of BdpA (left), and surface representation of the homodimeric protein without the galactose-binding domain-like region colored according to electrostatic potential (right), with positively charged residues in blue and negatively charged residues in red. The concave face (top right) has an accumulation of distributed positively charged residues, while the side profile shows predicted BAR domain-like intrinsic curvature.
Figure 1—figure supplement 1
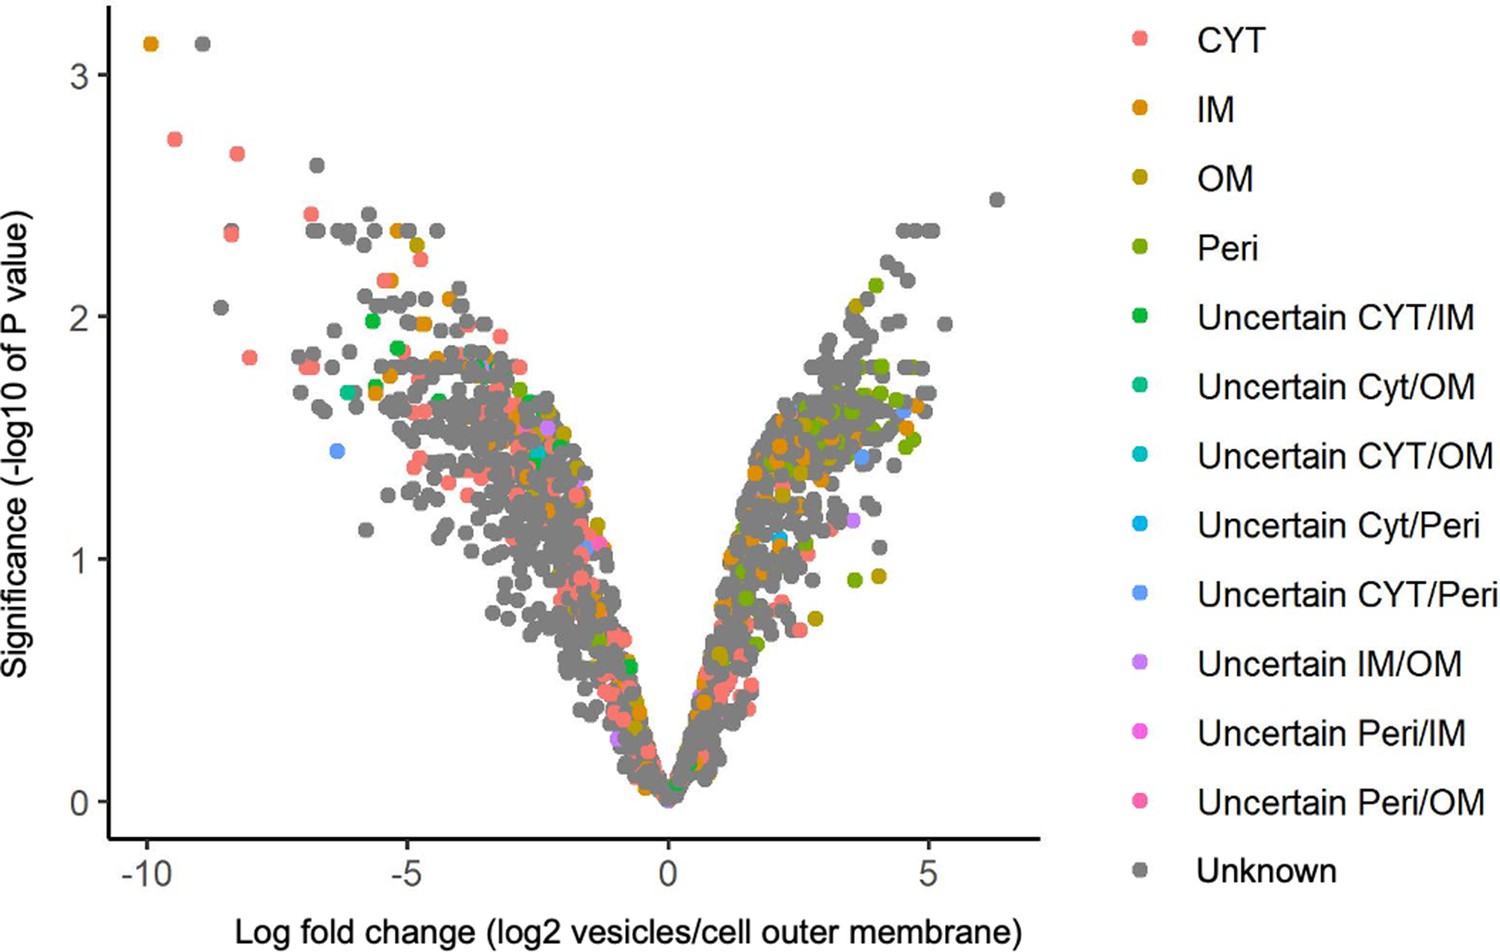
Locations of proteins associated with vesicles and cell outer membrane predicted by PSORTb (CYT = cytoplasm, IM = inner membrane, OM = outer membrane, Peri = periplasm).
Note: There was disagreement between PSORTb and other protein prediction services.
Figure 2 with 3 supplements
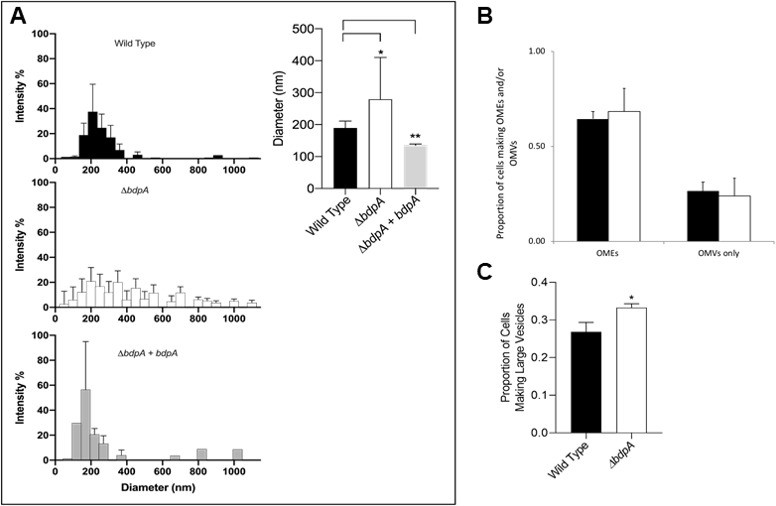
BdpA is responsible for maintaining vesicle size but does not alter the combined frequency of cells producing membrane structures.
(A) Outer membrane vesicle (OMV) size distribution by dynamic light scattering (DLS) from the Shewanella oneidensis wild-type (WT) strain (top left, n = 11), deletion strain (ΔbdpA) (middle left, n = 9), and ΔbdpA strain expressing bdpA from a plasmid (bottom left, n = 3). Error bars represent the standard deviation from the average percentage of particles (% intensity) at a given diameter. The absence of an error bar indicates that a given diameter was only observed in a single replicate sample. The weighted average of the OMV diameter for each strain was also compared (right). Error bars represent the standard deviation and asterisks indicate a significant difference (p < 0.05, Student’s t-test) between samples indicated by the line above. (B) Average proportion of cells producing distinctly visible outer membrane extensions (OMEs) (whether or not they also produce OMVs), and the average proportion of cells producing only visible OMVs (i.e., no distinctly visible OMEs) during 5 hr perfusion flow imaging experiments. Black bars are the WT strain and white bars are the ΔbdpA strain. A total of 2607 WT and 2943 ΔbdpA cells were quantified from n = 3 independent biological replicate experiments per strain. (C) Average proportion of cells forming large vesicles (typically >300 nm diameter) during 5 hr perfusion flow imaging experiments. A total of 1273 WT and 1317 ΔbdpA cells (from n = 3 independent biological replicate experiments per strain) were included in this quantification. Asterisk indicates a significant difference between samples (p < 0.0001, Pearson’s χ2 test). For both (B) and (C). cell membranes were visualized by staining with FM 4–64 FX during time-lapse fluorescence imaging in a perfusion flow platform (6.25 ± 0.1 µL/s). Time-lapse images were acquired from at least five fields of view every 5 min over 5 hr for each strain. Error bars represent ± SEM.
Figure 2—figure supplement 1
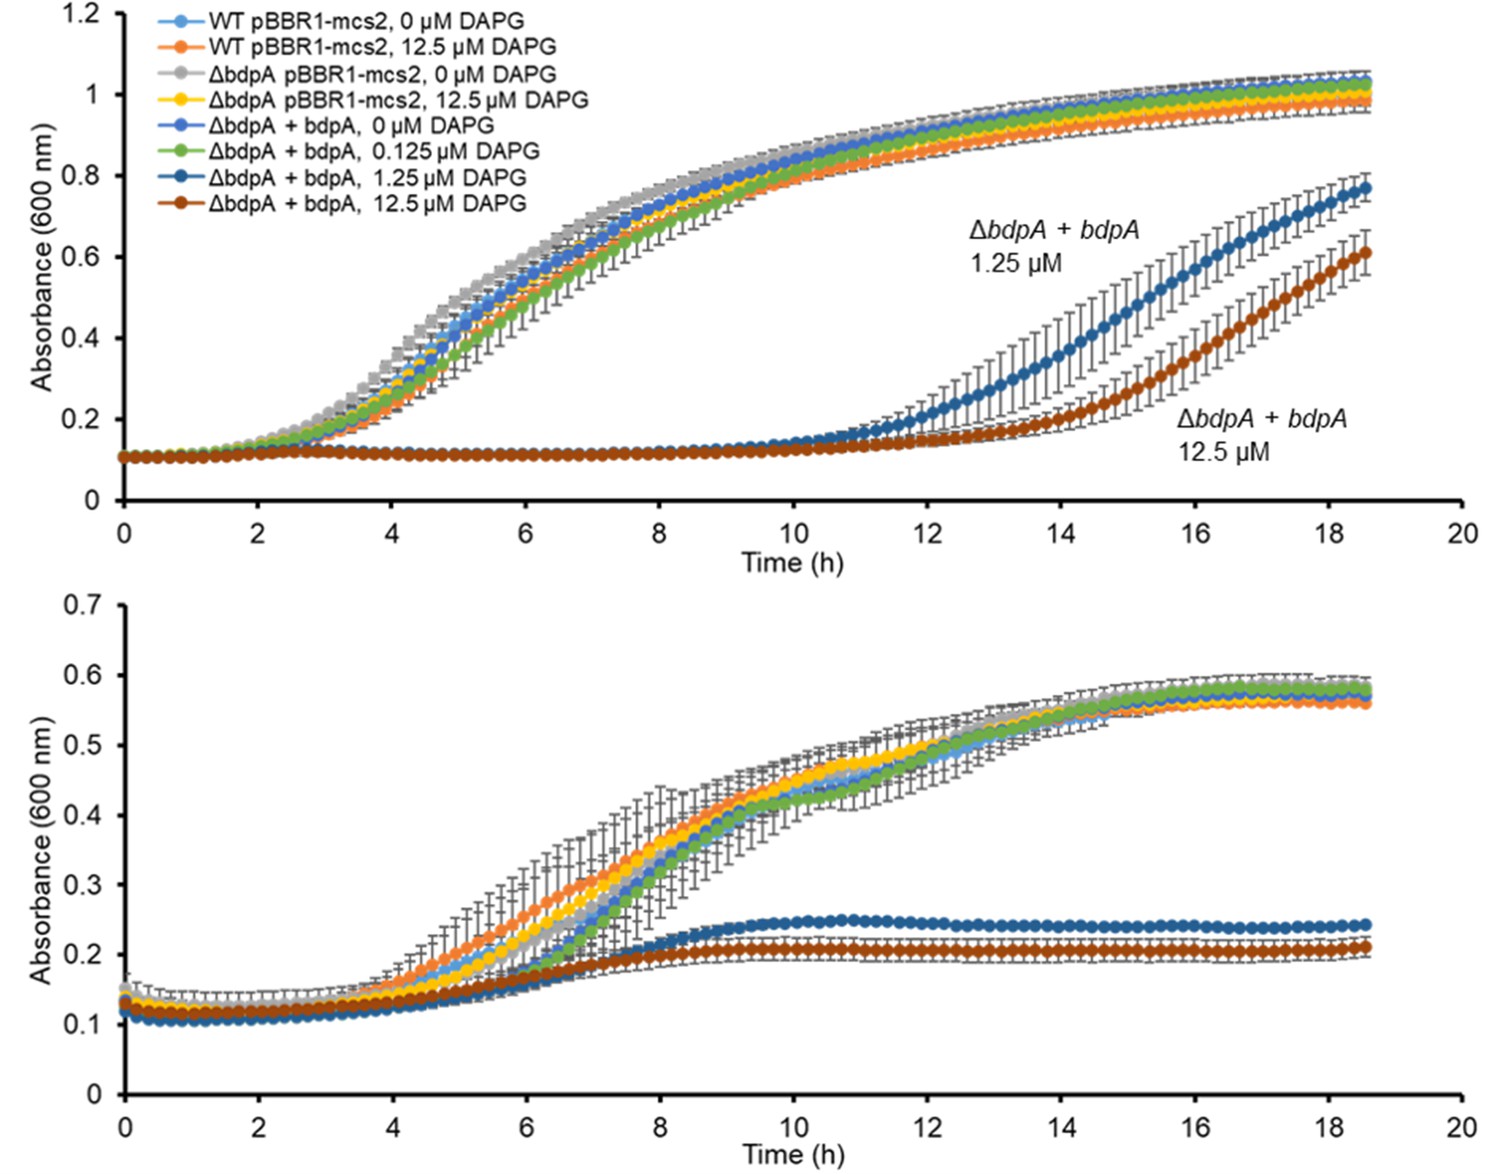
Growth of Shewanella oneidensis strains in Luria Bertani (LB) (top) or Shewanella defined medium (SDM) (bottom) in response to DAPG exposure and BdpA induction.
Error bars are standard deviation of three biological replicates (independent cultures).
Figure 2—figure supplement 2

Anaerobic ferrihydrite reduction over time by Shewanella oneidensis strains.
Concentration of Fe(II) was determined by ferrozine assay. Error bars are standard deviation of three biological replicates (independent cultures).
Figure 2—figure supplement 3
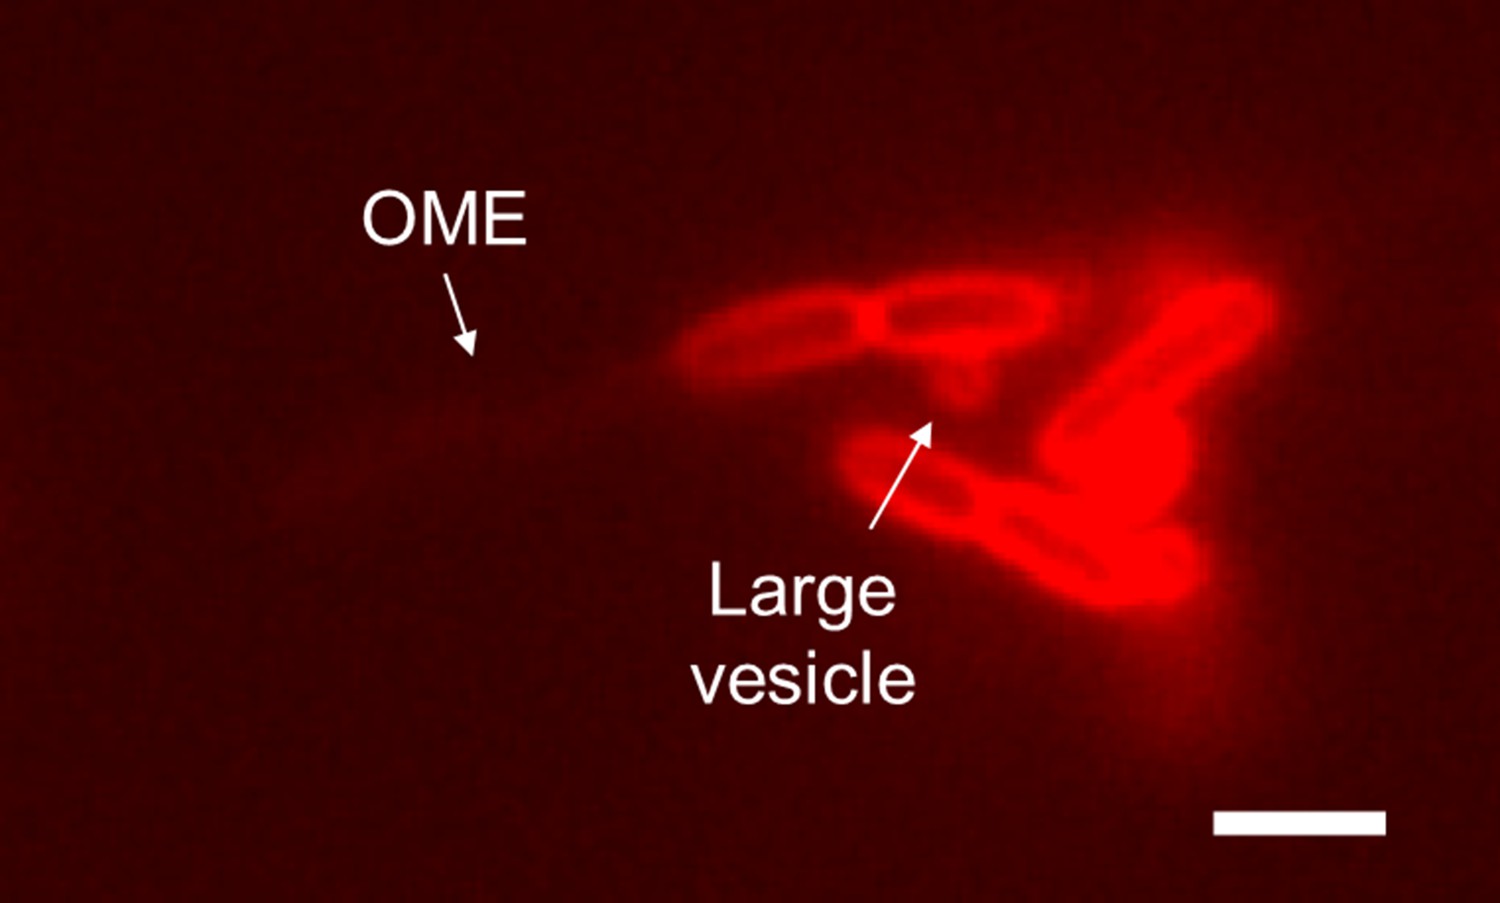
Example image of an outer membrane extension (OME) and a large vesicle produced by Shewanella oneidensis ΔbdpA after 3 hr during perfusion flow conditions. Scale = 2 µm.
Figure 3

BdpA promotes outer membrane extension (OME) maturation into ordered tubules.
(A) Fluorescence images of Shewanella oneidensis wild-type (WT) (top), ΔbdpA (middle), and ΔbdpA+ bdpA with 12.5 µM DAPG (bottom) OMEs. Scale = 2 µm. All cells were counted manually and categorized as either with extension or without extension (a total of 2444 cells from WT, 4378 cells from ΔbdpA, and 3354 cells from ΔbdpA+ bdpA). (B) Proportion of cells making OMEs relative to the total number of cells counted from static cultures at 3 hr post-deposition onto chambered cover glass, recorded from five random fields of view from fluorescence microscopy for each of three independent cultures per strain. Statistical significance was determined by Student’s t-test (p > 0.05 for each). Error bars represent standard deviation. (C) Representative cartoon of OME phenotypes used for classification at 3 hr. (D) Frequency of OME phenotypes observed with cryogenic transmission electron microscopy (cryo-TEM) relative to the total number of OMEs observed from each strain. Phenotypes were documented from observations of 14 WT, 12 ΔbdpA, and 41 ΔbdpA+ bdpA OMEs at the 90 min time point, and 31 WT, 13 ΔbdpA, and 3 ΔbdpA+ bdpA OMEs at the 3 hr time point across three separate biological replicates, with two technical replicates of each strain per biological replicate. Membrane blebs/bulges were defined as non-structured membrane protrusions that did not resemble either of the other OME categories depicted in (E). (E) Representative cryo-TEM of S. oneidensis WT (top), ΔbdpA (middle), and ΔbdpA+ bdpA with 12.5 µM DAPG (bottom) OMEs at 90 min post-surface attachment. Scale = 100 nm. (F) Representative cryo-TEM images of WT (top), ΔbdpA (middle), and ΔbdpA+ bdpA with 12.5 µM DAPG (bottom) OMEs at 3 hr post-surface attachment. Scale = 100 nm.
Figure 4 with 1 supplement
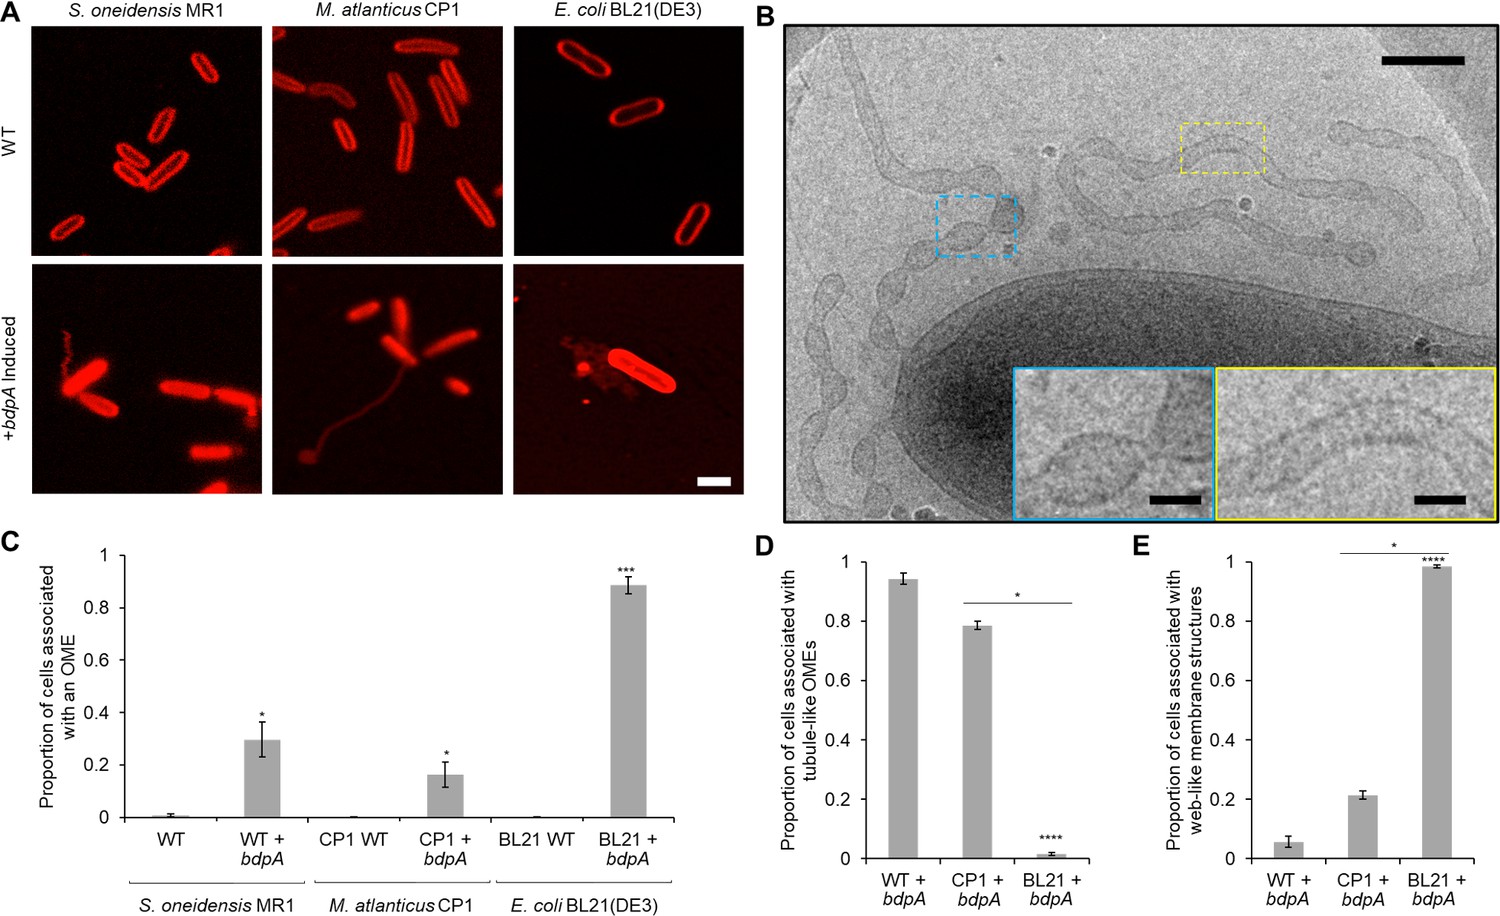
Heterologous expression of BdpA promotes outer membrane extension (OME) formation.
(A) Induction (1 hr) of BdpA expression with 12.5 µM DAPG during planktonic, non-attached growth results in OME formation in Shewanella oneidensis (left, wild type [WT] + bdpA), Marinobacter atlanticus CP1 (middle, CP1+ bdpA), and Escherichia coli BL21(DE3) (right, BL21+ bdpA). Scale = 2 µm. At least three individual biological replicates were included per strain and images are representative of 5–15 fields of view per replicate. (B) Cryogenic transmission electron microscopy (cryo-TEM) image of OMEs following a 2 hr planktonic induction of BdpA expression in S. oneidensis WT + bdpA cells. Scale = 200 nm. Insets enlarged to show detail of regularly ordered electron densities at the surface of OME junctions (blue) and tubule regions (yellow). Scale = 50 nm. (C) Quantification of the proportion of cells associated with an OME from 1 hr planktonic induction cultures observed across 5–10 fields of view and three individual biological replicates from S. oneidensis WT (700 cells) and WT + bdpA (472 cells) (p = 0.025), M. atlanticus CP1 (4041 cells) and CP1+ bdpA (150 cells) (p = 0.041), and E. coli BL21 WT (2190 cells) and BL21+ bdpA (2623 cells) (p = 0.0007). Asterisks denote statistical significance between OME proportions of the WT and+ bdpA samples of the same species. No significance was observed between WT + bdpA and CP1+ bdpA (p = 0.089), but BL21+ bdpA produced more OMEs than either WT + bdpA (p = 0.0017) or CP1+ bdpA (p = 0.0001). (D) Proportion of the cells associated with a tubule-like OME relative to the total number of OME-associated cells observed for each+ bdpA strain. S. oneidensis WT + bdpA produced significantly more tubule-like OMEs than E. coli BL21+ bdpA cultures (p = 1.1 × 10⁻⁵) but not M. atlanticus CP1+ bdpA (p > 0.05). Similarly, more tubule-like OMEs were observed from M. atlanticus CP1+ bdpA cultures than in E. coli BL21+ bdpA (p = 0.035). (E) Proportion of the total number of OME-associated cells in each strain observed in contact with a web-like OME. E. coli BL21+ bdpA produced predominately web-like OMEs, and significantly more than S. oneidensis WT + bdpA (p = 1.1 × 10⁻⁵) or M. atlanticus CP1+ bdpA (p = 0.035). All statistical significance was determined by Welch’s t-test. Error bars represent standard deviation.
Figure 4—figure supplement 1
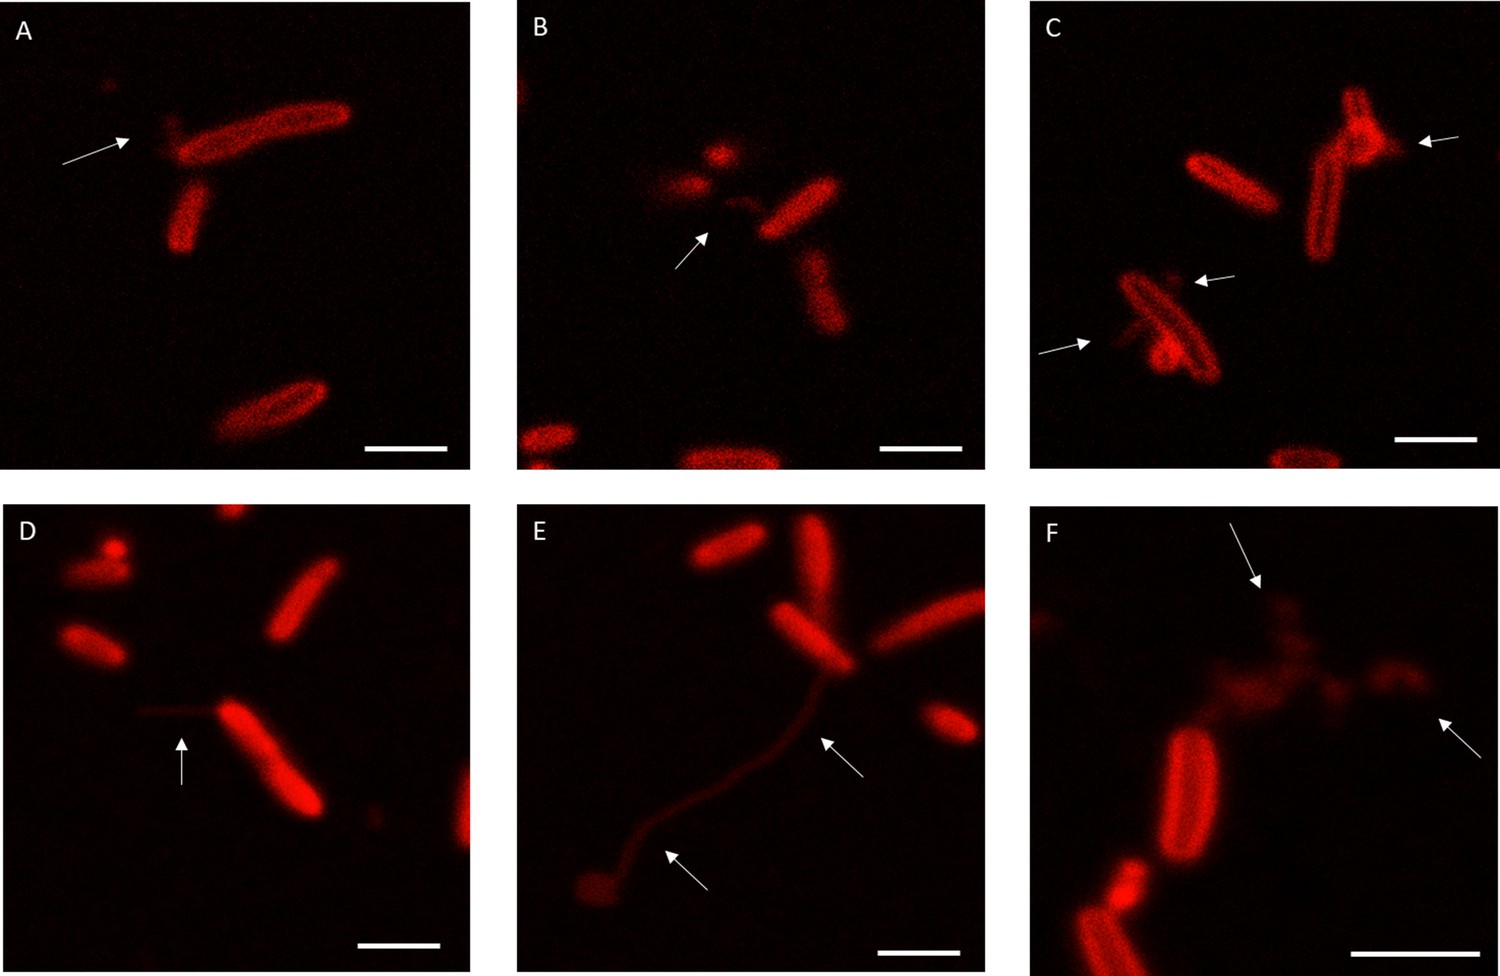
Variability in outer membrane extension (OME) phenotypes following BdpA induction in Marinobacter atlanticus CP1+ bdpA cells. Cells displayed an array of membrane curvature phenotypes, ranging from tubule-like OMEs (A–F), membrane vesicles or blebbing (C,F), and branched, web-like OME/outer membrane vesicle (OMV) chains (F). Frequencies of each phenotype are shown in Figure 4. Scale = 2 µm.
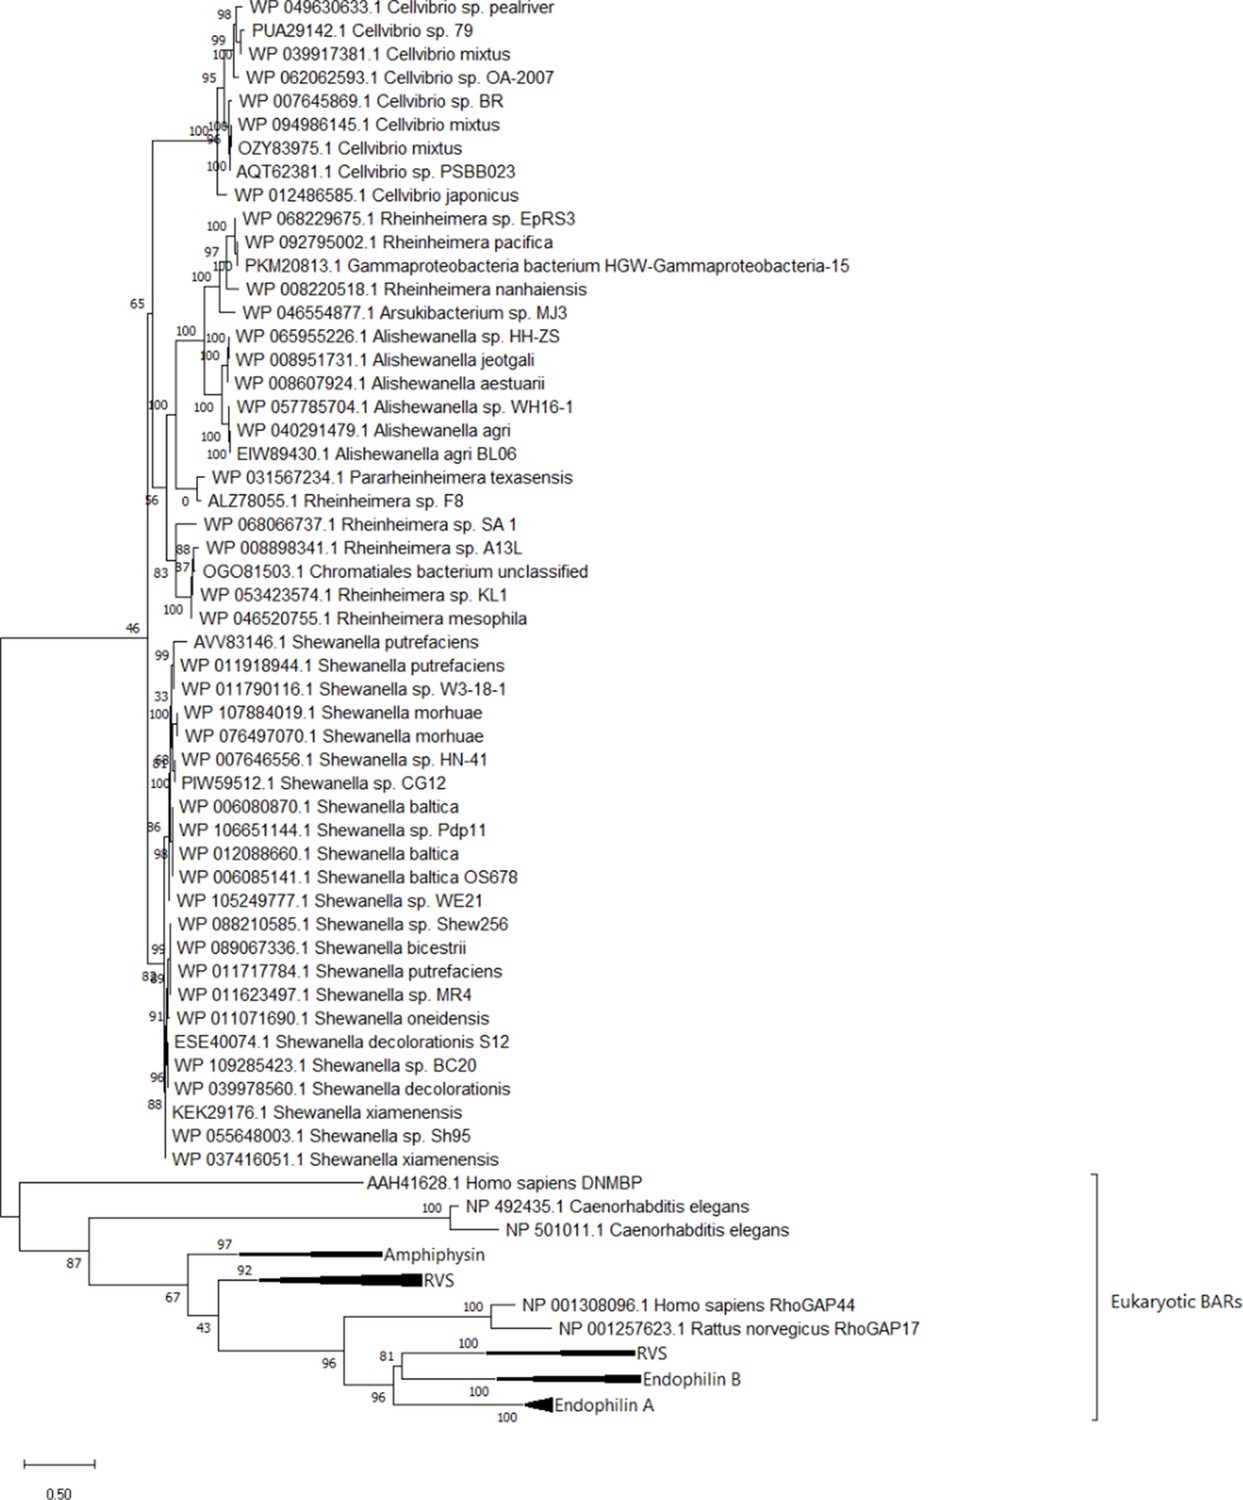
Figure 5 with 1 supplement
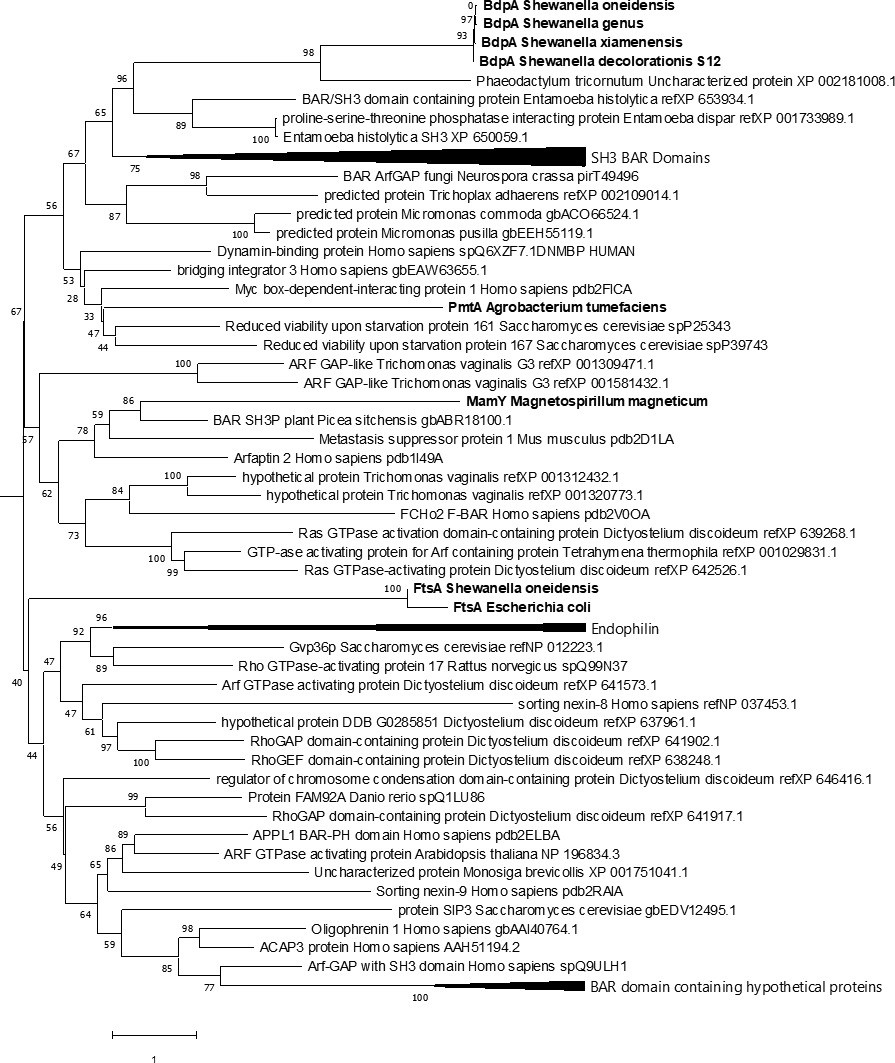
Comparative phylogenetic analysis of BdpA with bacterial homologs, membrane curvature-associated bacterial proteins, and eukaryotic Bin/Amphiphysin/RVS (BAR) domains.
Maximum likelihood evolutionary histories were inferred from 1000 bootstrap replicates, and the percentage of trees in which the taxa clustered together is shown next to the branches. Arrows indicate multiple branches collapsed to a single node. Shewanella oneidensis BdpA and three unique bacterial orthologs (WP_011623497 – unclassified Shewanella, ESE40074 – S. decolorationis S12, KEK29176 – Streptomyces xiamenensis) predicted by the current BAR domain Pfam hidden Markov model (HMM) to contain a BAR domain aligned with representative BAR domains from various BAR domain subtypes (N-BAR, F-BAR, SNX-BAR, I-BAR) at a total of 435 positions. Bacterial proteins are emphasized with bold font. The gamma distribution used to model evolutionary rate differences among sites was 7.24.
Figure 5—figure supplement 1
BdpA has homologs in other bacterial species.
A phylogenetic tree of the 23 Bin/Amphiphysin/RVS (BAR) domain sequences that seed the BAR domain hidden Markov model (HMM) predictions, Shewanella oneidensis BdpA, and conserved BdpA orthologs in other bacteria. The protein regions corresponding to the BdpA BAR domain sequence from the 52 bacterial BdpA orthologs were aligned with the 23 representative eukaryotic BAR domain-containing proteins used to generate the BAR domain consensus sequence (cd07307) at a total of 286 positions. Maximum likelihood evolutionary histories were inferred from 1000 bootstrap replicates, and the percentage of trees in which the taxa clustered together is shown next to the branches. The gamma distribution used to model evolutionary rate differences among sites was 11.9548.
Videos
Video 1
Epifluorescence time course imaging of a single frame of Shewanella oneidensis wild-type (WT) cells during perfusion flow over a 5 hr duration, collecting images at 5 min intervals.
Scale = 5 µm.
Video 2
Epifluorescence time course imaging of ΔbdpA cells during perfusion flow over a 5 hr duration, collecting images at 5 min intervals.
Scale = 5 µm.
Video 3
Epifluorescence imaging of Shewanella oneidensis wild-type (WT) cells 3 hr post-deposition onto the surface of a chambered cover glass.
Images were collected of a single field of view for a 20 s duration. Scale = 5 µm.
Video 4
Epifluorescence imaging of Shewanella oneidensis ΔbdpA cells 3 hr post-deposition onto the surface of a chambered cover glass.
Images were collected of a single field of view for a 20 s duration. Scale = 5 µm.
Video 5
Epifluorescence imaging of Shewanella oneidensis ΔbdpA+ bdpA cells 3 hr post-deposition onto the surface of a chambered cover glass.
Images were collected of a single field of view for a 20 s duration. Scale = 5 µm.
Video 6
Confocal imaging of Shewanella oneidensis MR-1 p452-bdpA cells after 1 hr planktonic induction of BdpA with 12.5 µM DAPG.
Cells with apparent outer membrane extensions (OMEs) can be seen moving through the field of view. Scale = 5 µm.
Tables
Key resources table
| Reagent type (species) or resource | Designation | Source or reference | Identifiers | Additional information |
|---|---|---|---|---|
| Gene (Shewanella oneidensis) | bdpA | GenBank | AE014299.2 | locus tag SO_1507 |
| Strain, strain background (S. oneidensis MR-1) | WT | Myers and Nealson, 1988 | Wild type | |
| Strain, strain background (S. oneidensis MR-1) | WT+ pBBR1-mcs2 | This paper | Wild type with the pBBR1-mcs2 empty vector | |
| Strain, strain background (S. oneidensis MR-1) | WT + bdpA | This paper | Wild type with an extra copy of bdpA in trans under inducible control by DAPG on the p452-bdpA plasmid | |
| Strain, strain background (S. oneidensis MR-1) | ΔbdpA | This paper | bdpA scarless deletion | |
| Strain, strain background (S. oneidensis MR-1) | ΔbdpA + pBBR1-mcs2 | This paper | bdpA knockout strain with the pBBR1-mcs2 empty vector | |
| Strain, strain background (S. oneidensis MR-1) | ΔbdpA+ bdpA | This paper | bdpA scarless deletion with bdpA under inducible control by DAPG in the p452-bdpA plasmid | |
| Strain, strain background (S. oneidensis MR-1) | JG1194 (∆Mtr) | Coursolle and Gralnick, 2010 | S. oneidensis with the extracellular electron transfer pathway proteins deleted (ΔmtrC/ΔomcA/ΔmtrF/ΔmtrA/ ΔmtrD/ΔdmsE/ΔSO4360/ΔcctA/ΔrecA) | |
| Strain, strain background (S. oneidensis MR-1) | JG1194 (∆Mtr)+ pBBR1-mcs2 | This paper | White strain harboring the pBBR1-mcs2 empty vector | |
| Strain, strain background (Marinobacter atlanticus CP1) | CP1 | Bird et al., 2018 | Wild type | |
| Strain, strain background (M. atlanticus CP1) | CP1+ bdpA | This paper | Heterologous expression strain of bdpA under inducible control by DAPG from the p452-bdpA plasmid in M. atlanticus CP1 | |
| Strain, strain background (Escherichia coli) | BL21(DE3) | PMID:3537305 | OneShot E. coli BL21(DE3) | |
| Strain, strain background (E. coli) | BL21+ bdpA | This paper | E. coli BL21(DE3) with bdpA under inducible control by DAPG in the p452-bdpA plasmid | |
| Strain, strain background (E. coli) | UQ950 | Saltikov and Newman, 2003 | Cloning strain | |
| Strain, strain background (E. coli) | BW29427 (WM3064) | Saltikov and Newman, 2003 | Conjugation strain | |
| Recombinant DNA reagent | pBBR1-mcs2 (plasmid) | Kovach et al., 1995 | Empty vector | |
| Recombinant DNA reagent | pBBJM (plasmid) | This paper | Cloning backbone | |
| Recombinant DNA reagent | pSMV3 (plasmid) | Simon et al., 1983 | Suicide vector | |
| Recombinant DNA reagent | pBBJM-452 (plasmid) | Yates et al., 2021; Meyer et al., 2019 | Marionette sensor with yellow fluorescent protein (YFP) under inducible control of DAPG in the pBBR1-mcs2 backbone | |
| Recombinant DNA reagent | pSMV3_1507KO (plasmid) | This paper | Contains up- and downstream regions of open reading frame SO_1507 (bdpA) | |
| Recombinant DNA reagent | p452-bdpA (plasmid) | This paper | DAPG inducible bdpA in the pBBJM-452 plasmid instead of YFP | |
| Sequence-based reagent | pAJMF2 | This paper | PCR primers | TTAACGCGAATTTTAACAAAATATTAACGC cccgcttaacgatcgttggctg |
| Sequence-based reagent | pAJMR3 | This paper | PCR primers | AGCGGATAACAATTTCACACAGGAAACAGC Tacctcagataaaatatttgc |
| Sequence-based reagent | pBBRF3 | This paper | PCR primers | gggctcatgagcaaatattttatctgaggt AGCTGTTTCCTGTGTGAAATTG |
| Sequence-based reagent | pBBRR2 | This paper | PCR primers | acccgcgctcagccaacgatcgttaagcggg GCGTTAATATTTTGTTAAAATTCGC |
| Sequence-based reagent | 1507 F_insert | This paper | PCR primers | ttaatactagagaaagaggggaaatactag ATGCGCACCGCTGC |
| Sequence-based reagent | 1507 R_insert | This paper | PCR primers | gaggcctcttttctggaatttggtaccgagC TACATAAAGGCTTTAGTAAAGGCTT |
| Sequence-based reagent | BBJMV_reverse | This paper | PCR primers | CAGCATTGAGATGACTGCAGCGGTGCGCAT ctagtatttcccctctttctctagtat |
| Sequence-based reagent | BBJMV_forward | This paper | PCR primers | AAGGAAGCCTTTACTAAAGCCTTTATGTAG ctcggtaccaaattccagaaaag |
| Sequence-based reagent | pSMV3_R | This paper | PCR primers | GCTAATCCAAAGGGAAACACCACA ATAAACGATCCCCCGGGCTG |
| Sequence-based reagent | pSMV3_F | This paper | PCR primers | Caagacattattgaaattaagcaaagcacacactagttctagagcggccg |
| Sequence-based reagent | bdpAUpstream1kb_F | This paper | PCR primers | tgatatcgaattcctgcagcccgggggatcgtttattgtggtgtttccctttgga |
| Sequence-based reagent | bdpAUpstream1kb_R | This paper | PCR primers | AAGCCCAGTAAACCTTTCTATAACAAGTCGAAAAGCCT CATAAAACATAAATAACATACGAAG |
| Sequence-based reagent | bdpAdwnstream1kb_F | This paper | PCR primers | cgtatgttatttatgttttatgaggcttttcgacttgttatagaaaggtttactggg |
| Sequence-based reagent | bdpAdwnstream1kb_R | This paper | PCR primers | ACCGCGGTGGCGGCCGCTCTAGAACTAGTGTGTGC TTTGCTTAATTTCAATAATGTCTTG |
| Other | FM 4–64 | Invitrogen | T13320 | (0.25 µg/mL) |
Additional files
-
Supplementary file 1
Protein enrichment within the outer membrane vesicle (OMV) proteome relative to the proteome of the Shewanella oneidensis outer membrane (OM).
- https://cdn.elifesciences.org/articles/60049/elife-60049-supp1-v2.xlsx
-
Supplementary file 2
Alignment of BdpA homologs with bacterial membrane curvature associated proteins and eukaryotic Bin/Amphiphysin/RVS (BAR) domains.
- https://cdn.elifesciences.org/articles/60049/elife-60049-supp2-v2.docx
-
Transparent reporting form
- https://cdn.elifesciences.org/articles/60049/elife-60049-transrepform1-v2.docx
Download links
A two-part list of links to download the article, or parts of the article, in various formats.
Downloads (link to download the article as PDF)
Open citations (links to open the citations from this article in various online reference manager services)
Cite this article (links to download the citations from this article in formats compatible with various reference manager tools)
A bacterial membrane sculpting protein with BAR domain-like activity
eLife 10:e60049.
https://doi.org/10.7554/eLife.60049


