Novel cell types and developmental lineages revealed by single-cell RNA-seq analysis of the mouse crista ampullaris
- Department of Biological Structure, University of Washington, United States
- Institute for Stem Cells and Regenerative Medicine, University of Washington, United States
- Department of Biochemistry, University of Washington, United States
Figures
Figure 1
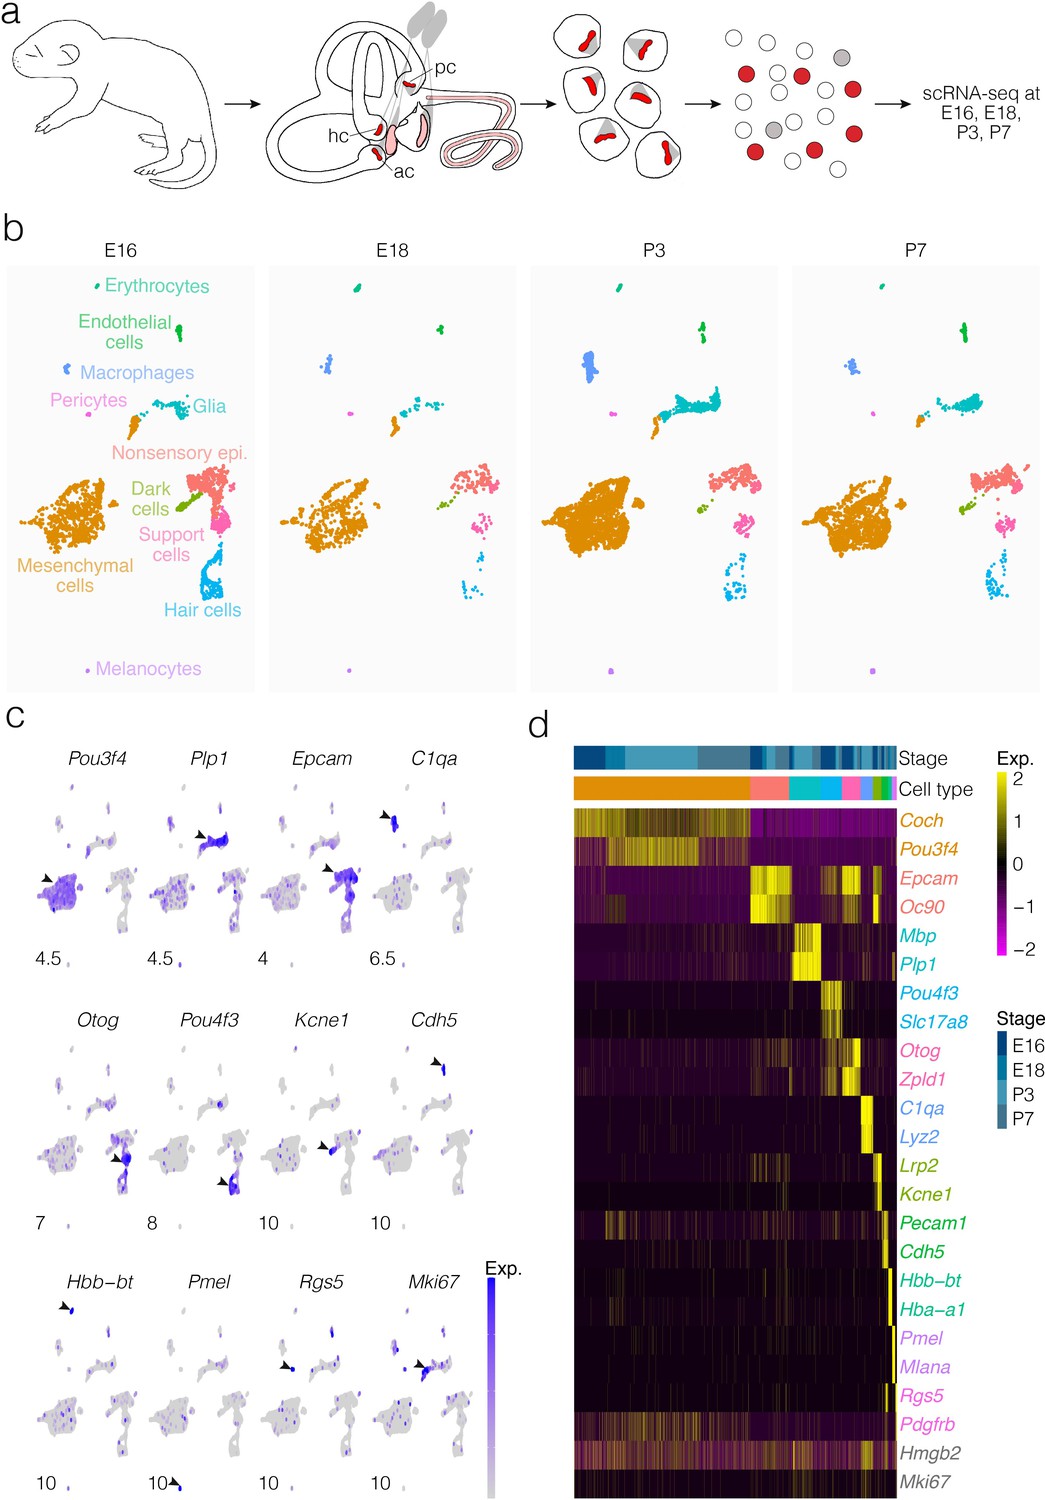
Cellular diversity in the crista ampullaris.
(a) Cristae, including the ampullae, were dissected from E16, E18, P3, and P7 mice, then dissociated for single-cell RNA-seq (scRNA-seq) analysis of cell types and gene expression. (b) UMAP of batch-corrected scRNA-seq datasets from E16, E18, P3, and P7 crista ampullaris. (c) Expression of known marker genes in each of the major cell groups detected by scRNA-seq and the G2/M maker Mki67. (d) Heatmap showing additional known markers. ac, anterior crista; hc, horizontal crista; pc, posterior crista.
Figure 2 with 7 supplements
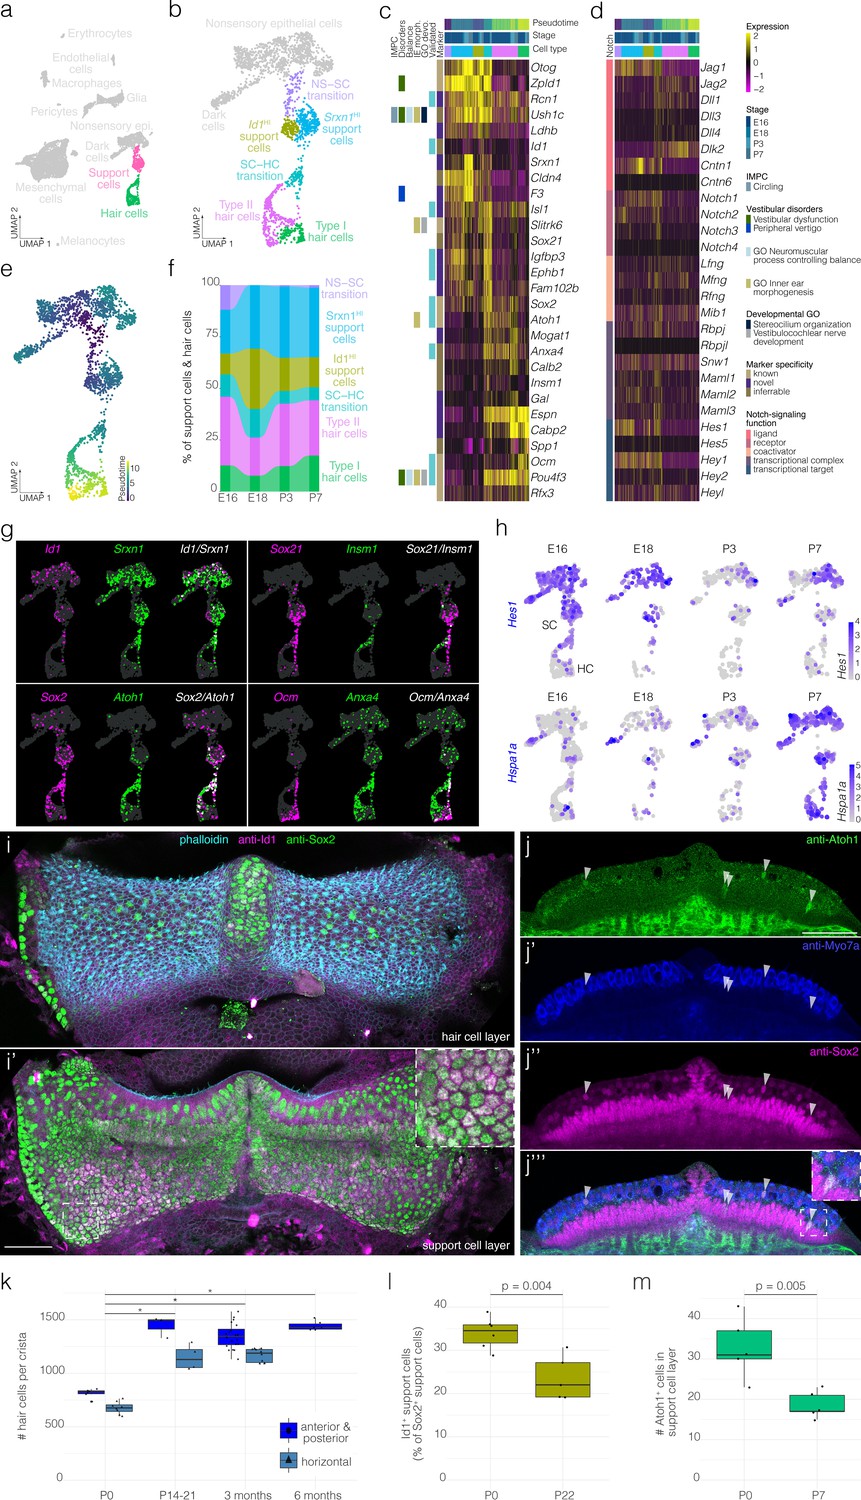
Hair cell and support cell subtypes and dynamics during development.
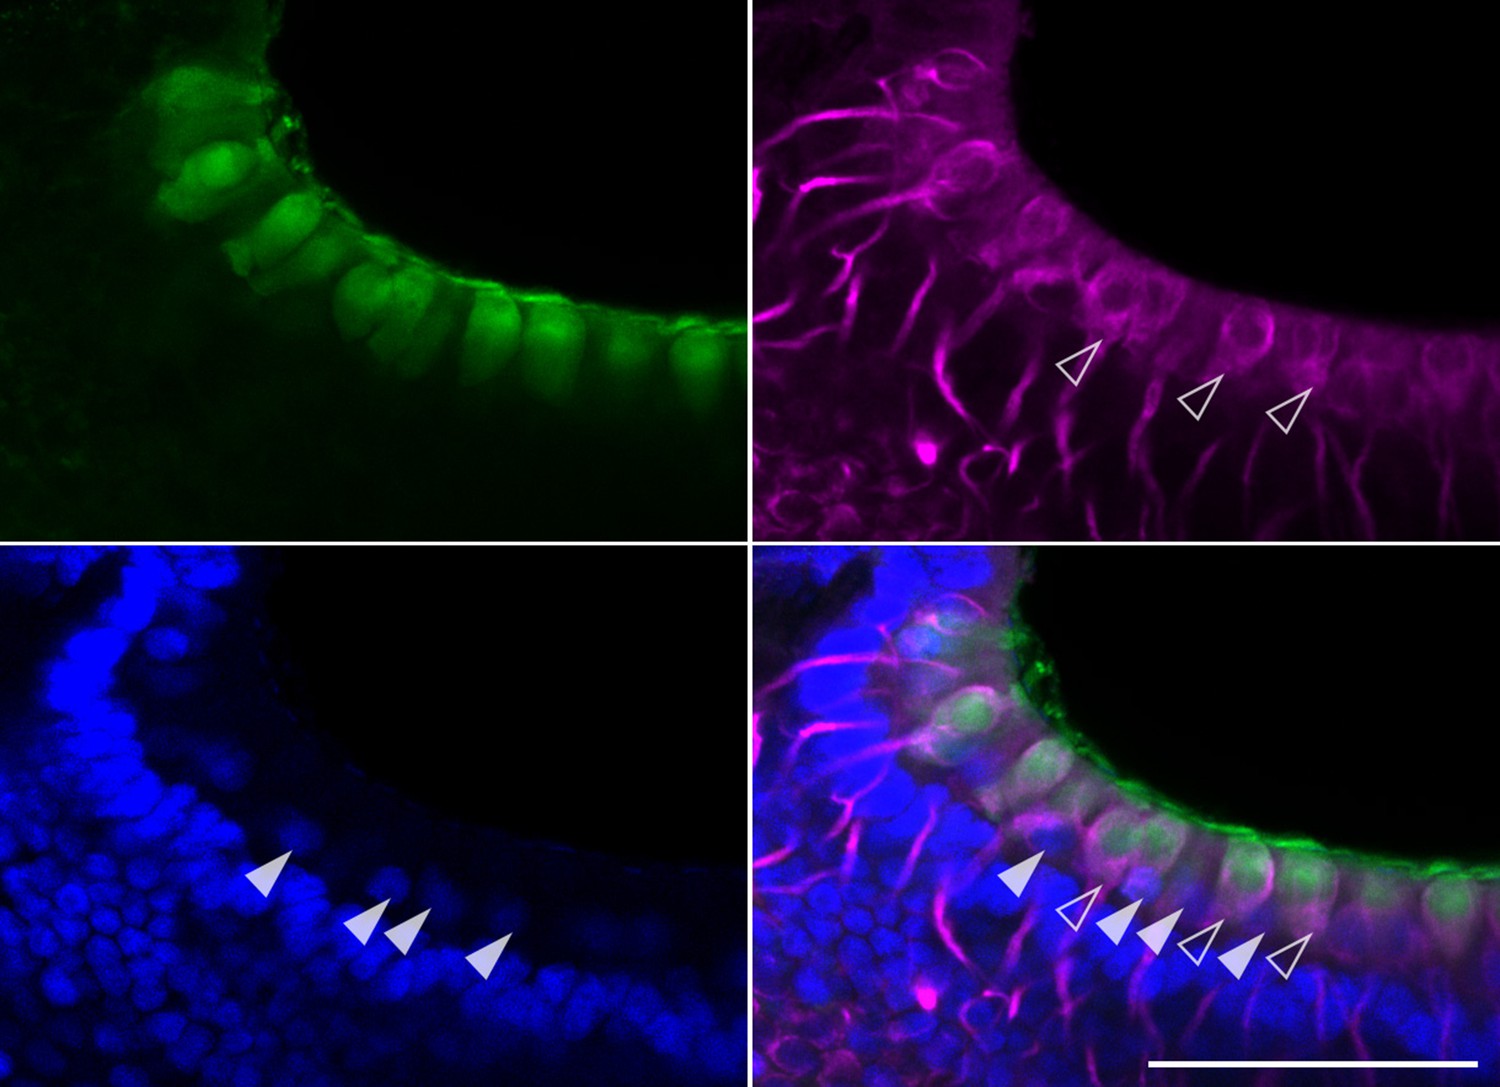
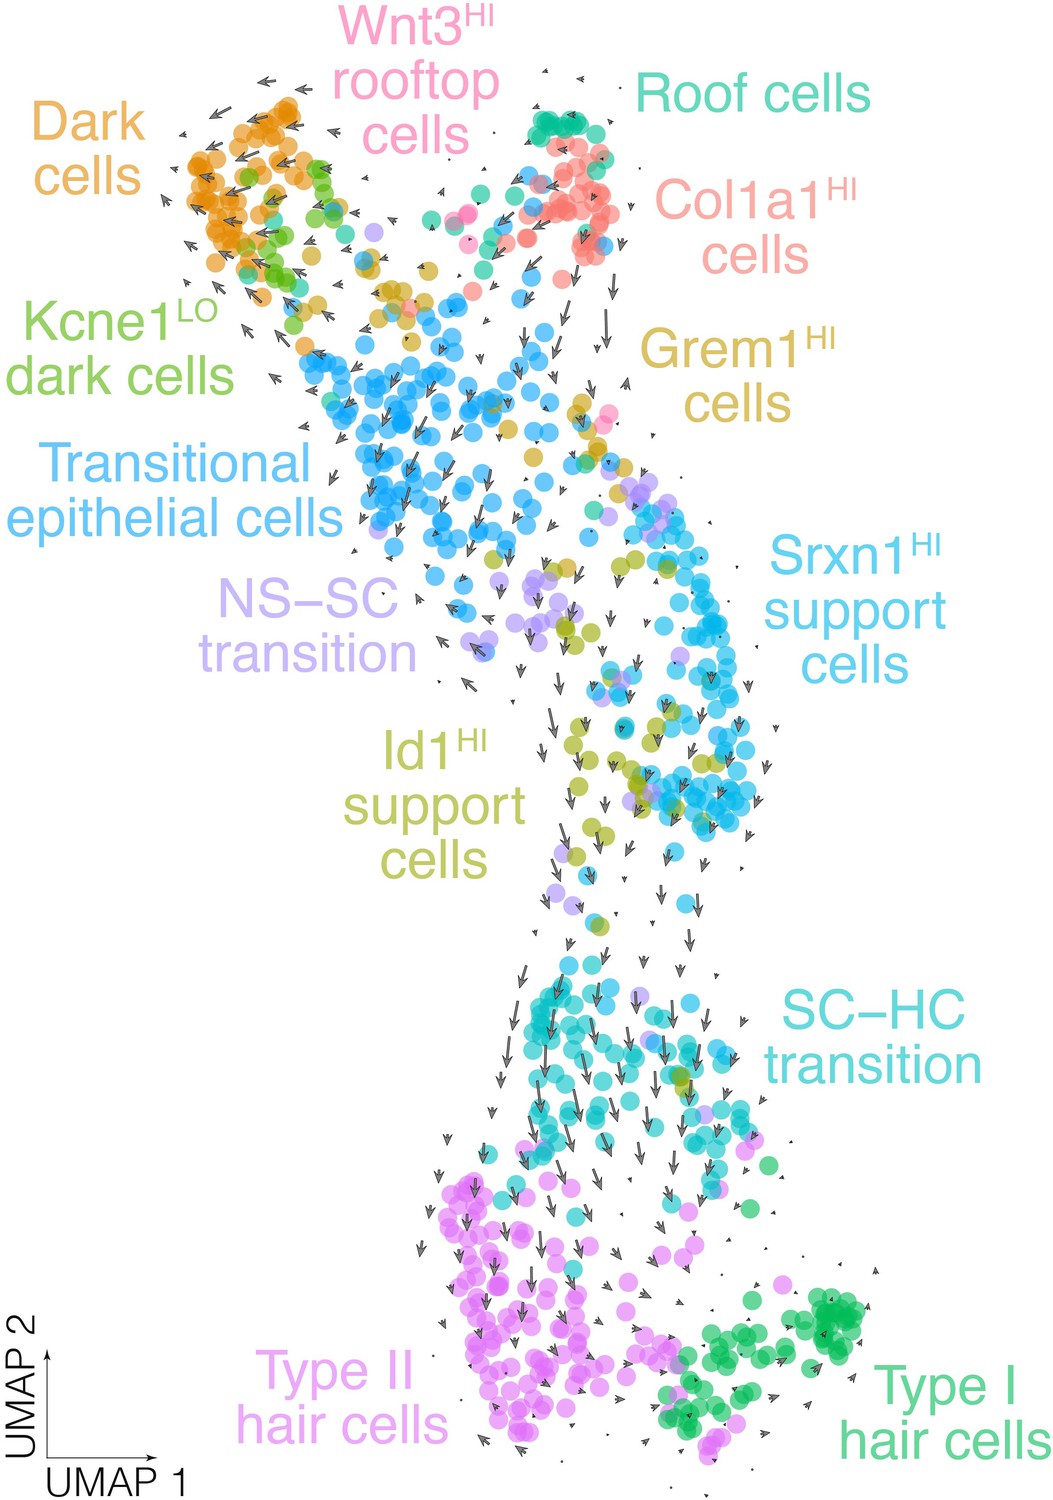
(a) Highlights the position of support cells and hair cells in UMAP space relative to the whole dataset (i.e. E16, E18, P3, and P7 combined). (b) Cluster analysis in support cells and hair cells. (c and d) show expression of markers and Notch pathway genes, respectively, relative to cell cluster, pseudotime and developmental time. Additional color bars indicate whether markers are known or novel in specificity, implicated in vestibular diseases and dysfunction or in the Notch pathway. (e) Pseudotime of the support cell–hair cells trajectory in cristae. Note that the trajectory between support cells and hair cells is continuous. (f) The relative contributions of support cell and hair cell subtypes to the composition of the support cell and hair cell clusters at the indicated developmental stages. Note that the contribution of the Id1HI support cell subtype decreases as that of Srxn1HI support cell subtype and hair cells increases. (g) ‘Blendplots’ show the overlap of marker specificity in UMAP. (h) shows differential expression of the Notch target Hes1 and the Hsp70 component Hspa1a across developmental stages in the support cell clusters. (i) Id1 (magenta) localization in a subset of Sox2+ (green) support cells in P0 B6 crista relative to phalloidin (cyan). (j) Atoh1 (green), Myo7a (blue) and Sox2 (green) IF in optical sections of P0 B6 mouse crista. Arrowheads indicate Atoh1+/Sox2+ nuclei in the support cell layer. (k) Hair cell counts made manually in whole B6 cristae at P0 (n = 15), P14-21 (n = 7), 3 months (n = 30), and 6 months (n = 6). Note the addition of ~500 hair cells. Asterisks indicate p<1×10⁻⁷. (l) The Id1+ percentage of Sox2+ support cells at P0 (n = 6) and P22 (n = 5). (m) The number Atoh1+ cells in the Sox2+ support cell layer per crista at P0 (n = 5) and P7 (n = 5). Scale bars = 50 μm.
Figure 2—figure supplement 1
Oncomodulin immunofluorence in type I hair cells of the crista ampullaris.
IF for oncomodulin (green), neurofilament medium (magenta) and Sox2 (blue) in a vibratome section of P3 B6 crista. Open arrowheads indicate calyx-type synapses of type I hair cells. Closed arrowheads indicate Sox2+ nuclei of type II hair cells. Scale bar = 100 μm.
Figure 2—figure supplement 2
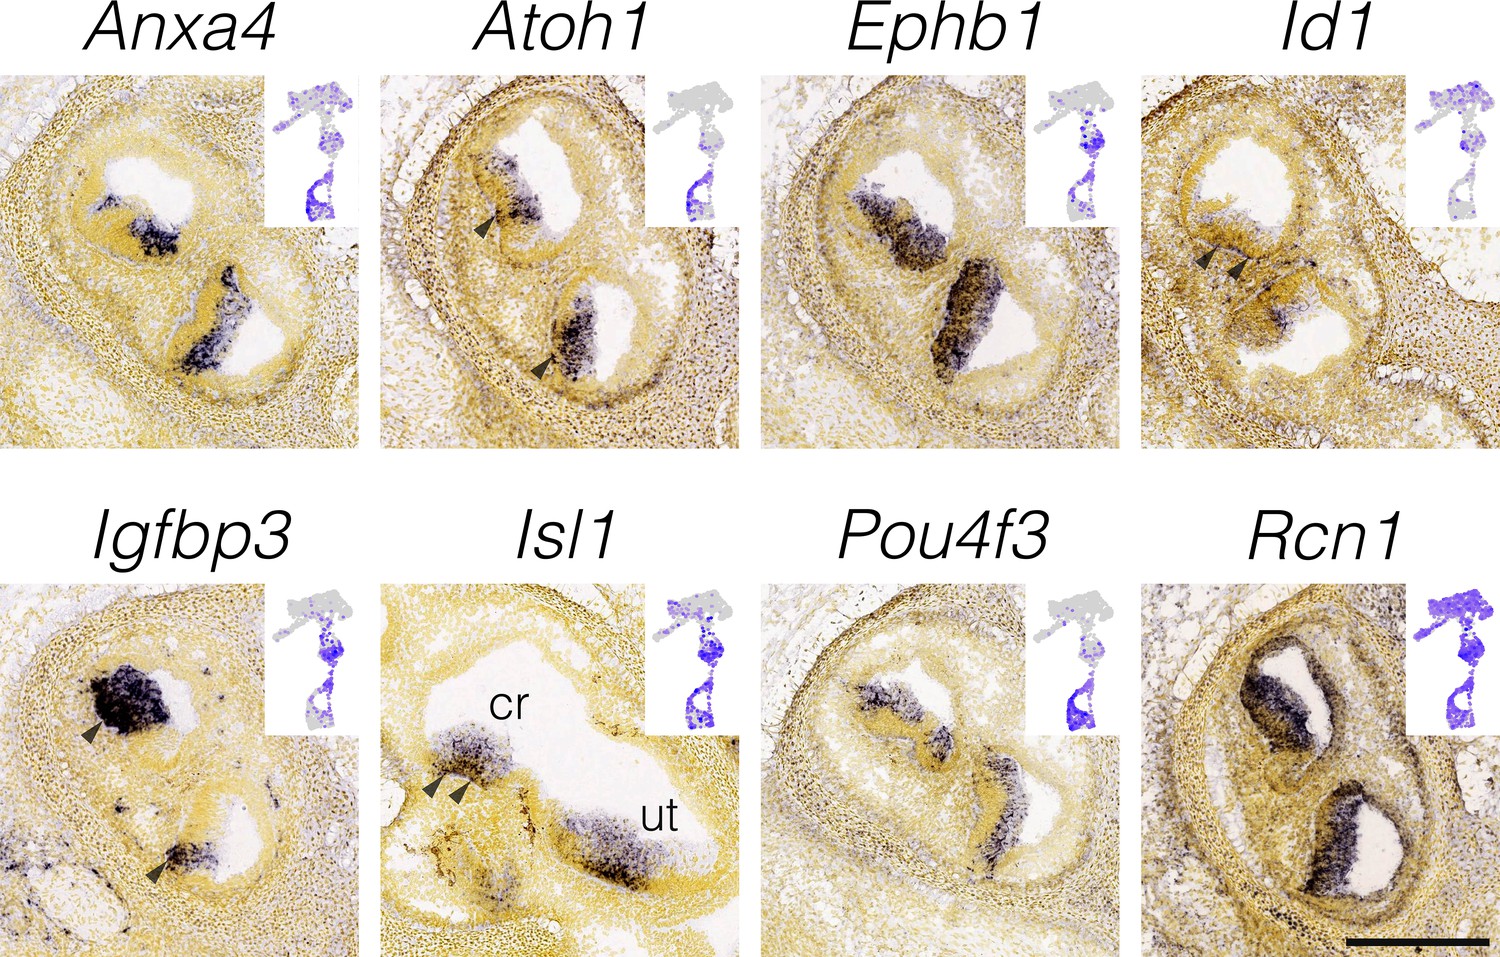
Localization of hair cell and support cell markers.
RNA in situ hybridization data from the Allen Developing Mouse Brain Atlas is shown for cluster-specific markers in E15.5 cristae (Isl1 is E16.5). Insets show the cluster specificity in UMAP. Note the expression of the type II hair cell marker Anxa4 throughout the hair cell layer at E15.5. Arrowheads indicate expression in the support cell layer. Scale bar = 300 μm.
Figure 2—figure supplement 3
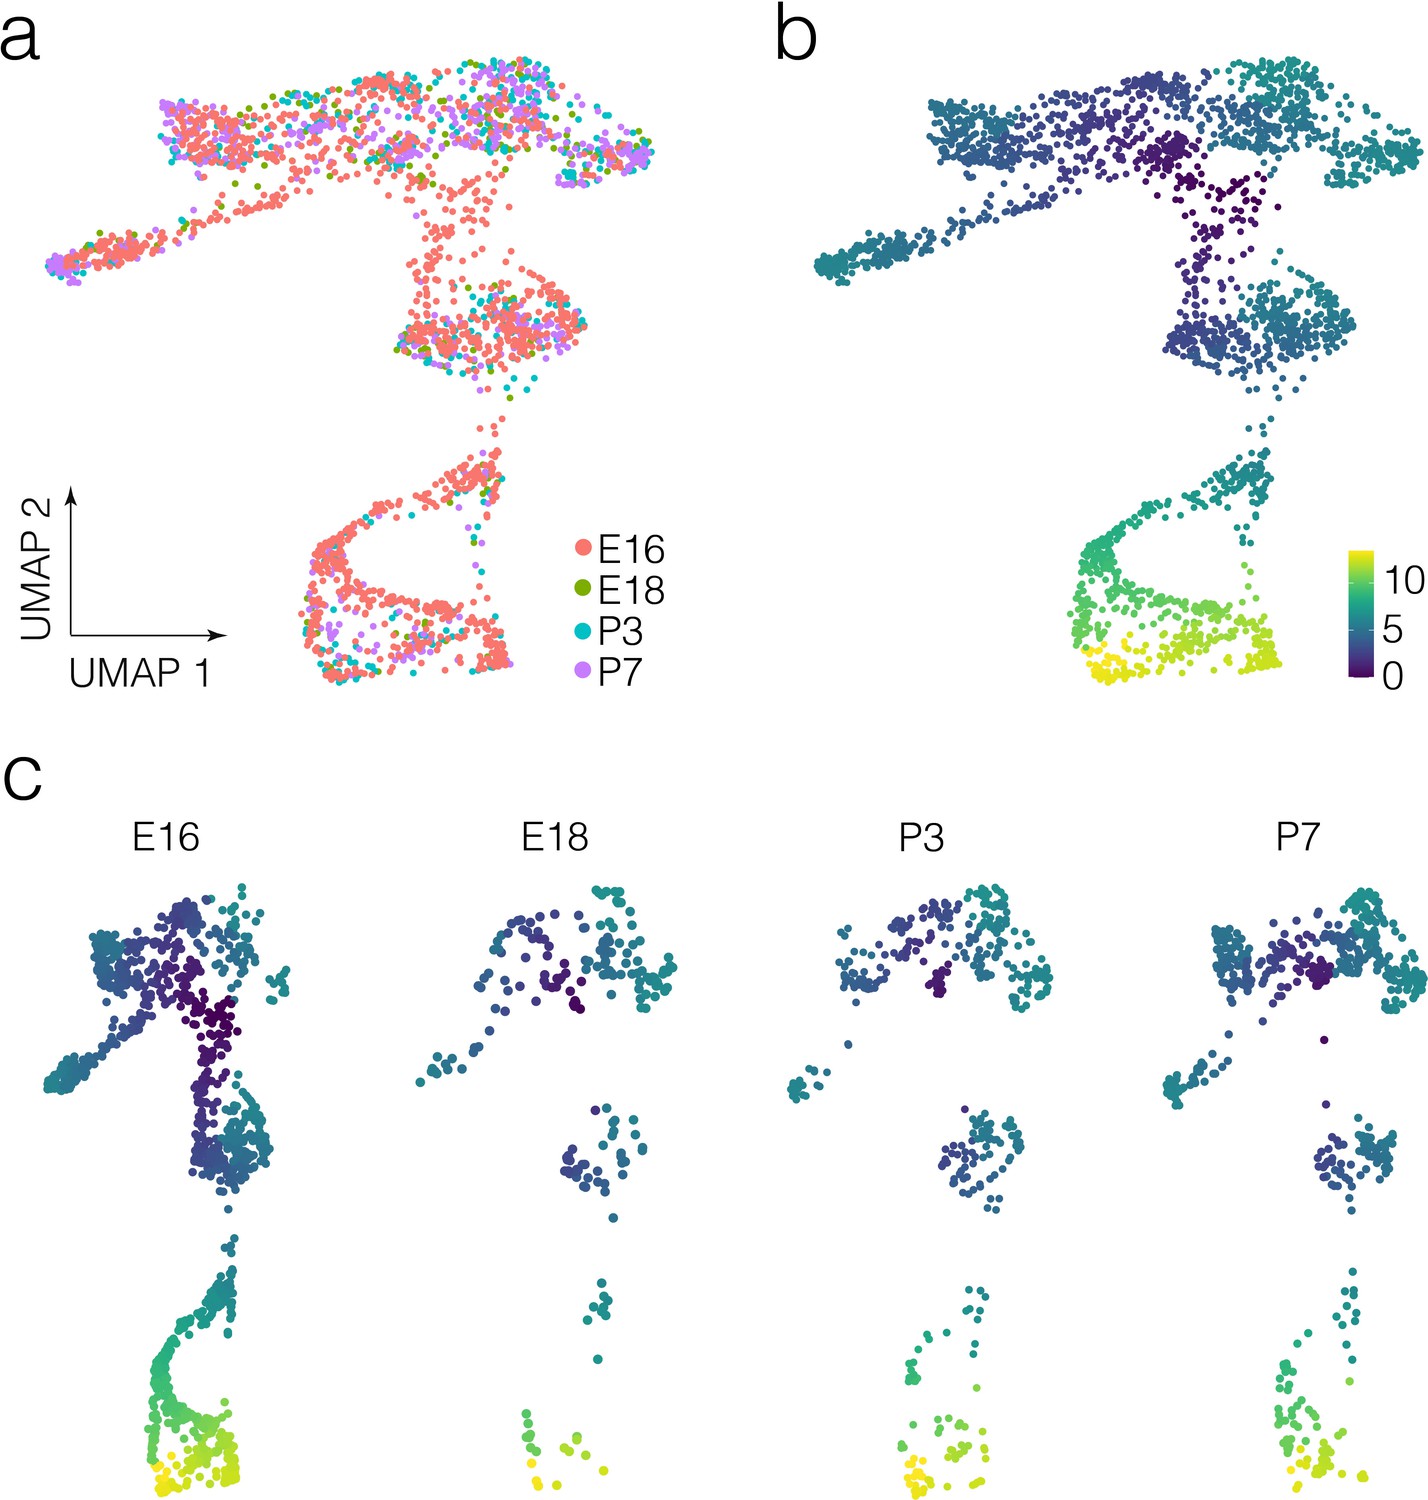
Developmental stage and pseudotime in crista epithelial cells.
(a and b) show developmental stage and pseudotime on UMAP in cells from the whole dataset, respectively. (b) Is replicated from Figure 2e for easy comparison with (a). (c) shows pseudotime in cell on UMAP for each developmental stage analyzed.
Figure 2—figure supplement 4
RNA velocity analysis in crista epithelial cells.
Arrows show the RNA velocity (i.e. the rate and direction of transcriptomic change as indicated by the ratio of unspliced:spliced transcripts La Manno et al., 2018) in UMAP of batch-corrected scRNA-seq datasets from E16, E18, P3, and P7 crista ampullaris.
Figure 2—figure supplement 5
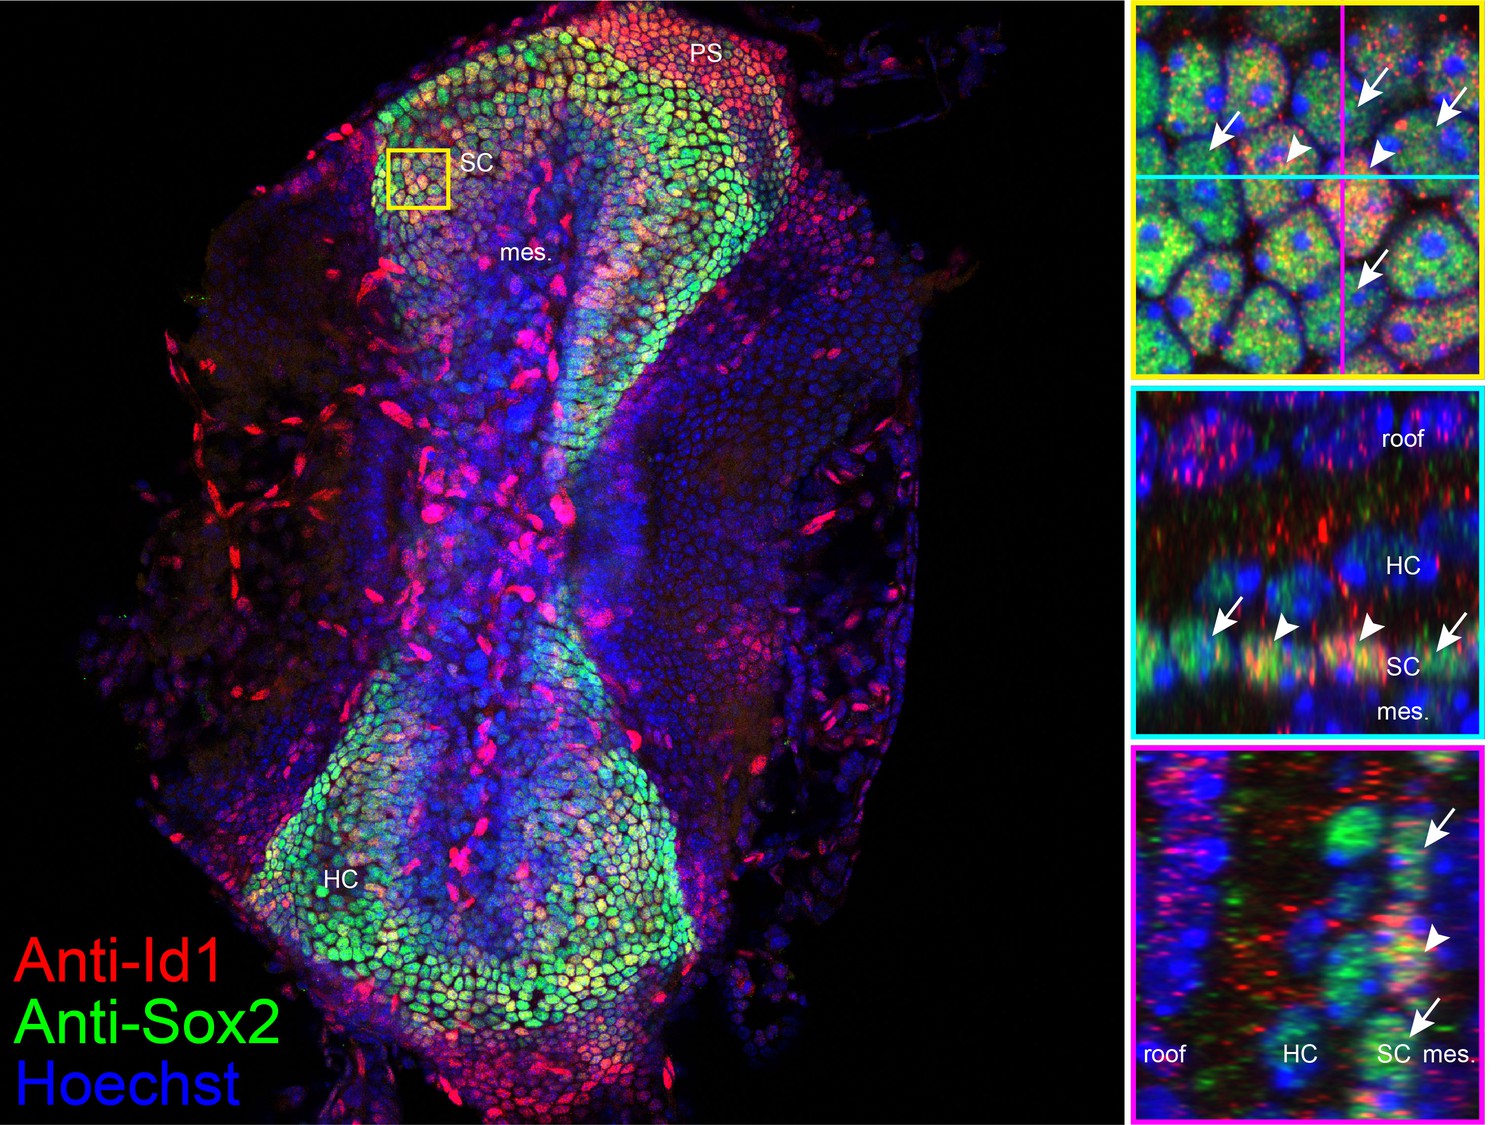
Localization of anti-Id1 in crista.
(a) Id1 (red) localization in a subset of Sox2+ (green) support cell nuclei in optical sections of P4 Hes5-GFP crista counterstained with Hoecsht 33342 (blue). Hi magnification images in the region indicated in yellow show that anti-Id1 foci are more plentiful in a subset of Sox2+ support cell nuclei and absent from hair cell nuclei. Endothelial cells within the mesenchyme show intense Id1 immunofluorescence.
Figure 2—figure supplement 6
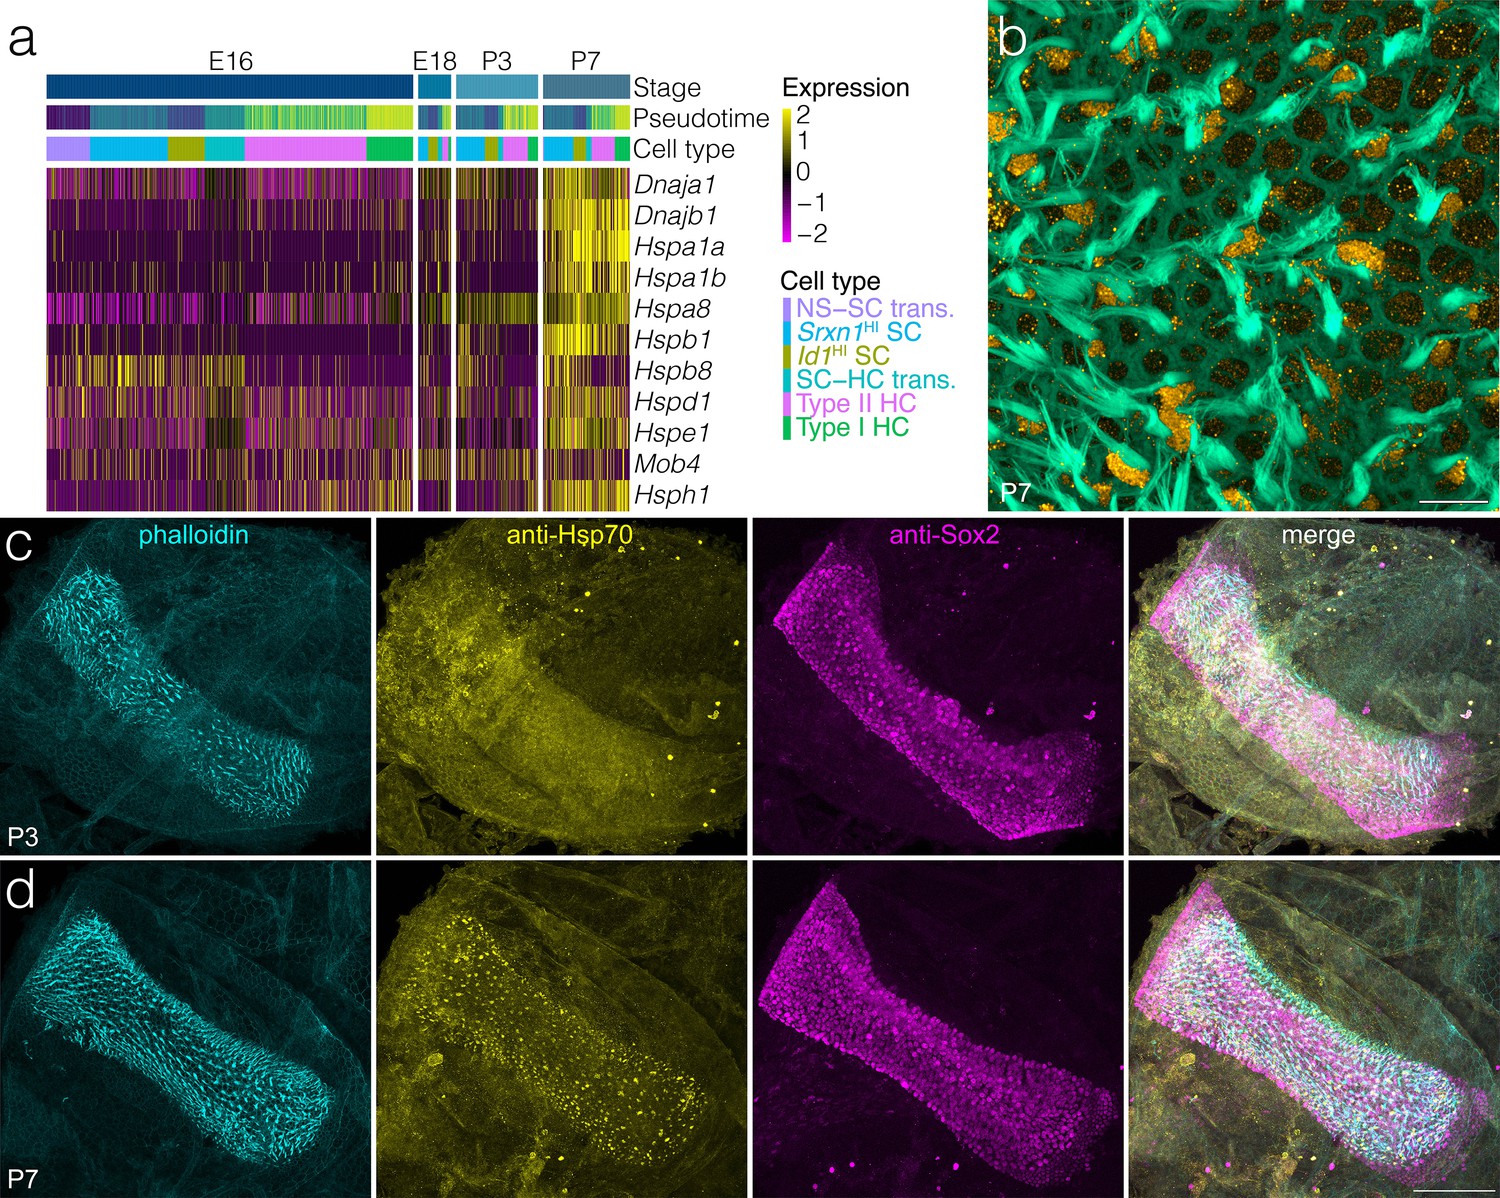
Heat-shock pathway dynamics during support cell development.
(a) Shows expression of heat shock response genes relative to support cell and hair cell clusters, pseudotime and developmental time. Note that most Hsp- and Dnaj- genes increase at P7. (b) Shows foci of inducible Hsp70 IF adjacent to phalloidin-stained hair bundles extending to the apical surface of some supporting cells in P7 crista. Scale bar = 10 μm (c) Shows that IF for inducible Hsp70 increases by P7 relative to P3. Scale bar = 100 μm.
Figure 2—figure supplement 7
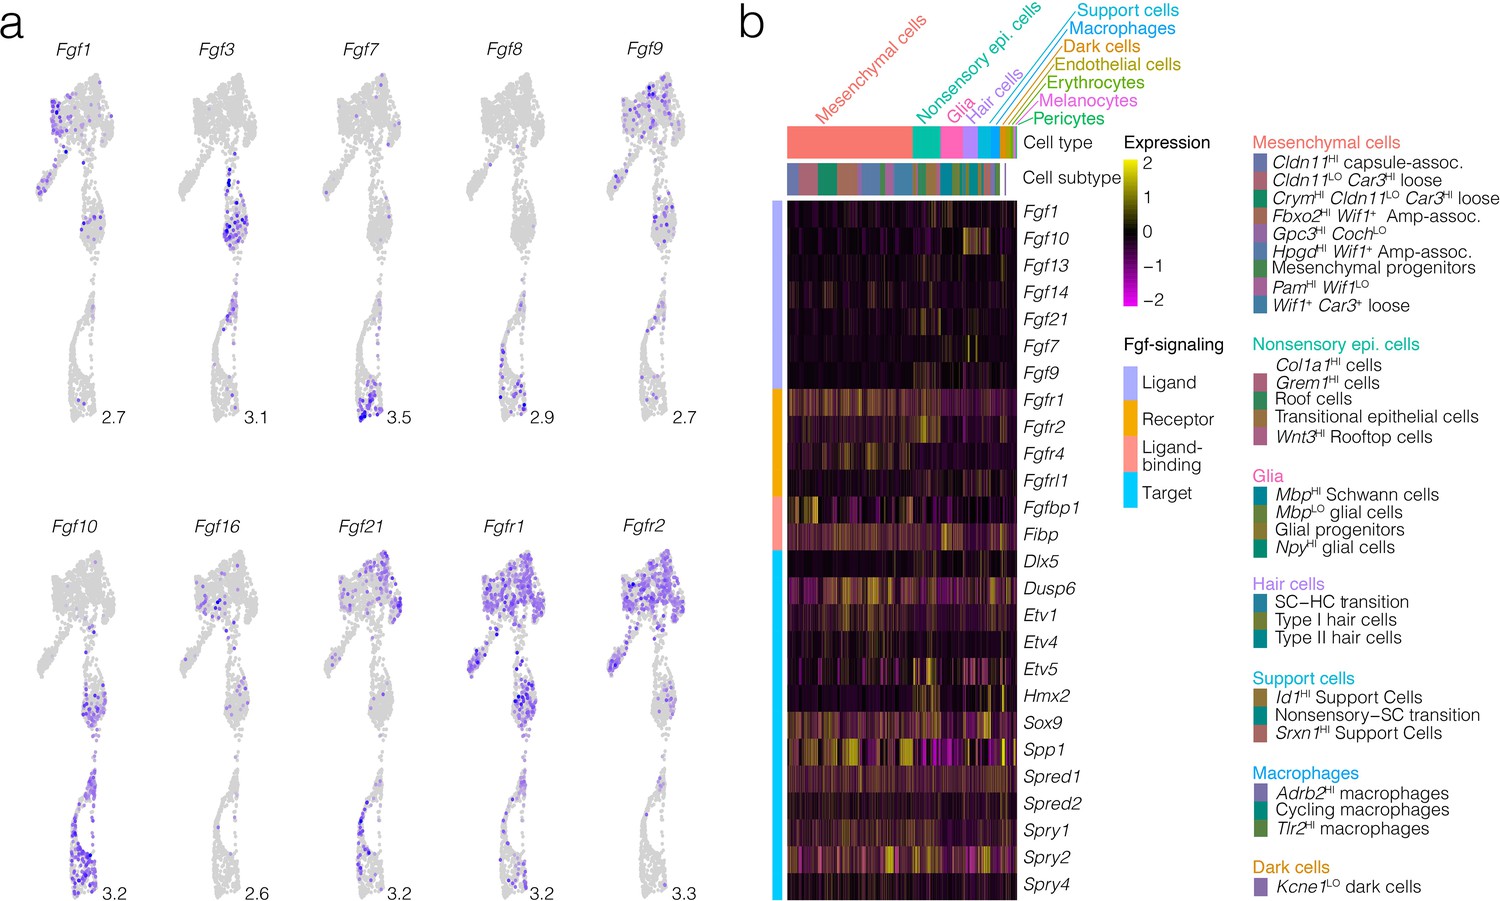
Fgf pathway in the developing crista ampullaris.
(a) Shows the expression of Fgf ligands and receptors in UMAP of the crista epithelium. Maximum expression is shown at lower right of each UMAP panel. In (b), The expression of Fgf ligands, receptors, binding proteins, and targets in the developing crista ampullaris is visualized by heatmap.
Figure 3 with 2 supplements
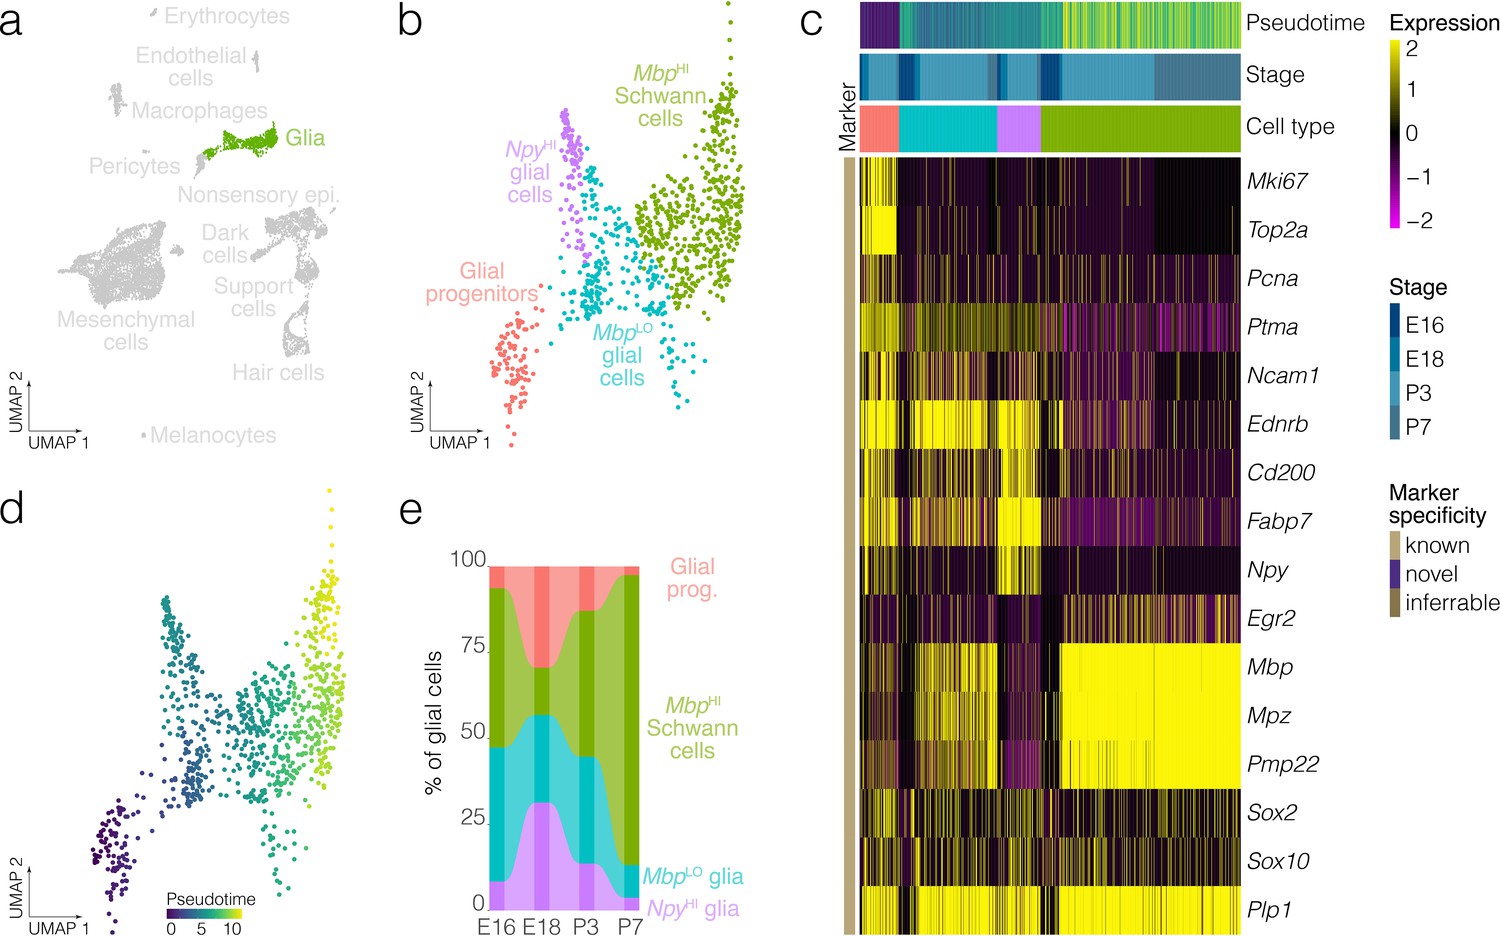
Glial cell diversity and dynamics.
(a) Highlights the position of glial cells in UMAP space relative to the whole dataset. (b) Cluster analysis in glia. (c) Expression of markers relative to cell cluster, developmental stage and pseudotime. (d) Pseudotime of the developmental trajectory in glia. (e) The relative contributions of cell clusters to the composition of glia at the indicated developmental stages. Note that Schwann cells and myelinating cell markers increase with the developmental time.
Figure 3—figure supplement 1
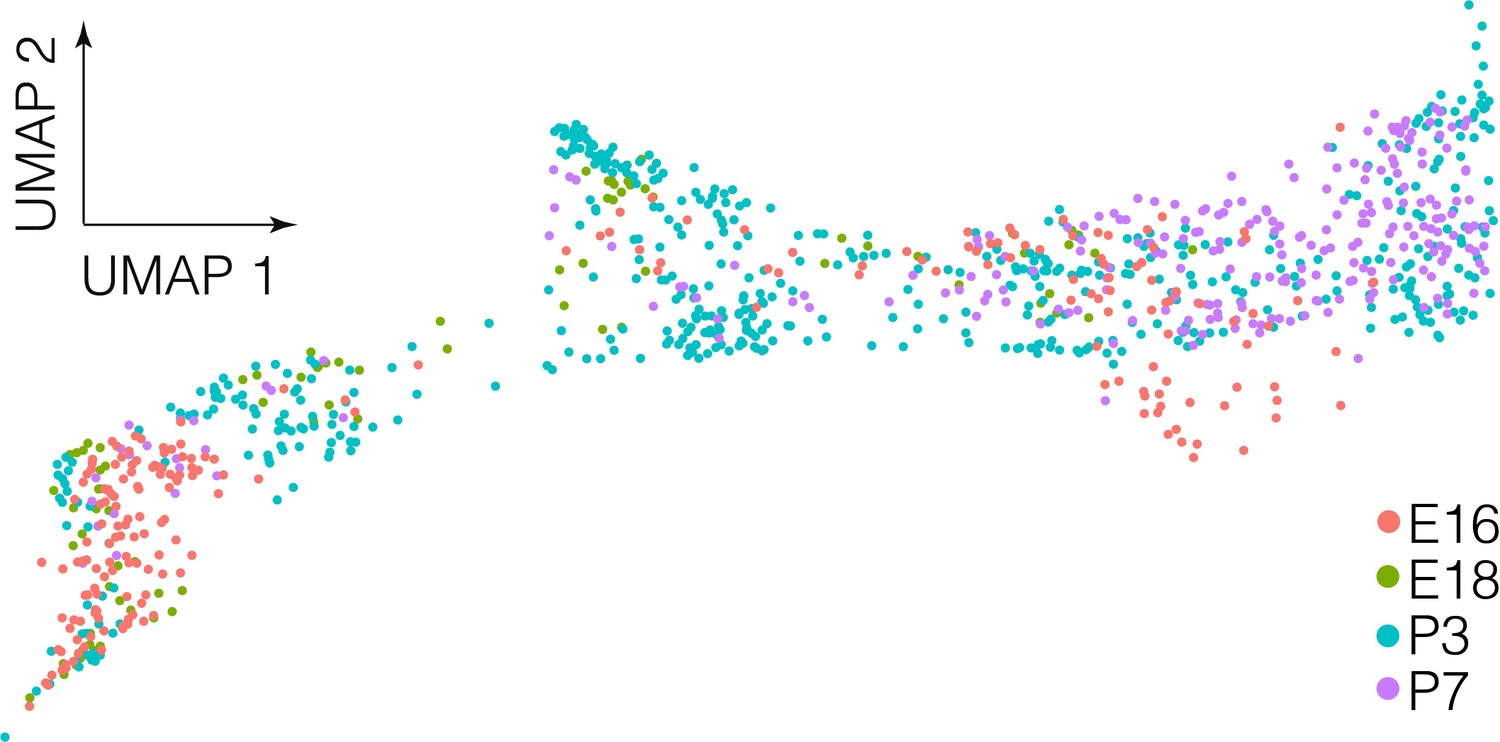
Developmental stage relative to UMAP in crista glial cells.
Glial cells in the whole dataset shown in UMAP with color-coding by developmental stage.
Figure 3—figure supplement 2
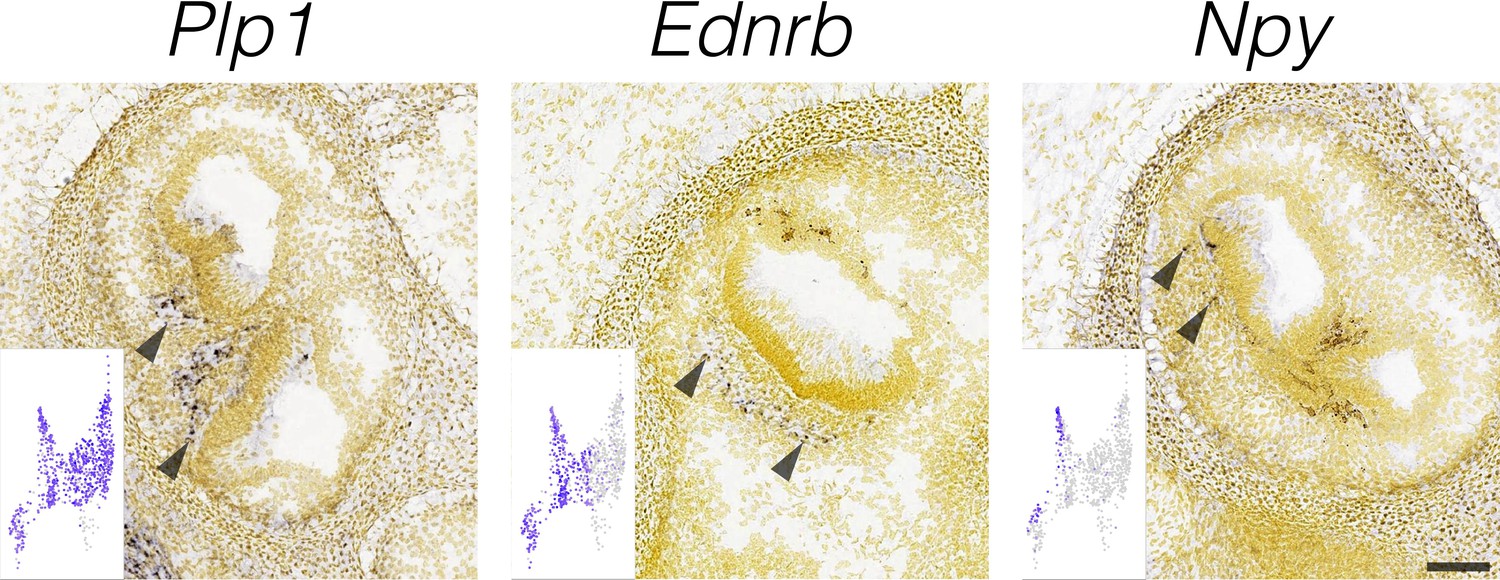
Localization of glial cell markers.
RNA in situ hybridization data from the Allen Developing Mouse Brain Atlas is shown for cluster-specific markers in E15.5 cristae. Insets show the cluster specificity in UMAP. Arrowheads indicate RNA ISH signal in the approximate localization of the crista nerve fibers. Scale bar = 100 μm.
Figure 4 with 1 supplement
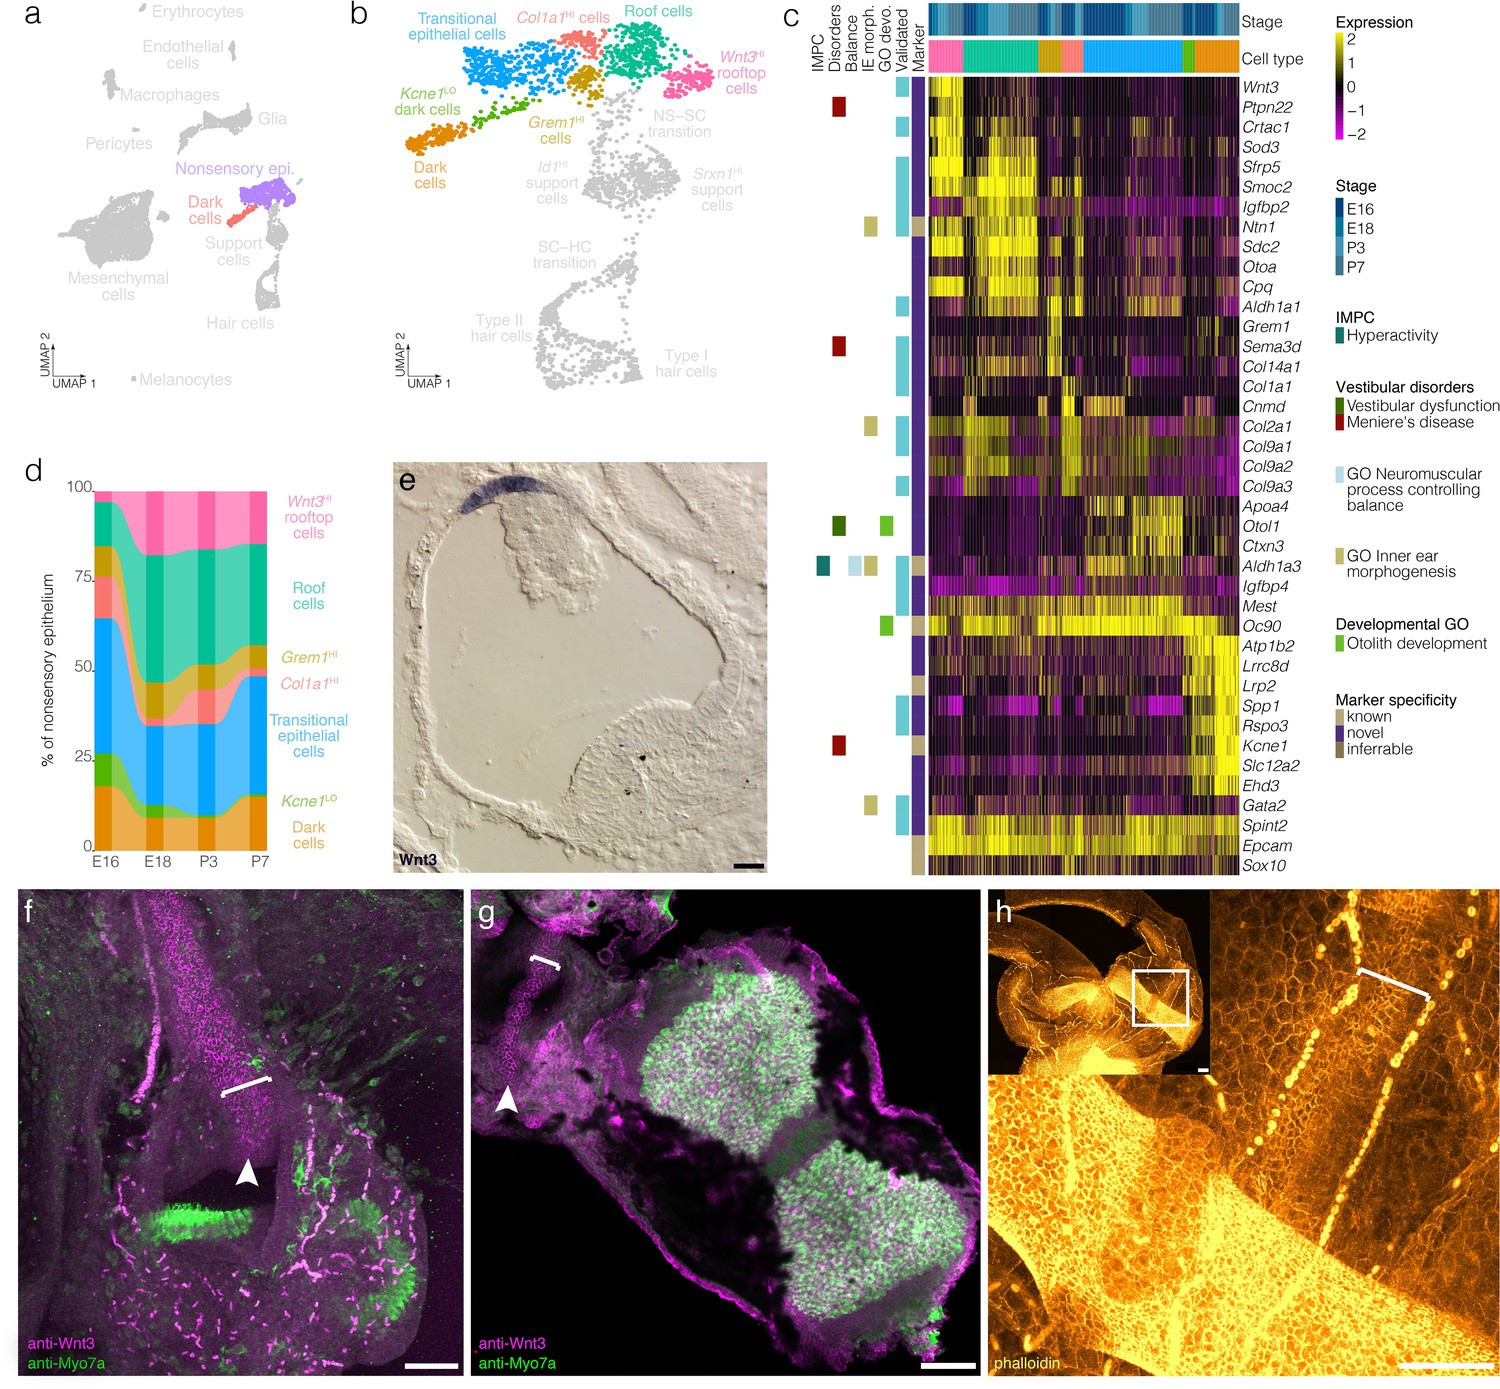
Cellular diversity in the nonsensory ampulla epithelium.
(a) Highlights the position of the nonsensory epithelial cells of the ampulla in UMAP space relative to the whole dataset. (b) Cluster analysis in nonsensory ampulla epithelium. (c) Expression of markers relative to cell cluster and developmental time. Additional color bars indicate whether markers are known or novel in specificity or implicated in vestibular diseases and dysfunction. (d) The relative contributions of cell clusters to the nonsensory ampulla epithelium at the indicated developmental ages. (e) Wnt3 RNA ISH localizes to a distinct population of cells in top of the roof of the P1 Swiss Webster ampulla. (f) Wnt3 IF in vibratome-sectioned crista localizes to the top of the roof of the P0 B6 ampulla and extends into the semicircular canal. (g) Wnt3 IF in a whole mount P7 B6 crista bisected to show the apical surface of the rooftop en face. (h) Phalloidin staining in P3 B6 ampulla whole mount. Note that roof cells in the Wnt3+ domain are smaller than surrounding epithelial cells. Brackets in f–g indicate the Wnt3+ rooftop domain. Scale bars = 50 μm.
Figure 4—figure supplement 1
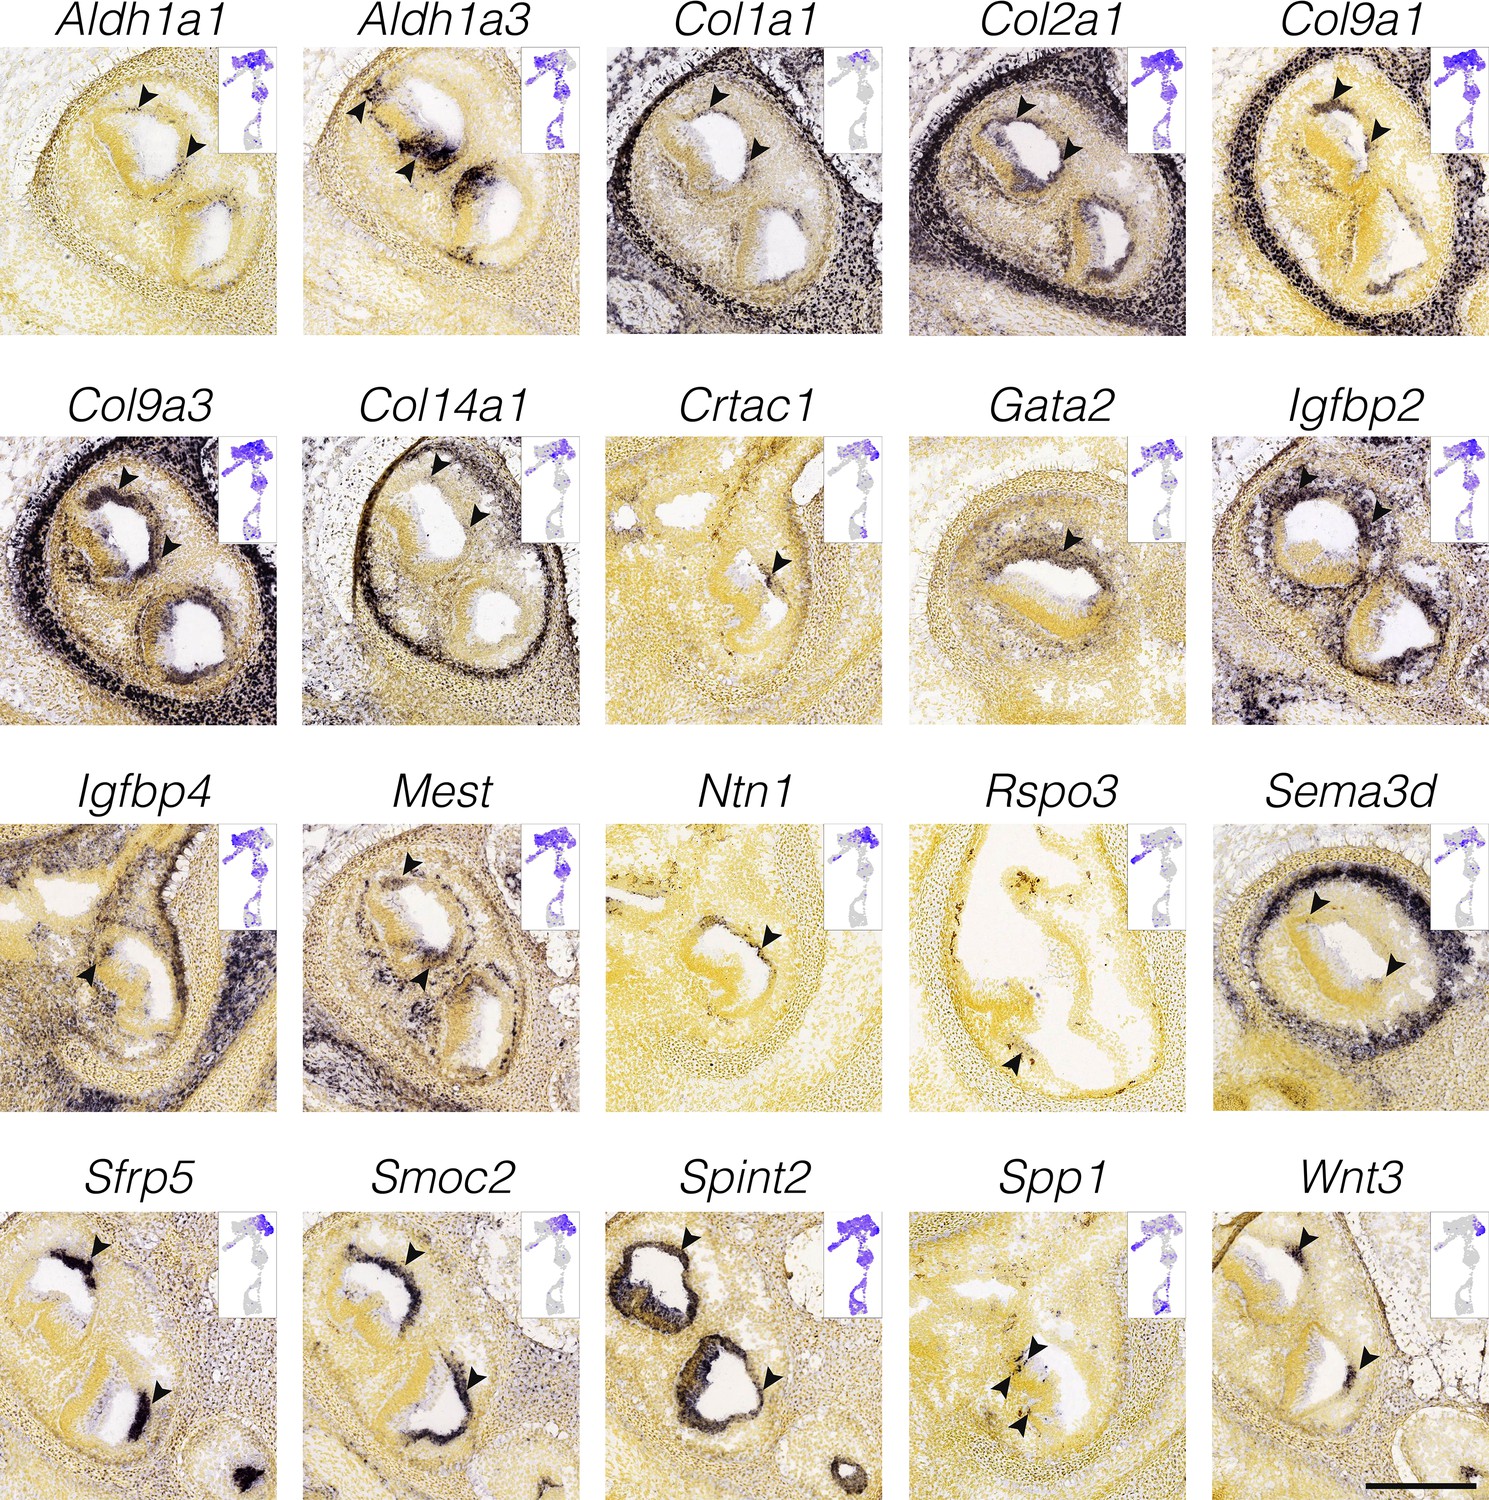
Localization of cluster-specific markers in nonsensory ampulla epithelium.
RNA in situ hybridization data from the Allen Developing Mouse Brain Atlas is shown for cluster-specific markers in E15.5 cristae. Insets show the cluster specificity in UMAP. Arrowheads indicate expression in the ampulla epithelium. Dark cells are few at E15.5. Scale bar = 300 μm.
Figure 5 with 2 supplements

Mesenchymal cell diversity and dynamics.
In (a), Labeling of endogenous IgG (white) in a vibratome section of E15.5 posterior crista demonstrates the region of loose mesenchyme (bracket) bounded by regions of dense mesenchyme proximal to the ampulla epithelium and the otic capsule cartilage. Iba1 (blue) and Pecam1 (green) IF demonstrate the macrophages and endothelial cells, respectively, present in the otic mesenchyme. (b) Highlights the position of mesenchymal cells in UMAP space relative to the whole dataset. Mesenchymal progenitors expressing both G2/M and mesenchymal markers group closely to proliferating glia in UMAP (see Pou3f4 and Mki67 expression in the UMAP in Figure 1c). (c) Expression of markers relative to cell cluster, developmental stage and localization in the ampulla relative to ampulla epithelium and boney capsule (see validation by RNA ISH in Figure 5—figure supplement 1). (d) Cluster analysis in mesenchymal cells. (e) The relative contributions of cell clusters to the composition of the mesenchyme at the indicated developmental stages.
Figure 5—figure supplement 1
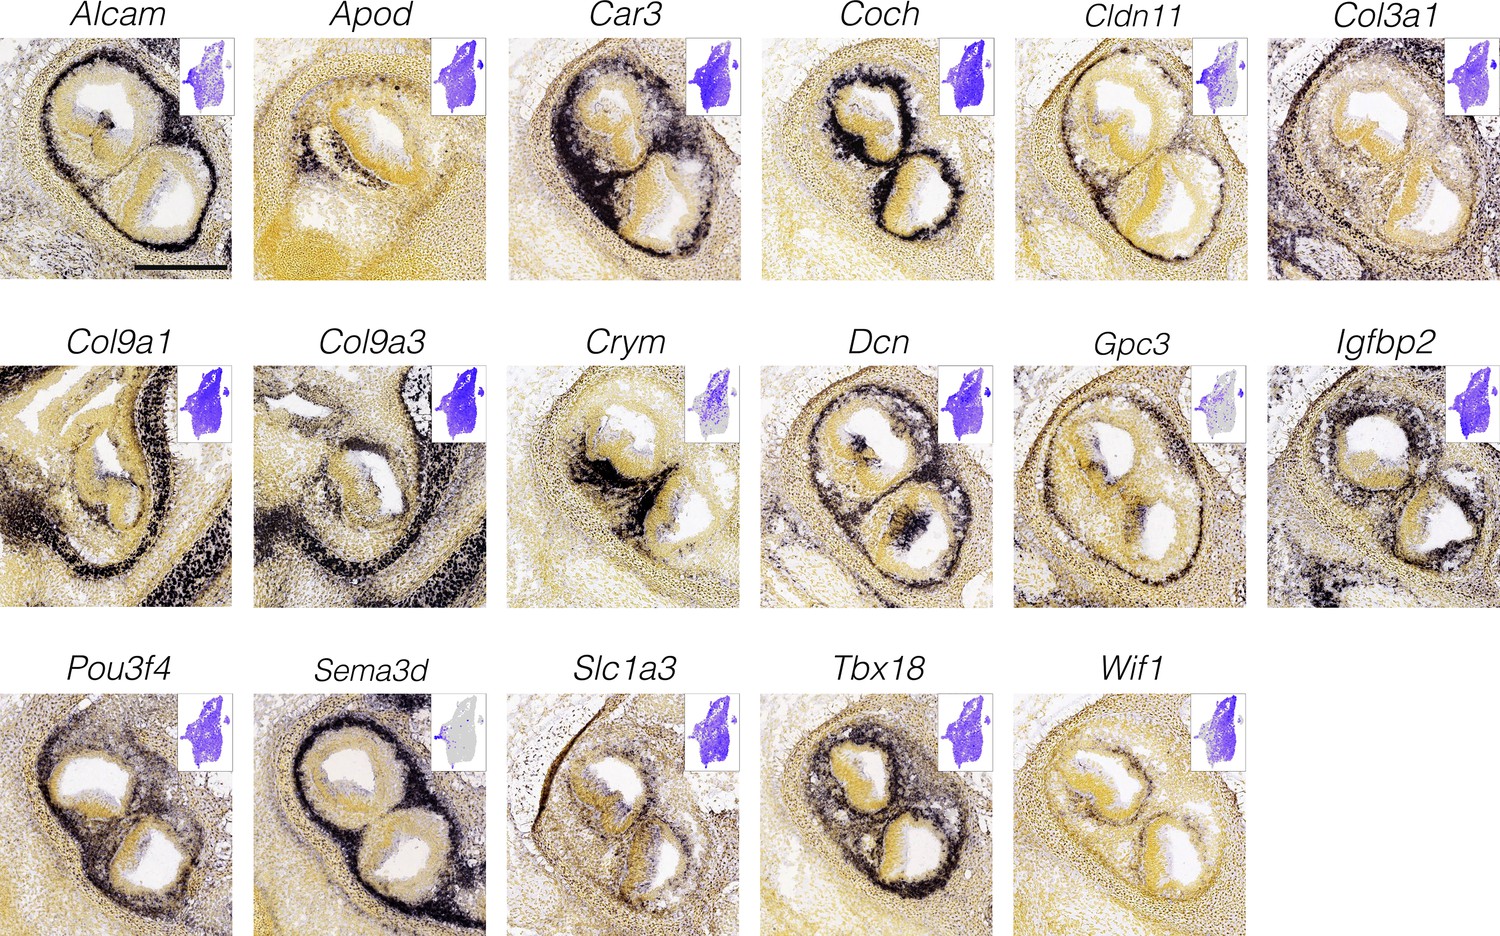
Localization of cluster-specific markers in otic mesenchyme surrounding the ampulla.
Panels show RNA in situ hybridization data for cluster-specific markers in E15.5 cristae from the Allen Developing Mouse Brain Atlas. Insets show specificity in the UMAP space. Expression patterns in the left–right UMAP axis relate to distance of the mesenchyme from the ampulla epithelium. Scale bar = 300 μm.
Figure 5—figure supplement 2
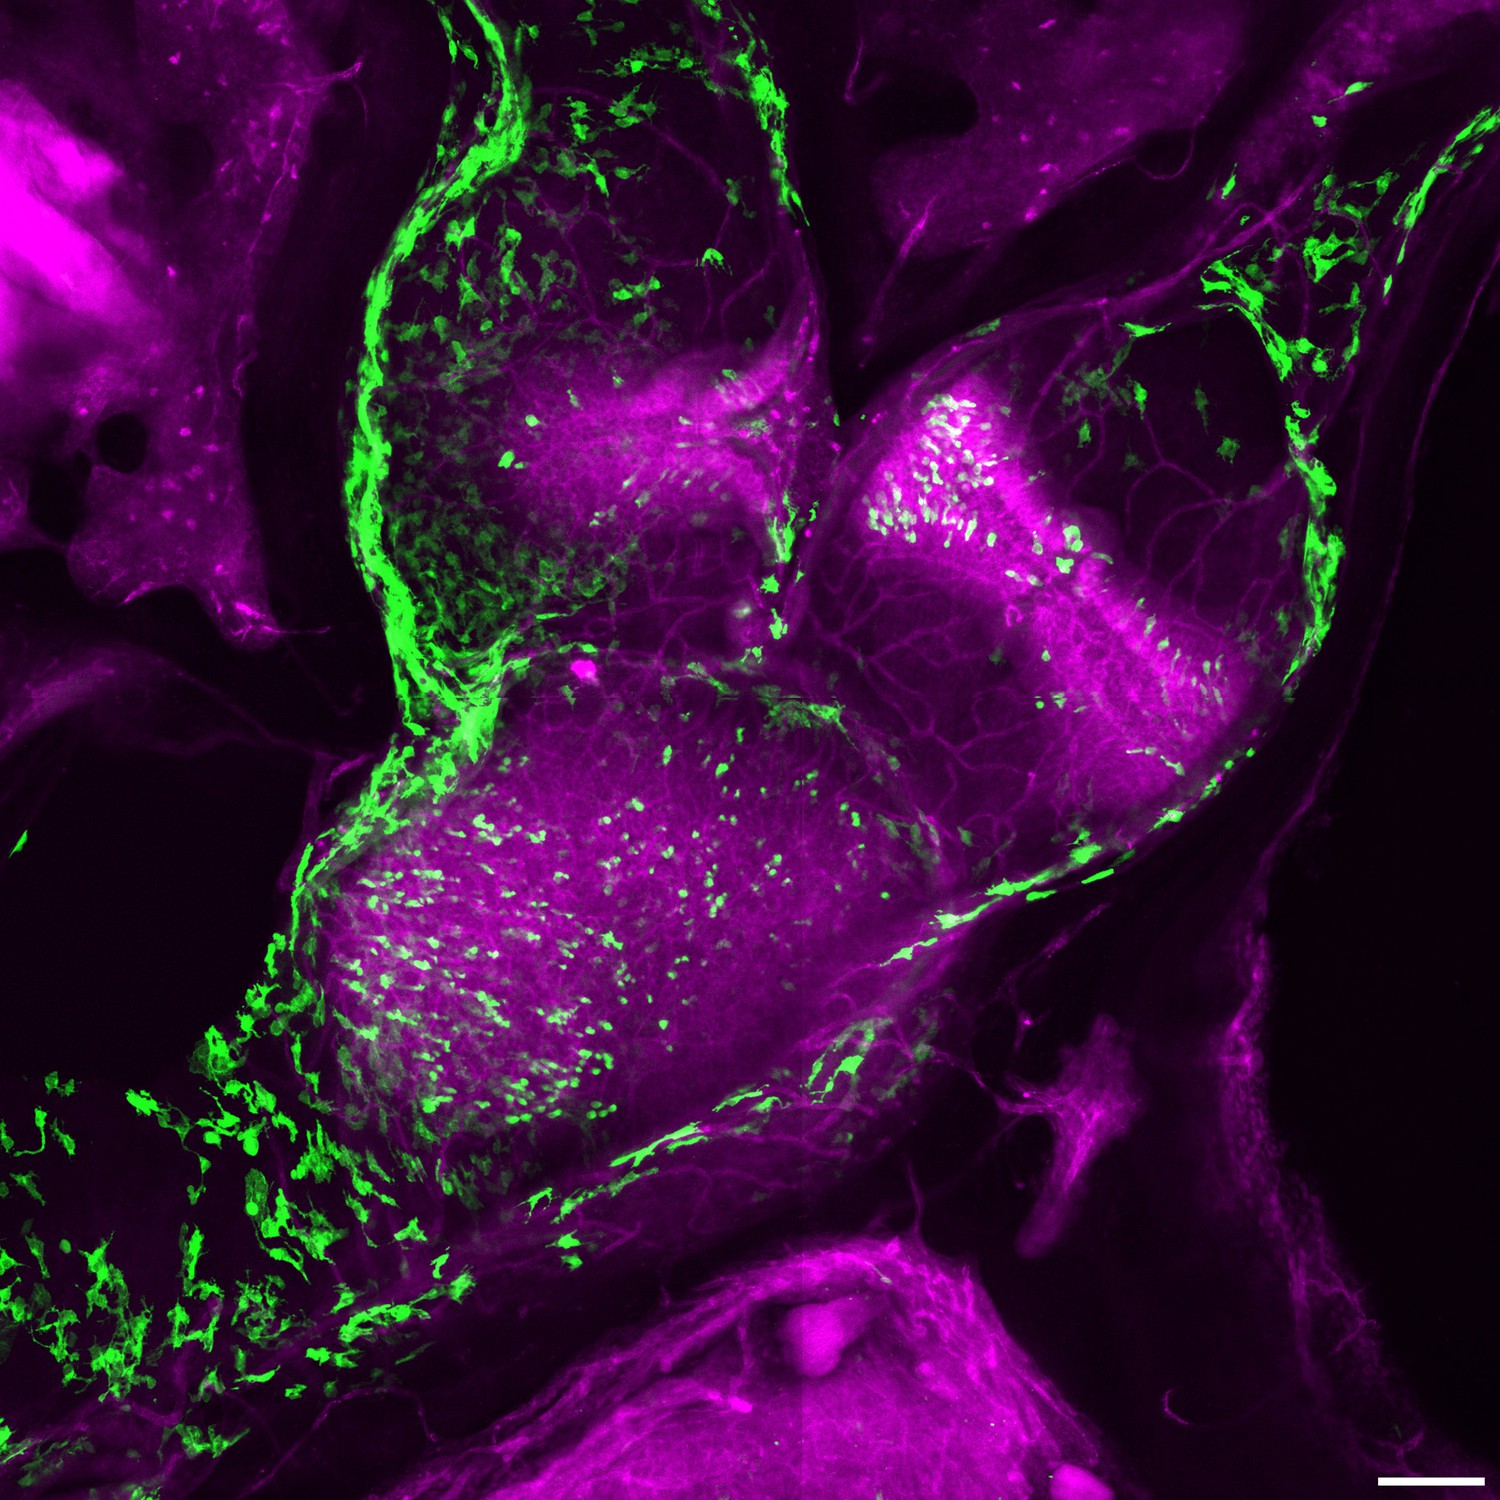
Slc1a3-CreER activity in the anterior canal, horizontal canal and utricle.
Green shows Slc1a3-CreER activation of GFP reporter (Todd et al., 2020) in a subset of support cells and also a subset of mesenchymal cells in the cristae and utricle in an adult temporal bone vibratome section. Magenta shows anti-Myo7a immunofluorescence in hair cells and also nonspecific signal in blood vessels and bone. Scale bar = 100 μm.
Figure 6
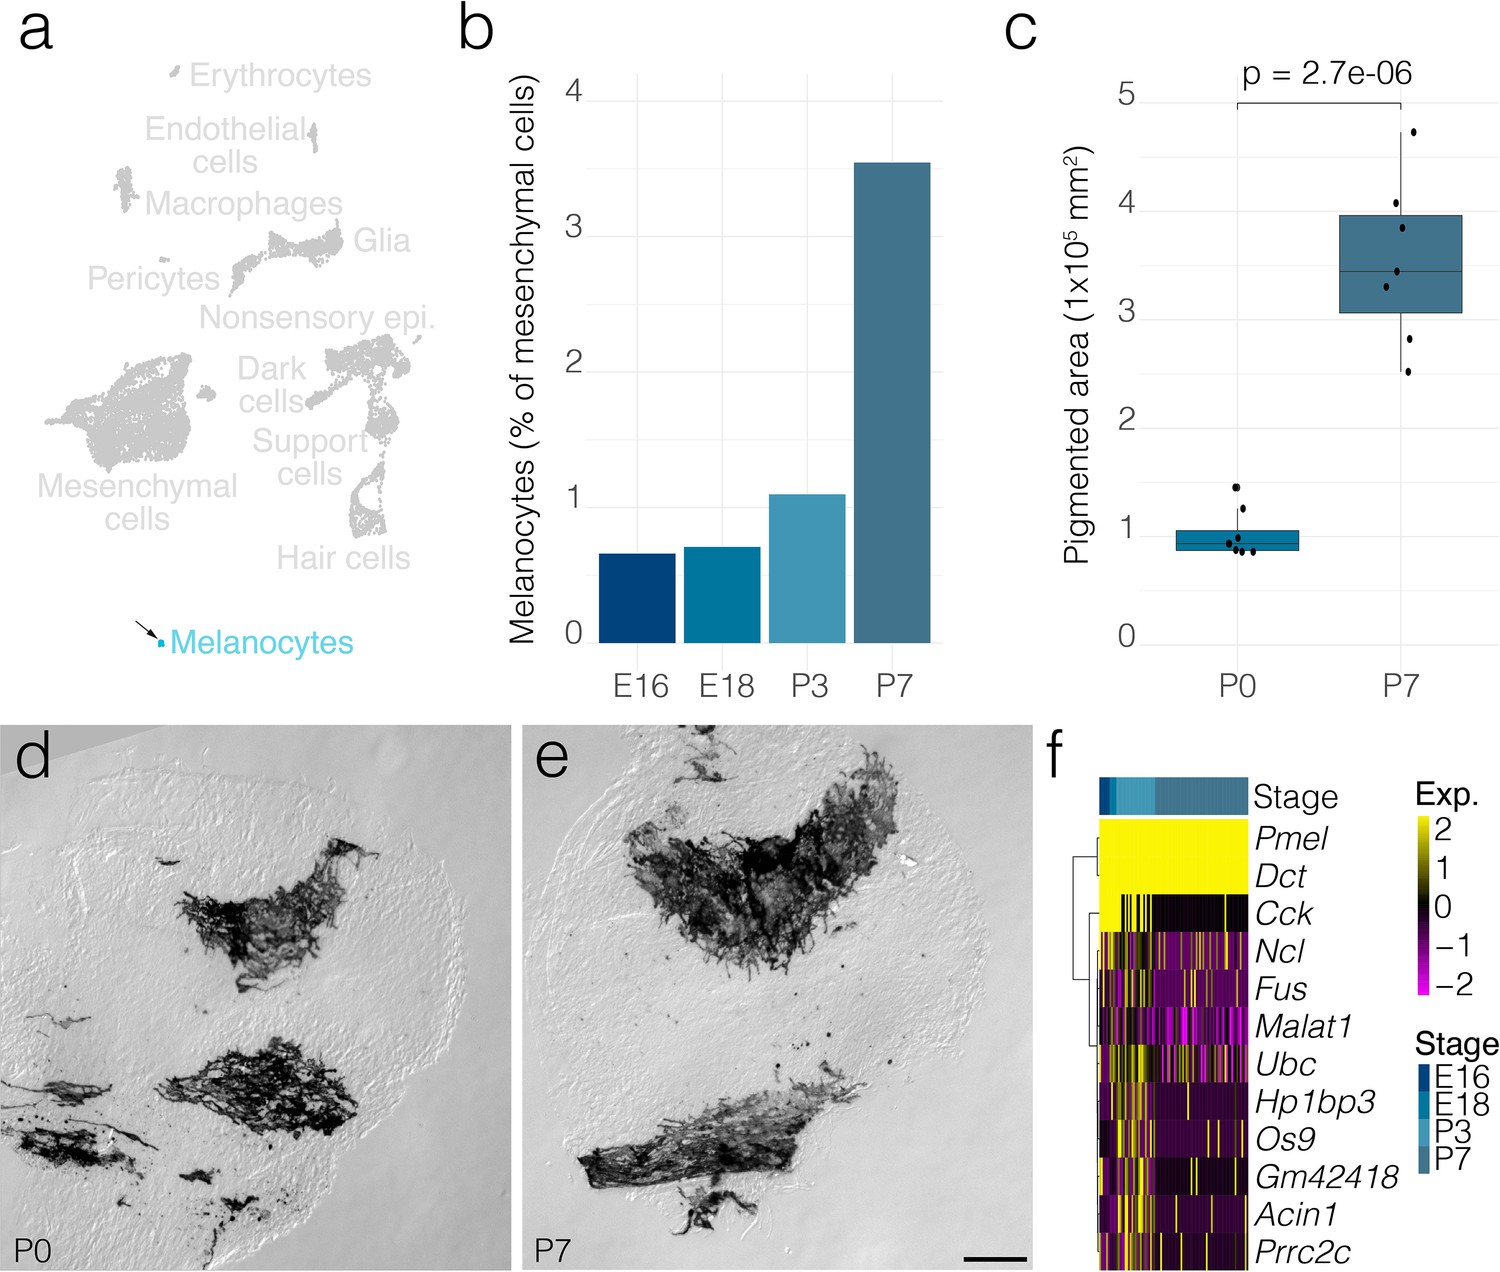
Melanocyte dynamics.
(a) Arrow indicates the cluster of melanocytes in UMAP space relative to the whole dataset. (b) The relative contributions of melanocytes to the composition of the mesenchyme at the indicated developmental stages. (c) The area occupied by pigmented cells quantified from DIC micrographs of whole mount cristae at P0 (n = 7) and P7 (n = 7) as shown in d and e, respectively. (f) Shows differential gene expression in melanocytes at P7 relative to those at P3. Scale bar = 100 μm.
Figure 7 with 2 supplements
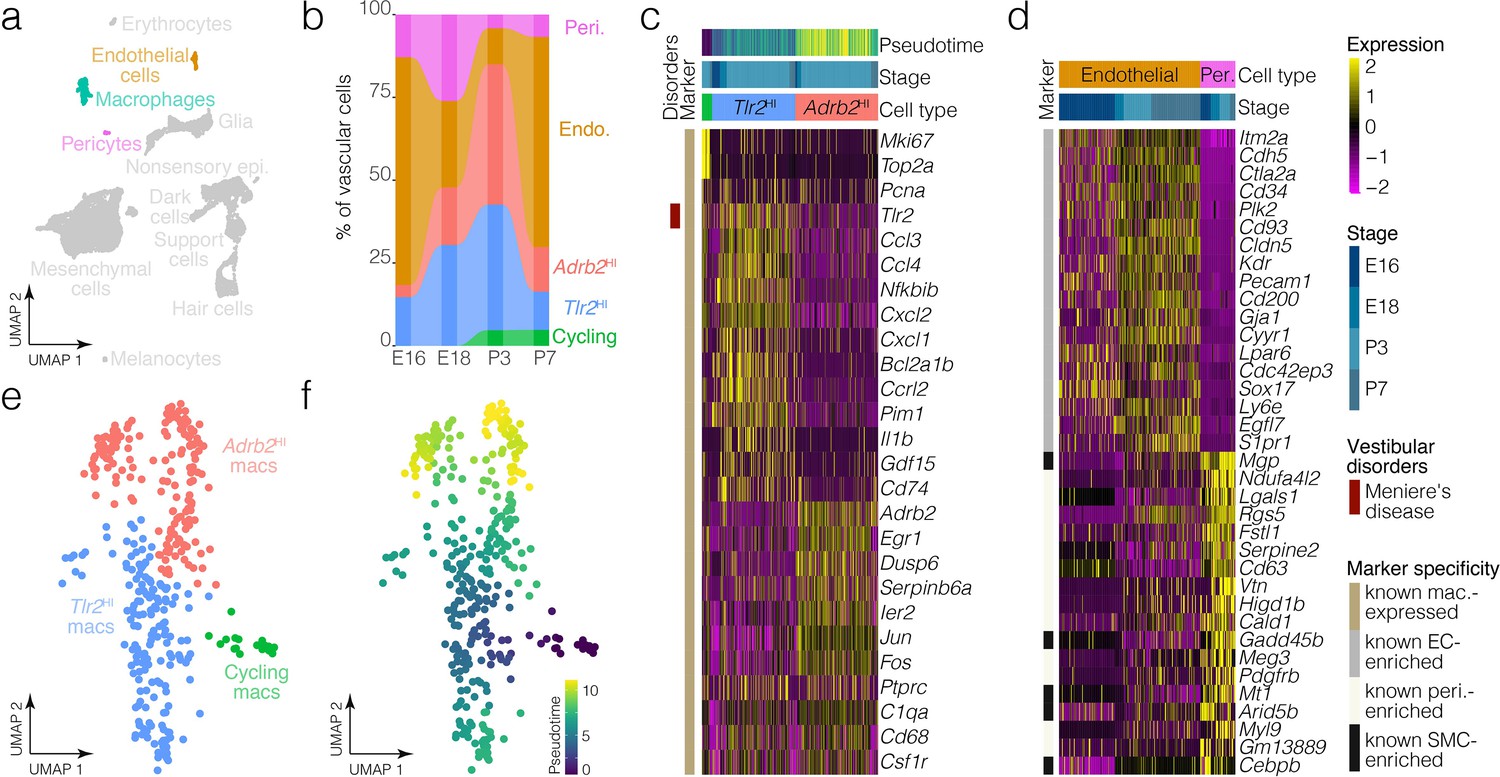
Macrophage and vascular cell diversity and dynamics.
(a) Highlights the positions of macrophages and vascular cells in UMAP space relative to the whole dataset. (b) The relative contributions of cell clusters to the composition of the vasculature at the indicated developmental stages. A subset of macrophages is not associated with blood vessels (Figure 5a). (c) Expression of markers relative to macrophage cluster. (d) Relative expression of markers in endothelial cells and pericytes. (e) Cluster analysis in the macrophages. (f) Pseudotime of the macrophage trajectory.
Figure 7—figure supplement 1
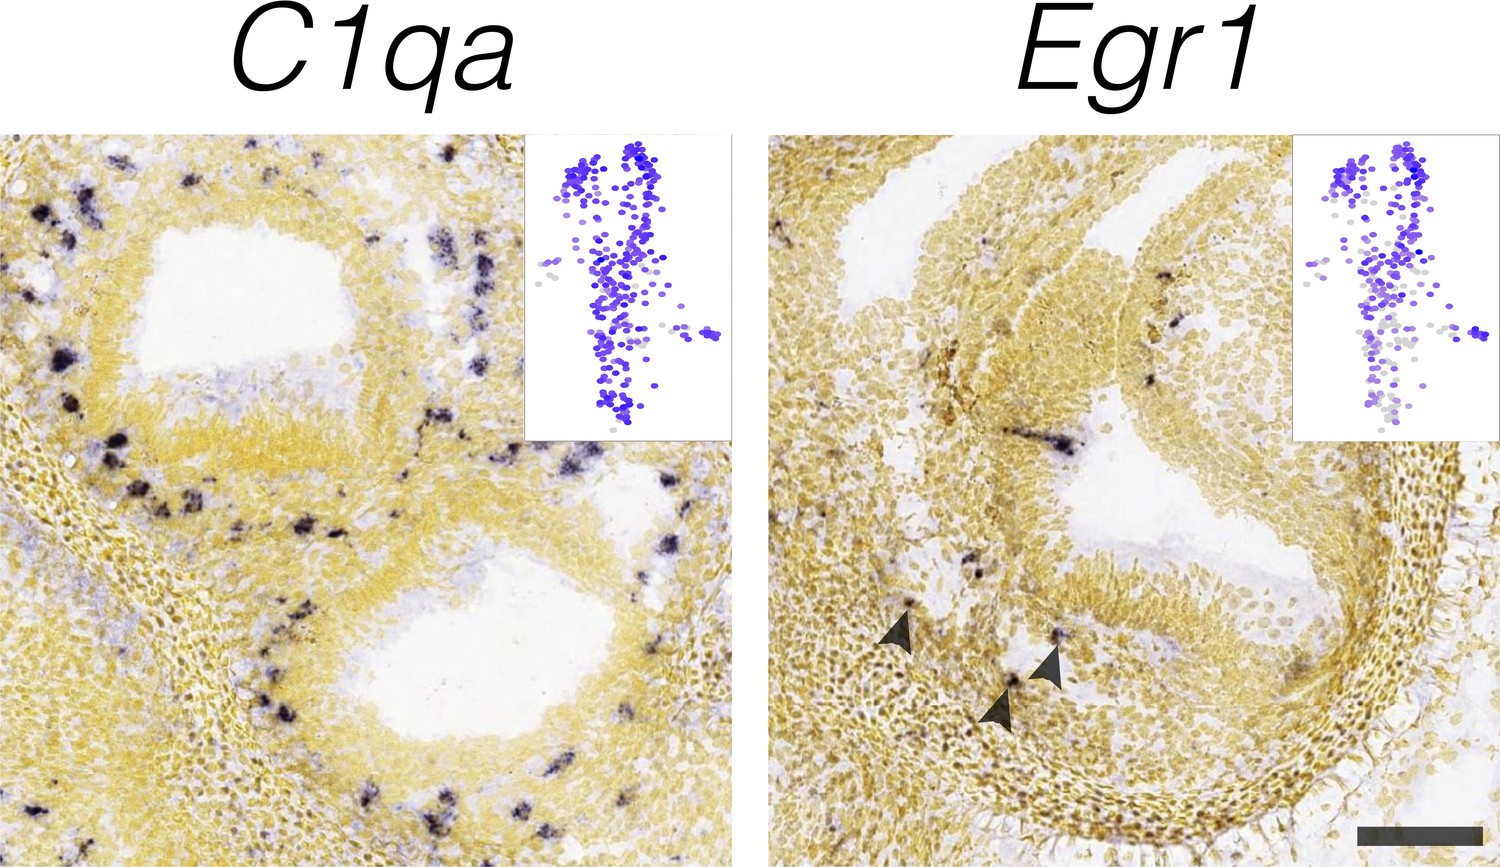
Localization of macrophage markers.
RNA in situ hybridization data from the Allen Developing Mouse Brain Atlas is shown for macrophage cluster-specific markers in E15.5 B6 cristae. Insets show the cluster specificity in UMAP. Arrowheads indicate Egr1 RNA ISH signal in a sparse population of mesenchymal cells within the posterior crista. Scale bar = 100 μm.
Figure 7—figure supplement 2
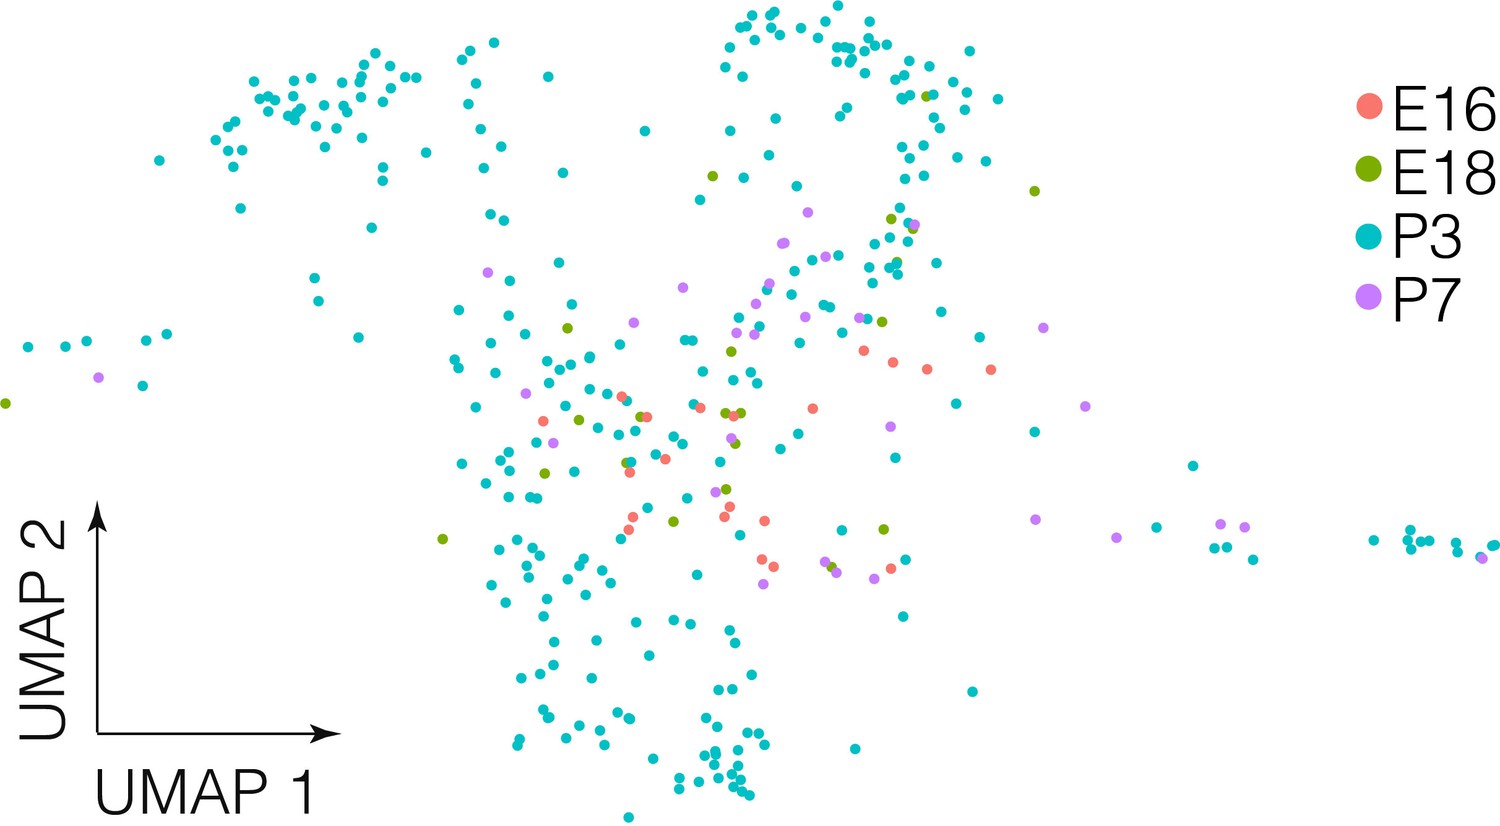
Developmental stage relative to UMAP in ampulla macrophages.
Macrophages in the whole dataset shown in UMAP with color-coding by developmental stage.
Figure 8

Comparative analysis of P7 crista ampullaris and P7 cochlea.
(a) Shows the relatedness of scRNA-seq data from Kolla et al. for P7 Swiss Webster cochlea (left) and the P7 B6 crista ampullaris data from the present study (right) in UMAP space. Note that common cell types overlap, indicating similarity, in contrast to tissue-specific cell types such as dark cells and pillar cells. (b) Shows differential expression in the hair cells and support cells of the cochlea vs. those of the crista.
Figure 9

Expression of genes associated with vestibular disease and dysfunction in the crista ampullaris.
The heatmap summarizes the expression of a subset of genes associated with vestibular disease and dysfunction in cell clusters of the crista ampullaris. Figure 9—source data 1 shows the full list of vestibular disorder-associated genes. Column color bars indicate the major cell types and subtypes. Row color bars denote the following: IMPC, genes mutated in mice that exhibit circling (cornflour blue) and hyperactivity (teal) or both (purple) phenotypes. Disorders, gene associations with Vestibular dysfunction (forest green), susceptibility to ototoxicity (magenta) and Meniere’s disease (maroon) were compiled from MSigDB, OMIM and Malacards databases. GWAS, hits in genome-wide association studies of motion sickness (green) and vestibular migraine (orange). Balance, genes in the GO term ‘neuromuscular process controlling balance’ (sky blue). IE morph, genes in the GO term ‘inner ear morphogenesis’ (khaki). GO devo., genes in GO terms ‘stereocilium organization’ (midnight blue) and ‘otolith development’ (lime green).
-
Figure 9—source data 1
Expression of genes associated with vestibular disease and dysfunction in the crista ampullaris.
The heatmap summarizes the expression of genes associated with vestibular disease and dysfunction in cell clusters of the crista ampullaris. Column color bars indicate the major cell types and subtypes. Row color bars denote the following: IMPC, genes mutated in mice that exhibit circling (cornflour blue) and hyperactivity (teal) or both (purple) phenotypes. Disorders, gene associations with Vestibular dysfunction (forest green), susceptibility to ototoxicity (magenta), peripheral vertigo (blue) and Meniere’s disease (maroon) were compiled from MSigDB, OMIM and Malacards databases. GWAS, hits in a genome-wide association studies of motion sickness (green) and vestibular migraine (orange). Balance, genes in the GO term ‘neuromuscular process controlling balance’ (sky blue). IE morph, genes in the GO term ‘inner ear morphogenesis’ (khaki). Devo., genes in GO terms ‘stereocilium organization’ (midnight blue), ‘otolith development’ (lime green) and ‘vestibulocochlear nerve development’ (gray).
- https://cdn.elifesciences.org/articles/60108/elife-60108-fig9-data1-v2.pdf
Appendix 1—figure 1
Wnt3 expression in the E11.5 otocyst.
Panels show RNA in situ hybridization data from the Allen Developing Mouse Brain Atlas for cluster-specific markers in E15.5 B6 cristae. Note that the expression of Wnt3 coincides with Nr4a3/Nor1 and Netrin1 in the presumptive canal fusion plate of the dorsolateral otocyst.
Appendix 1—figure 2
Wnt pathway in the perinatal crista.
The expression of Wnt ligands, receptors, inhibitors and mediators is visualized by heatmap.
Videos
Video 1
Id1 immunofluorescence in P0 crista.
Video shows a series of 1 micron optical sections per second imaged in P0 B6 cristae showing anti-Sox2 (green), anti-Id1 (magenta), and phalloidin (cyan).
Video 2
Id1 immunofluorescence in P4 crista.
Video shows a series of 1 micron optical sections per second imaged in P4 Hes5-GFP cristae from a colleagues’ colony showing anti-Sox2 (white), anti-Id1 (magenta), Hes5-GFP (yellow), and Hoechst 33342 (cyan).
Tables
Table 1
Antibodies used for immunofluorescence.
| Antigen | Host | Dilution | Cat. no. | Manufacturer | RRID |
|---|---|---|---|---|---|
| Atoh1 | Rabbit | 1:1000 | 21215–1-AP | Proteintech | AB_10733126 |
| Hsp70 | Rabbit | 1:1000 | PA5-28003 | Invitrogen | AB_2545479 |
| Iba1 | Rabbit | 1:1000 | 019–19741 | Wako | AB_839504 |
| Id1 | Rabbit | 1:1000 | BCH-1/37–2 | Biocheck | AB_2713996 |
| Myo7a | Rabbit | 1:1000 | 25–6790 | Proteus | AB_10015251 |
| Myo7a* | Mouse | 5 μg/ml | MYO7A 138–1 | DSHB | AB_2282417 |
| Nefm | Chick | 1:200 | ab134458 | Abcam | AB_2860025 |
| Ocm | Rabbit | 1:1000 | Omg4 | Swant | AB_10000346 |
| Pecam1 | Rat | 1:50 | 551262 | BD Pharmingen | AB_398497 |
| Sox2 | Goat | 1:200 | sc-17320 | Santa Cruz | AB_2286684 |
| Wnt3* | Goat | 1:125 | PA5-18516 | Thermo | AB_10979520 |
-
*Requires antigen retrieval.
Additional files
-
Supplementary file 1
Cell numbers, sequencing depth, and gene detection in the crista ampullaris dataset.
- https://cdn.elifesciences.org/articles/60108/elife-60108-supp1-v2.docx
-
Supplementary file 2
RNA ISH images from the Allen Developing Mouse Brain Atlas.
- https://cdn.elifesciences.org/articles/60108/elife-60108-supp2-v2.docx
-
Transparent reporting form
- https://cdn.elifesciences.org/articles/60108/elife-60108-transrepform-v2.pdf
Download links
A two-part list of links to download the article, or parts of the article, in various formats.
Downloads (link to download the article as PDF)
Open citations (links to open the citations from this article in various online reference manager services)
Cite this article (links to download the citations from this article in formats compatible with various reference manager tools)
Novel cell types and developmental lineages revealed by single-cell RNA-seq analysis of the mouse crista ampullaris
eLife 10:e60108.
https://doi.org/10.7554/eLife.60108


