Global and local tension measurements in biomimetic skeletal muscle tissues reveals early mechanical homeostasis
- Institute for Cell Biology, University of Münster, Germany
- Institute of Biomedical Engineering, University of Toronto, Canada
- Donnelly Centre, University of Toronto, Canada
- 3rd Institute of Physics-Biophysics, University of Göttingen, Germany
- Cluster of Excellence "Multiscale Bioimaging: from Molecular Machines to Networks of Excitable Cells" (MBExC), University of Göttingen, Germany
- Department of Cell and Systems Biology, University of Toronto, Canada
Figures
Figure 1 with 2 supplements
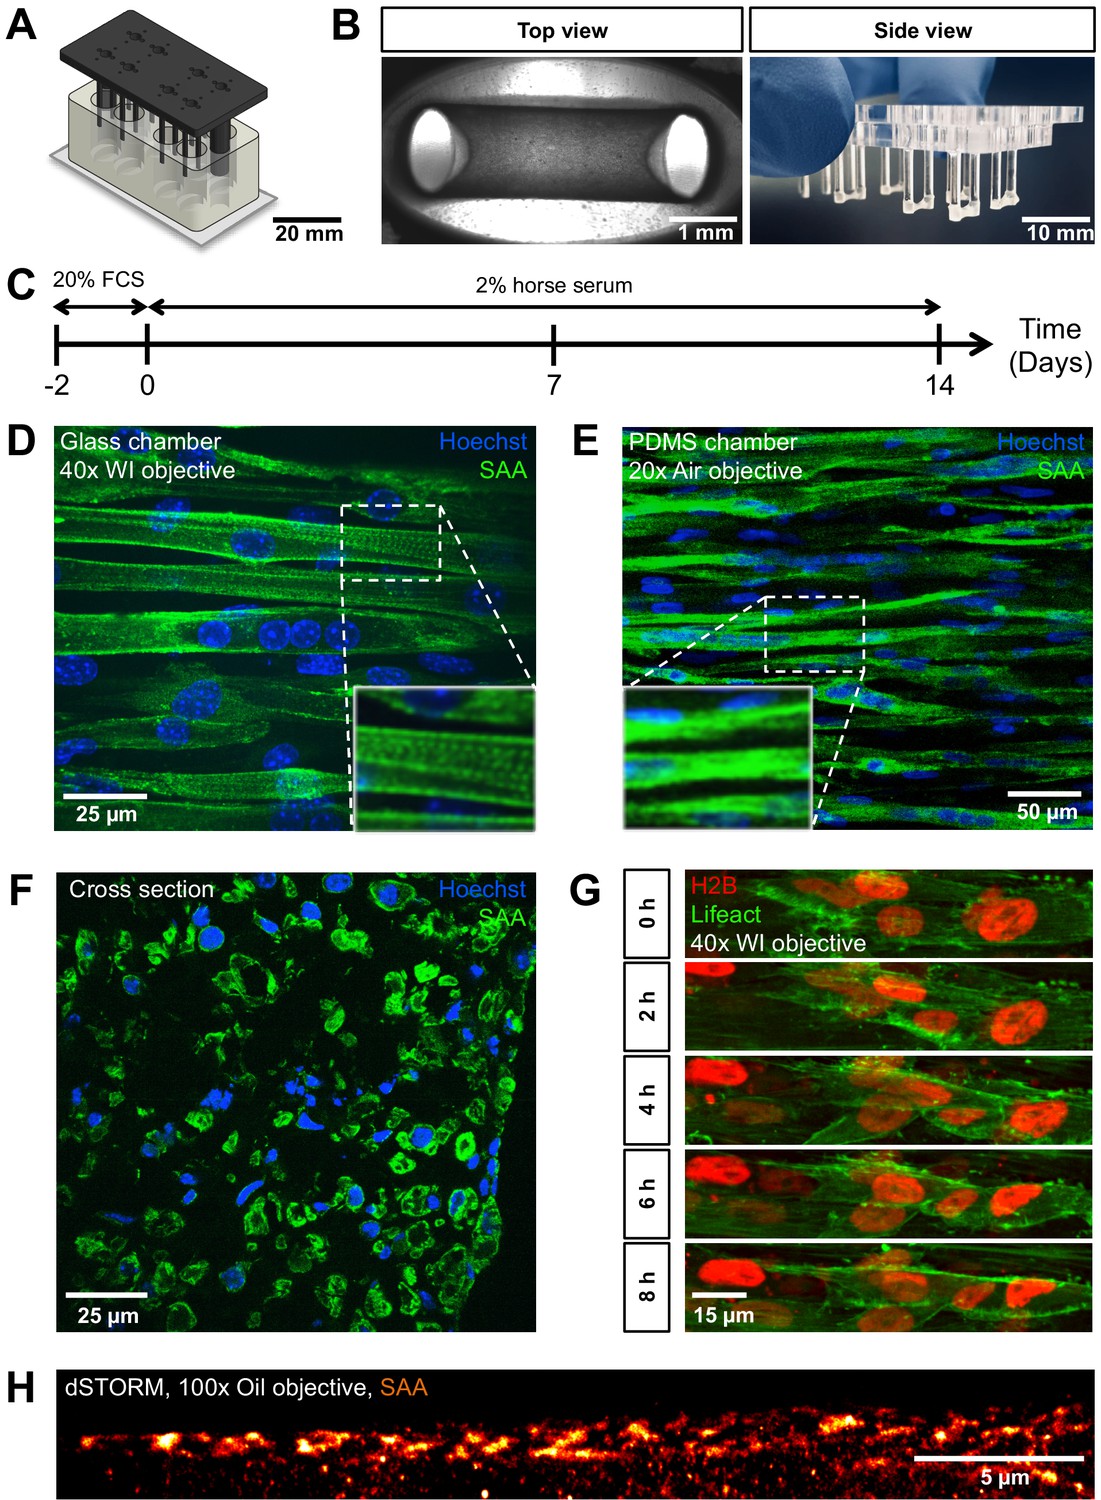
PMMA culture device supports the generation of 3D biomimetic skeletal muscle tissues.
(A) Computer-generated depiction of the PMMA mold design. The top part containing eight pairs of vertical posts is shown in black. Eight holes positioned equidistant between each pair of posts allows for gas and media exchange. Two larger sized vertical posts at either end of the top part serve to fix the top and bottom portion (translucent white) together and ensure vertical posts are properly positioned. The bottom portion is affixed to a microscopy grade glass (B) Images of remodeled C2C12 muscle tissues at 7 days of differentiation anchored to the end of the posts captured to provide (left image) a view looking up into a well in which the top and bottom parts are fashioned together (left; ×4 objective) or (right image) from the side looking at the top part to visualize six pairs of posts with tissues at the bottom. (C) Schematic workflow used to raise 3D skeletal muscle tissues in vitro. (D–F) Representative confocal microscopy longitudinal (D; whole mount, flattened stack, ×40 water immersion objective, PMMA chamber, (E); whole mount, flattened stack, ×20 air objective, PDMS chamber) and transverse (F; cryosection, single snap, ×40 water immersion objective) images of multinucleated myotubes within a 14-day-old muscle tissue immunostained for sacomeric alpha-actinin (SAA, green) and counterstained with Hoechst 33342 to visualize nuclei (blue). (G) Timeseries of myoblast fusion within a 3D skeletal muscle tissue on day 4 of differentiation, demonstrating the possibility of high-resolution imaging during living tissue formation. Lifeact-GFP (green) and H2B-mCherry (red) was stably introduced into AB1167 cells. (H) Super-resolution dSTORM imaging of SAA-stained myofibrillar structures present inside a myotube, recorded with ×100 oil immersion objective.
Figure 1—figure supplement 1
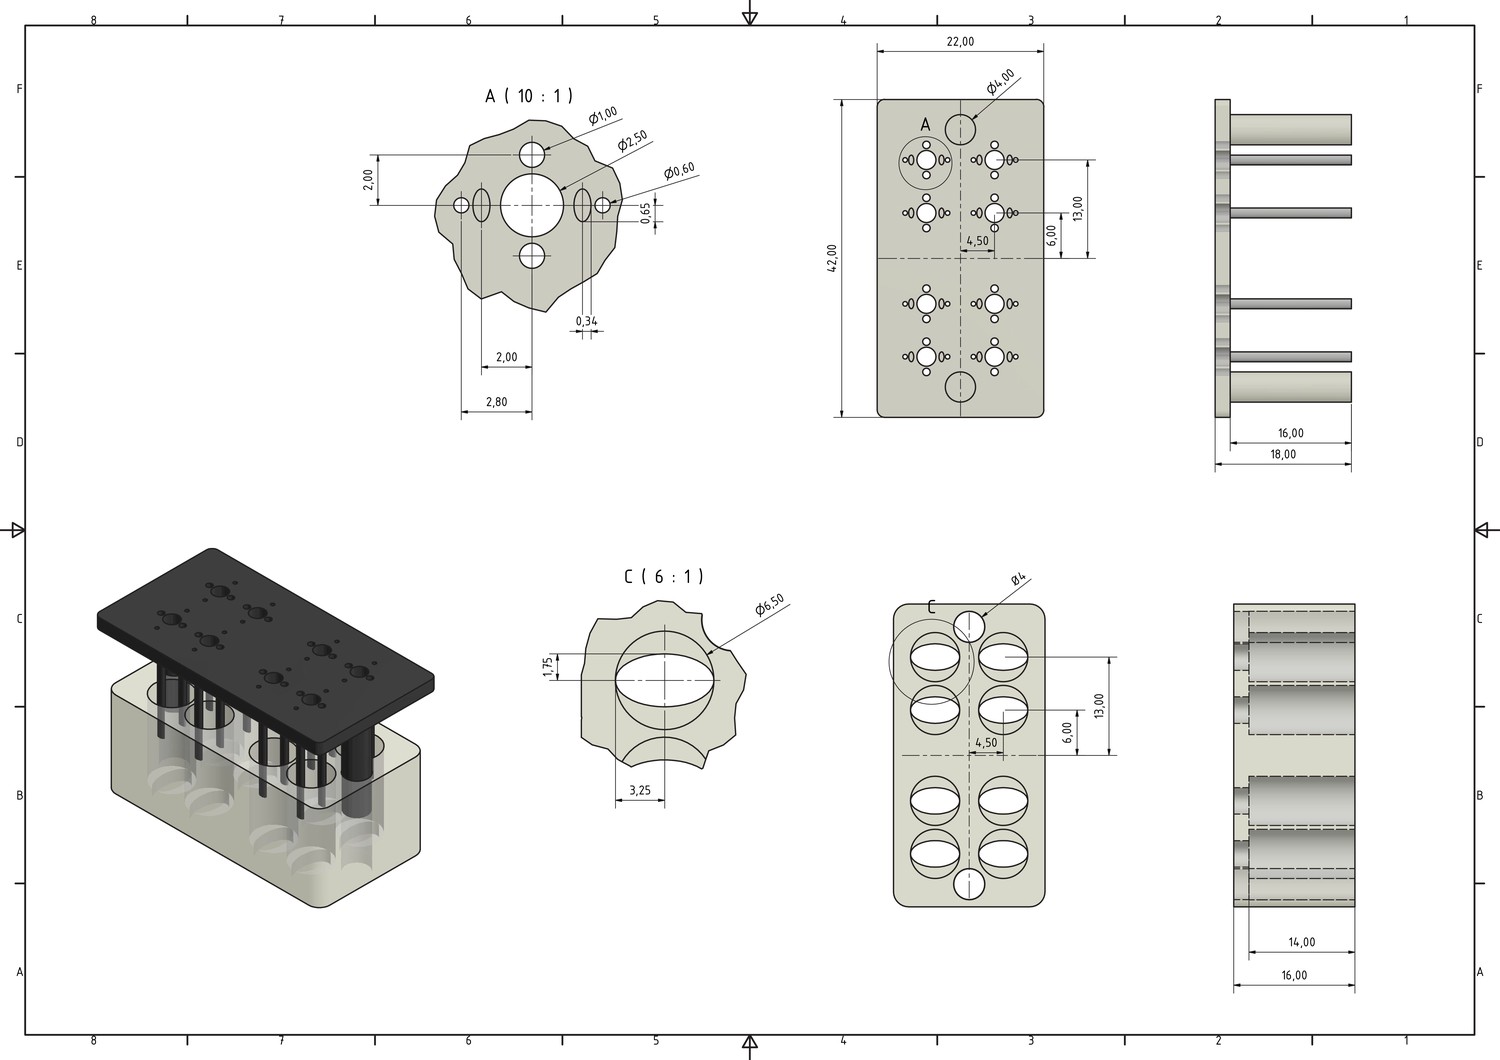
Engineering drawing with respective dimensions of the novel culture device used in this study for raising 3D skeletal muscle tissues in vitro.
Figure 1—figure supplement 2
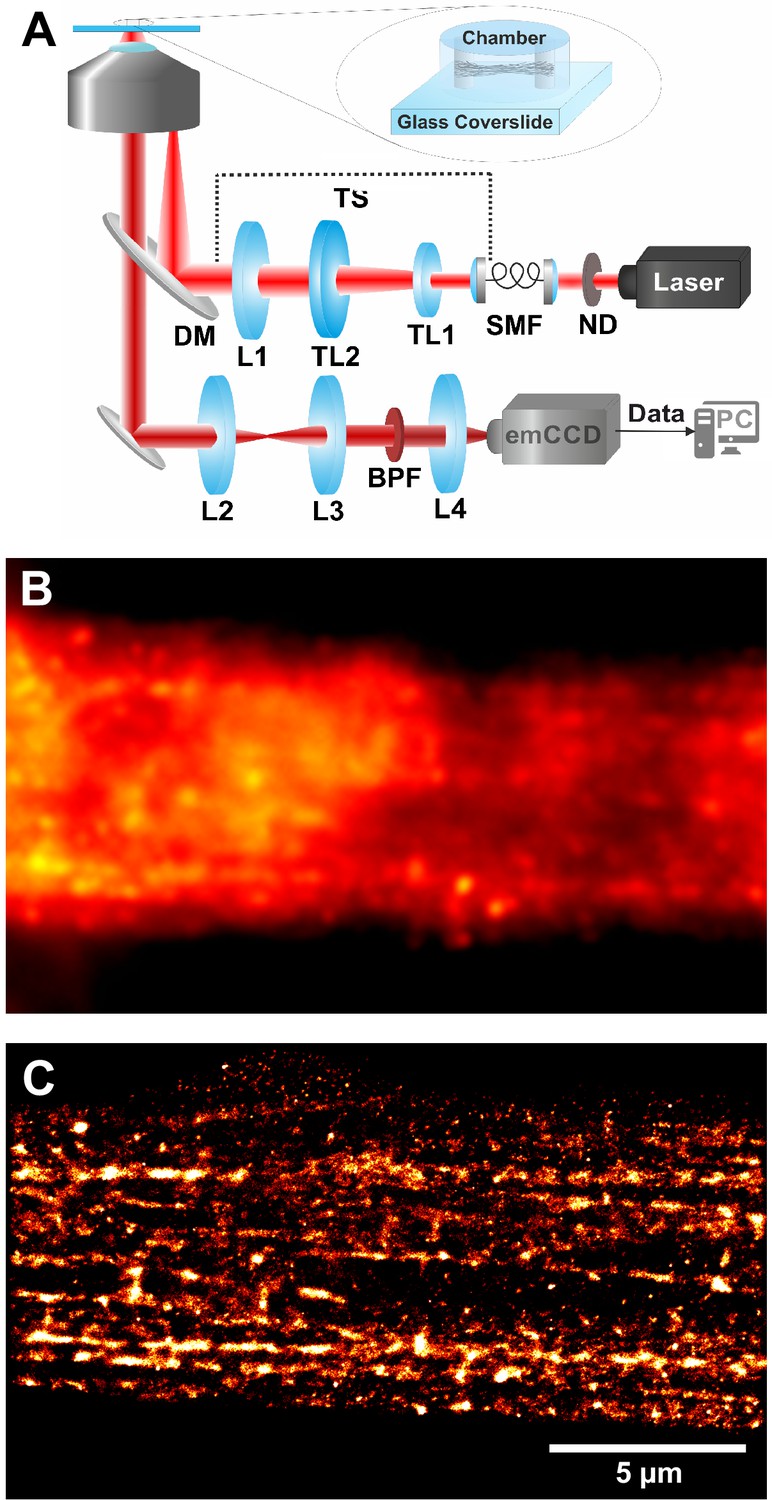
Schematic of the custom-built setup for super-resolution dSTORM microscopy (A).
Epifluorescence image of SAA-stained myofibrillar structures in a myotube acquired using a ×100 oil objective (B) and the related dSTORM image (C).
Figure 2

Quantification of biomimetic skeletal muscle tissue contractile forces over time in culture.
(A) Representative bright-field images of the bottom of a post under ×10 magnification before (left) and during (middle) a tetanus contraction. Pink and blue pseudo color highlights the deflection regions when pre- and post- contraction images are overlaid (right). Representative time course traces of forces exerted on the posts are displayed in (B) for an optogenetically induced twitch and in (C) for a tetanus contraction induced by the addition of 2 mM ACh. (D) Bar graph with force measurements of optogenetically induced twitches (N = 18) and ACh induced tetanus contractions (N = 14) of 2-week-old muscle tissues. (E) Bar graph with pre-tension measurements of skeletal muscle tissues at 1 (N = 8) and 2 weeks of differentiation (N = 7). (F) Relation between simulated and measured spring constants for different post lengths. Up to a post length of 12 mm, the simulated and measured spring constant are equal within the error; however, for shorter posts we observe discrepancy. Hence, such short posts should be always crosschecked experimentally.
-
Figure 2—source data 1
Source data of global contraction and tissue pre-tension studies (Figure 2B–E).
- https://cdn.elifesciences.org/articles/60145/elife-60145-fig2-data1-v2.xlsx
-
Figure 2—source data 2
Source data of spring constant determination of PMMA posts (Figure 2F).
- https://cdn.elifesciences.org/articles/60145/elife-60145-fig2-data2-v2.xlsx
Figure 3
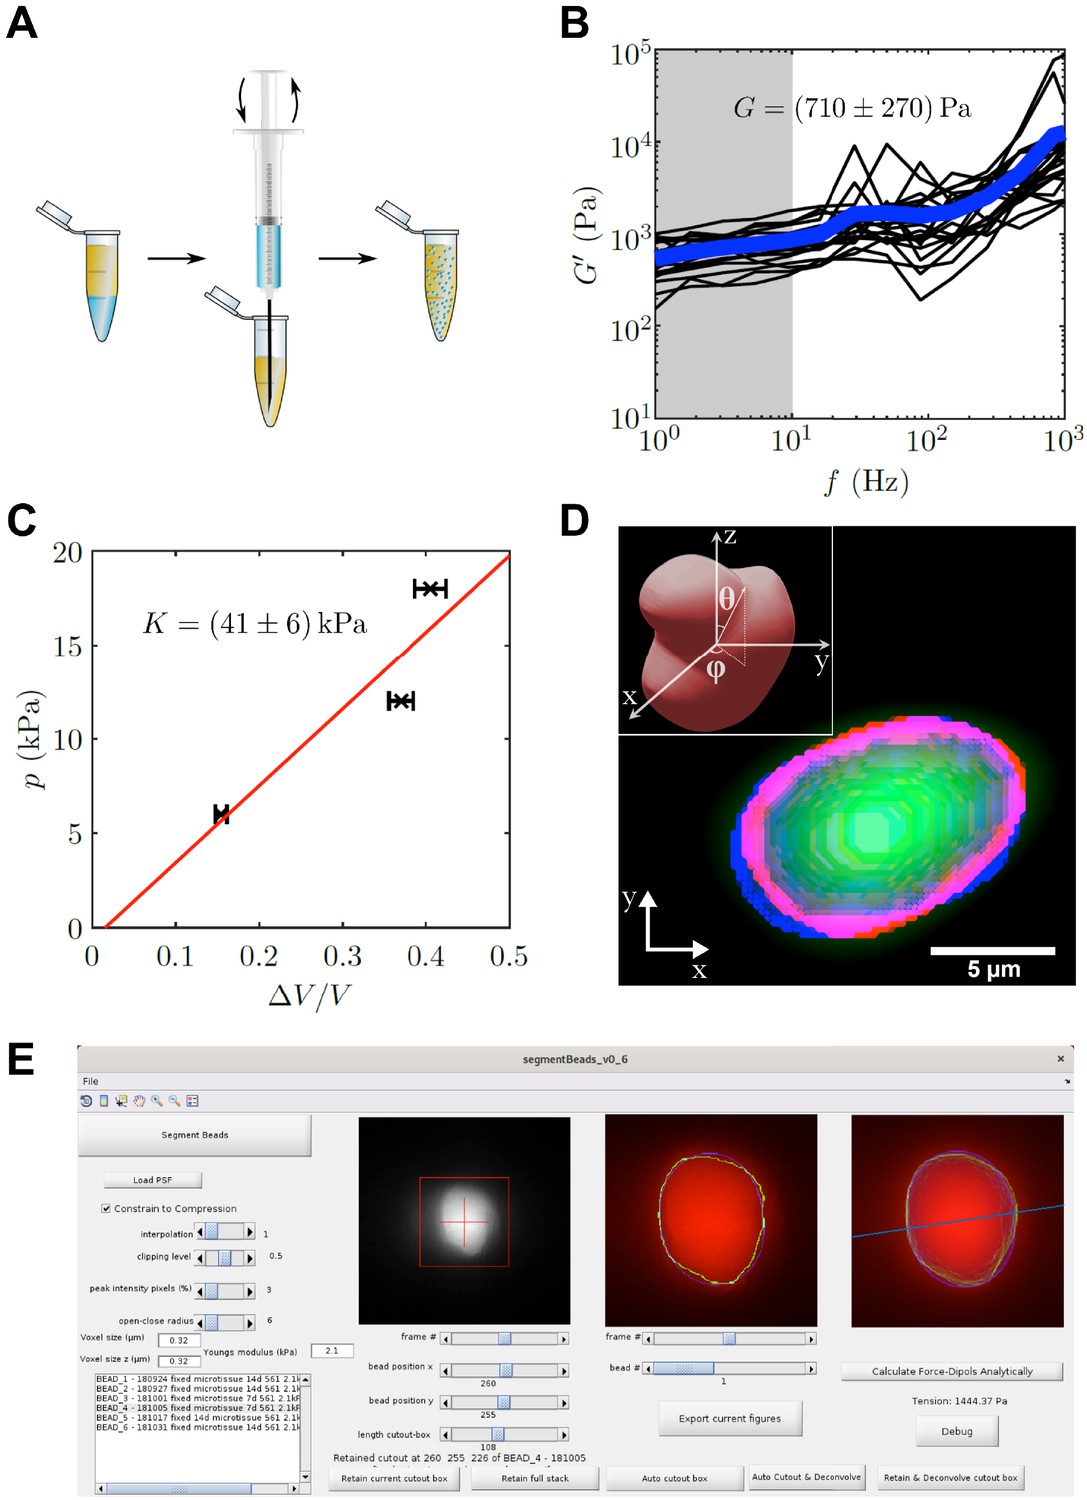
PAA bead characterization and analysis software.
(A) Schematic workflow of bead fabrication. Using a syringe, a water in oil emulsion is created and the acryl amide solution is polymerized to produce elastic PAA beads. (B) Graph showing the determination of the shear modulus of elastic PAA beads, which was measured for varying oscillation-frequency of 1 µm beads. (C) Graph depicting the determination of the bulk modulus of elastic PAA beads, which was measured by an osmotic pressure approach using dextran. (D) Segmentation of a deformed PAA bead (green). The surface (red) was segmented and a linear combination of spherical harmonics of degree n = 0, two and order m = 0 (blue) were fitted to the surface. Insert is showing the coordinate system and angles and used for the spherical harmonics expansion. (E) Screenshot of PAA bead deformation analysis software front-end. Providing a point spread function enables the automatized program to deconvolve the image and determine the edge position of an elastic bead (green) in a given cutout box. The bead’s shape is then fitted by spherical harmonics (blue), which are used to calculate the main axis of the force dipole (blue line) and the corresponding tension analytically. For detailed information also refer to section ‘BDA software workflow’.
-
Figure 3—source data 1
Source data of shear modulus determination of PAA beads (Figure 3B).
- https://cdn.elifesciences.org/articles/60145/elife-60145-fig3-data1-v2.mat
-
Figure 3—source data 2
Source data of bulk modulus determination of PAA beads (Figure 3C).
- https://cdn.elifesciences.org/articles/60145/elife-60145-fig3-data2-v2.xlsx
Figure 4 with 2 supplements
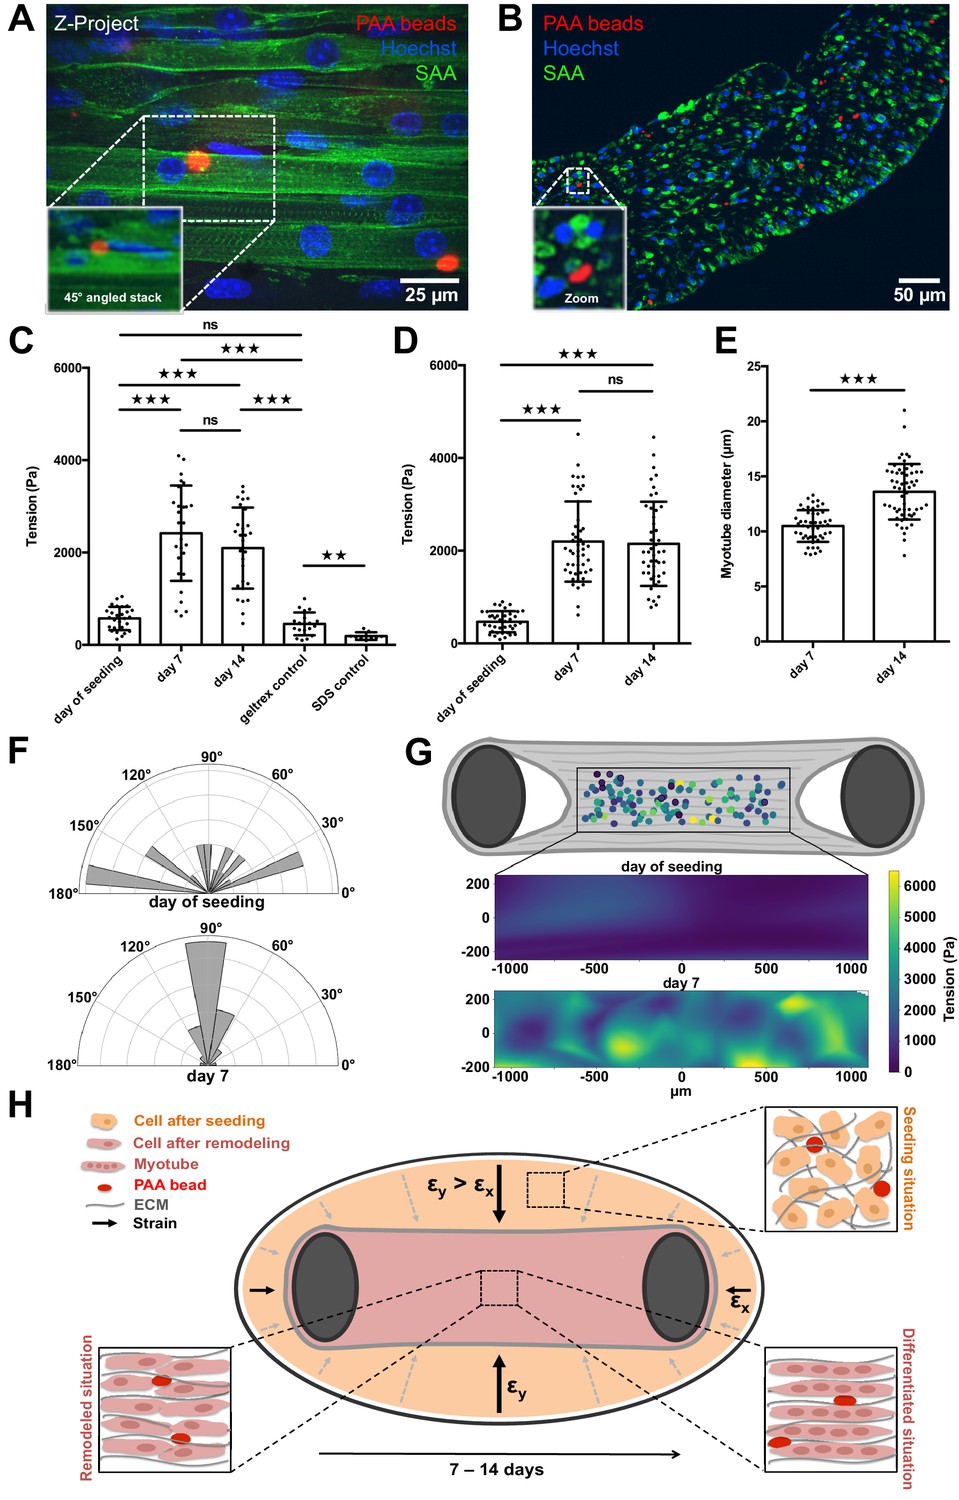
PAA beads serve as local tension sensors within in vitro muscle tissues (A).
Representative flattened confocal microscopy stack of a 14-day-old C2C12 tissue with PAA beads embedded (red) and immunostained for sacomeric alpha-actinin (green) and counterstained with Hoechst 33342 to visualize nuclei (blue). PAA bead section is depicted as a 45° angled view of the stack to show exact inter-myotube bead localization. (B) Representative confocal snap of a transverse section of a 14-day-old C2C12 tissue. A PAA bead section is depicted as a zoom to clarify inter-myotube bead localization. (C) Bar graph of local tension within C2C12 muscle tissues at the day of seeding (N = 7, n = 28), and after 1 (N = 4, n = 28) and 2 weeks of differentiation (N = 4, n = 29). Beads were imaged in the context of living tissues raised in PMMA molds for BDA utilizing spinning disk microscopy. Also shown is negative controls in which tension was measured in the cell-free geltrex/fibrin matrix alone (N = 3, n = 20) as well as following the dissolution of tissues using 5% SDS (N = 3, n = 10). (D) Bar graph of local tension within C2C12 muscle tissues raised in the MyoTACTIC PDMS microtissue platform that were fixed and removed for imaging using Multiview Light-Sheet microscopy on the day of seeding (N = 13, n = 39), and after 1 (N = 17, n = 48) and 2 weeks of differentiation (N = 19, n = 46). (E) Bar graph of myotube diameter analysis conducted on C2C12 muscle tissues at 1 (N = 3, n = 49) and 2 (N = 3, n = 57) weeks of differentiation. Each myotube diameter data point reflects the average of three measurements per myotube. (F) Angles of PAA bead deformation at the day of seeding and 7 days after differentiation. (G) Flattened tension map of C2C12 muscle tissues at the day of seeding and 7 days after differentiation generated from BDA output. (H) Model of tension-driven in vitro muscle tissue formation.
-
Figure 4—source data 1
Source data of local tissue tension studies (Figure 4C–E, Figure 4—figure supplements 1 and 2).
- https://cdn.elifesciences.org/articles/60145/elife-60145-fig4-data1-v2.xlsx
-
Figure 4—source data 2
Source data of bead deformation angles and tissue tension maps (Figure 4F&G).
- https://cdn.elifesciences.org/articles/60145/elife-60145-fig4-data2-v2.xlsx
Figure 4—figure supplement 1
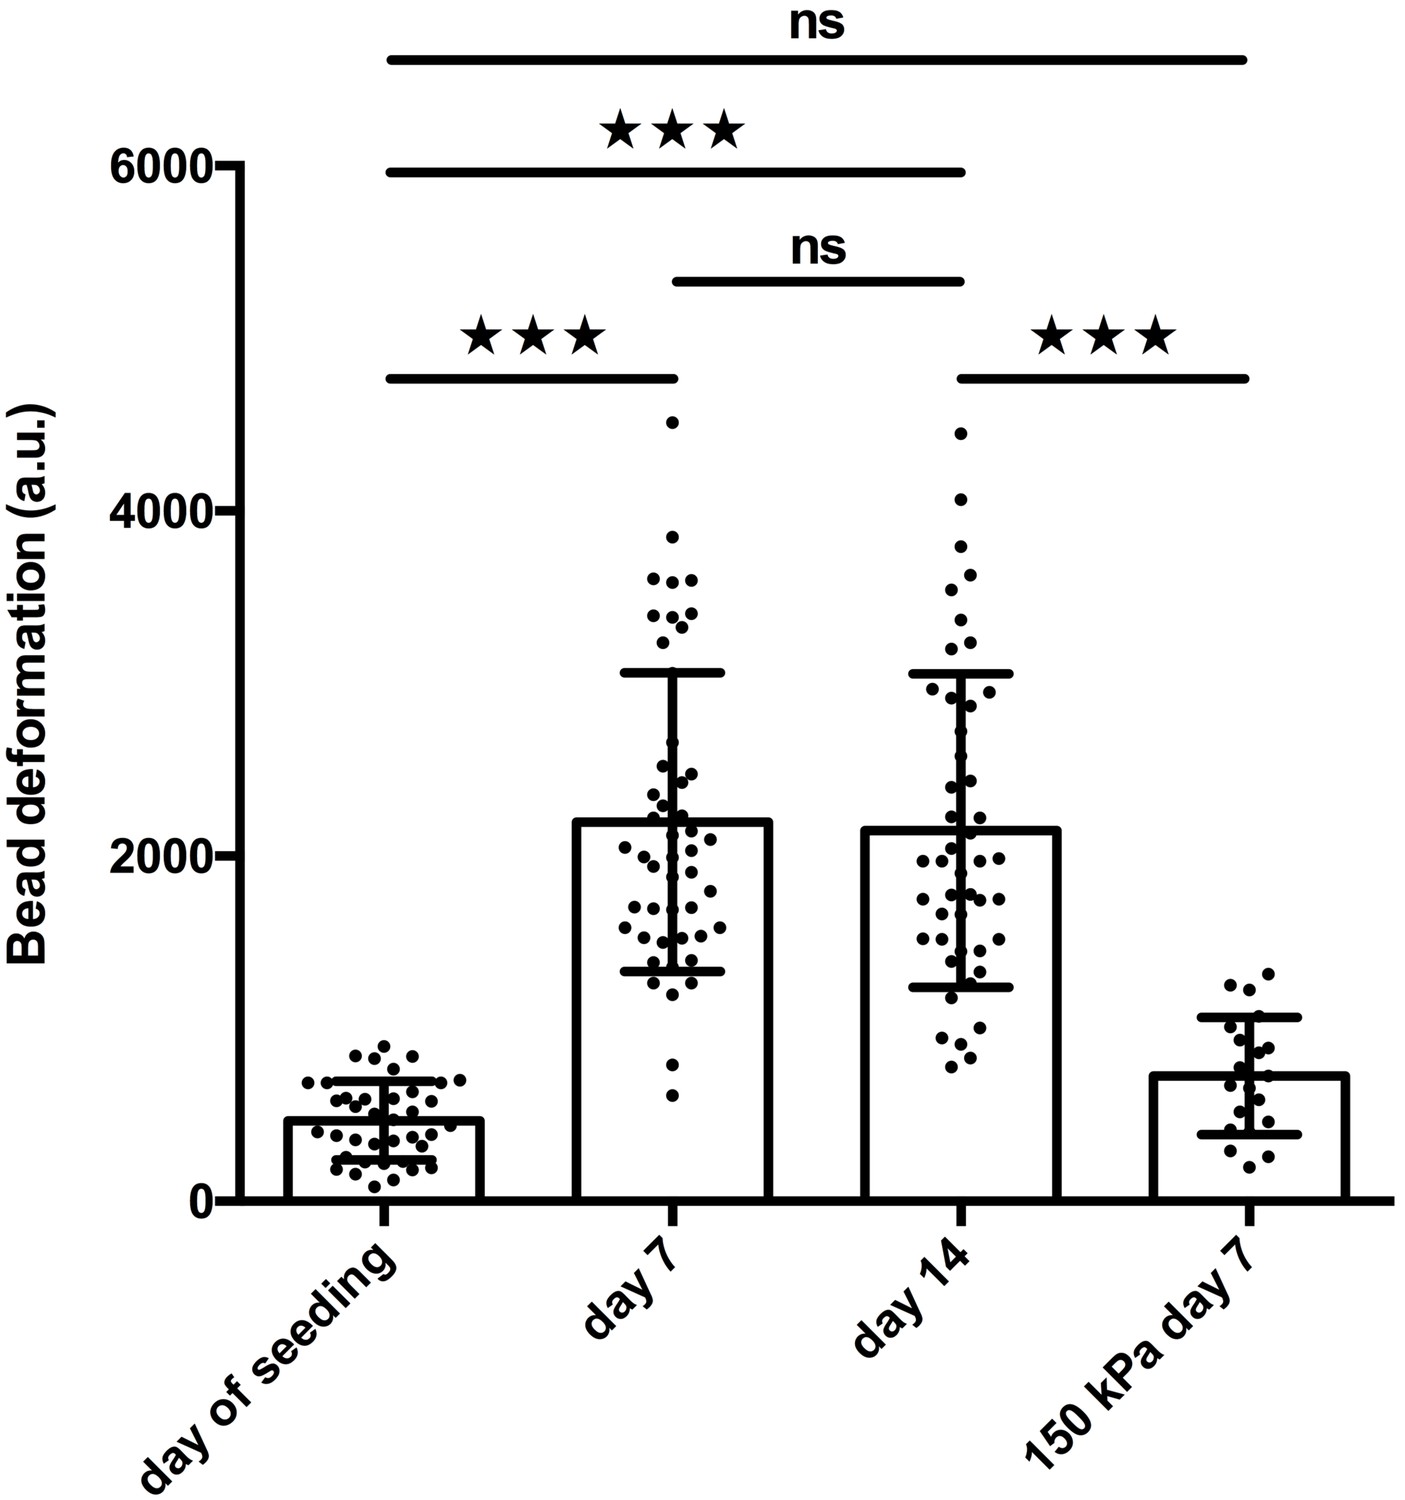
Stiff 150 kPA PAA beads do not get significantly deformed during biomimetic muscle tissue formation.
C2C12 microtissues with 2.1 kPa embedded were cultivated for 2 weeks and the PAA bead deformations were captured at the day of seeding (N = 13, n = 39) and after 7 days (N = 17, n = 48) as well as 14 days of differentiation (N = 19, n = 46), respectively. In parallel, C2C12 microtissues were cultivated with 150 kPa beads embedded. 150 kPa beads were not significantly more deformed after 7 days of differentiation (N = 4, n = 21) in comparison to 2.1 kPa beads at the day of seeding.
Figure 4—figure supplement 2

Microtissue fixation with 4% PFA for 15 min does not impair PAA tension sensor outcome.
2.1 kPa PAA beads were embedded in C2C12 microtissues and cultivated for 1 week. The exact same PAA beads were imaged and its deformation was analyzed before and after fixation, respectively.
Videos
Video 1
Flattened 8 hr timeseries stack of a developing human microtissue 4 days after differentiation shows highly dynamic nuclear motion and myoblast fusion events during myotube formation.
Lifeact-GFP (green) and H2B-mCherry (red) was stably introduced into AB1167 cells.
Video 2
Contraction of a human muscle microtissue upon optogenetically induced stimulation at two weeks of differentiation.
Channelrhodopsin-2 was stably introduced into AB1190 cells.
Video 3
Post-deflection upon contraction of a 2-week-old human AB1190 microtissue induced by 2 mM ACh.
Video 4
Post-deflection during dissolution of a 1-week-old human AB1167 microtissue with 10% SDS.
Video 5
3D confocal stack rotation of a 14-day-old C2C12 tissue with PAA beads embedded (red) and immunostained for sacomeric alpha-actinin (SAA, green) and counterstained with Hoechst 33342 to visualize nuclei (blue).
Video 6
Flattened 12.40 hr timeseries stack of a developing human microtissue 4 days after differentiation shows highly dynamic nuclear motion in closest proximity to a deformed PAA bead (red).
Lifeact-GFP (green) and H2B-mCherry (blue) was stably introduced into AB1167 cells. Video was recorded with a ×60 water immersion objective.
Video 7
Video tutorial for seeding and cultivation of biomimetic 3D skeletal muscle tissues.
Tables
Key resources table
| Reagent type (species) or resource | Designation | Source or reference | Identifiers | Additional information |
|---|---|---|---|---|
| Strain, background (Escherichia coli) | Stbl3 | Invitrogen | Cat# C737303 | Chemically competent cells |
| Cell line (M. musculus) | C2C12 myoblast | ATCC | Cat# CRL-1772 RRID:CVCL_0188 | |
| Cell line (Homo sapiens) | AB1167 myoblast | Vincent Mouly Mamchaoui et al., 2011 | ||
| Cell line (Homo sapiens) | AB1190 myoblast | Vincent Mouly Mamchaoui et al., 2011 | ||
| Plasmid | Fubi-ChR2-GFP | Edward Boyden | RRID:Addgene#22051 | |
| Plasmid | pLenti6-H2B- mCherry | Torsten Wittmann | RRID:Addgene#89766 | |
| Plasmid | pLenti.PGK. Lifeact-GFP.W | Rusty Lansford | RRID:Addgene#51010 | |
| Antibody | Anti-sarcomericalpha actinin (monoclonal mouse) | Abcam | Cat# ab9465 RRID:AB_307264 | IF 1:100 |
| Antibody | anti-mouse IgG1 (polyclonal goat) | Invitrogen | Cat# A21121 RRID:AB_2535764 | IF 1:1000 |
| Other | Hoechst 33342 | ThermoFisher | Cat# 62249 | 20 µM |
| Software | Elastic Bead Analysis | This paper | Wallmeyer, 2020; Hofemeier, 2021 | Software to analyse tension exerted on elastic beads using z-stack images of deformed beads |
| Software | Post-Deflection Analysis | This paper | https://github.com/Tillmuen09/PostDeflectionAnalysis | Software to analyse forces exerted on post using timelapse movies of post deflections |
Additional files
Download links
A two-part list of links to download the article, or parts of the article, in various formats.
Downloads (link to download the article as PDF)
Open citations (links to open the citations from this article in various online reference manager services)
Cite this article (links to download the citations from this article in formats compatible with various reference manager tools)
Global and local tension measurements in biomimetic skeletal muscle tissues reveals early mechanical homeostasis
eLife 10:e60145.
https://doi.org/10.7554/eLife.60145


