A statistical framework for assessing pharmacological responses and biomarkers using uncertainty estimates
- Sheffield Institute for Translational Neuroscience, University of Sheffield, United Kingdom
- Department of Computer Science, University of Sheffield, United Kingdom
- PROWLER.io, United Kingdom
- Institute of Computational Biology, Helmholtz Zentrum München—German Research Center for Environmental Health, Germany
- Department of Biology, Ludwig-Maximilians University Munich, Germany
- The Medical School, University of Sheffield, United Kingdom
- Wellcome Sanger Institute, United Kingdom
- Research and Early Development, Oncology R&D, AstraZeneca, United States
- Institute of Computational Biomedicine,Faculty of Medicine,Heidelberg Universityand Heidelberg University Hospital, Bioquant, Germany
- German Center for Diabetes Research (DZD e.V.), Germany
- Centre for Health Informatics, Computation and Statistics, Lancaster Medical School, Lancaster University, United Kingdom
Figures
Figure 1
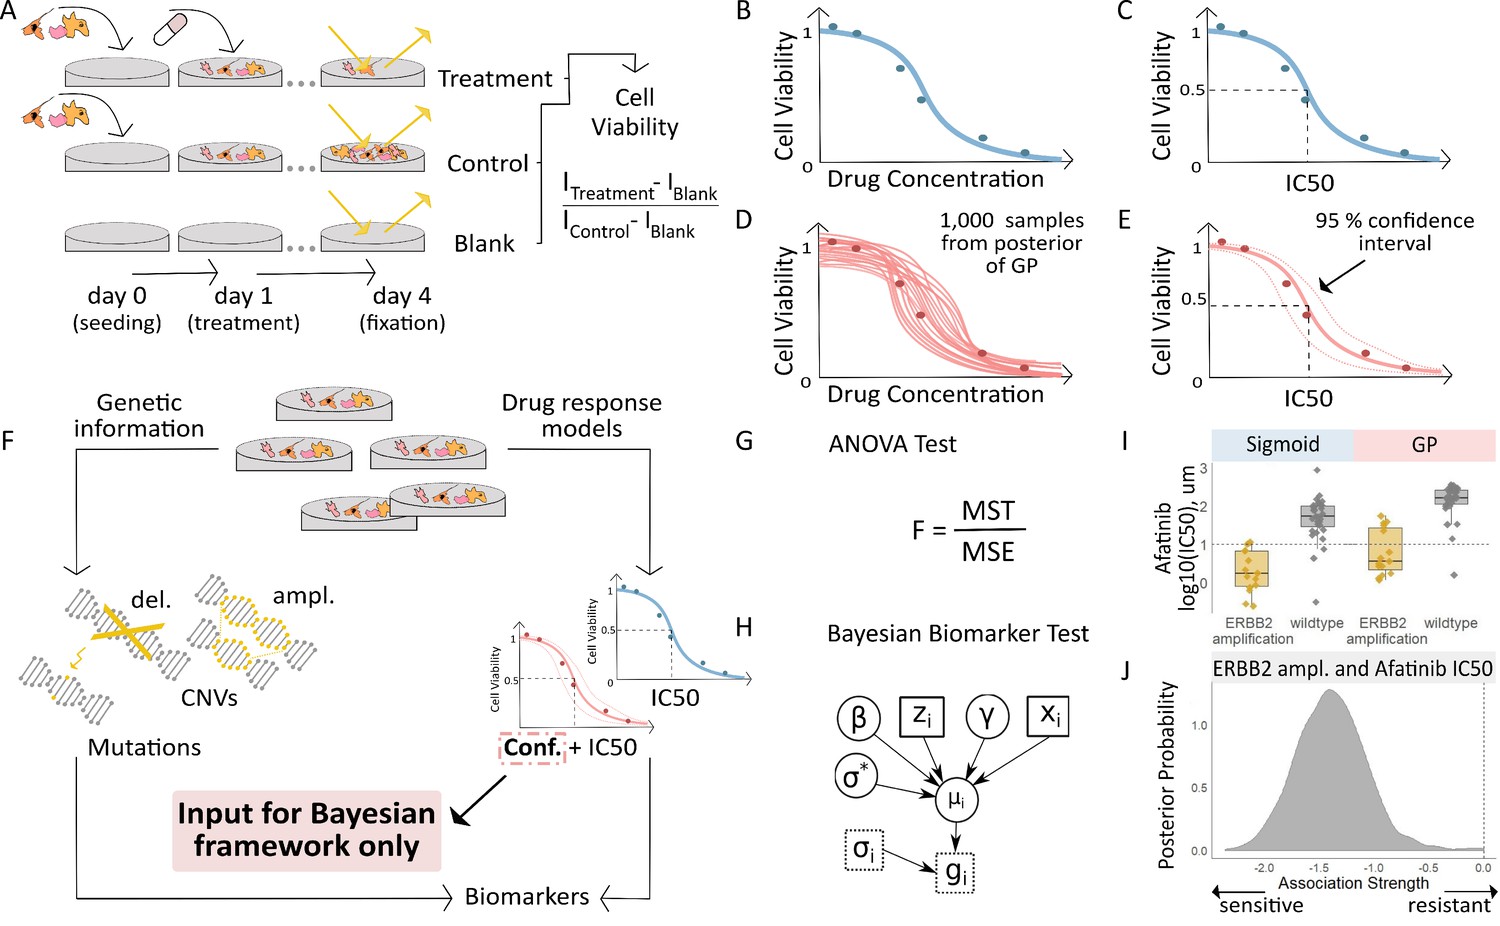
Workflow for fitting of Gaussian Process models to dose-response curves and estimating their uncertainty.
(A) Large-scale drug screens test cell lines with different drugs and at different doses are used to obtain dose-response data. (B) Typically, for each drug tested in a cell line, the sigmoid model is fit to the drug-response data and (C) the overall measures of response (IC50, AUC, etc.) are extracted. (D) For each drug tested in a cell line, we fit a GP model to the dose-response data. The GP allows us to sample from a distribution of possible dose-response curves, obtaining a measure of uncertainty. (E) From these curves, we can extract overall measures of response, such as IC50, and importantly, their 95% confidence intervals. (F) Mutation markers for each cell line can be determined based on presence/absence of single nucleotide polymorphisms (SNPs) in key genes. Both the drug-response estimates and the mutation markers are used to compute (G) the F-statistic for ANOVA, and (H) Bayesian test for biomarker association. The drug-response summary measure gi for cell line i is modelled via a cell line- specific mean µi and standard error σi. The mean is defined as a linear effect β of the biomarker status zi and a further effect γ from any remaining covariates xi, such as tissue type. The parameter σ* is the standard deviation of µi. (I) Boxplots illustrate the differences in the estimated mean IC50 of ERBB2 amplified and non-amplified breast cancer cell lines treated with afatinib. An ANOVA test was used to test this difference in means but did not consider uncertainty in each IC50 estimate. (J) We estimated posterior distributions of gene association using the Bayesian model, that is the effect of a genetic mutation on the IC50 measurement of drug response. Distributions centred on zero indicate no effect whilst distributions on either side of zero indicate positive or negative effects of mutations on drug response.
Figure 2 with 1 supplement
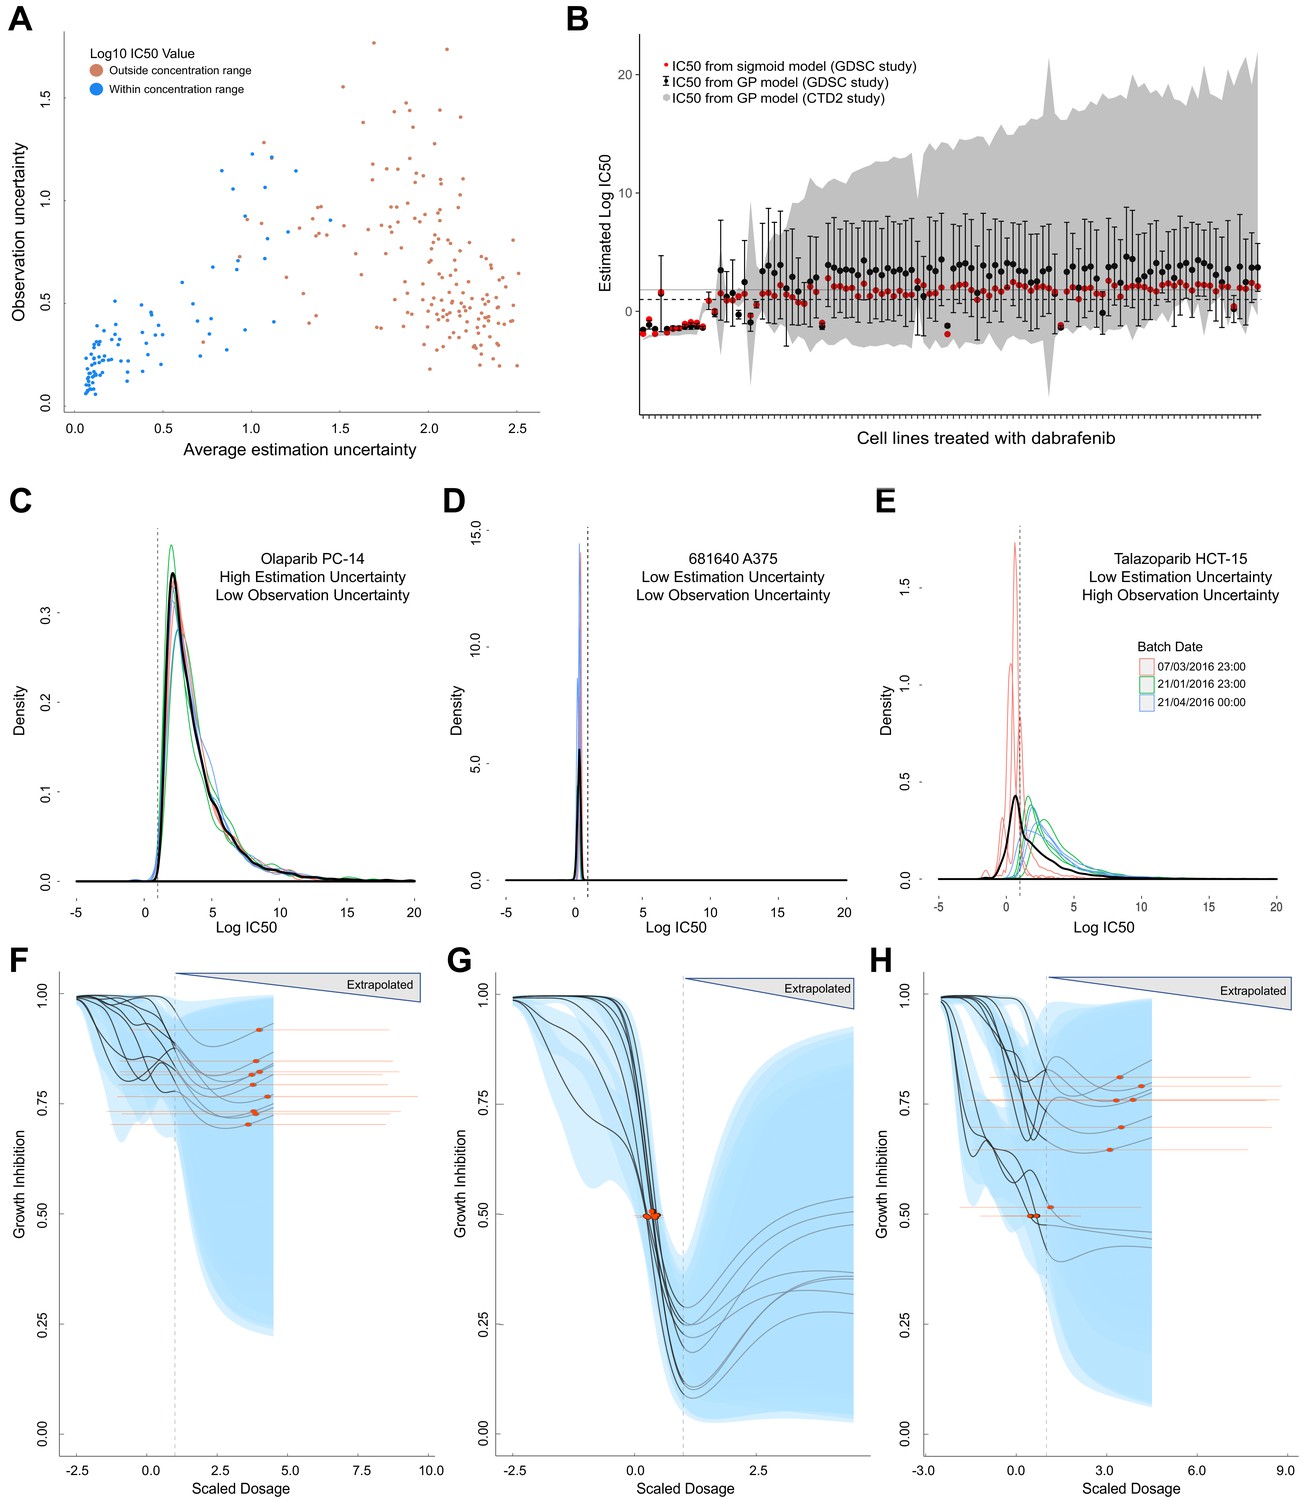
Comparison of GP estimates of uncertainty to replicate drug screening experiments.
(A) Comparison between observational uncertainty (standard deviation over replicates of log10(IC50) mean estimates) and estimation uncertainty (average over replicates of log10(IC50) standard deviation) from each replication experiment. The colour of the points indicates whether the log10(IC50) mean estimates were within or outside the maximum concentration range for each assay. (B) Mean IC50 and the estimation uncertainty from the GPs for a BRAF inhibitor (dabrafenib) tested in each cell line in two independent studies (GDSC and CTD2). Estimation uncertainty (error bars and grey shading) were larger beyond the max concentration in both GDSC (dashed line) and CTD2 (grey line). The point estimates of the IC50s from the GPs (black dots) were also comparable to the published IC50s (red dots). (C-E) Three sets of replicate experiments, representing different amounts of estimation and observation uncertainty. Each density represents the distribution of IC50 values from the Gaussian process samples from each replicate experiment. The colours represent different experimental batches. Narrow distributions demonstrate low estimation uncertainty and overlapping distributions demonstrate low observation uncertainty. The thick black line represents the density obtained by pooling samples from all replicates and the dashed line shows the maximal dosage tested. GP-curve fits corresponding to the three sets of replicate experiments showing IC50 estimates with (F) high uncertainty, (G) low uncertainty, and (H) mix of uncertainties depending on whether estimates are made within or beyond the max concentration. The blue areas represent the 95% confidence interval in the curve fits and extrapolated GP curves (light grey lines) are displayed up to five times the maximum concentration, where the uncertainty will be extremely high.
Figure 2—figure supplement 1
Investigation of batch effects in the replicate data.
Scatterplot of observation uncertainty against average estimation uncertainty, split by experimental batch.
Figure 3 with 2 supplements
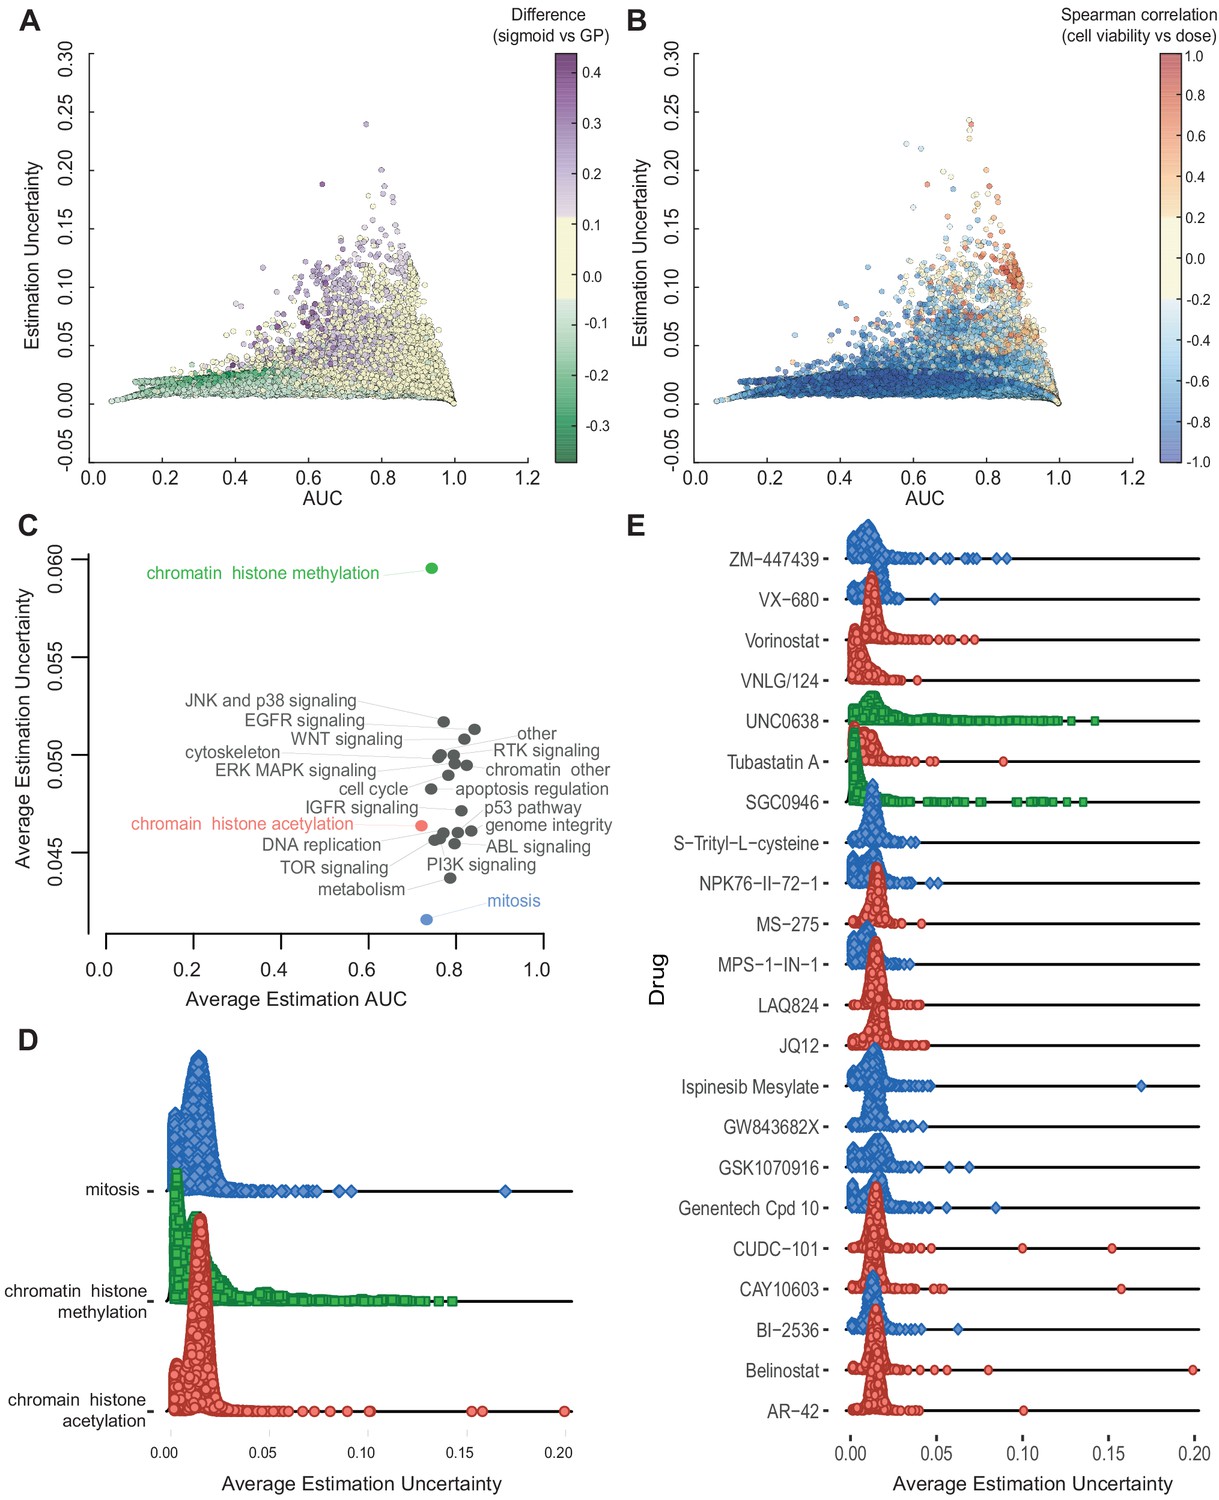
Relationship between AUC and uncertainties estimated from GPs across all experiments.
(A) Coloured by difference between the AUC estimated by sigmoid vs GP fits. (B) Coloured by Spearman correlation between cell viability and dose concentration in the raw data. Poorer experiments (orange-red) result in greater uncertainty and positively correlated with cell viability increasing with higher dose. (C) Average uncertainty and AUC for experiments with uncertain fits (estimation uncertainty >0.03) with drugs grouped by their target pathway. (D) Distribution of estimation uncertainty for all drugs targeting chromatin histone methylation, chromatin histone acetylation, and mitosis and (E) for individual drugs.
Figure 3—figure supplement 1
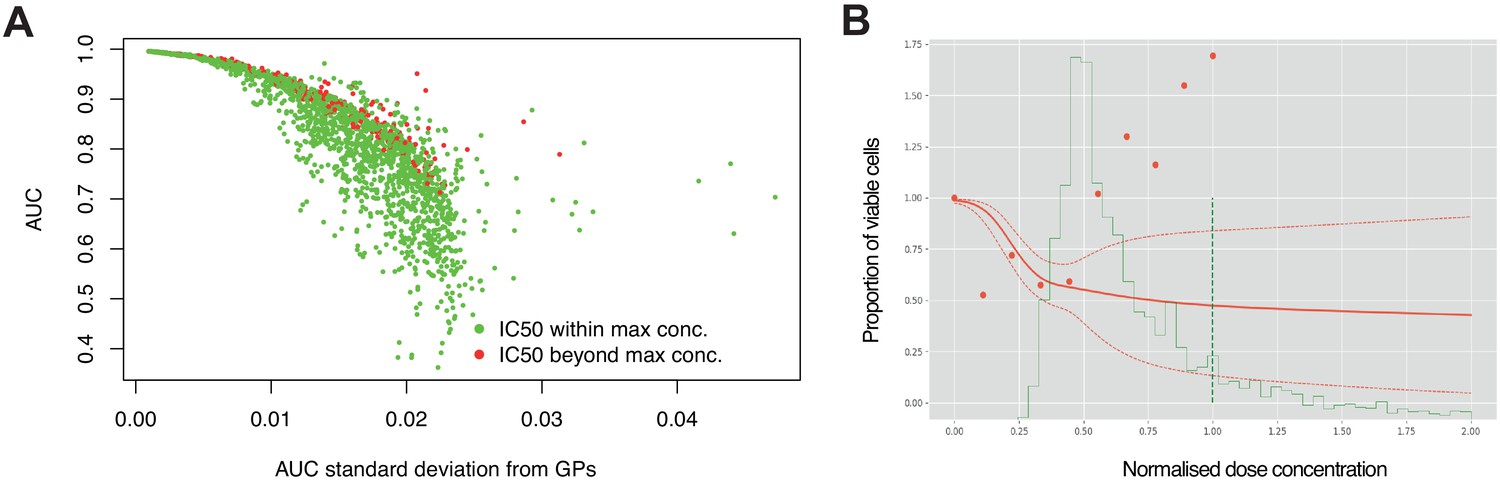
High estimation uncertainty independent of concentration range.
(A) Estimation uncertainty for AUC (standard deviation) across replicate experiments were robust to whether the IC50 was within or beyond the maximum concentration tested. (B) Dose- response of a single experiment where there was high estimation uncertainty (dotted red line) despite the fitted curve (red line) crossing 50% viable cells before reaching the max dose concentration (dotted green line). The probability distribution of IC50 is estimated across dose concentrations (solid green line), however, raw data points (red dots) show increased cell viability with increased dose.
Figure 3—figure supplement 2
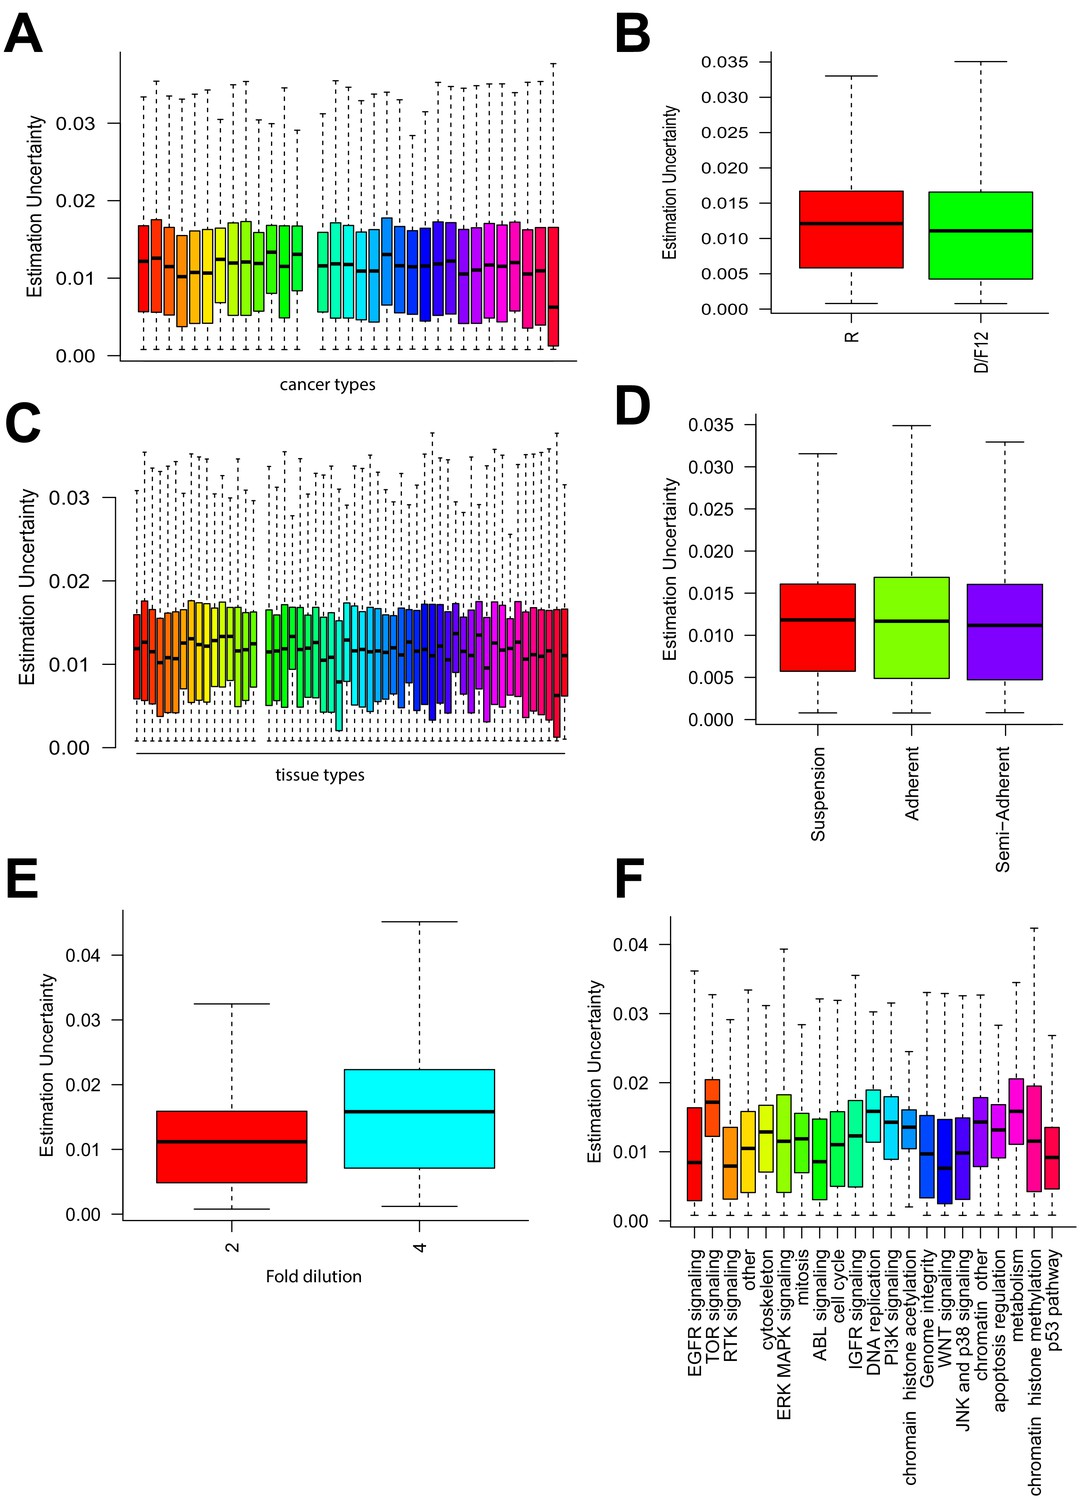
Relationship between uncertainties and other experimental factors.
Estimation uncertainty grouped by (A) cancer type of cell lines, (B) growth media used, (C) tissue of origin, (D) growth condition of the cells, (E) dilution factor for each dose tested of a drug, and (F) target pathways of drugs.
Figure 4 with 3 supplements
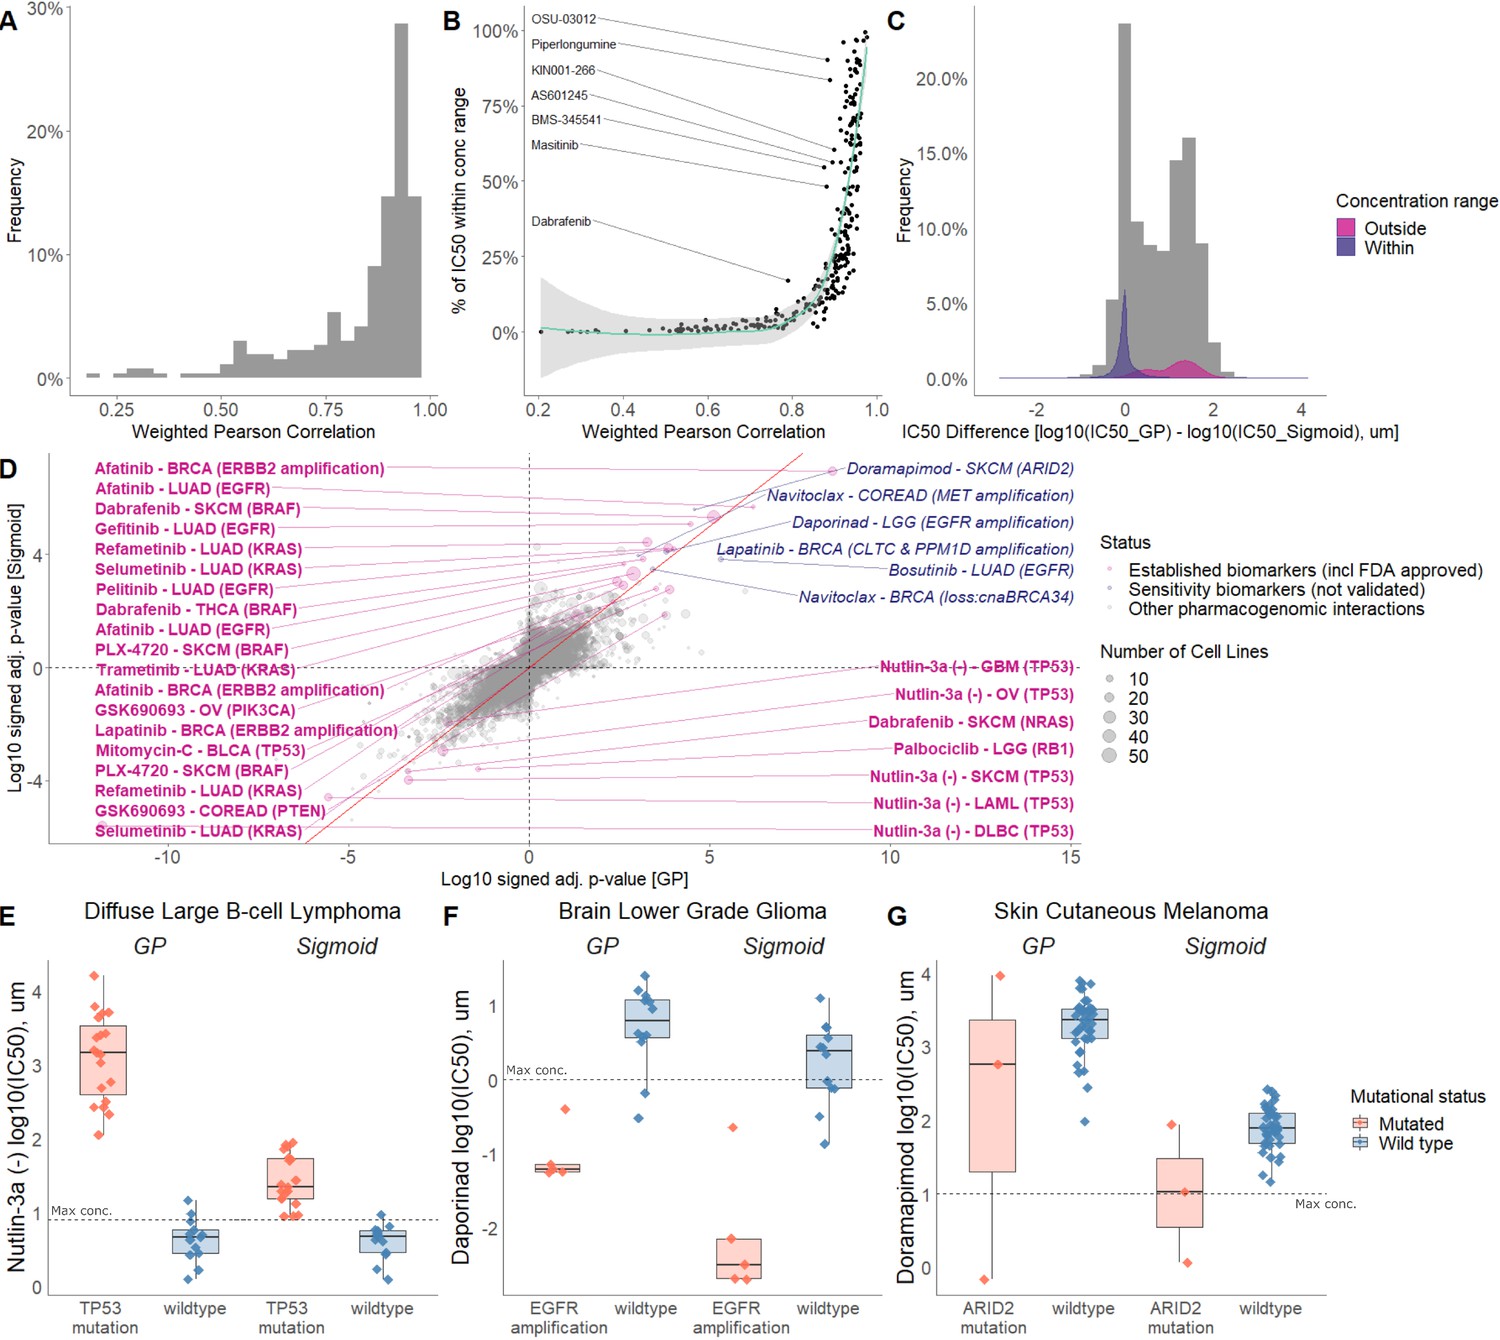
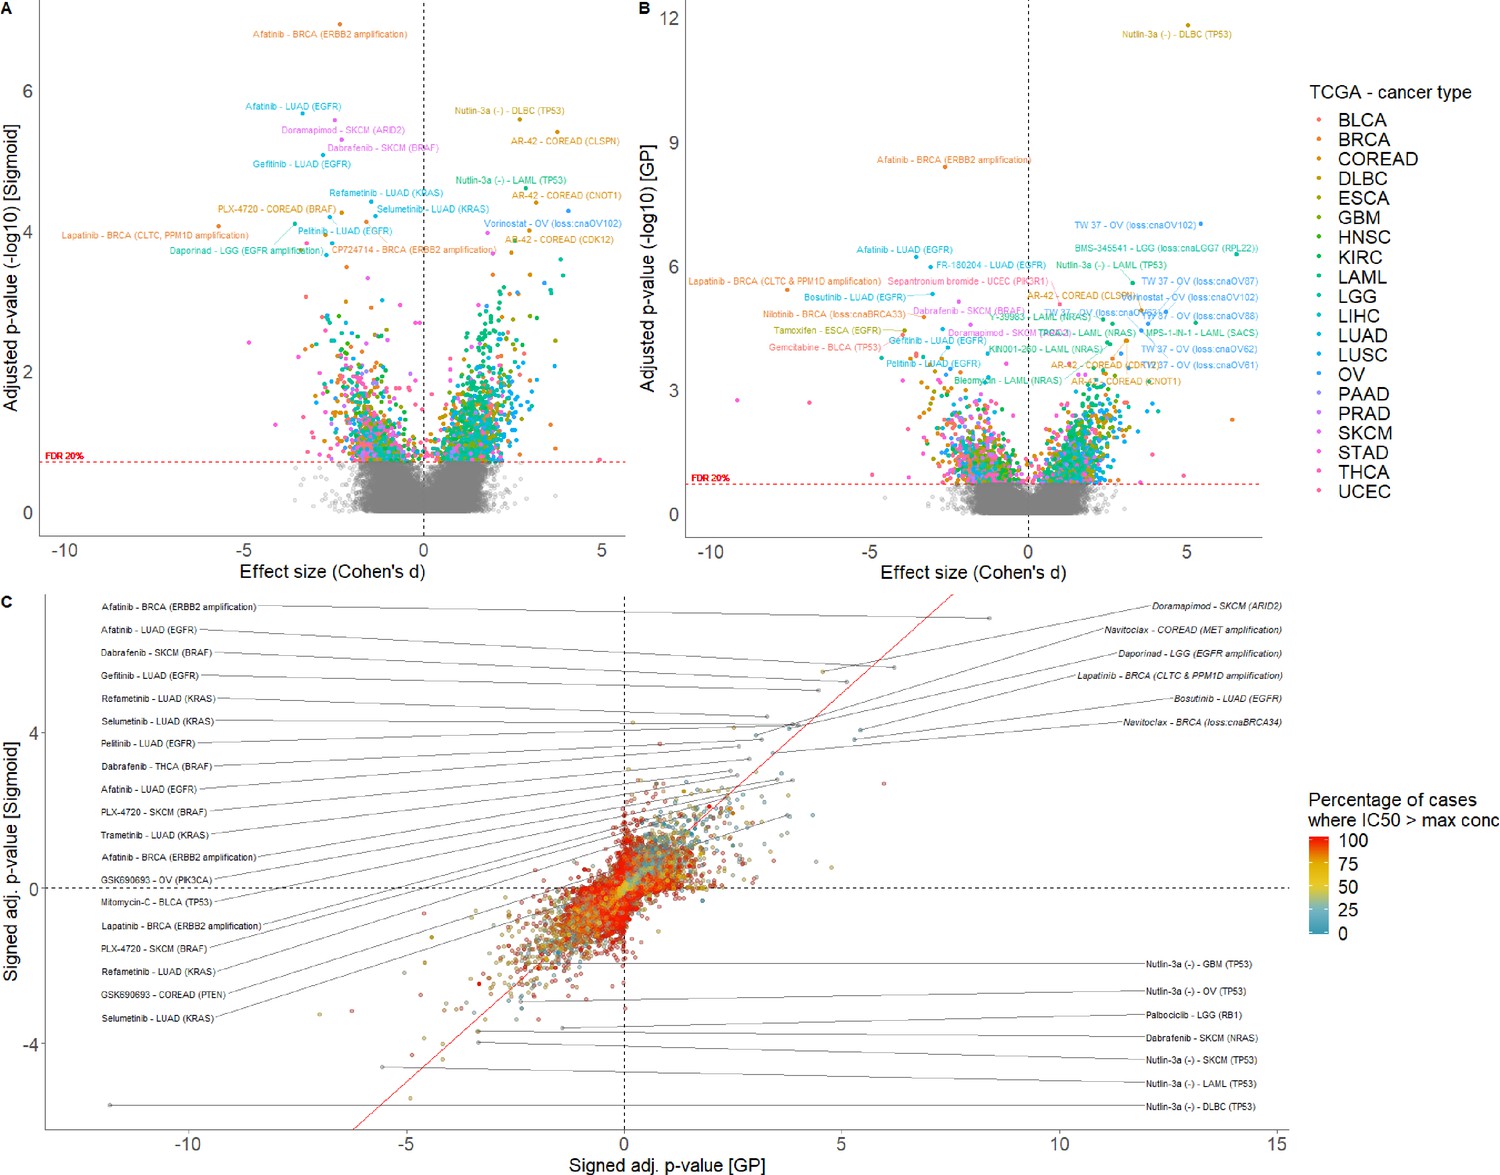
Comparison of sigmoid and GP-curve fitting.
(A) Weighted Pearson correlation of each drug within cancer types. (B) Comparing the concordance of sigmoid and GP-curve fitting when stratifying for percentage of cell lines with IC50 value lower than maximum concentration. (C) IC50 value difference between GP and sigmoid curves. Grey histogram represents frequency distribution of the IC50 value difference between GP and sigmoid curves without stratification by within/outside the concentration range. (D) Drug-response biomarker comparison based on both curve fittings (sigmoid vs GP). The Benjamini-Hochberg adjusted p-values are in log10 scale and signed based on the direction of the effect size (Cohen’s d). Additional biomarker examples for (E) diffuse large B-cell lymphoma (DLBCL) treated with nutlin-3a (MDM2 inhibitor) and stratified by TP53 mutants; (F) Low grade glioma (LGG) treated with daporinad (NAMPT inhibitor) and stratified by EGFR amplification; (G) Skin cutaneous melanoma (SKCM) treated with doramapimod (p38 and JNK2 inhibitor) and stratified with ARID2 mutations.
Figure 4—figure supplement 1
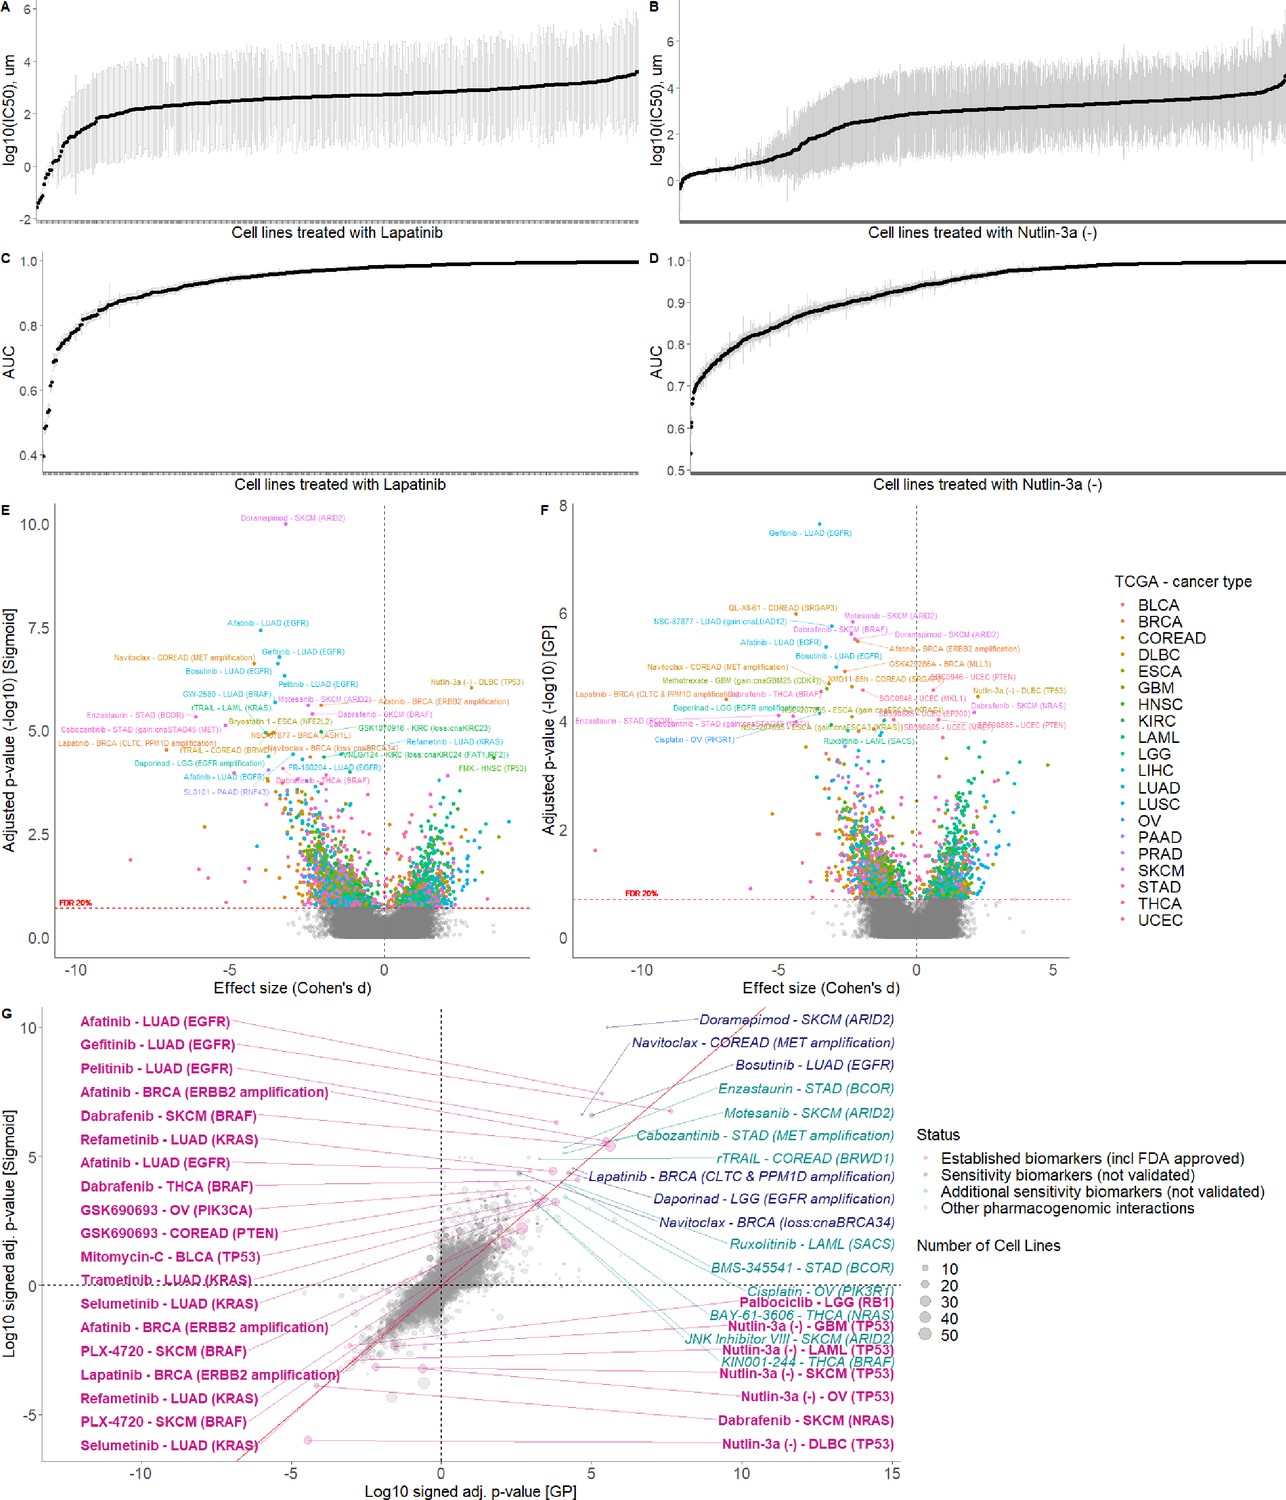
Comparison of GP and Sigmoid curve fitting using AUCs.
GP fitted log10(IC50)s with standard error (grey error bars) of the cell lines treated with (A) Lapatinib and (B) Nutlin-3a. GP fitted AUCs with standard error (grey error bars) of the cell lines treated with (C) Lapatinib and (D) Nutlin-3a. Volcano plot of drug-response biomarker associations based on (E) sigmoid and (F) GP-curve fitting using AUC as a measure. (G) Drug-response biomarker comparison based on both curve fittings.
Figure 4—figure supplement 2
Comparison of sigmoid and GP-curve fitting using IC50s.
Volcano plot of drug-response biomarker associations based on (A) sigmoid and (B) GP-curve fitting. (C) Drug-response biomarker comparison based on both curve fittings, and colour coding percentage of drug-response data observed within- concentration range.
Figure 4—figure supplement 3
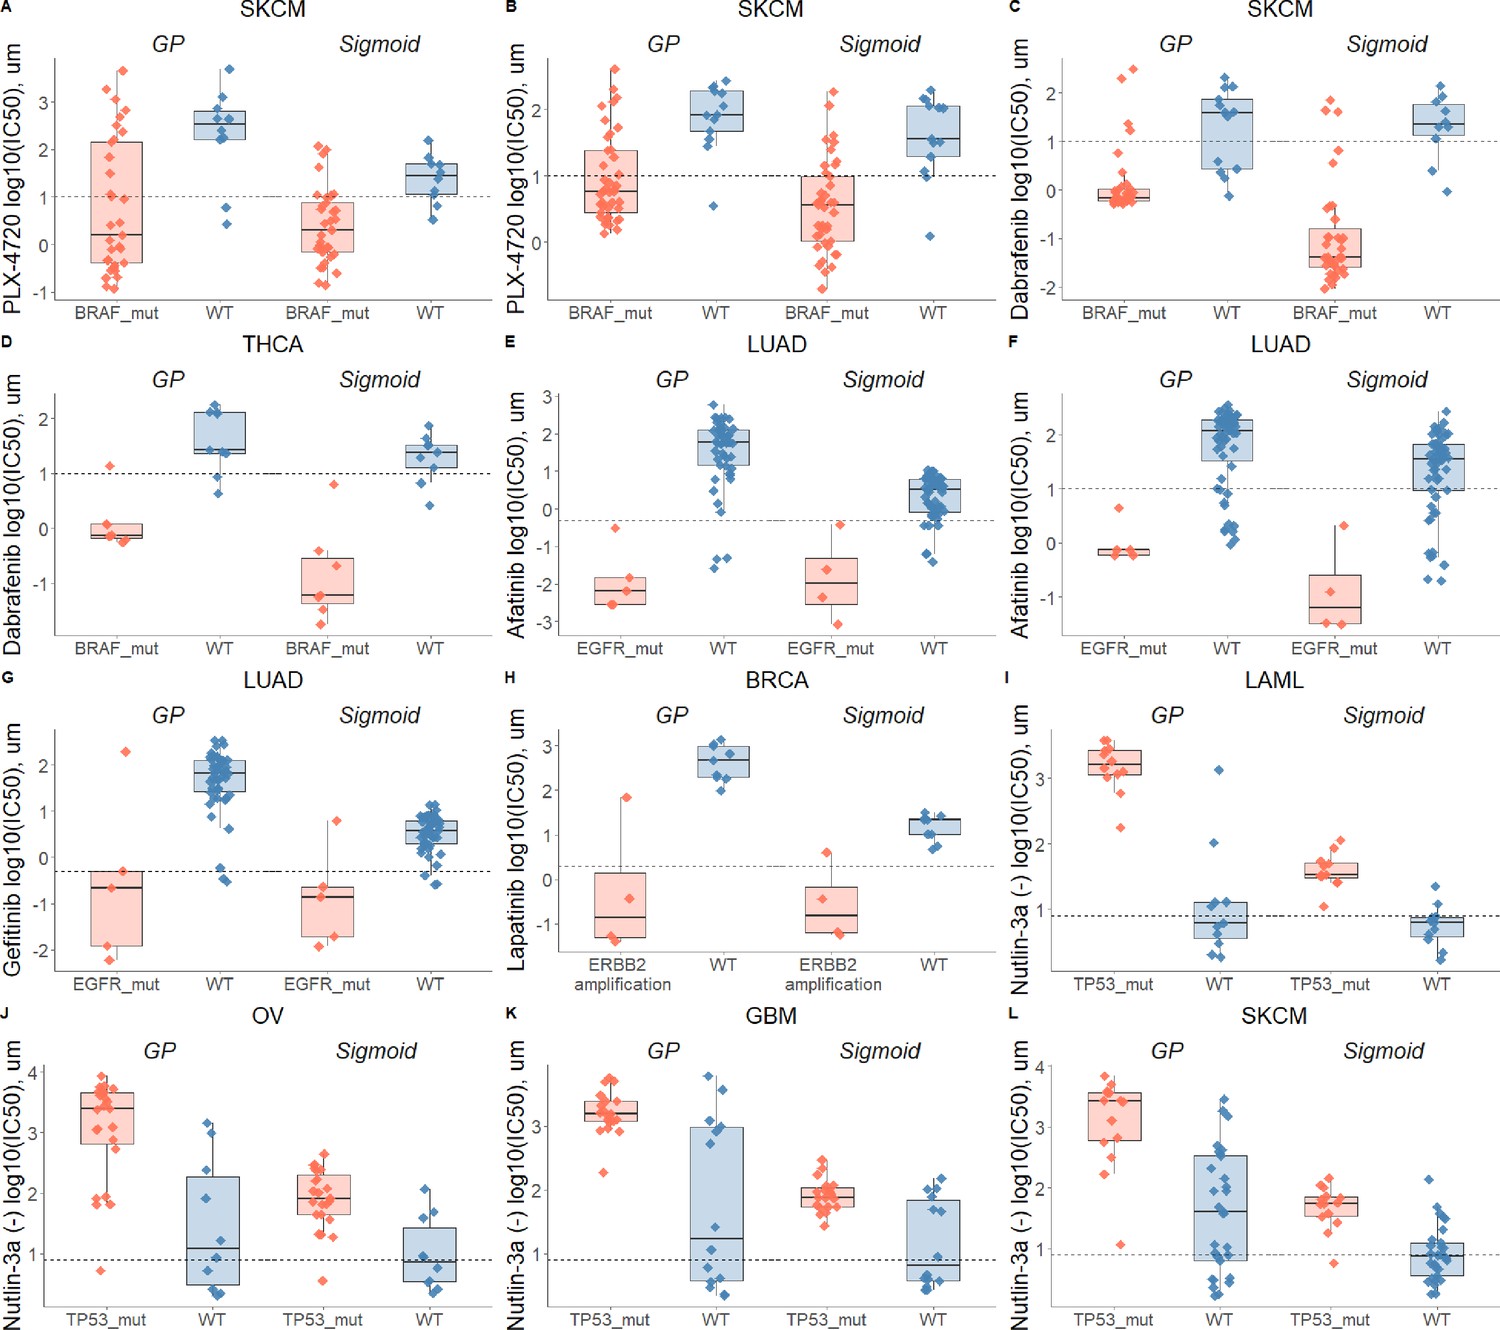
Drug-response biomarker comparison based on both curve fittings.
Dashed line depicts maximum concentration. (A) Skin cutaneous melanoma (SKCM) treated with PLX-4720 (BRAF inhibitor) and stratified with BRAF mutations; (B) Skin cutaneous melanoma (SKCM) treated with PLX-4720 (BRAF inhibitor) and stratified with BRAF mutations - replicate; (C) Skin cutaneous melanoma (SKCM) treated with Dabrafenib (BRAF inhibitor) and stratified with BRAF mutations; (D) Thyroid carcinoma (THCA) treated with Dabrafenib (BRAF inhibitor) and stratified with BRAF mutations; (E) Lung adenocarcinoma (LUAD) treated with Afatinib (ERBB2, EGFR inhibitor) and stratified with EGFR mutations; (F) Lung adenocarcinoma (LUAD) treated with Afatinib (ERBB2, EGFR inhibitor) and stratified with EGFR mutations - replicate; (G) Lung adenocarcinoma (LUAD) treated with Gefitinib (EGFR inhibitor) and stratified with EGFR mutations; (H) Breast invasive carcinoma (BRCA) treated with Lapatinib (ERBB2, EGFR inhibitor) and stratified with ERBB2 amplifications; (I) Acute Myeloid Leukemia (LAML) treated with nutlin-3a (MDM2 inhibitor) and stratified by TP53 mutants; (J) Ovarian serous cystadenocarcinoma (OV) treated with nutlin-3a (MDM2 inhibitor) and stratified by TP53 mutants; (K) Glioblastoma multiforme (GBM) treated with nutlin-3a (MDM2 inhibitor) and stratified by TP53 mutants; (L) Skin cutaneous melanoma (SKCM) treated with nutlin-3a (MDM2 inhibitor) and stratified by TP53 mutants.
Figure 5 with 2 supplements
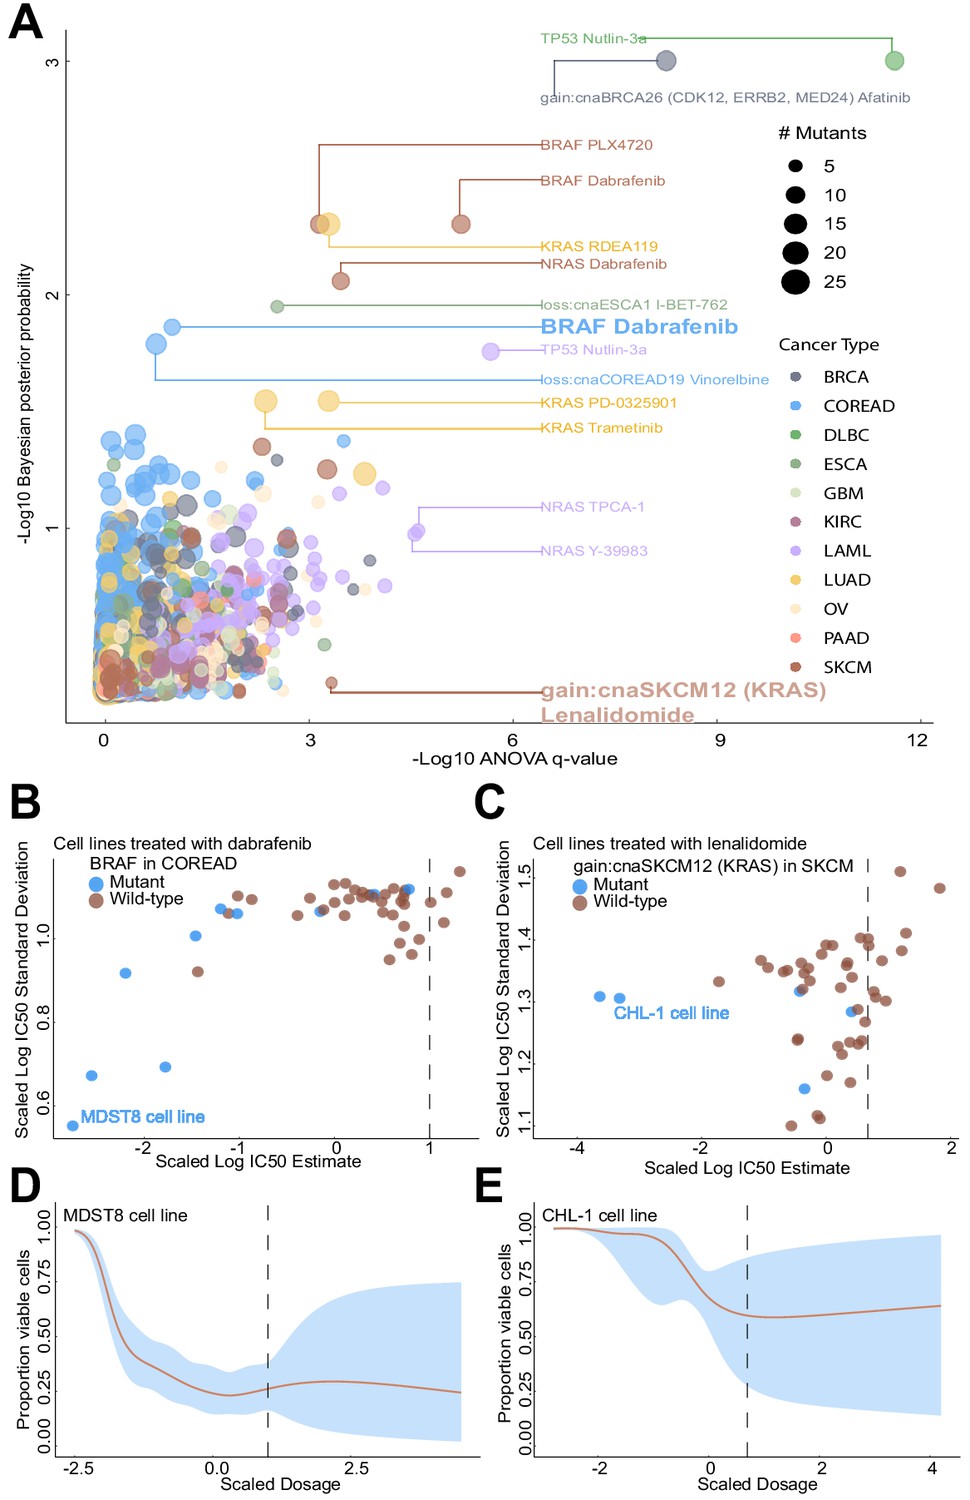
Comparison of Bayesian testing and ANOVA using the GP IC50 estimates.
(A) Scatterplot of biomarker associations with IC50 drug response. The y-axis shows the negative log10 transformed posterior probability of a sign change in the effect under the Bayesian testing model, whilst the x-axis shows the negative log10 of the q-value from ANOVA testing. The size of the circles is proportional to the number of mutants or copy number variations in the given type of cancer cell line. (B) GP estimates for the mean and standard deviation of the log(IC50) from colorectal cell lines tested with BRAF inhibitor dabrafenib, which showed significant association with BRAF mutation in the Bayesian test. (C) Estimated IC50 and its uncertainty for skin cutaneous melanoma cell lines tested with the immunomodulatory drug lenalidomide, which showed significant association with KRAS copy number alteration in the ANOVA test. Black vertical lines show the location of the maximum experimental drug dosage. Dose-response curve of the (D) MDST8 colorectal cancer cell lines with BRAF mutation treated with dabrafenib. The black dotted line represents the maximum concentration of the drug used to treat the cell lines. The blue area represents the 95% confidence intervals in the dose-response fits. (E) Similar to (D) but for CHL-1 skin cutaneous melanoma cell lines with KRAS copy number alteration treated with lenalidomide.
Figure 5—figure supplement 1
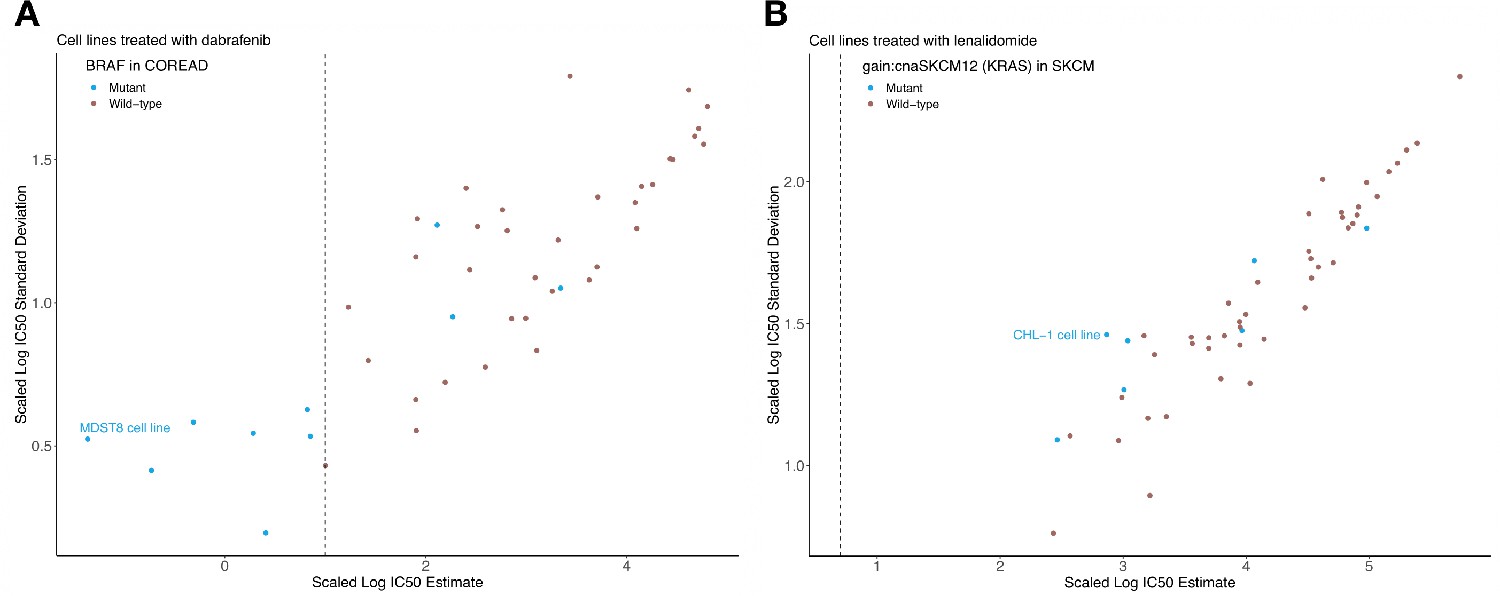
Sigmoid curve fitting uncertainty.
Estimated log10(IC50) and uncertainties based on a bootstrap sampling method, for (A) colorectal cell lines tested with dabrafenib and (B) skin cutaneous melanoma cell lines tested with lenalidomide. Black vertical line represents the maximum experimental drug dosage.
Figure 5—figure supplement 2
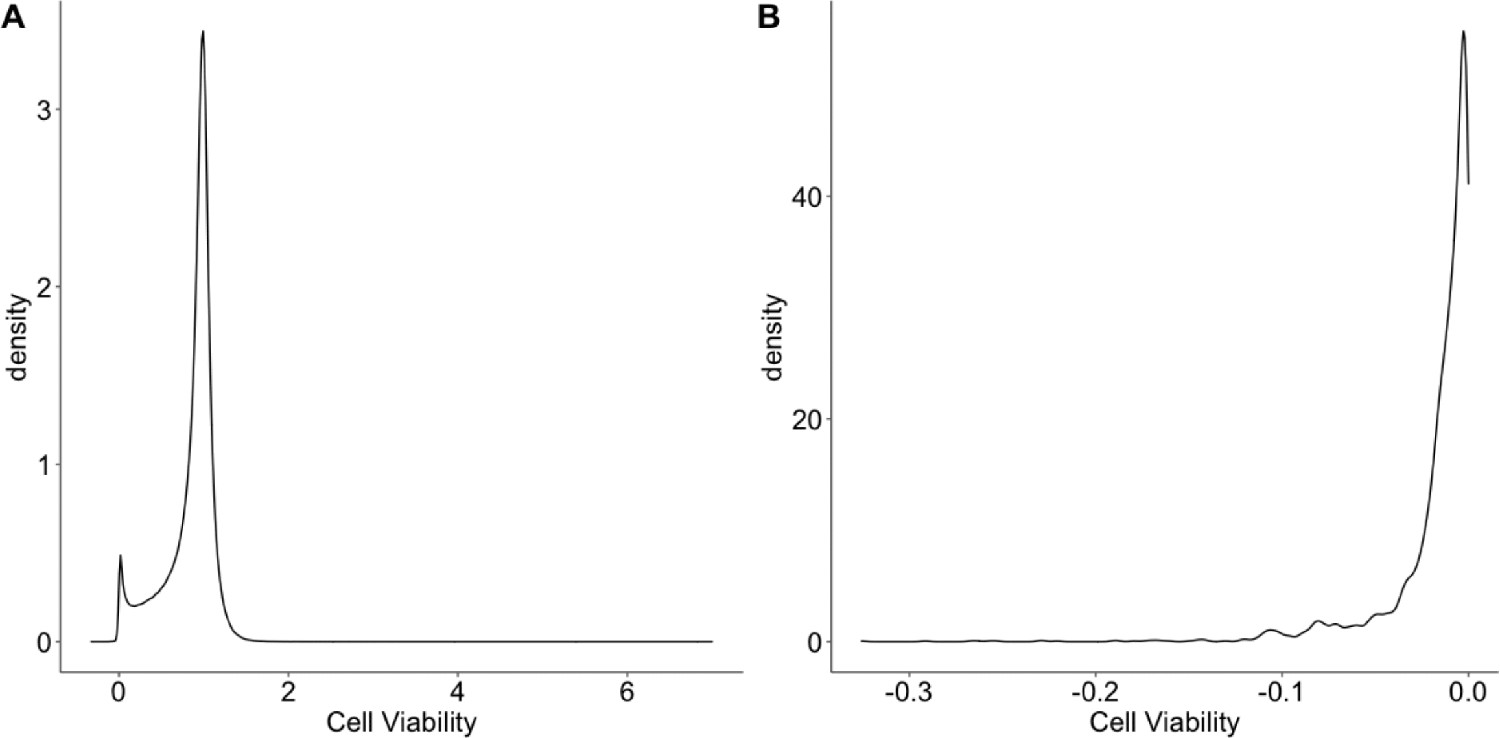
An overview of the cell viability values.
(A) The distribution of the cell viability values. (B) The distribution of negative cell viability values.
Tables
Key resources table
| Reagent type (species) or resource | Designation | Source or reference | Identifiers | Additional information |
|---|---|---|---|---|
| Cell line (Home sapines) | 1074 cancer cell lines | (Iorio et al., 2016) PMID:27397505 | GDSC cell line drug response:GDSC1 (v17); GDSC cell line genomics:GDSCtools_mobems | Further information about the cancer cell lines from the GDSC can be found here: https://www.cancerrxgene.org/downloads/bulk_download |
| Software, algorithm | Source code for curve fitting and Bayesian biomarker detection | This paper | All source code can be found via GitHub here: https://github.com/FrankD/GPDrugModels | |
| Software, algorithm | GPFlow | GPFlow (https://www.gpflow.org) | Version 1.5.1 | |
| Software, algorithm | TensorFlow | TensorFlow (https://www.tensorflow.org/) | Version 1.14.0 |
Additional files
-
Supplementary file 1
Summary of pharmacogenomic associations based on ANOVA.
- https://cdn.elifesciences.org/articles/60352/elife-60352-supp1-v3.xlsx
-
Supplementary file 2
Pharmacogenomic associations based on Bayesian testing of GP-curve fits.
- https://cdn.elifesciences.org/articles/60352/elife-60352-supp2-v3.xlsx
-
Supplementary file 3
Raw and curve fitted replicate dataset.
- https://cdn.elifesciences.org/articles/60352/elife-60352-supp3-v3.xlsx
-
Supplementary file 4
GP-curve fits dataset with calculated summary statistics.
- https://cdn.elifesciences.org/articles/60352/elife-60352-supp4-v3.xlsx
-
Transparent reporting form
- https://cdn.elifesciences.org/articles/60352/elife-60352-transrepform-v3.docx
Download links
A two-part list of links to download the article, or parts of the article, in various formats.
Downloads (link to download the article as PDF)
Open citations (links to open the citations from this article in various online reference manager services)
Cite this article (links to download the citations from this article in formats compatible with various reference manager tools)
A statistical framework for assessing pharmacological responses and biomarkers using uncertainty estimates
eLife 9:e60352.
https://doi.org/10.7554/eLife.60352


