Metabolic control of cellular immune-competency by odors in Drosophila
- Institute for Stem Cell Science and Regenerative Medicine (inStem), India
- Manipal Academy of Higher Education, India
- Department of Life Science, College of Natural Science, Hanyang University, Republic of Korea
- The University of Trans-Disciplinary Health Sciences & Technology (TDU), India
- Research Institute for Natural Science, Hanyang University, Republic of Korea
Figures
Figure 1 with 2 supplements
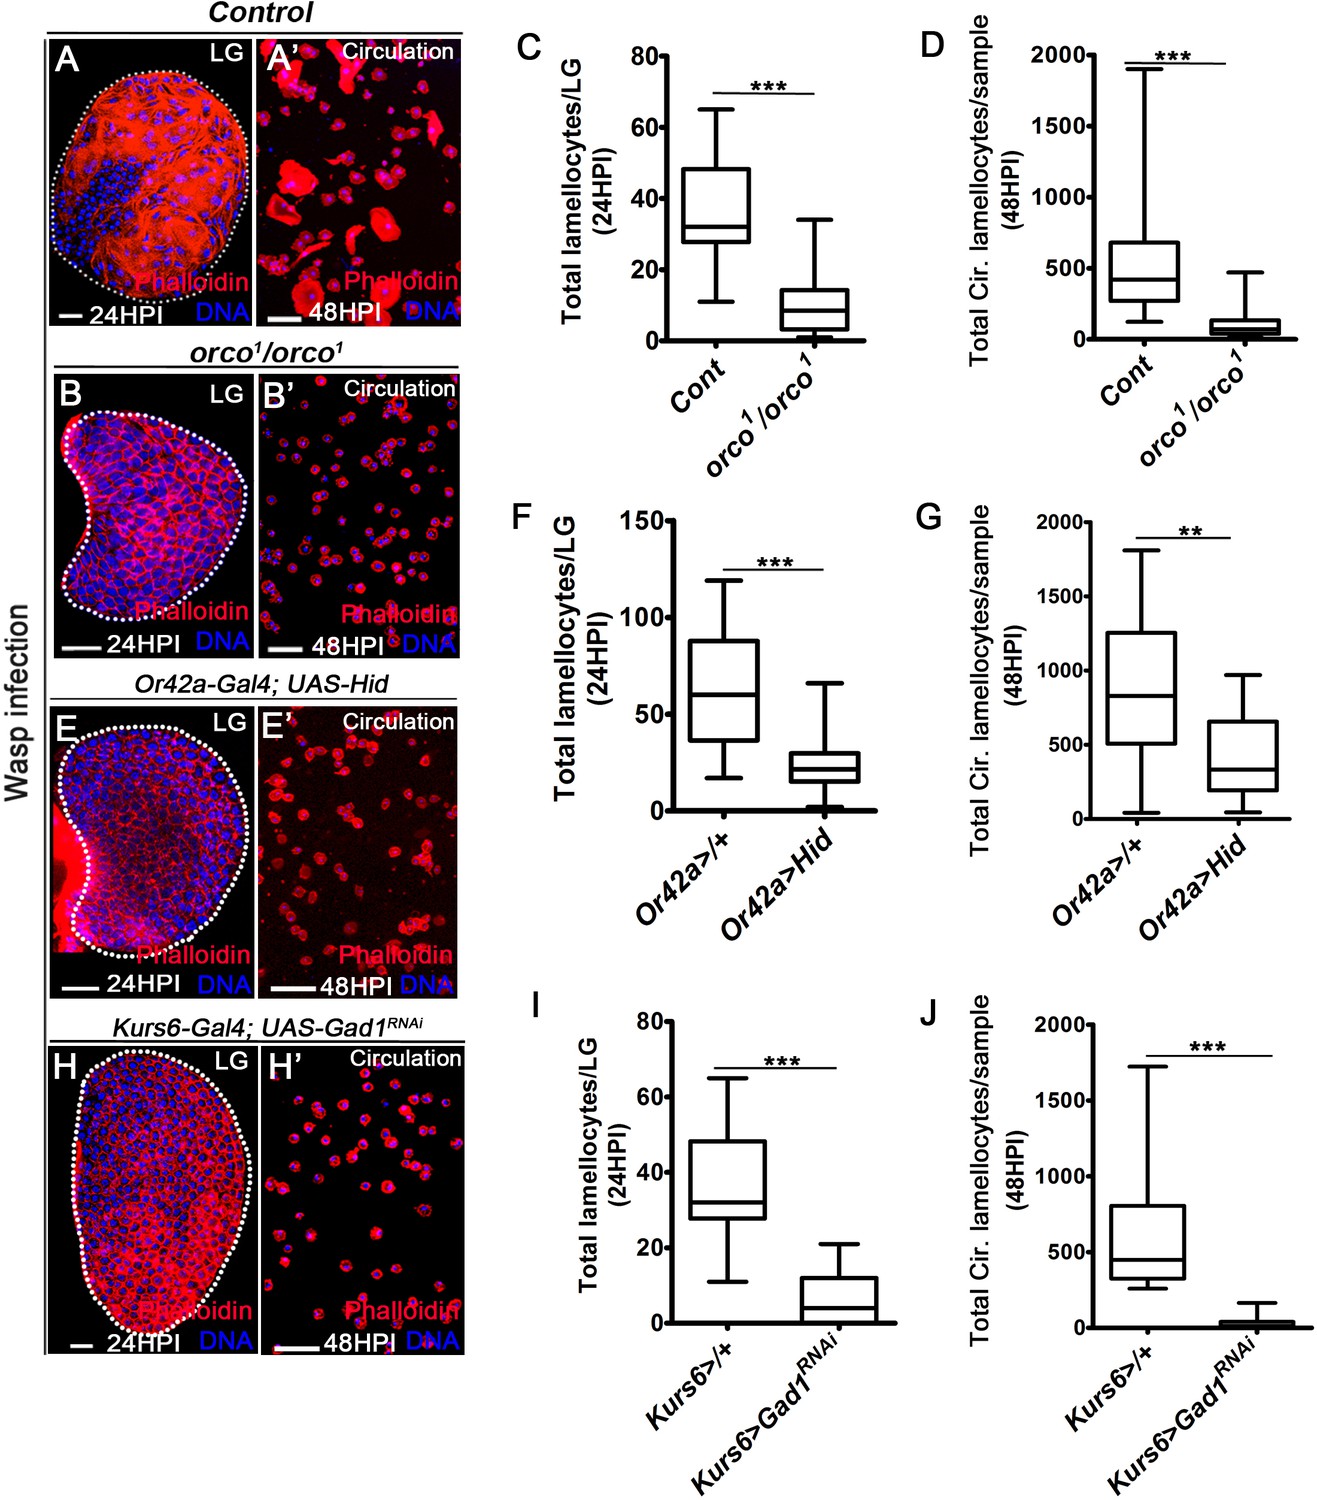
Odor-mediated neuronal GABA availability specifies lamellocyte potential.
DNA is stained with DAPI (blue). Phalloidin (red) marks blood cells and lamellocytes are characterized by their large flattened morphology. Scale bars in panels A, B, E, H = 20 µm and A’, B’, E’, H’ = 50 µm. HPI indicates hours post wasp-infection, and LG is lymph gland. In lymph gland, lamellocytes analyzed at 24HPI and in circulation at 48HPI. In panels (C, D, F, G, I, J), median is shown in box plots and vertical bars represent upper and lowest cell-counts and statistical analysis is Mann-Whitney test, two-tailed. ‘n’ represents the total number of larvae analyzed, and for lymph gland ‘n’ represents lymph gland lobes analyzed. White dotted lines demarcate lymph glands. For better representation of the lymph gland primary lobes, the images shown, have been edited for removal of adjacent tissues (like dorsal vessel and ring gland). (A–A’) Control (w1118) infected larvae showing lamellocyte induction in (A) lymph gland and (A’) circulation. (B–D) Compared to (A–A’) control (w1118), orco1/orco1 mutant larvae show reduction in lamellocyte in (B, C) lymph gland (n = 20, ***p<0.0001 compared to w1118, n = 18) and (B’, D) circulation (n = 18, ***p<0.0001 compared to w1118, n = 23). (E–G) Specifically ablating Or42a (Or42a-Gal4; UAS-Hid) causes reduction in lamellocytes in (E, F) lymph gland (n = 24, ***p<0.0001 compared to Or42a-Gal4/+, n = 24) and (E’, G) circulation (n = 20, **p=0.004 compared to Or42a-Gal4/+, n = 19). (H–J) Blocking neuronal GABA bio-synthesis in Kurs6+ neurons (Kurs6-Gal4; UAS-Gad1RNAi) recapitulates lamellocyte reduction in (H, I) lymph gland (n = 22, ***p<0.0001 compared to Kurs6-Gal4/+, n = 18) and (H’, J) circulation (n = 25, ***p<0.0001 compared to Kurs6-Gal4/+, n = 22).
-
Figure 1—source data 1
Contains numerical data plotted in Figure 1C,D,F,G,I and J.
- https://cdn.elifesciences.org/articles/60376/elife-60376-fig1-data1-v2.xlsx
Figure 1—figure supplement 1
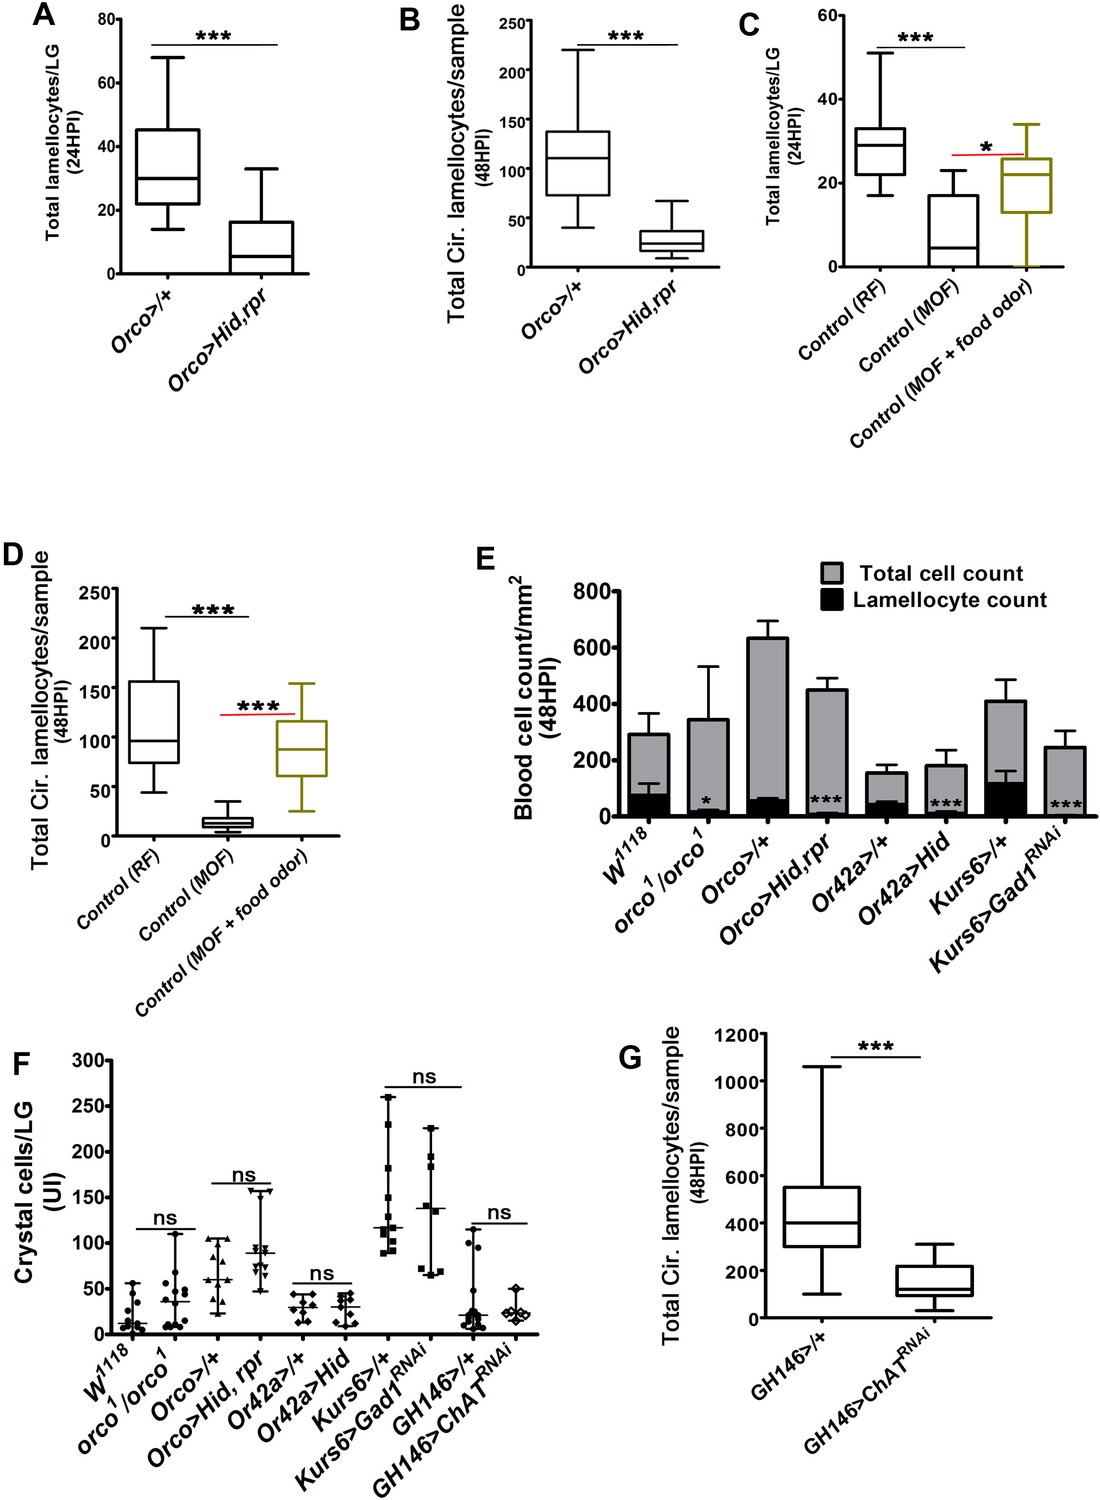
Olfaction/GABA axis controls lamellocyte induction.
UI is uninfected, HPI indicates hours post wasp-infection, RF is regular food, and MOF is minimal odor food. In lymph gland, lamellocytes analyzed at 24HPI and in circulation at 48HPI. In panels (A– D) and (F–G), median is shown in box plots and vertical bars represent upper and lowest cell counts, and in panel (E), mean ± standard deviation (mean ± SD) is shown. Statistical analysis in panels (A– D) and (F–G) is Mann-Whitney test, two-tailed and in panel (E) is unpaired t-test, two-tailed. ‘n’ represents the total number of larvae analyzed, and for lymph glands ‘n’ represents lymph gland lobes analyzed. ns means nonsignificant. (A–B) Olfactory neuron ablation inhibits lamellocyte differentiation both in the (A) lymph gland Orco-Gal4/+ (n = 14, control) and Orco-Gal4, UAS-Hid, rpr (n = 16, ***p=0.0001) and (B) circulation Orco-Gal4/+ (n = 34, control) and Orco-Gal4, UAS-Hid, rpr (n = 36, ***p<0.0001). (C, D) Larvae reared on minimal odors show lamellocyte defect both in lymph gland and in circulation, which is restored by providing food odors. Quantification of (C) lymph gland lamellocyte counts in RF (n = 11), MOF (n = 12, ***p=0.0002), and MOF rescue with food odors (n = 14, *p=0.0113), (D) total circulating lamellocytes on RF (n = 23), MOF (n = 21, ***p<0.0001), and MOF rescue with food odors (n = 18, ***p<0.0001). (E) Quantification of total circulating blood cell numbers per mm2 in animals at 48 HPI. Represented here are the numbers of lamellocytes (black bar) and total cell counts (gray bar) counted per mm2. Compared to total blood cell densities a significant reduction in lamellocyte numbers is seen in orco1/orco1 (n = 5, *p<0.0001) in comparison to w1118 (n = 6), Or42a-Gal4; UAS-Hid (n = 5, ***p=0.0005) in comparison to Or42a-Gal4/+(n = 5), Orco-Gal4; UAS-Hid, rpr (n = 9, ***p<0.0001) in comparison to Orco-Gal4/+ (n = 9) and Kurs6-Gal4; UAS-Gad1RNAi (n = 6, ***p=0.0001) compared to Kurs6>/+(n = 6). (F) Quantification of total crystal cells (Hindsight+) per lymph gland lobe in control, w1118 (n = 11), orco1/orco1, (n = 14, ns), Orco-Gal4/+ (n = 11), Orco-Gal4; UAS-Hid, rpr (n = 13, ns), Or42a-Gal4/+ (n = 8), Or42a-Gal4; UAS-Hid (n = 9, ns), Kurs6>/+(n = 11), Kurs6-Gal4; UAS-Gad1RNAi (n = 8, ns), GH146>/+ (n = 17), GH146-Gal4; UAS-ChATRNAi (n = 6, ns). For details refer Supplementary file 5. (G) Blocking projection neuron signaling (GH146-Gal4; UAS-ChATRNAi) leads to reduction in lamellocyte numbers. Quantifications of total circulating lamellocytes in GH146>/+ (control, n = 43) and GH146>ChATRNAi (n = 36, ***p<0.0001).
-
Figure 1—figure supplement 1—source data 1
Contains numerical data plotted in Figure 1—figure supplement 1A,B,C,D,E,F and G.
- https://cdn.elifesciences.org/articles/60376/elife-60376-fig1-figsupp1-data1-v2.xlsx
Figure 1—figure supplement 2
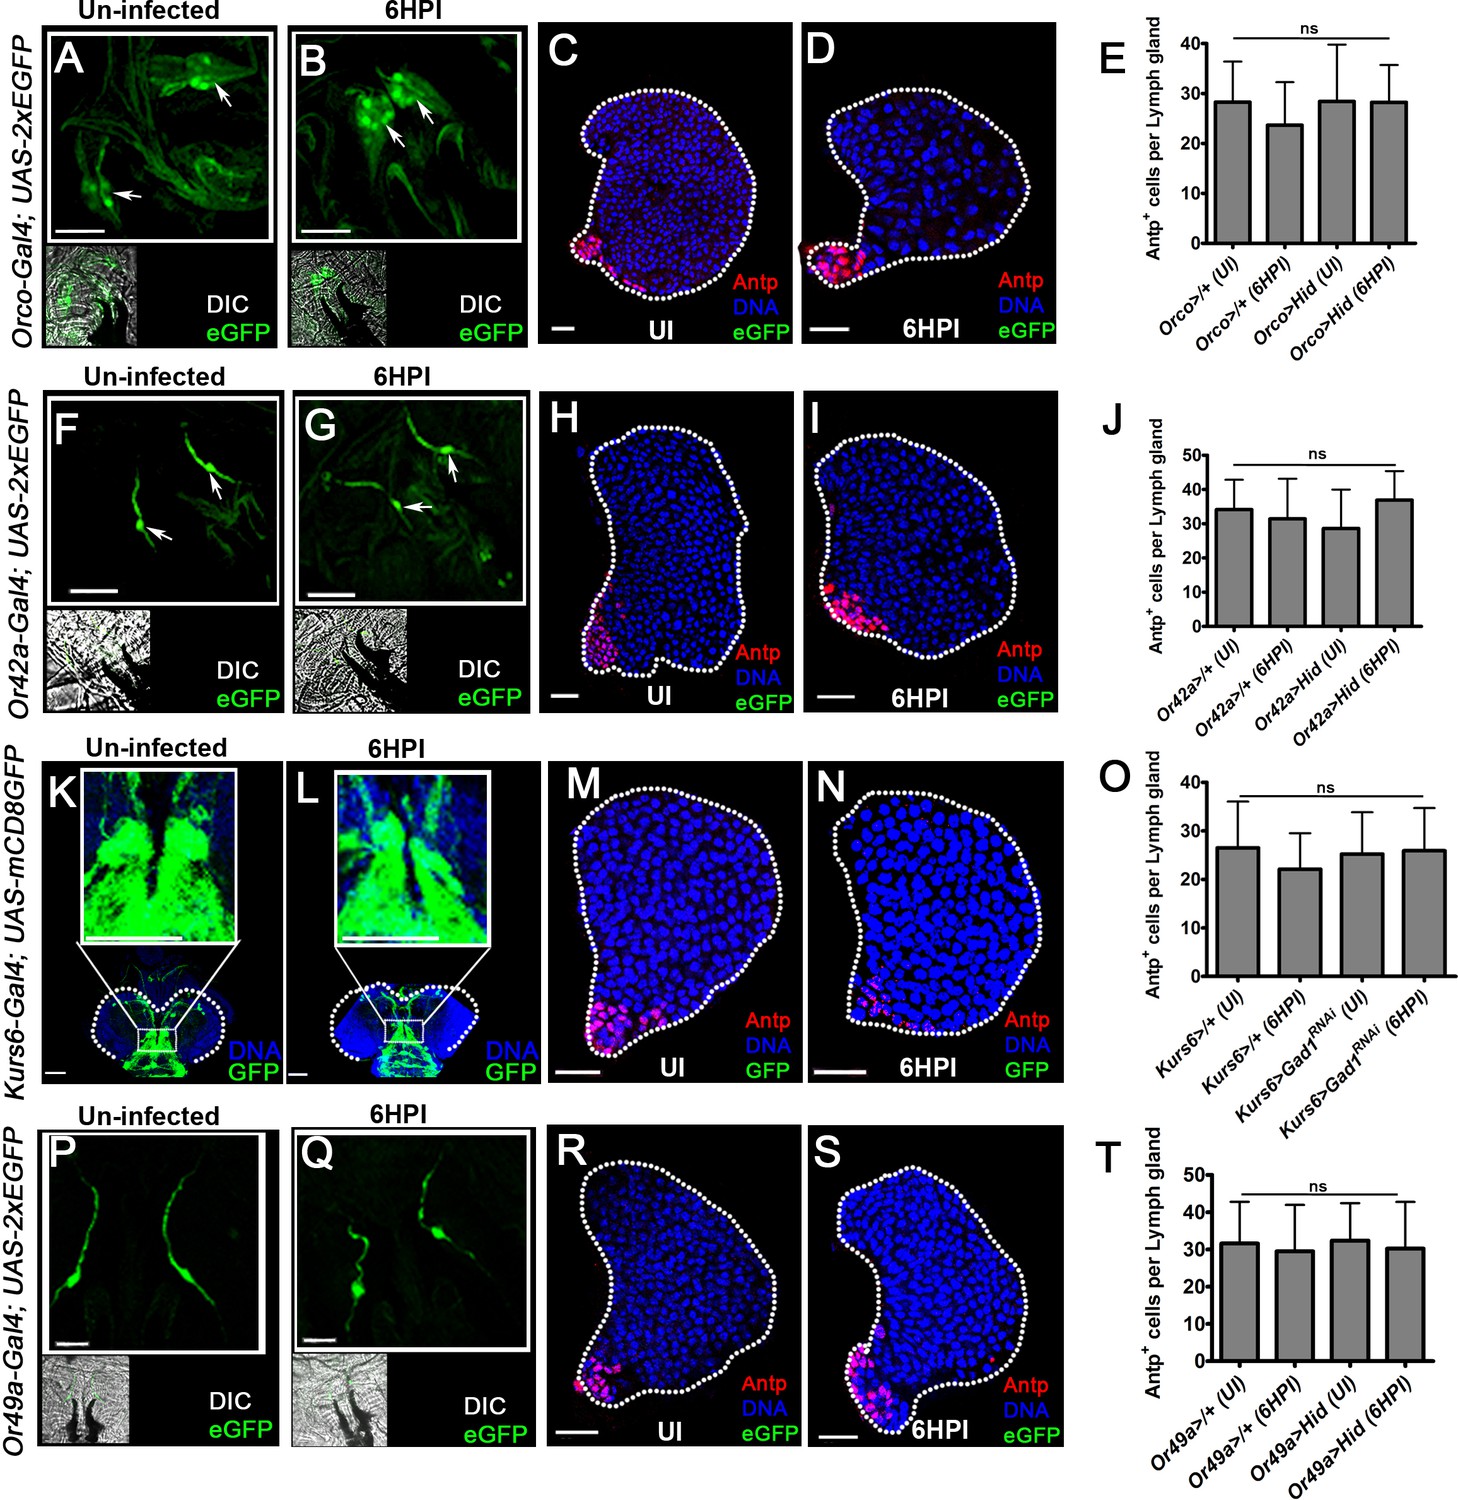
Expression profile of the neuronal driver lines.
UI is uninfected, HPI indicates hours post wasp-infection. Scale bars in panels (A, B, F, G, K, L, P, Q = 50 µm and C, D, H, I, M, N, R) and S = 20 µm. In panels (E, J, O, and T), mean ± standard deviation (mean ± SD) is shown and statistical analysis is unpaired t-test, two-tailed. For lymph glands ‘n’ represents lymph gland lobes analyzed. ns means nonsignificant. For better representation of the lymph gland primary lobes, the images shown, have been edited for removal of adjacent tissues (like dorsal vessel and ring gland). (A, B) Expression of Orco-Gal4 (green, Orco-Gal4; UAS-2xEGFP) in (A) uninfected and (B) infected (6HPI) conditions remains unchanged. Arrows indicate Dorsal organ ganglion. The small insets are DIC acquisition of the same images shown in (a and b). (C, D) No expression of Orco-Gal4 (green, Orco-Gal4; UAS-2xEGFP) is detected in cells of the lymph gland or in the posterior signaling center PSC (Antp, red) in (C) uninfected and (D) infected (6HPI) condition. (E) Quantification of Antp + cells per lymph gland in Orco-Gal4; UAS-2xEGFP, uninfected (n = 11), Orco-Gal4; UAS-2xEGFP, 6HPI (n = 12, ns compared to Orco-Gal4; UAS-2xEGFP, uninfected), Orco-Gal4; UAS-Hid, uninfected (n = 12, ns compared Orco-Gal4; UAS-2xEGFP, uninfected), and Orco-Gal4; UAS-Hid, 6HPI (n = 12, ns compared to Orco-Gal4; UAS-2xEGFP, 6HPI) showed no change in their numbers. (F, G) Expression of Or42a-Gal4 (green, Or42a-Gal4; UAS-2xEGFP) in (F) uninfected and (G) infected condition (6HPI) remains unchanged. Arrows indicate Dorsal organ ganglion. The small insets are DIC acquisition of the same images shown in (F and G). (H, I) No expression of Or42a-Gal4 (green, Or42a-Gal4; UAS-2xEGFP) is detected in cells of the lymph gland or in the PSC (Antp, red) in (H) uninfected and (I) infected (6HPI) conditions. (J) Quantification of Antp + cells per lymph gland in Or42a-Gal4; UAS-2xEGFP, uninfected (n = 16), and Or42a-Gal4; UAS-2xEGFP, 6HPI (n = 12, ns compared to Or42a-Gal4; UAS-2xEGFP, uninfected), Or42a-Gal4; UAS-Hid, uninfected (n = 10, ns compared to Or42a-Gal4; UAS-2xEGFP, uninfected), and Or42a-Gal4; UAS-Hid, 6HPI (n = 8, ns, compared to Or42a-Gal4; UAS-2xEGFP, 6HPI) showed no change in their numbers. (K, L) Expression of Kurs6-Gal4 (green, Kurs6-Gal4; UAS-mCD8GFP) in the larval brain (indicated by while dotted lines, and zoomed in image in the white box for better clarity) shows no change in (K) uninfected and (L) infected conditions (6HPI). (M, N) No expression of Kurs6-Gal4 (green, Kurs6-Gal4; UAS-mCD8GFP) is seen in the lymph gland blood cells and the PSC (Antp, red), in (M) uninfected and (N) infected (6HPI) condition. (O) Quantification of Antp + cells per lymph gland in Kurs6-Gal4; UAS-mCD8GFP, uninfected, (n = 18), Kurs6-Gal4; UAS-mCD8GFP, 6HPI (n = 10, ns compared to Kurs6-Gal4; UAS-mCD8GFP, uninfected), Kurs6-Gal4; UAS-mCD8GFP; UAS-Gad1RNAi, uninfected (n = 18, ns compared to Kurs6-Gal4; UAS-mCD8GFP, uninfected) and Kurs6-Gal4; UAS-mCD8GFP; UAS-Gad1RNAi, 6HPI (n = 23, ns, compared to Kurs6-Gal4; UAS-mCD8GFP, 6HPI) showed no change in their numbers. (P, Q) Expression of Or49a-Gal4 (green, Or49a-Gal4; UAS-2xEGFP) in (P) uninfected and (Q) infected condition (6HPI) remains unchanged. Arrows indicate Dorsal organ ganglion. The small insets are DIC acquisition of the same images shown in (P and Q). (R, S) No expression of Or49a-Gal4 (green, Or49a-Gal4; UAS-2xEGFP) is seen in the lymph gland blood cells and the PSC (Antp, red), in (r) uninfected and (s) infected (6HPI) conditions. (T) Quantification of Antp + cells per lymph gland in Or49a-Gal4; UAS-2xEGFP, uninfected, (n = 10), and Or49a-Gal4; UAS-2xEGFP, 6HPI (n = 8, ns compared to Or49a-Gal4; UAS-2xEGFP, uninfected), Or49a-Gal4; UAS-Hid, uninfected (n = 11, ns compared to Or49a-Gal4; UAS-2xEGFP, uninfected) and 6HPI (n = 9, ns, compared to Or49a-Gal4; UAS-2xEGFP, 6HPI) showed no change in their numbers.
-
Figure 1—figure supplement 2—source data 1
Contains numerical data plotted in Figure 1—figure supplement 2E,J,O and T.
- https://cdn.elifesciences.org/articles/60376/elife-60376-fig1-figsupp2-data1-v2.xlsx
Figure 2 with 5 supplements
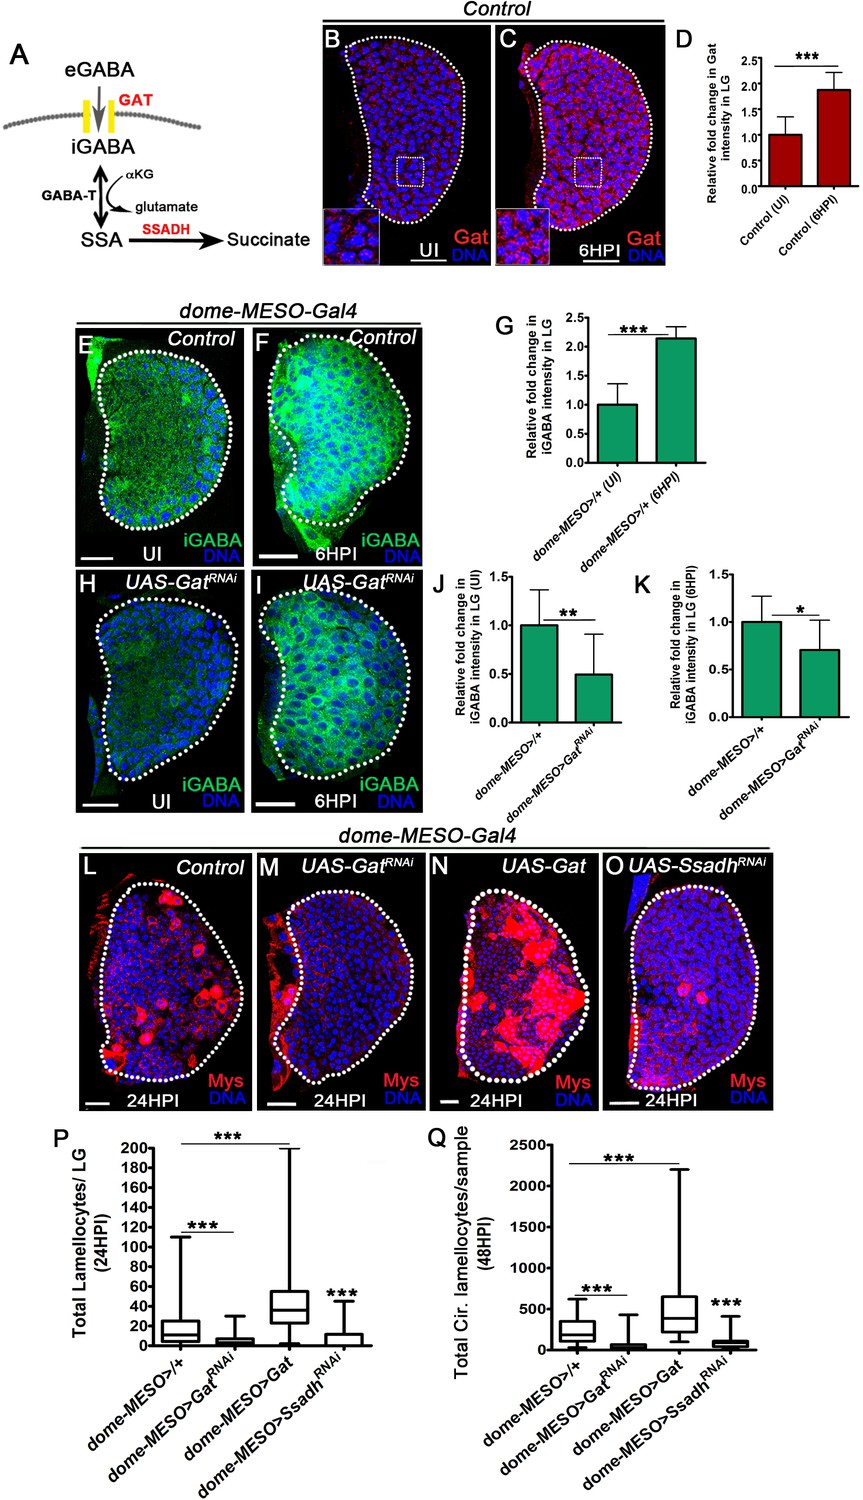
GABA-uptake and catabolism is necessary for lamellocyte formation.
DNA is marked with DAPI (blue), GABA Transporter (Gat, red), intracellular GABA (iGABA, green), and blood cells are marked with phalloidin (red). Myospheroid (Mys) antibody staining (in panels, (L–O), red) is employed to mark the lamellocytes in lymph gland. Scale bars in panels (B, C, E, F, H, I, L-O = 20 µm). UI indicates uninfected, HPI indicates hours post-wasp-infection. In lymph gland, lamellocytes analyzed at 24HPI and in circulation at 48HPI. In panels (D, G, J and K), mean with standard deviation is shown and in panels (P and Q), median is shown in the box plots and vertical bars represent upper and lowest cell counts. Statistical analysis applied in panels (D, G, J, and K) is unpaired t-test, two-tailed and in panels (P and Q) is Mann-Whitney test, two-tailed. ‘n’ is the total number of larvae analyzed, and for lymph gland ‘n’ represents lymph gland lobes analyzed. White dotted lines demarcate lymph glands. For better representation of the lymph gland primary lobes, the images shown, have been edited for removal of adjacent tissues (like dorsal vessel and ring gland). (A) Schematic of the GABA-shunt pathway. Uptake of extra cellular GABA (eGABA) via GAT (yellow bars) in blood-progenitor cells and its intracellular catabolism through GABA-transaminase (GABA-T) which catalyzes the conversion of GABA into succinic semi-aldehyde (SSA) and its further breakdown into succinate by succinic semi-aldehyde dehydrogenase (SSADH, rate limiting step). (B, C) Uniform GABA transporter (Gat) expression is detected in control (Hml△-Gal4, UAS-GFP) lymph gland from (B) Uninfected Drosophila larvae. In comparison to uninfected lymph gland, (C) Gat expression is elevated in lymph gland at 6HPI. Inset in both A, B shows zoomed image for the selected region in lymph gland for better clarity. Scale bars correspond to the main lymph gland image and not the inset. See corresponding quantifications in (D). (D) Relative fold change in Gat expression in control lymph gland from uninfected and infected states at 6HPI. Compared to uninfected control lymph gland (Hml△-Gal4, UAS-GFP/+, n = 15), almost twofold increase in Gat expression is observed at 6HPI (Hml△-Gal4, UAS-GFP/+, n = 16, ***p<0.0001). (E, F) Control (dome-MESO>GFP/+) lymph glands from (E) Uninfected Drosophila larvae show punctated iGABA staining in all blood cells (anti-GABA antibody staining in 1X PBS + 0.3%Triton X-100). In comparison to (E), iGABA levels detected in (F) lymph gland at 6HPI is elevated. See corresponding quantifications in (G). (G) Relative fold change in iGABA levels in uninfected and infected control lymph glands at 6HPI. Compared to uninfected control lymph gland (dome-MESO-Gal4, UAS-GFP/+, n = 9), a twofold increase in iGABA expression is observed at 6HPI (dome-MESO-Gal4, UAS-GFP/+, n = 11, ***p<0.0001). (H, I) Loss of progenitor Gat function (dome-MESO-Gal4, UAS-GFP; UAS-GatRNAi) leads to reduced iGABA levels both in (H) uninfected and (I) infected states as compared to control (dome-MESO-Gal4, UAS-GFP/+) in (E) uninfected and (F) infected states, respectively. See corresponding quantifications in (J and K). (J) Relative fold change in iGABA levels in lymph glands from uninfected dome-MESO-Gal4, UAS-GFP/+ (control, n = 10) and dome-MESO-Gal4, UAS-GFP; UAS-GatRNAi (n = 10, **p=0.0097). (K) Relative fold change in iGABA expression in lymph glands at 6HPI in dome-MESO-Gal4, UAS-GFP/+ (control, n = 11) and dome-MESO-Gal4, UAS-GFP; UAS-GatRNAi (n = 11, *p=0.0286). (L–O) In response to wasp-infection, lamellocytes detected in (L) Control lymph gland. (M) Expressing GatRNAi in progenitor cells (dome-MESO-Gal4, UAS-GFP; UAS-GatRNAi) causes reduction in lamellocyte numbers in lymph gland. However, (N) Expressing Gat in progenitor cells (dome-MESO-Gal4, UAS-GFP; UAS-Gat) leads to increased number of lamellocytes in lymph gland. (O) Expressing SsadhRNAi in progenitor cells (dome-MESO-Gal4, UAS-GFP; UAS-SsadhRNAi) causes reduction in lamellocyte numbers in lymph gland compared to (L) Control lymph gland response. See corresponding quantifications in (P). (P) Quantifications of progenitor-specific knock-down of Gat, over-expression of Gat and Ssadh knock-down showing lymph gland lamellocyte numbers, dome-MESO-Gal4, UAS-GFP/+ (control, n = 68), dome-MESO-Gal4, UAS-GFP; UAS-GatRNAi (n = 42, ***p<0.0001), dome-MESO-Gal4, UAS-GFP; UAS-Gat (n = 63, ***p<0.0001), dome-MESO-Gal4, UAS-GFP; UAS-SsadhRNAi (n = 57, ***p=0.0001). (Q) Quantifications of progenitor-specific knock-down of Gat, over-expression of Gat and Ssadh knock-down showing lamellocytes numbers in circulation, dome-MESO-Gal4, UAS-GFP/+ (control, n = 42), dome-MESO-Gal4, UAS-GFP; UAS-GatRNAi (n = 37, ***p<0.0001), dome-MESO-Gal4, UAS-GFP; UAS-Gat (n = 40, ***p<0.0001) and dome-MESO-Gal4, UAS-GFP; UAS-SsadhRNAi (n = 22, ***p<0.0001).
-
Figure 2—source data 1
Contains numerical data plotted in Figure 2D,G,J,K,P and Q.
- https://cdn.elifesciences.org/articles/60376/elife-60376-fig2-data1-v2.xlsx
Figure 2—figure supplement 1
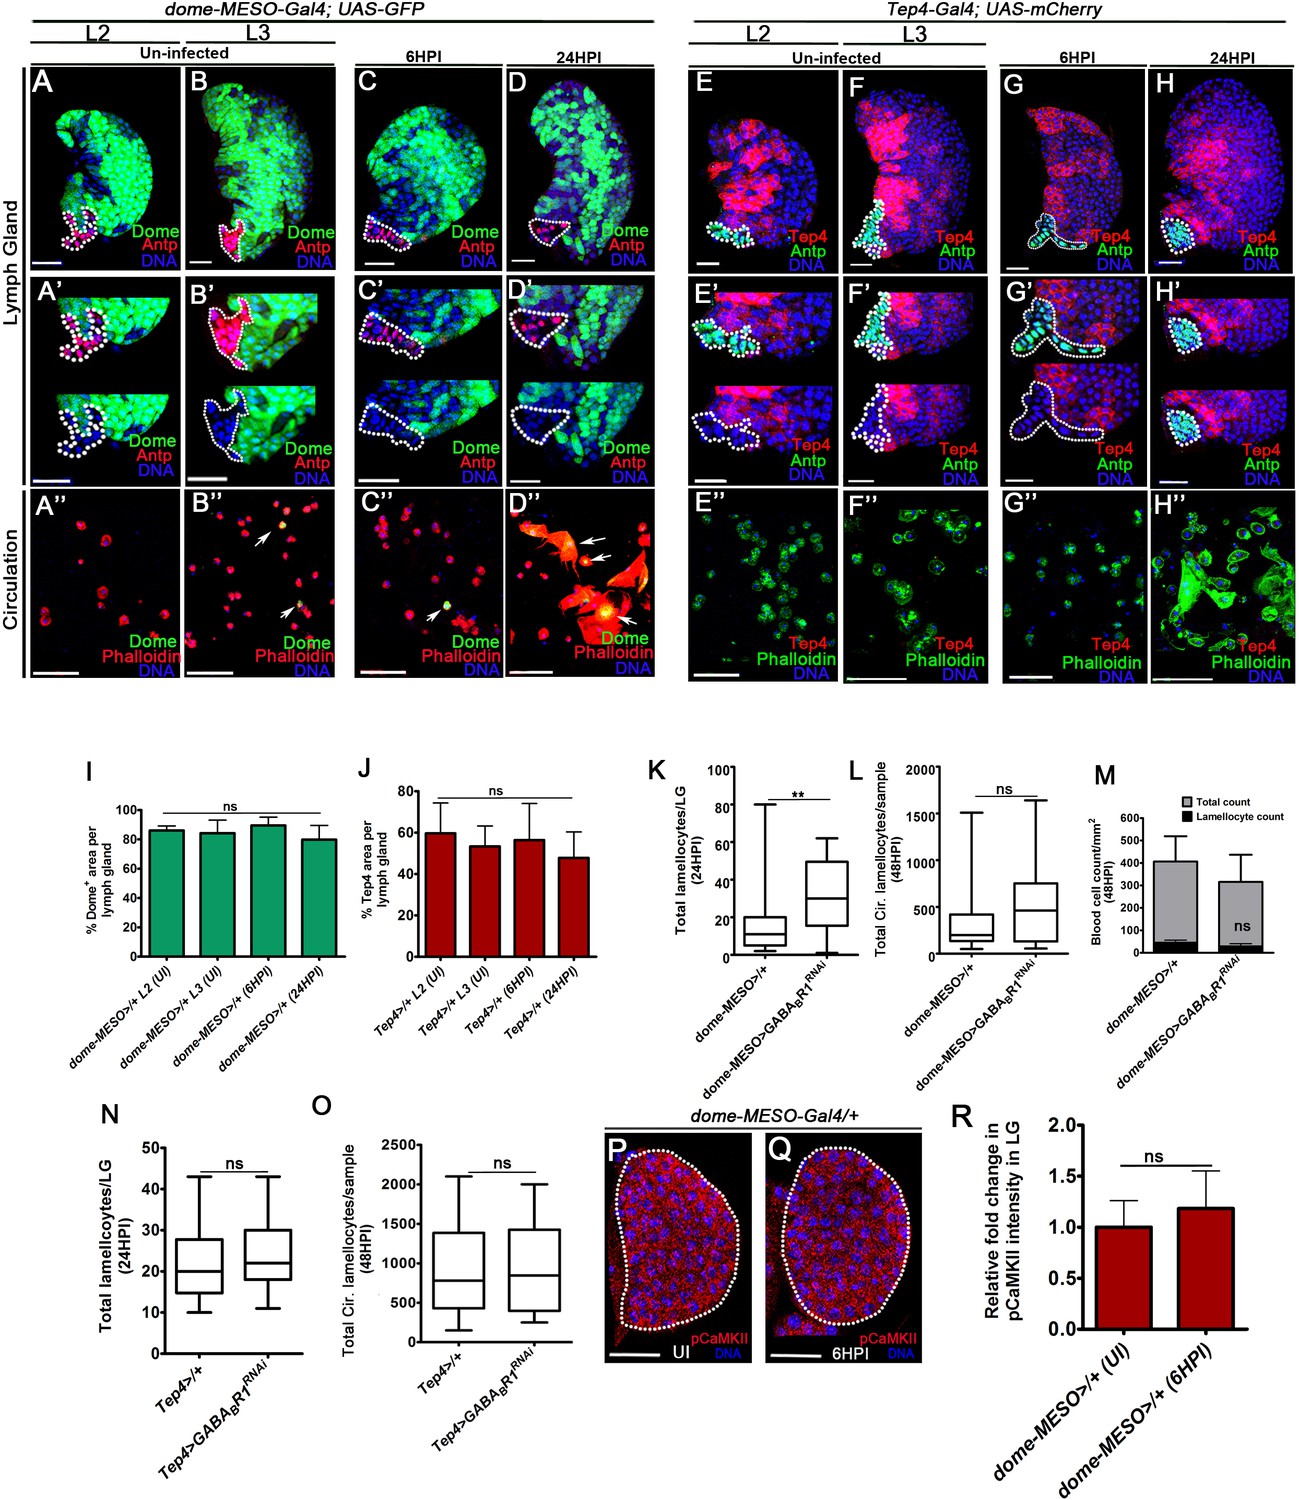
GABA receptor signaling is not required for lamellocyte formation.
UI is uninfected, HPI is hours post wasp-infection. Scale bars in panels (A–H’’), and P and Q = 20 µm. In lymph gland, lamellocytes are analyzed at 24HPI and in circulation at 48HPI. Panels (I, J, M and R) represents mean ± standard deviation (mean ± SD) and in (K, L, N and O) median is shown in box plots and vertical bars represent upper and lowest cell counts and panel. Statistical analysis in panels (I, J, M and R) is unpaired t-test, two-tailed and in panels (K, L, N and O) is Mann-Whitney, two-tailed and. ‘n’ represents the total number of larvae analyzed, and for lymph gland ‘n’ represents lymph gland lobes analyzed. ns is nonsignificant. For better representation of the lymph gland primary lobes, the images shown, have been edited for removal of adjacent tissues (like dorsal vessel and ring gland). (A, B’’) dome-MESO expression (green, dome-MESO-Gal4, UAS-GFP) at (A–A’’) 2nd instar (L2) and (B–B’’) 3rd instar larval stage (L3) is restricted to (A, B) progenitor cells of the lymph gland and (A’, B’) not seen in the posterior signaling center (PSC; marked with Antp in red, and outlined with a white dotted line). (A’’, B’’) dome-MESO expression (green) is detected sparingly in circulating blood cells. Phalloidin (red) marks all blood cells and arrows point to blood cells that are dome positive (green). (C, D’’) dome-MESO expression (green, dome-MESO-Gal4, UAS-GFP) at (C–C’’) 6HPI and (D–D’’) 24HPI is seen in the (C, D) lymph gland progenitor cells and (C’, D’) not in the PSC (marked with Antp in red, and outlined with a white dotted line). (C’’, D’’) dome-MESO expression (green) is detected sparingly in circulating blood cells at (c’’) 6HPI, but is more prominent at (D’’) 24HPI. Phalloidin (red) marks all blood cells, including lamellocytes (large flat cells) and arrows point to blood cells that are dome positive (green). (E, F’’) Tep4 expression (red, Tep4-Gal4, UAS-mCherry) at (E–E’’) 2nd instar (L2) and (F–F’’) 3rd instar larval stage (L3) is restricted to (E, F) progenitor cells of the lymph gland and (E’, F’) not seen in the PSC (marked with Antp in green and outlined with a white dotted line). (E’’, F’’) Tep4 expression (red) is not detected in circulating blood cells. Phalloidin (green) marks all blood cells. (G, H’’) Tep4 expression (red, Tep4-Gal4, UAS-mCherry) at (G–G’’) 6HPI and (H–H’’) 24HPI is seen in the (G, H) lymph gland progenitor cells and (G’, H’) not in the PSC (marked with Antp in green and outlined with a white dotted line). (G’’, H’’) Tep4 expression (red) is not detected in circulating blood cells. Phalloidin (green) marks all blood cells. (I) Quantification of percentage area of dome-positive expression in the lymph glands obtained from 2nd instar dome-MESO-Gal4, UAS-GFP, uninfected (n = 8), 3rd instar dome-MESO-Gal4, UAS-GFP, uninfected (n = 13), dome-MESO-Gal4, UAS-GFP, 6HPI (n = 17, ns compared to 2nd instar dome-MESO-Gal4, UAS-GFP, uninfected) and dome-MESO-Gal4, UAS-GFP, 24HPI (n = 8, ns, 3rd instar dome-MESO-Gal4, UAS-GFP, uninfected). (J) Quantification of percentage area of Tep4-positive expression in the lymph glands obtained from 2nd instar Tep4-Gal4, UAS-mCherry>/+, uninfected (n = 23) and 3rd instar larvae Tep4-Gal4, UAS-mCherry>/+, uninfected (n = 6), Tep4-Gal4, UAS-mCherry>/+, 6HPI (n = 31, ns compared to 2nd instar Tep4-Gal4, UAS-mCherry>/+, uninfected) and Tep4-Gal4, UAS-mCherry>/+, 24HPI (n = 18, ns compared to 3rd instar Tep4-Gal4, UAS-mCherry>/+, uninfected). (K, L) Expressing GABABR1RNAi in progenitor cells (dome-MESO-Gal4, UAS-GFP; UAS- GABABR1RNAi) does not reduce lamellocyte formation in the (K) lymph gland and (L) circulation. (K) Total lamellocyte quantification in lymph gland, in dome-MESO-Gal4, UAS-GFP/+ (control, n = 31), dome-MESO-Gal4, UAS-GFP; UAS-GABABR1RNAi (n = 24, **p=0.0028), and (L) total lamellocyte quantification in circulation, dome-MESO-Gal4, UAS-GFP/+ (control, n = 30), dome-MESO-Gal4, UAS-GFP; UAS-GABABR1RNAi (n = 24, ns). (M) Quantification of total circulating blood cell numbers per mm2 in animals at 48HPI. Represented here are the numbers of lamellocytes (black bar) and total cell counts (gray bar) counted per mm2. No difference is detected both in overall blood cell density and lamellocyte density in dome-MESO-Gal4, UAS-GFP/+ (control, n = 5), dome-MESO-Gal4, UAS-GFP; UAS-GABABR1RNAi (n = 5, ns). (N, O) Expressing GABABR1RNAi in progenitor cells using using Tep4-Gal4 driver (Tep4-Gal4, UAS-mCherry; UAS- GABABR1RNAi) does not affect lamellocyte formation in the (N) lymph gland and (O) circulation. (N) Total lamellocyte quantification in lymph gland, Tep4-Gal4, UAS-mCherry/+ (control, n = 10), Tep4-Gal4, UAS-mCherry; UAS- GABABR1RNAi (n = 11, ns compared to control), (O) total lamellocyte quantification in circulation, Tep4-Gal4, UAS-mCherry/+ (control, n = 33), Tep4-Gal4, UAS-mCherry; UAS- GABABR1RNAi (n = 30, ns). (P–R) No change in pCaMKII levels is detected in control (dome-MESO>GFP/+) lymph glands obtained from (P) uninfected and (Q) infected (6HPI) animals. (R) Relative fold change in pCaMKII intensity of dome-MESO>GFP/+ in UI (control, n = 12), and at 6HPI (n = 13, ns).
-
Figure 2—figure supplement 1—source data 1
Contains numerical data plotted in Figure 2—figure supplement 1I,J,K,L,M,N,O and R.
- https://cdn.elifesciences.org/articles/60376/elife-60376-fig2-figsupp1-data1-v2.xlsx
Figure 2—figure supplement 2

GABA uptake and its metabolism is important for lamellocyte formation.
HPI is hours post wasp-infection. Scale bars in panels C, D And L = 20 µm and in panel E-H = 50 µm. In lymph gland, lamellocytes analyzed at 24HPI and in circulation at 48HPI. Graphs in panels (A, B, J and K), represents median in box plots and vertical bars represent upper and lowest cell counts and panels (i and m) represents mean ± standard deviation (mean ± SD). Statistical analysis in panels A, B, K and J is Mann-Whitney, two-tailed panel (I and M) is unpaired t-test, two-tailed and in. ‘n’ represents the total number of larvae analyzed, and for lymph glands ‘n’ represents lymph gland lobes analyzed. ns is nonsignificant. For better representation of the lymph gland primary lobes, the images shown, have been edited for removal of adjacent tissues (like dorsal vessel and ring gland). (A) Quantifications of progenitor-specific knock-down of Gat and Ssadh knock-down showing lymph gland lamellocyte numbers, dome-MESO-Gal4, UAS-GFP/+ (control, n = 39), dome-MESO-Gal4, UAS-GFP; UAS-GatRNAi BL (n = 15, *p=0.0238) dome-MESO-Gal4, UAS-GFP; UAS-GatRNAi GD (n = 36, ns), dome-MESO-Gal4, UAS-GFP; UAS-SsadhRNAi KK (n = 13, **p=0.0026), dome-MESO-Gal4, UAS-GFP; UAS-SsadhRNAi GD (n = 18, **p=0.0017) and dome-MESO-Gal4, UAS-GFP; UAS-SsadhRNAi BL (n = 20, ns). (B) Quantifications of progenitor-specific knock-down of Gat, and Ssadh knock-down showing lamellocytes numbers in circulation, dome-MESO-Gal4, UAS-GFP/+ (control, n = 57), dome-MESO-Gal4, UAS-GFP; UAS-GatRNAi BL (n = 15, ***p<0.0001), dome-MESO-Gal4, UAS-GFP; UAS-GatRNAi GD (n = 15, ***p=0.007), dome-MESO-Gal4, UAS-GFP; UAS-SsadhRNAi KK (n = 22, ***p=0.0002), dome-MESO-Gal4, UAS-GFP; UAS-SsadhRNAi BL (n = 36, ns). (C, D) Lymph glands from (C) control (dome-MESO>GFP/+) uninfected larvae show punctated iGABA (green) staining in all blood cells of lymph gland while (D) larvae over-expressing Gat in progenitor cells (dome-MESO-Gal4, UAS-GFP; UAS-Gat) showed an increase in iGABA levels in blood cells. (E–H) In response to wasp-infection, compared to lamellocyte numbers detected in circulation of (E) control animals (dome-MESO-GFP>/+), progenitor-specific (F) expression of GatRNAi (dome-MESO-Gal4, UAS-GFP; UAS-GatRNAi) causes reduction in lamellocyte numbers, while (G) overexpression of Gat (dome-MESO-Gal4, UAS-GFP; UAS-Gat) leads to increased numbers and (H) expression of SsadhRNAi (dome-MESO-Gal4, UAS-GFP; UAS-SsadhRNAi) causes reduction. (I) Quantification of total circulating blood cell numbers per mm2 in animals at 48 HPI. Represented here are the numbers of lamellocytes (black bar) and total cell counts (gray bar) counted per mm2. No significant difference in overall cell density is detected, although a reduction in lamellocyte numbers is seen in dome-MESO-Gal4, UAS-GFP; UAS-GatRNAi (n = 5, **p=0.0026), and dome-MESO-Gal4, UAS-GFP; UAS-SsadhRNAi (n = 5, **p=0.0019) and an increase is seen in dome-MESO-Gal4, UAS-GFP; UAS-Gat (n = 5, *p=0.0214) in comparison to dome-MESO-Gal4, UAS-GFP/+ (control, n = 5). (J) Total lamellocyte quantification per lymph gland. Tep4-Gal4, UAS-mCherry/+ (control, n = 54), Tep4-Gal4, UAS-mCherry; UAS-GatRNAi (n = 16, *p=0.0191), Tep4-Gal4, UAS-mCherry; UAS-SsadhRNAi (n = 68, **p=0.0065). (K) Total circulating lamellocyte quantification per sample. Tep4-Gal4, UAS-mCherry/+ (control, n = 33), Tep4-Gal4, UAS-mCherry; UAS-GatRNAi (n = 16, ***p<0.0001), Tep4-Gal4, UAS-mCherry; UAS-SsadhRNAi (n = 34, ***p<0.0001). (L) Representative in situ hybridization images showing Ssadh mRNA expression in lymph gland from mid-2nd and 3rd instar control larva. Uniform expression is detected in all cells in early time-points. Later the expression is comparatively elevated within the prospective progenitor compartment (medullary zone, MZ). (M) Relative mRNA expression of Gat and Ssadh from RNA extracted from 3rd instar wild-type larval lymph glands. The levels are normalized to rp49 CT values.
-
Figure 2—figure supplement 2—source data 1
Contains numerical data plotted in Figure 2—figure supplement 2A,B,I,J,K and M.
- https://cdn.elifesciences.org/articles/60376/elife-60376-fig2-figsupp2-data1-v2.xlsx
Figure 2—figure supplement 3
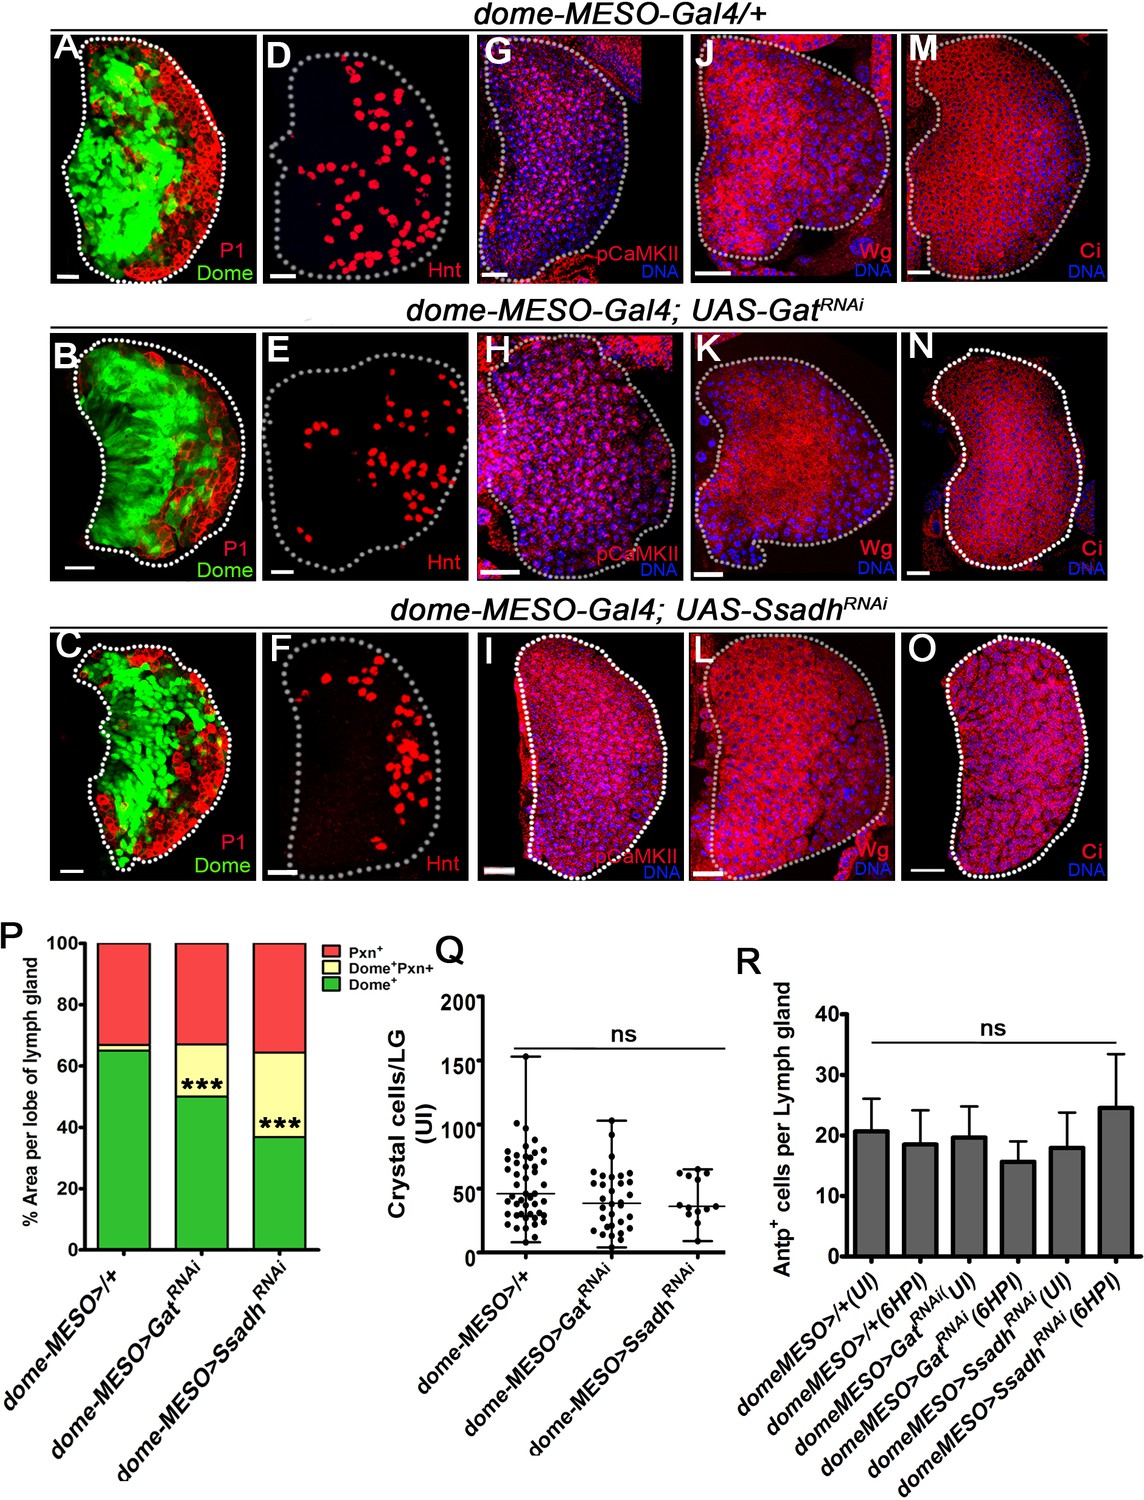
GABA-shunt pathway is dispensable for normal hematopoiesis.
DNA is stained with DAPI (blue). Representative 3rd instar lymph gland images showing progenitors in green (Domeless, Dome), plasmatocytes in red (P1) and crystal cells (red, Hindsight, Hnt). Scale bar in panels A-O = 20 µm. For lymph glands ‘n’ represents lymph gland lobes analyzed. ns is nonsignificant. For better representation of the lymph gland primary lobes, the images shown, have been edited for removal of adjacent tissues (like dorsal vessel and ring gland). (A–F) Lymph gland development and hematopoiesis in progenitor-specific loss of Gat and Ssadh function. Compared to (A, D) Control (dome-MESO-Gal4, UAS-GFP/+), expressing (B, E) GatRNAi in progenitor cells (dome-MESO-Gal4, UAS-GFP; UAS-GatRNAi) and (C, F) SsadhRNAi in progenitor cells (dome-MESO-Gal4, UAS-GFP; UAS-SsadhRNAi), expression of (A–C) P1 (red, marking plasmatocytes) and (D–F) Hnt (red, marking crystal cells) in lymph glands remains unaffected. Also see quantifications in (Q). (G–O) Expression analysis of (G–I) pCaMKII, (J–L) wingless (Wg), and (M–O) cubitus interruptus (Ci) in (G, J, M) control (dome-MESO-Gal4, UAS-GFP/+), (H, K, N) GatRNAi (dome-MESO-Gal4, UAS-GFP; UAS-GatRNAi) and (I, L, O) SsadhRNAi (dome-MESO-Gal4, UAS-GFP; UAS-SsadhRNAi) show no changes in their pattern or levels. (P) Graphical representation of percentage areas of progenitor cells (green, Dome+ only), intermediate population (IP, yellow, Dome+ Pxn+) and differentiating blood cells (red, Peroxidasin+ only). An expansion of IP is noted in genetic knock-downs of Gat and Ssadh, dome-MESO-Gal4, UAS-GFP; UAS-GatRNAi (n = 7, ***p<0.0001) and dome-MESO-Gal4, UAS-GFP; UAS-SsadhRNAi (n = 11, ***p<0.0001) in comparison to dome-MESO-Gal4, UAS-GFP/+ (control, n = 8). For details refer Supplementary file 3. (Q) Quantification of total crystal cells (Hindsight+) in lymph gland control (dome-MESO-Gal4, UAS-GFP/+, n = 47), GatRNAi (dome-MESO-Gal4, UAS-GFP; UAS-Gat RNAi, n = 32, ns) and SsadhRNAi (dome-MESO-Gal4, UAS-GFP; UAS-Ssadh RNAi, n = 13, ns). For details refer Supplementary file 5. (R) Quantification of Antp + cells per lymph gland in control in uninfected state (dome-MESO-Gal4, UAS-GFP/+, n = 17) and at 6HPI (dome-MESO-Gal4, UAS-GFP/+, n = 20, ns), expressing GatRNAi in progenitors cells in uninfected state (dome-MESO-Gal4, UAS-GFP; UAS-Gat RNAi, n = 11, ns compared to dome-MESO-Gal4, UAS-GFP/+, uninfected) and at 6HPI (dome-MESO-Gal4, UAS-GFP; UAS-Gat RNAi, n = 8, ns compared to dome-MESO-Gal4, UAS-GFP/+, 6HPI), expressing SsadhRNAi in progenitors cells in uninfected state (dome-MESO-Gal4, UAS-GFP; UAS-Ssadh RNAi, n = 15, ns compared to dome-MESO-Gal4, UAS-GFP/+, uninfected) and at 6HPI (dome-MESO-Gal4, UAS-GFP; UAS-Ssadh RNAi, n = 21, ns compared to dome-MESO-Gal4, UAS-GFP/+, 6HPI).
-
Figure 2—figure supplement 3—source data 1
Contains numerical data plotted in Figure 2—figure supplement 3P,Q and R.
- https://cdn.elifesciences.org/articles/60376/elife-60376-fig2-figsupp3-data1-v2.xlsx
Figure 2—figure supplement 4
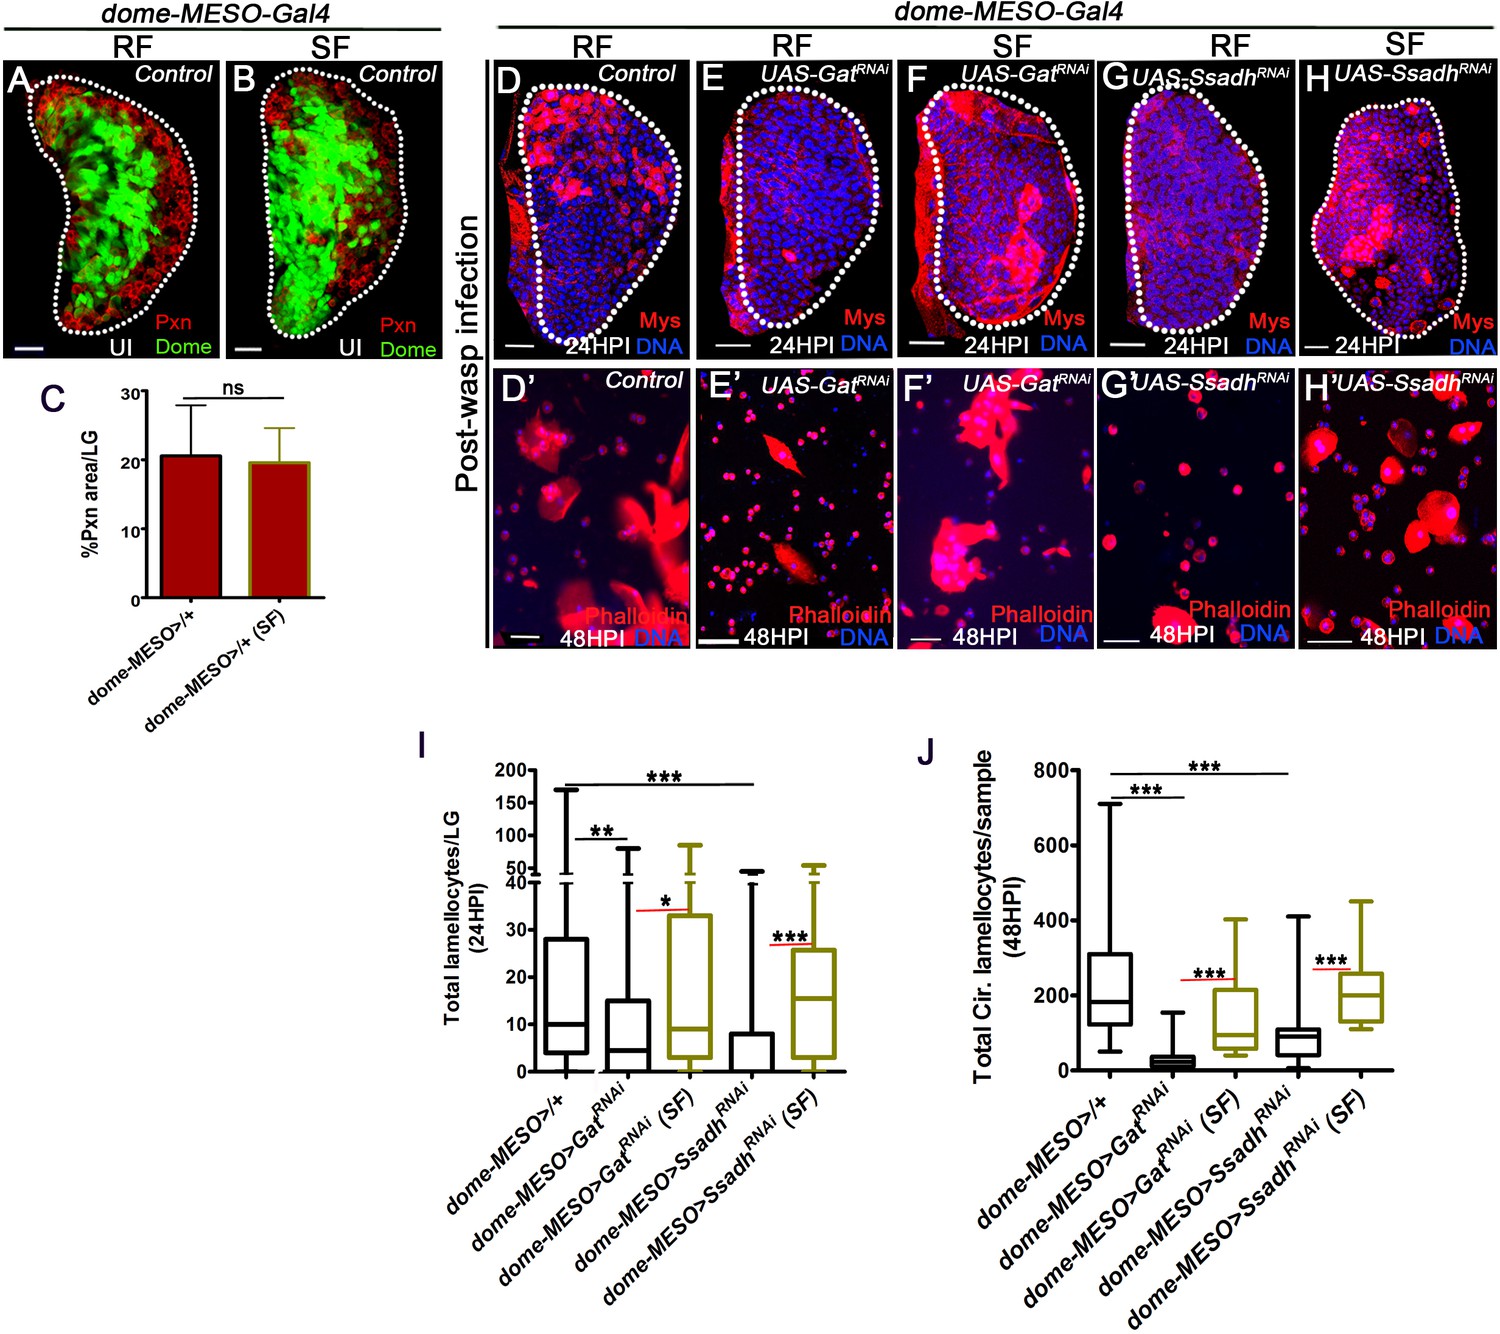
GABA-shunt-derived succinate controls lamellocyte potential.
DNA is marked with DAPI (blue) and blood cells are marked with phalloidin (red). In panels (A, B, D-H, scale bars = 20 µm and D’–H’) = 50 µm. HPI indicates hours post wasp-infection, RF is regular food and SF is succinate food. In lymph gland, lamellocytes analyzed at 24HPI and in circulation at 48HPI. Graph in panel (C) Represents mean + standard deviation (mean + SD) and in panels (I and J) Median is shown in box plots and vertical bars represent upper- and lower cell counts. Statistical analysis in panel (C) is unpaired t-test, two-tailed and in panels (I and J) is Mann-Whitney, two-tailed. ‘n’ is the total number of larvae analyzed, and for lymph glands ‘n’ represents lymph gland lobes analyzed. ns is nonsignificant. For better representation of the lymph gland primary lobes, the images shown have been edited for removal of adjacent tissues (like dorsal vessel and ring gland). (A–C) Progenitor maintenance (Domeless, green) and differentiation status (Peroxidasin, Pxn, red) is unaffected with (B) succinate supplementation (5% SF) as compared to (A) regular food (RF) condition in control (dome-MESO-Gal4, UAS-GFP/+). (C) Quantification of dome-MESO-Gal4, UAS-GFP/+on RF (n = 15) and SF (n = 11, ns) represented as percentage area distribution of Peroxidasin (Pxn, differentiation status) in 3rd instar larval lymph gland, also refer Supplementary file 3. (d–h’) Compared to lamellocytes detected in (D, D’) control (dome-MESO-Gal4, UAS-GFP/+) (D) lymph gland and (D’) circulation, their formation is affected in (E–E’) dome-MESO-Gal4, UAS-GFP; UAS-GatRNAi (on RF). This is restored by (F, F’) succinate supplementation both in the (F) lymph gland (compared with E) and (F’) circulation (compared with E’). Similarly, lamellocytes formation is affected in (G–G’) dome-MESO-Gal4, UAS-GFP; UAS-SsadhRNAi (on RF), which is restored by (H, H’) succinate supplementation in the (H) lymph gland (compared with G) and (H’) circulation (compared with G’). Corresponding quantifications are shown in (I and J). (I) Total lamellocyte quantification per lymph gland. dome-MESO-Gal4, UAS-GFP/+ on RF (control, n = 115), dome-MESO-Gal4, UAS-GFP; UAS-GatRNAi on RF (n = 60, **p=0.0027), dome-MESO-Gal4, UAS-GFP; UAS-GatRNAi on SF (n = 53, *p=0.0235), dome-MESO-Gal4, UAS-GFP; UAS-SsadhRNAi on RF (n = 63, ***p<0.0001) and, dome-MESO-Gal4, UAS-GFP; UAS-SsadhRNAi on SF (n = 36, ***p<0.0001). (J) Total circulating lamellocyte quantification per sample. dome-MESO-Gal4, UAS-GFP/+ on RF (control, n = 46), dome-MESO-Gal4, UAS-GFP; UAS-GatRNAi on RF (n = 26, ***p<0.0001), dome-MESO-Gal4, UAS-GFP; UAS-GatRNAi on SF (n = 12, ***p<0.0001), dome-MESO-Gal4, UAS-GFP; UAS-SsadhRNAi on RF (n = 22, ***p<0.0001) and, dome-MESO-Gal4, UAS-GFP; UAS-SsadhRNAi on SF (n = 13, ***p<0.0001).
-
Figure 2—figure supplement 4—source data 1
Contains numerical data plotted in Figure 2—figure supplement 4C,I and J.
- https://cdn.elifesciences.org/articles/60376/elife-60376-fig2-figsupp4-data1-v2.xlsx
Figure 2—figure supplement 5
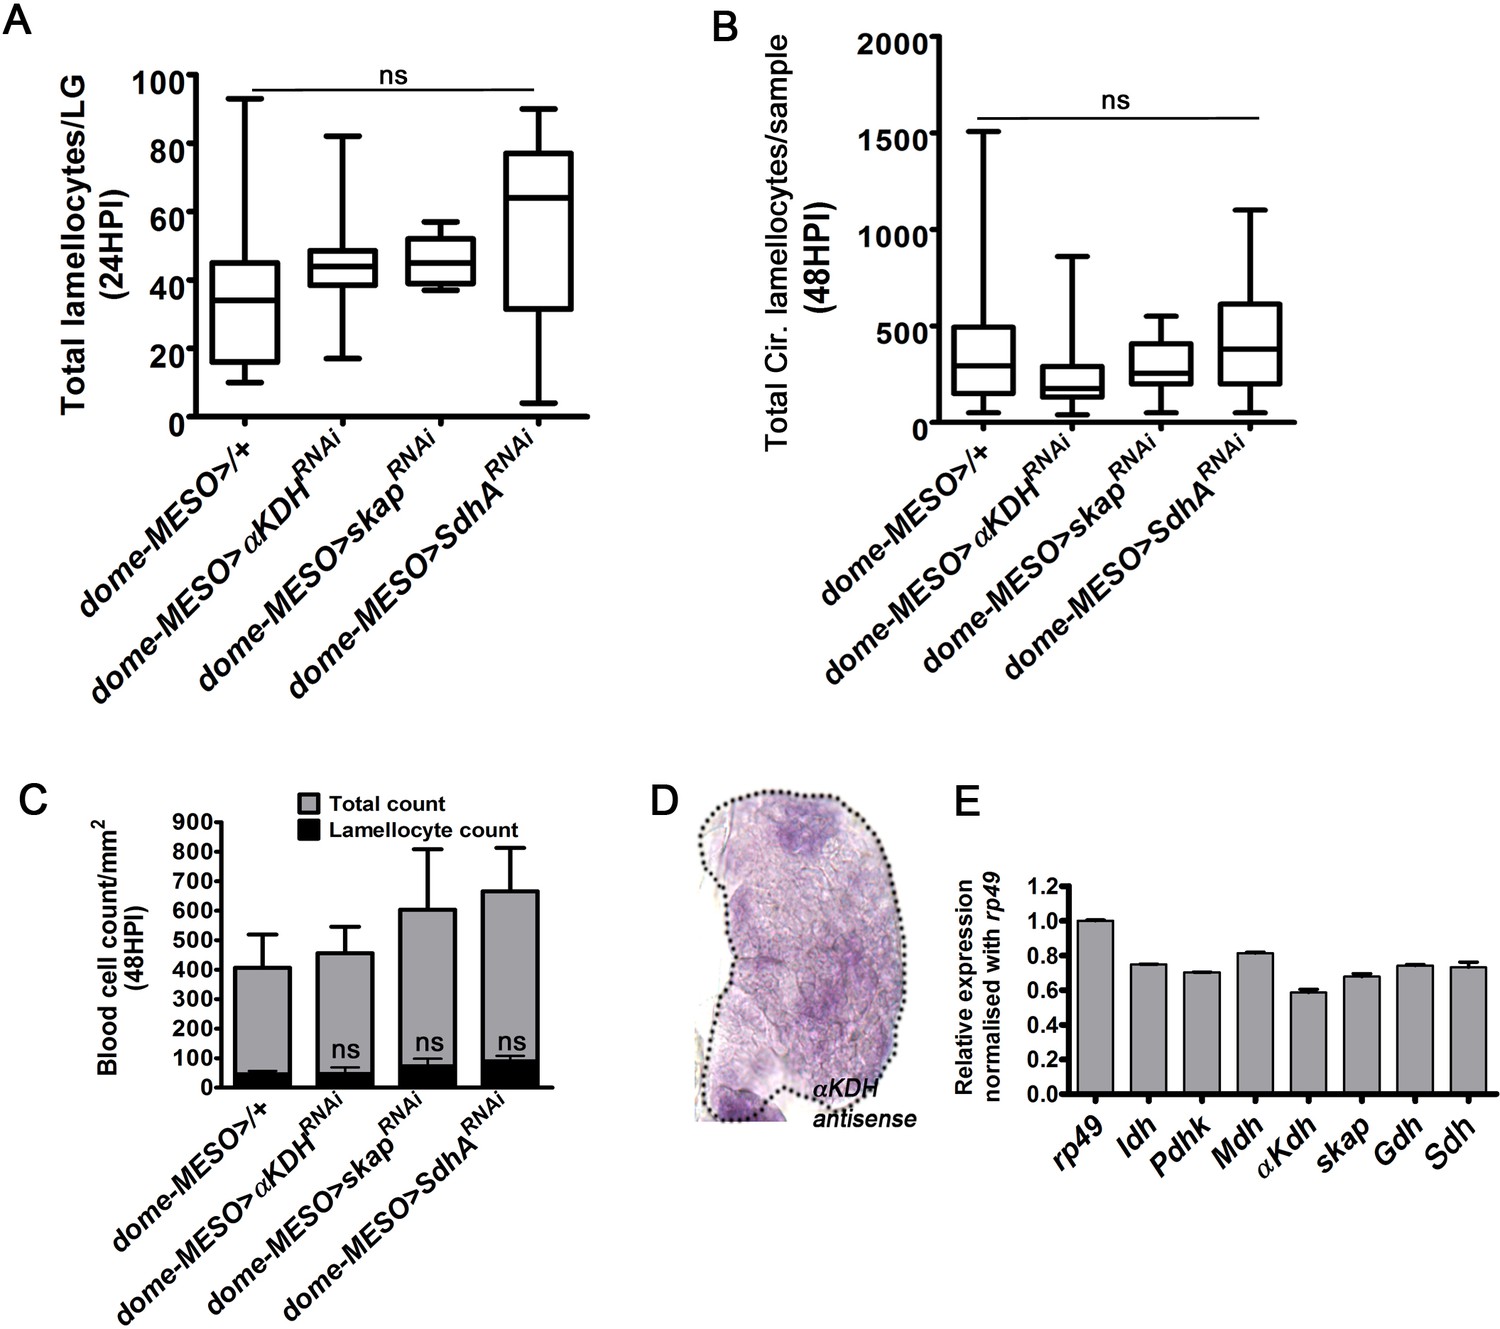
Lamellocyte induction is independent of TCA-cycle enzymes, αKDH, Skap, and Sdh.
HPI indicates hours post wasp-infection. In lymph gland, lamellocytes analyzed at 24HPI and in circulation at 48HPI. Bars in panels (A, B) show median in box plots and vertical bars represent upper and lowest cell counts and in panels (C and E) mean ± standard deviation (mean ± SD) is shown. Statistical analysis in panel (A, B) is Mann-Whitney test, two-tailed and in (Cand E) is unpaired t-test, two-tailed. ‘n’ represents the total number of larvae analyzed, and for lymph gland ‘n’ represents lymph gland lobes analyzed. ns is nonsignificant. For better representation of the lymph gland primary lobes, the images shown, have been edited for removal of adjacent tissues (like dorsal vessel and ring gland). (A) Progenitor-specific expression of αKDHRNAi (dome-MESO-Gal4, UAS-GFP; UAS-αKDHRNAi, n = 13, ns), skapRNAi (dome-MESO-Gal4, UAS-GFP; UAS-skapRNAi, n = 7, ns) and SdhA RNAi (dome-MESO-Gal4, UAS-GFP; UAS- SdhARNAi, n = 13, ns) does not affect lymph gland lamellocyte formation as compared to control (dome-MESO-Gal4, UAS-GFP/+, n = 15). (B) Quantifications of total circulating lamellocyte per sample in dome-MESO-Gal4, UAS-GFP/+ (control, n = 35), dome-MESO-Gal4, UAS-GFP; UAS-αKDHRNAi (n = 25, ns) and dome-MESO-Gal4, UAS-GFP; UAS-skapRNAi (n = 15, ns) and dome-MESO-Gal4, UAS-GFP; UAS-SdhARNAi (n = 38, ns). (C) Quantification of total circulating blood cell numbers per mm2 in animals at 48 HPI. Represented here are the numbers of lamellocytes (black bar) and total cell counts (gray bar) counted per mm2. No stark difference is seen in overall cell density and lamellocyte numbers in dome-MESO-Gal4, UAS-GFP; UAS-αKDHRNAi (n = 5, ns), dome-MESO-Gal4, UAS-GFP; UAS-skapRNAi (n = 5, ns) and dome-MESO-Gal4, UAS-GFP; UAS- SdhA RNAi (n = 5, ns) in comparison to dome-MESO-Gal4, UAS-GFP/+ (n = 5). (D) In situ expression analysis of αKDH mRNA in 3rd instar larval lymph gland. (E) Relative quantification of mRNA levels of TCA cycle-enzymes in RNA extracted from 3rd instar larval lymph glands. The levels are normalized to rp49 CT values.
-
Figure 2—figure supplement 5—source data 1
Contains numerical data plotted in Figure 2—figure supplement 5A,B,C and E.
- https://cdn.elifesciences.org/articles/60376/elife-60376-fig2-figsupp5-data1-v2.xlsx
Figure 3 with 2 supplements
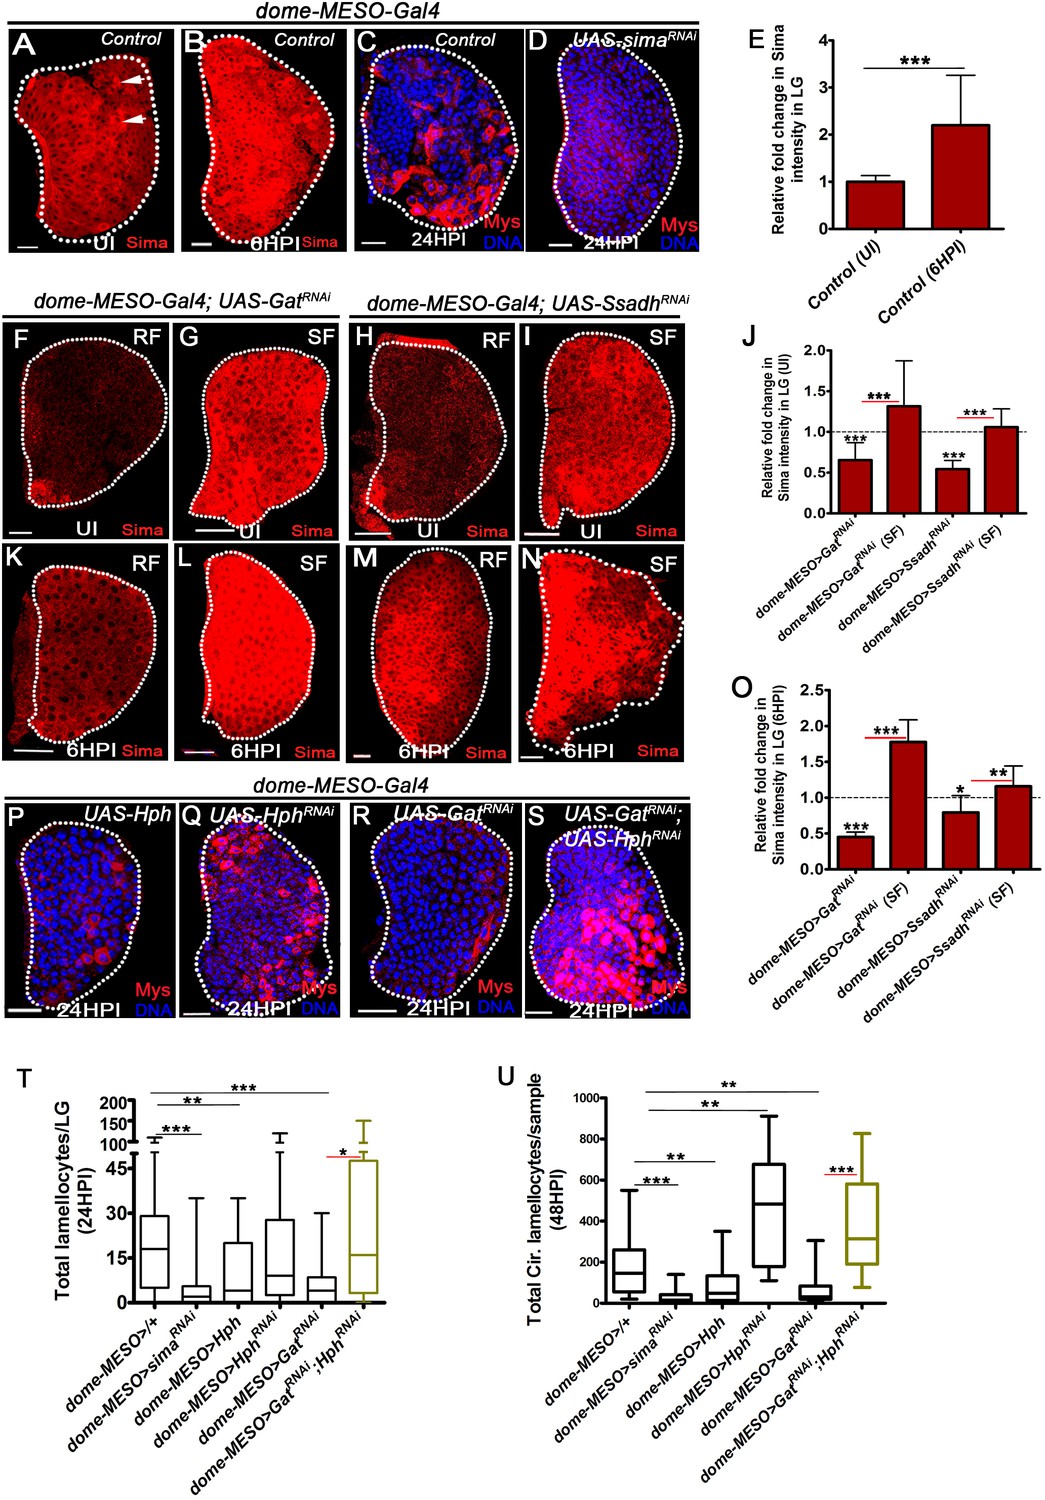
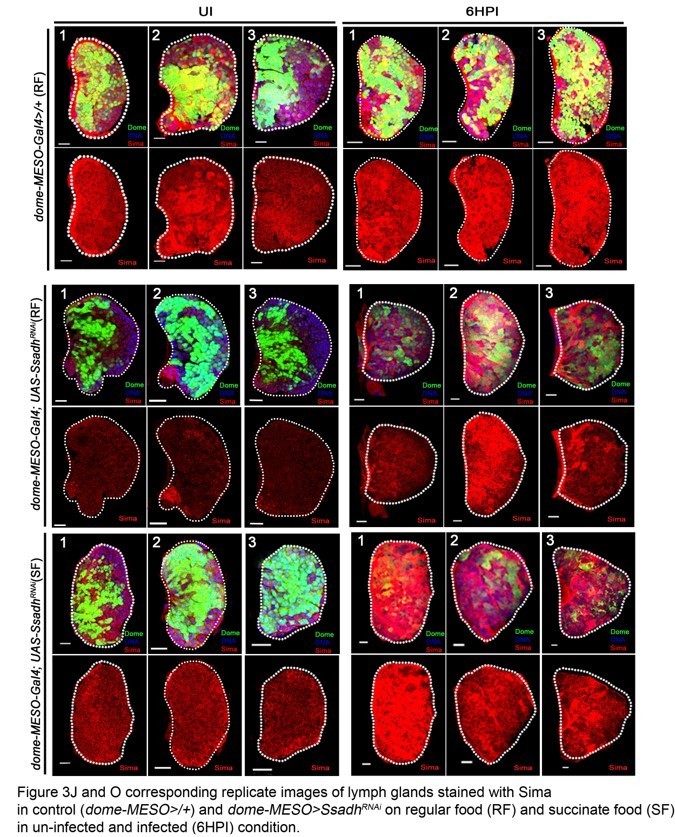
GABA-shunt-dependent control of Sima protein stabilization in immune-progenitor cells promotes lamellocyte induction.
DNA is marked with DAPI (blue). In panels (C, D, P–S), Myospheroid (Mys) antibody staining (red) is employed to mark the lamellocytes in lymph gland. In panels (A-D, F-I, K-N and P-S) scale bars = 20 µm. UI indicates uninfected, HPI indicates hours post-wasp-infection. In lymph gland, lamellocytes analyzed at 24HPI and in circulation at 48HPI. In panel (E, J, O) mean with standard deviation is shown and in panels (T and U) median is shown in the box plots and vertical bars represent upper and lowest cell counts. Statistical analysis applied in panel (E, J, O), is unpaired t-test, two-tailed and in panel, (T and U), is Mann-Whitney test, two-tailed. ‘n’ is the total number of larvae analyzed, and for lymph gland ‘n’ represents lymph gland lobes analyzed. White dotted lines demarcate lymph glands. For better representation of the lymph gland primary lobes, the images shown, have been edited for removal of adjacent tissues (like dorsal vessel and ring gland). (A–B) Sima expression detected in control (dome-MESO-Gal4, UAS-GFP/+) lymph gland obtained from (A) uninfected animals (crystal cells marked with white arrows), (B) Sima expression is elevated at 6HPI. See corresponding quantifications in (E). (C, D) Wasp-infection response in (C) control (dome-MESO-Gal4, UAS-GFP/+) showing lamellocytes in lymph gland, (D) Expressing simaRNAi (dome-MESO-Gal4, UAS-GFP; UAS-simaRNAi) in progenitor cells causes reduction in lamellocyte numbers in lymph gland. See corresponding quantifications in (T). (E) Relative fold change in Sima expression in control lymph glands (dome-MESO-Gal4, UAS-GFP/+) from uninfected and infected states at 6HPI. Compared to uninfected control lymph gland (dome-MESO>GFP/+, n = 12), almost twofold increase in Sima expression is observed at 6HPI (dome-MESO>GFP/+, n = 16, ***p=0.0007). (F–I) Compared to Sima levels detected in developing uninfected lymph glands from (A) control (dome-MESO-Gal4, UAS-GFP/+), (F) dome-MESO-Gal4, UAS-GFP; UAS-GatRNAi show reduction in Sima expression which gets elevated (G) when supplemented succinate in food (SF). Similarly, (H) Sima expression in dome-MESO-Gal4, UAS-GFP; UAS-SsadhRNAi also show reduction, (I) which gets elevated on succinate food (SF). See corresponding quantifications in (J). (J) Relative fold change in Sima expression in uninfected lymph glands control (dome-MESO-Gal4, UAS-GFP/+, n = 13), dome-MESO-Gal4, UAS-GFP; UAS-GatRNAi on RF (n = 23, ***p<0.0001) and on succinate food, SF (dome-MESO-Gal4, UAS-GFP; UAS-GatRNAi, SF, n = 13, ***p<0.0001). Similarly compared to control (dome-MESO-Gal4, UAS-GFP/+, n = 9), dome-MESO-Gal4, UAS-GFP; UAS-SsadhRNAi on RF (n = 11, ***p<0.0001) and on SF, (dome-MESO-Gal4, UAS-GFP; UAS-SsadhRNAi, SF, n = 8, ***p<0.0001). (K–N) Compared to Sima level elevation seen in (B) control at 6HPI, (K) dome-MESO-Gal4, UAS-GFP; UAS-GatRNAi failed to show the elevation at 6HPI; however, it gets restored on (L) succinate food (SF). Similarly, (M) dome-MESO-Gal4, UAS-GFP; UAS-SsadhRNAi failed to show the elevation at 6HPI which gets restored on (N) succinate food (SF). See corresponding quantifications in (O). (O) Relative fold change in Sima expression in lymph glands at 6HPI, compared to control on RF (dome-MESO-Gal4, UAS-GFP/+, n = 11), dome-MESO-Gal4, UAS-GFP; UAS-GatRNAi on RF (n = 11, ***p<0.0001), and on succinate food, dome-MESO-Gal4, UAS-GFP; UAS-GatRNAi on SF (n = 9, ***p<0.0001). Similarly compared to control, dome-MESO-Gal4, UAS-GFP/+, dome-MESO-Gal4, UAS-GFP; UAS-SsadhRNAi on RF (n = 8, *p=0.0316), and on SF (dome-MESO-Gal4, UAS-GFP; UAS-SsadhRNAi, SF, n = 9, **p=0.0097). (P–S) Compared to (C) control, (dome-MESO-Gal4, UAS-GFP/+) lymph gland response, (P) expressing Hph (dome-MESO-Gal4, UAS-GFP; UAS-Hph) in progenitor cells causes reduction in lamellocyte numbers in lymph gland. However, (Q) expressing Hph RNAi (dome-MESO-Gal4, UAS-GFP; UAS-Hph RNAi) leads to comparable number of lamellocytes in lymph gland, (R) dome-MESO-Gal4, UAS-GFP; UAS-GatRNAi which shows reduction in lymph gland as compared to (C) control, (S) expressing HphRNAi (dome-MESO-Gal4, UAS-GFP/UAS-GatRNAi; UAS-HphRNAi) in GatRNAi background results into restoration of lamellocyte formation in lymph gland. See corresponding quantifications in (T). (T) Quantifications of lymph gland lamellocyte counts in dome-MESO-Gal4, UAS-GFP/+ (control, n = 81), dome-MESO-Gal4, UAS-GFP; UAS-simaRNAi (n = 77, ***p<0.0001), dome-MESO-Gal4, UAS-GFP; UAS-Hph (n = 19, **p=0.0046) and dome-MESO-Gal4, UAS-GFP; UAS-HphRNAi (n = 52, ns), dome-MESO-Gal4, UAS-GFP; UAS-GatRNAi (n = 26, ***p=0.0003) and dome-MESO-Gal4, UAS-GFP; UAS-GatRNAi; UAS-HphRNAi (n = 16, *p=0.0219). (U) Quantifications of circulating lamellocyte counts in dome-MESO-Gal4, UAS-GFP/+ (control, n = 20), dome-MESO-Gal4, UAS-GFP; UAS-simaRNAi (n = 29, ***p<0.0001), dome-MESO-Gal4, UAS-GFP; UAS-Hph (n = 22, **p=0.0067) and dome-MESO-Gal4, UAS-GFP; UAS-HphRNAi (n = 18, **p=0.0019), dome-MESO-Gal4, UAS-GFP; UAS-GatRNAi (n = 24, **p=0.0014) and dome-MESO-Gal4, UAS-GFP; UAS-GatRNAi; UAS-HphRNAi (n = 9, ***p=0.0001).
-
Figure 3—source data 1
Contains numerical data plotted in Figure 3E,J,O,T and U.
- https://cdn.elifesciences.org/articles/60376/elife-60376-fig3-data1-v2.xlsx
Figure 3—figure supplement 1
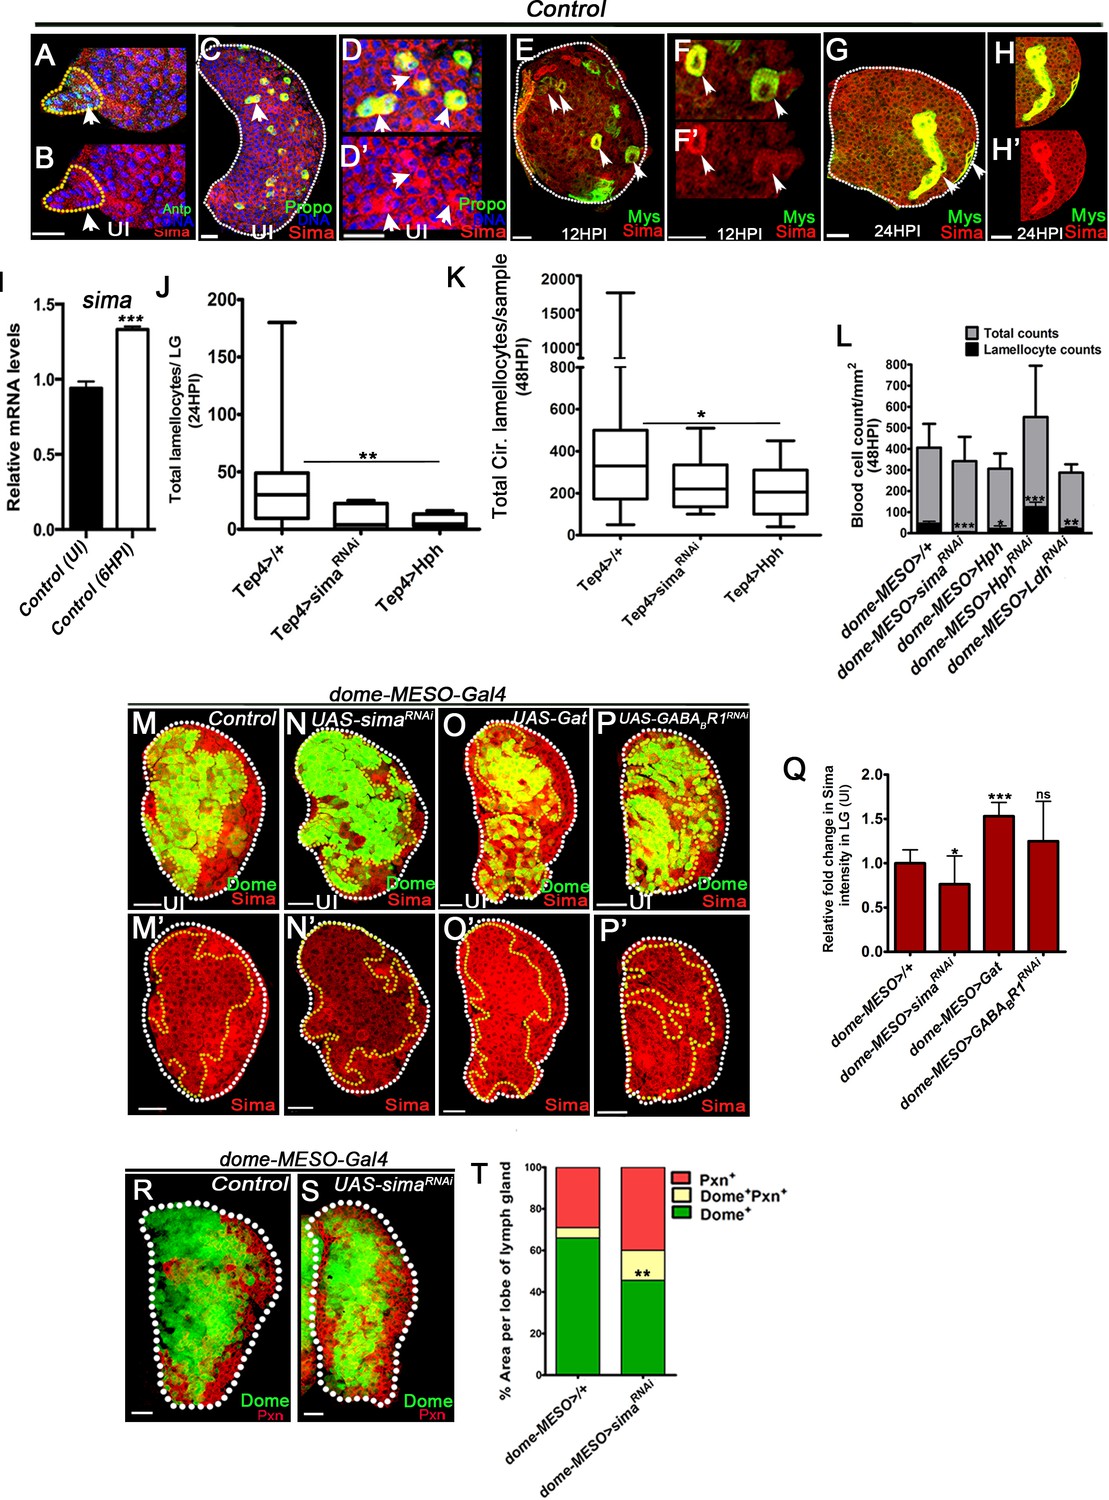
Sima function during larval hematopoiesis establishes lamellocyte potential.
DNA is stained with DAPI (blue). In lymph gland, lamellocytes analyzed at 24HPI and in circulation at 48HPI. Sima stainings (red) in panels (A–H) and (M–P’). Dome-GFP-positive area marks progenitor area and Pxn-positive area marks differentiating pool of blood cells (in panels y, y). In panels (A-H’, M-P’, R and S) scale bar = 20 µm. HPI indicates hours post wasp-infection, RF is regular food, and SF is succinate food. Panels (I, L, Q and T) represents mean ± standard deviation (mean ± SD), and panels (J and K) show median in box plots and vertical bars represent upper and lowest cell counts. Statistical analysis in panels (I, L, Q and T) is unpaired t-test, two-tailed and in panels (J and K) is Mann-Whitney test, two-tailed. ‘n’ represents the total number of larvae analyzed, and for lymph gland ‘n’ represents lymph gland lobes analyzed. ns is nonsignificant. For better representation of the lymph gland primary lobes, the images shown have been edited for removal of adjacent tissues (like dorsal vessel and ring gland). (A, B) Control (dome-MESO-Gal4, UAS-GFP/+) lymph gland from 3rd instar larvae obtained from uninfected animals showing (A) Sima protein expression (red) in the posterior signaling center (PSC) cells marked with Antp (green, area marked within yellow dotten line and white arrows head). Image in (B) shows Sima (red) in PSC cells (marked with yellow dotted line). (C–D’) Control (dome-MESO-Gal4, UAS-GFP/+) lymph gland from 3rd instar larvae obtained from uninfected condition showing elevated Sima protein expression (red) in crystal cells (ProPoA, green and marked with white arrows head). (D, D’) Zoomed images of elevated Sima expression in crystal cells. (E–F’) Control (Or49a-Gal4/+) lymph gland at 12HPI showing elevated Sima protein expression (red) in lamellocytes (co-stained with Myospheroid (Mys) in green and indicated with white arrowheads). (F, F’) show zoomed images of elevated Sima expression in lamellocytes at 12HPI. (G–H’) Control (Or42a-Gal4/+) lymph gland at 24HPI, showing elevated Sima protein expression (red) in lamellocytes (co-stained with Myospheroid (Mys) in green and indicated with white arrowheads). (H, H’) show zoomed images of elevated Sima expression in lamellocytes at 24 HPI. (I) Relative mRNA quantification of sima in control lymph glands obtained from uninfected and wasp-infected 3rd instar larvae at 6 HPI (***p<0.0001). (J, K) Quantifications of lamellocyte counts in (J) lymph gland in Tep4-Gal4, UAS-mCherry/+ (control, n = 25), Tep4-Gal4, UAS-mCherry; UAS-simaRNAi (n = 5, ns), Tep4-Gal4, UAS-mCherry; UAS-Hph (n = 14, **p=0.0027) and in (K) circulation Tep4-Gal4, UAS-mCherry/+ (control, n = 38), Tep4-Gal4, UAS-mCherry; UAS-simaRNAi (n = 13, ns), Tep4-Gal4, UAS-mCherry; UAS-Hph (n = 20, *p=0.0231). (L) Quantification of total circulating blood cell numbers per mm2 in animals at 48 HPI. Represented here are the numbers of lamellocytes (black bar) and total cell counts (gray bar) counted per mm2. No significant difference in overall cell density is detected, although significant reduction in lamellocyte numbers is seen in dome-MESO-Gal4, UAS-GFP; UAS-simaRNAi (n = 5, ***p<0.0001), dome-MESO-Gal4, UAS-GFP; UAS-Hph (n = 5, *p=0.0172) and an increase in dome-MESO-Gal4, UAS-GFP; UAS-HphRNAi (n = 5, ***p=0.0004), a decrease in dome-MESO-Gal4, UAS-GFP; UAS-LdhRNAi in (n = 5, **p=0.0055) and in comparison to dome-MESO-Gal4, UAS-GFP/+ (control, n = 5). (M–P’) Compared to Sima protein expression (red) in lymph glands from 3rd instar (M, M’) control (dome-MESO-Gal4, UAS-GFP/+) animals, a (N, N’) downregulation is seen in progenitor cells expressing simaRNAi (dome-MESO-Gal4, UAS-GFP; UAS-simaRNAi). (O, O’) Gat over-expressing progenitor cells (dome-MESO-Gal4, UAS-GFP; UAS-Gat) show elevated Sima protein expression in them. Compared to control (R, R’) GABABR1RNAi-expressing progenitor cells (dome-MESO-Gal4, UAS-GFP; UAS-GABABR1RNAi) show comparable sima expression. Images in M’–P’ show sima expression (red) of the respective images shown in M–P without GFP for better clarity. (Q) Relative fold change in Sima expression in dome-MESO-Gal4, UAS-GFP/+ (control, n = 12), dome-MESO-Gal4, UAS-GFP; UAS-simaRNAi (n = 10, *p=0.0326), dome-MESO-Gal4, UAS-GFP; UAS-Gat (n = 15, ***p<0.0001) and dome-MESO-Gal4, UAS-GFP; UAS-GABABR1RNAi (n = 10, ns). (R, S) 3rd instar lymph glands from (R) control (dome-MESO-Gal4, UAS-GFP/+) and, (S) lymph glands expressing simaRNAi in progenitor cells (dome-MESO-Gal4, UAS-GFP; UAS-simaRNAi). No dramatic change in lymph gland development is seen but progenitor maintenance (Dome+, green) and differentiation (Pxn+, red) marker analysis reveals a mild increase in Dome+Pxn+ cells, see quantification in (T). (T) Graphical representation of percentage areas of progenitor cells (green, Dome+ only), intermediate population (IP, yellow, Dome+ Pxn+) and differentiating blood cells (red, Peroxidasin+ only) in 3rd instar larval lymph gland. An expansion of IP is noted in genetic knock-down of sima, dome-MESO-Gal4, UAS-GFP; UAS-simaRNAi (n = 15, **p=0.0089) as percentage area distribution in comparison to dome-MESO-Gal4, UAS-GFP/+ (control, n = 6).
-
Figure 3—figure supplement 1—source data 1
Contains numerical data plotted in Figure 3—figure supplement 1I,J,K,L,Q and T.
- https://cdn.elifesciences.org/articles/60376/elife-60376-fig3-figsupp1-data1-v2.xlsx
Figure 3—figure supplement 2
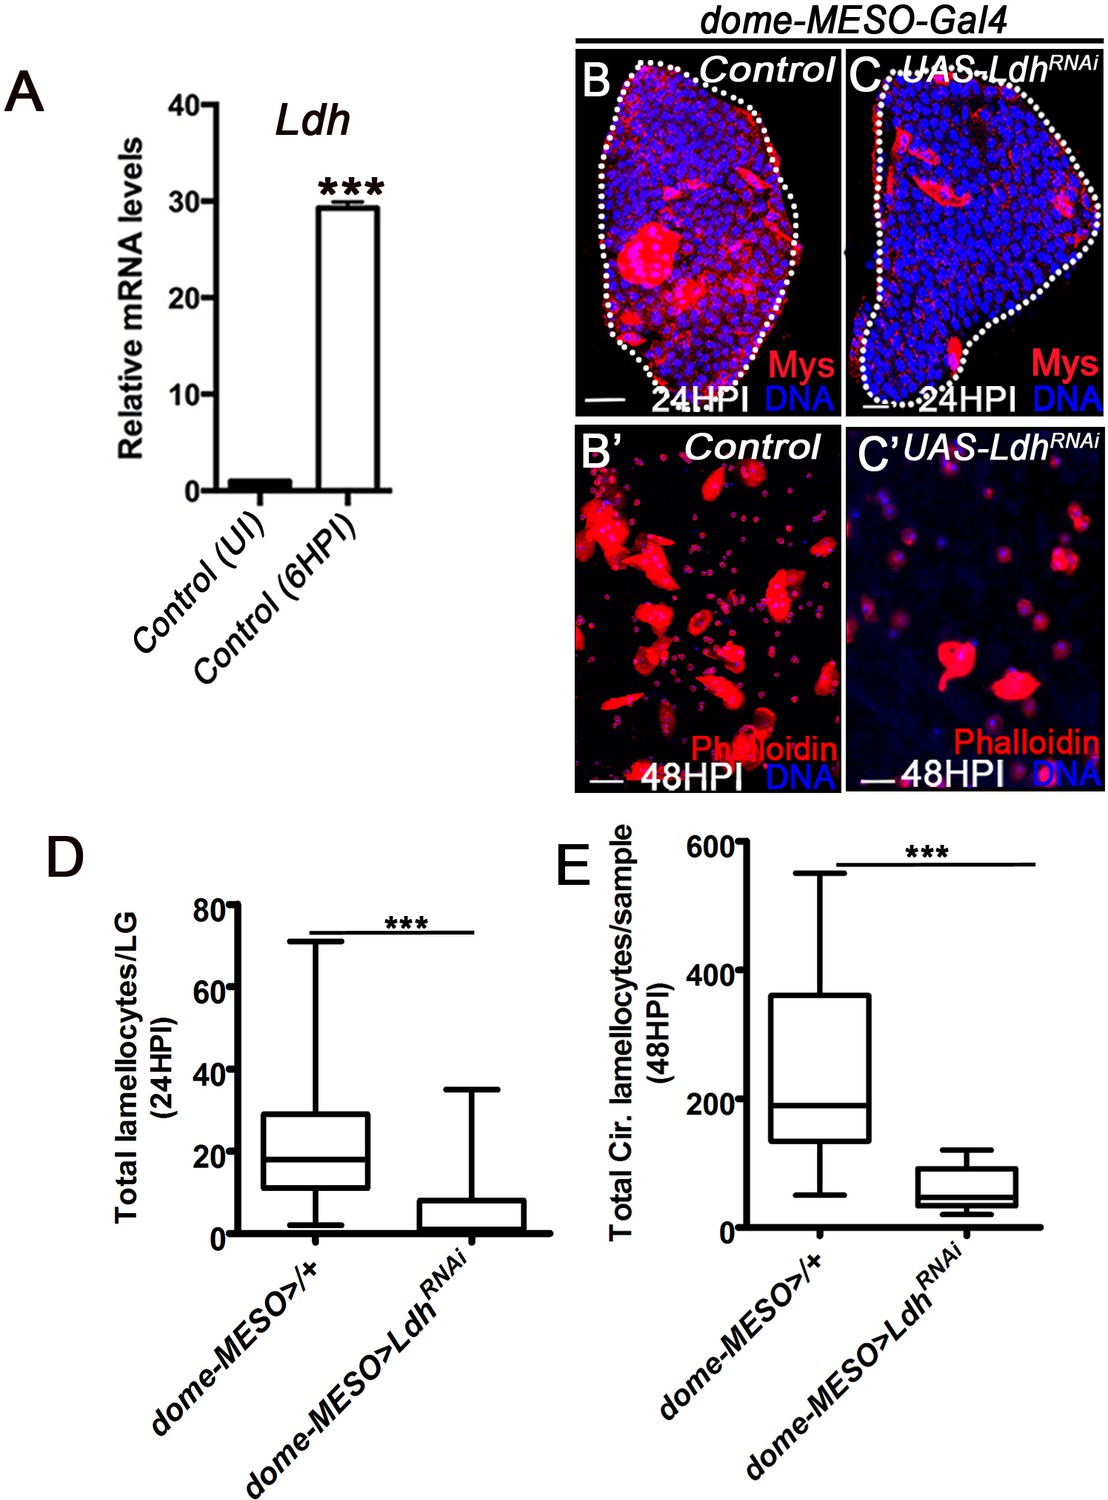
Ldh function in immune cells necessary for lamellocyte induction.
DNA is stained with DAPI (blue). UI is uninfected, HPI indicates hours post wasp-infection. In lymph gland, lamellocytes analyzed at 24HPI and in circulation at 48HPI. In panels (B and C) scale bar = 20 µm and in panels (B’ and C’) scale bar = 50 µm. In panel (A), mean ± standard deviation (mean ± SD) is shown and in panels (D and E), median in box plots are shown and vertical bars represent upper and lowest cell counts. Statistical analysis in panel (A) is unpaired t-test, two-tailed and in panels (D and E) is Mann-Whitney test, two-tailed. ‘n’ represents the total number of larvae analyzed and for lymph gland ‘n’ represents lymph gland lobes analyzed. For better representation of the lymph gland primary lobes, the images shown, have been edited for removal of adjacent tissues (like dorsal vessel and ring gland). (A) Relative mRNA quantification of Ldh in control lymph glands obtained from uninfected and wasp-infected 3rd instar larvae at 6HPI (***p<0.0001). (B–C’) Compared to (B, B’) control (dome-MESO-Gal4, UAS-GFP/+), lamellocyte formation in (B) lymph gland and in (B’) circulation, progenitor-specific expression of (C, C’) Ldh RNAi(dome-MESO-Gal4, UAS-GFP; UAS- Ldh RNAi) causes reduction in lamellocytes formation in (C) lymph gland and in (C’) circulation. (D) Quantifications of total lamellocyte per lymph gland in dome-MESO-Gal4, UAS-GFP/+ (control, n = 19), dome-MESO-Gal4, dome-MESO-Gal4, UAS-GFP; UAS- Ldh RNAi (n = 15, ***p=0.0006). (E) Quantifications of total circulating lamellocyte per sample in dome-MESO-Gal4, UAS-GFP/+ (control, n = 27), dome-MESO-Gal4, UAS-GFP; UAS-Ldh RNAi (n = 14, ***p<0.0001).
-
Figure 3—figure supplement 2—source data 1
Contains numerical data plotted in Figure 3—figure supplement 2A,D and E.
- https://cdn.elifesciences.org/articles/60376/elife-60376-fig3-figsupp2-data1-v2.xlsx
Figure 4 with 1 supplement
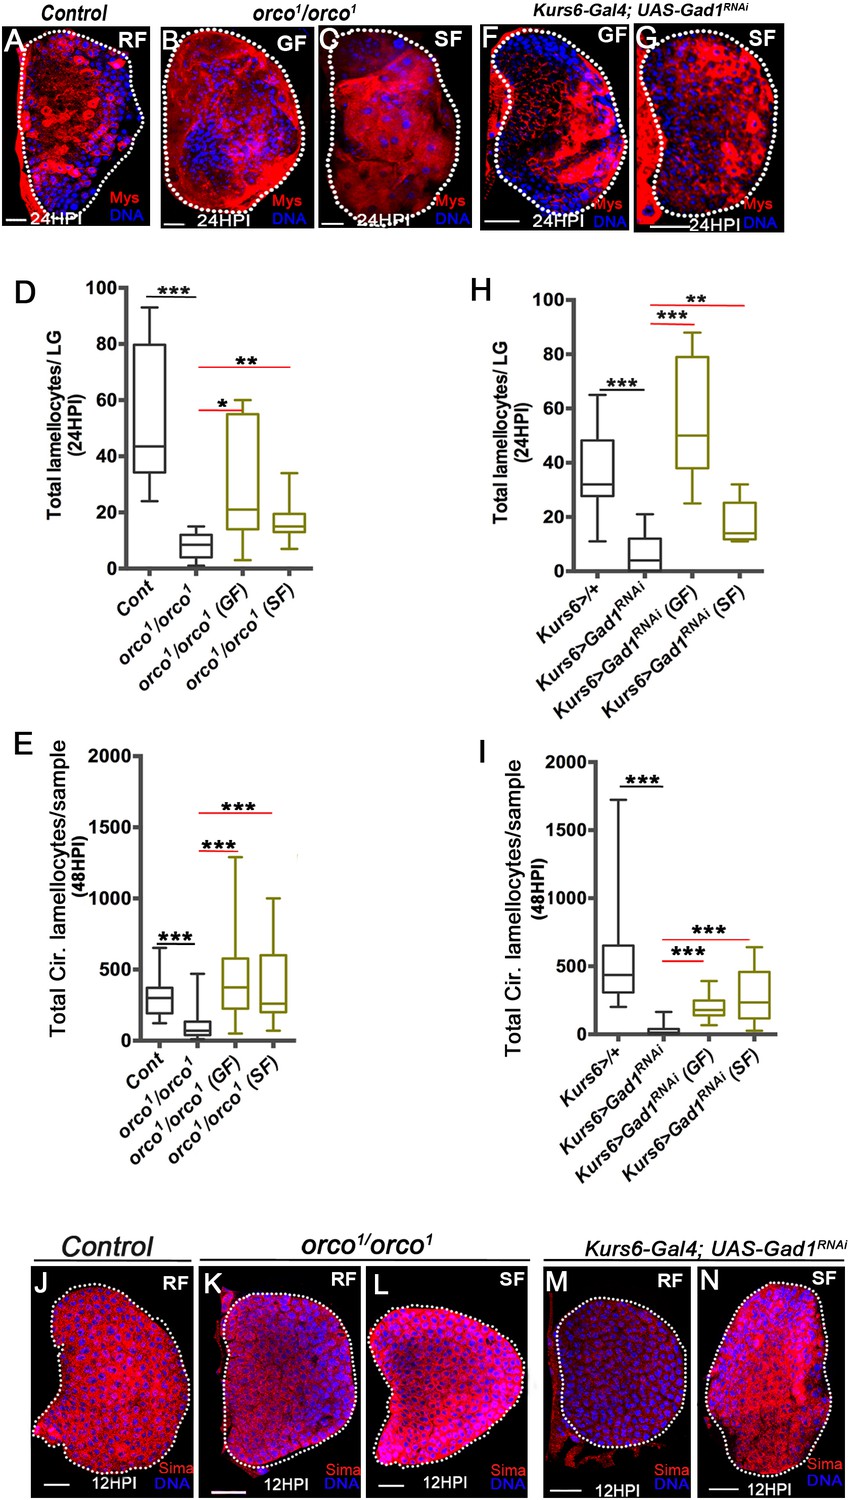
Olfaction-derived GABA and its metabolism to succinate controls lamellocyte potential.
DNA is marked with DAPI (blue). Lamellocytes in panels (A-C, F and G) are marked with Myospheroid (Mys, red). Lamellocytes are characterized by their large flattened morphology. Scale bars in panels (A-C, F, G and J-N = 20 µm). HPI indicates hours post wasp-infection, RF is regular food, GF is GABA supplemented food, SF is succinate supplemented food. In lymph gland, lamellocytes analyzed at 24HPI and in circulation at 48HPI. In panels (D, E, H and I) median is shown in the box plots and vertical bars represent upper and lowest cell counts. Mann-Whitney test, two-tailed is applied for statistical analysis. ‘n’ represents the total number of larvae analyzed, and for lymph glands ‘n’ represents lymph gland lobes analyzed. White dotted lines demarcate lymph glands. For better representation of the lymph gland primary lobes, the images shown, have been edited for removal of adjacent tissues (like dorsal vessel and ring gland). (A–C) In response to wasp-infection, lamellocytes in lymph gland (A) control (Kurs6-Gal4/+) in regular food (RF), (B) orco1/orco1 rescue in GABA supplemented food (GF) and (C) orco1/orco1 rescue in succinate supplemented food (SF). (D) Total lamellocyte count in lymph gland from control, (w1118, n = 8), orco1/orco1 mutant in RF (n = 10, ***p<0.0001), GF (n = 7, *p=0.022) and SF (n = 13, **p=0.006). (E) Total lamellocyte count in circulation from control (w1118, n = 14), orco1/orco1 mutant in RF (n = 41, ***p<0.0001), GF (n = 18, ***p<0.0001) and SF (n = 14, ***p<0.0001). (F–G) In response to wasp-infection, lamellocytes in lymph gland, Kurs6-Gal4, UAS-Gad1RNAi in (F) GABA supplemented food (GF) and (G) succinate supplemented food (SF), compared to (A) control (Kurs6-Gal4/+) in regular food (RF). (H) Total lamellocytes counts in lymph gland from control (Kurs6-Gal4/+, n = 18), Kurs6-Gal4, UAS-Gad1RNAi in RF (n = 22, ***p<0.0001), GF (n = 11, ***p<0.0001) and SF (n = 6, **p=0.007). (I) Total lamellocyte count in circulation in Kurs6-Gal4/+, (n = 25), Kurs6-Gal4, UAS-Gad1RNAi on RF (n = 25, ***p<0.0001), GF (n = 12, ***p<0.0001) and SF (n = 26, ***p<0.0001). (J–N) Compared to Sima protein levels detected at 12HPI in lymph glands from (J) control (w1118) animals on RF, (K) orco1/orco1 on RF and (M) Kurs6-Gal4, UAS-Gad1RNAi on RF show reduced Sima expression, which is restored with succinate supplementation, (L) orco1/orco1 on SF and (N) Kurs6-Gal4, UAS-Gad1RNAi on SF.
-
Figure 4—source data 1
Contains numerical data plotted in Figure 4D,E,H and I.
- https://cdn.elifesciences.org/articles/60376/elife-60376-fig4-data1-v2.xlsx
Figure 4—figure supplement 1
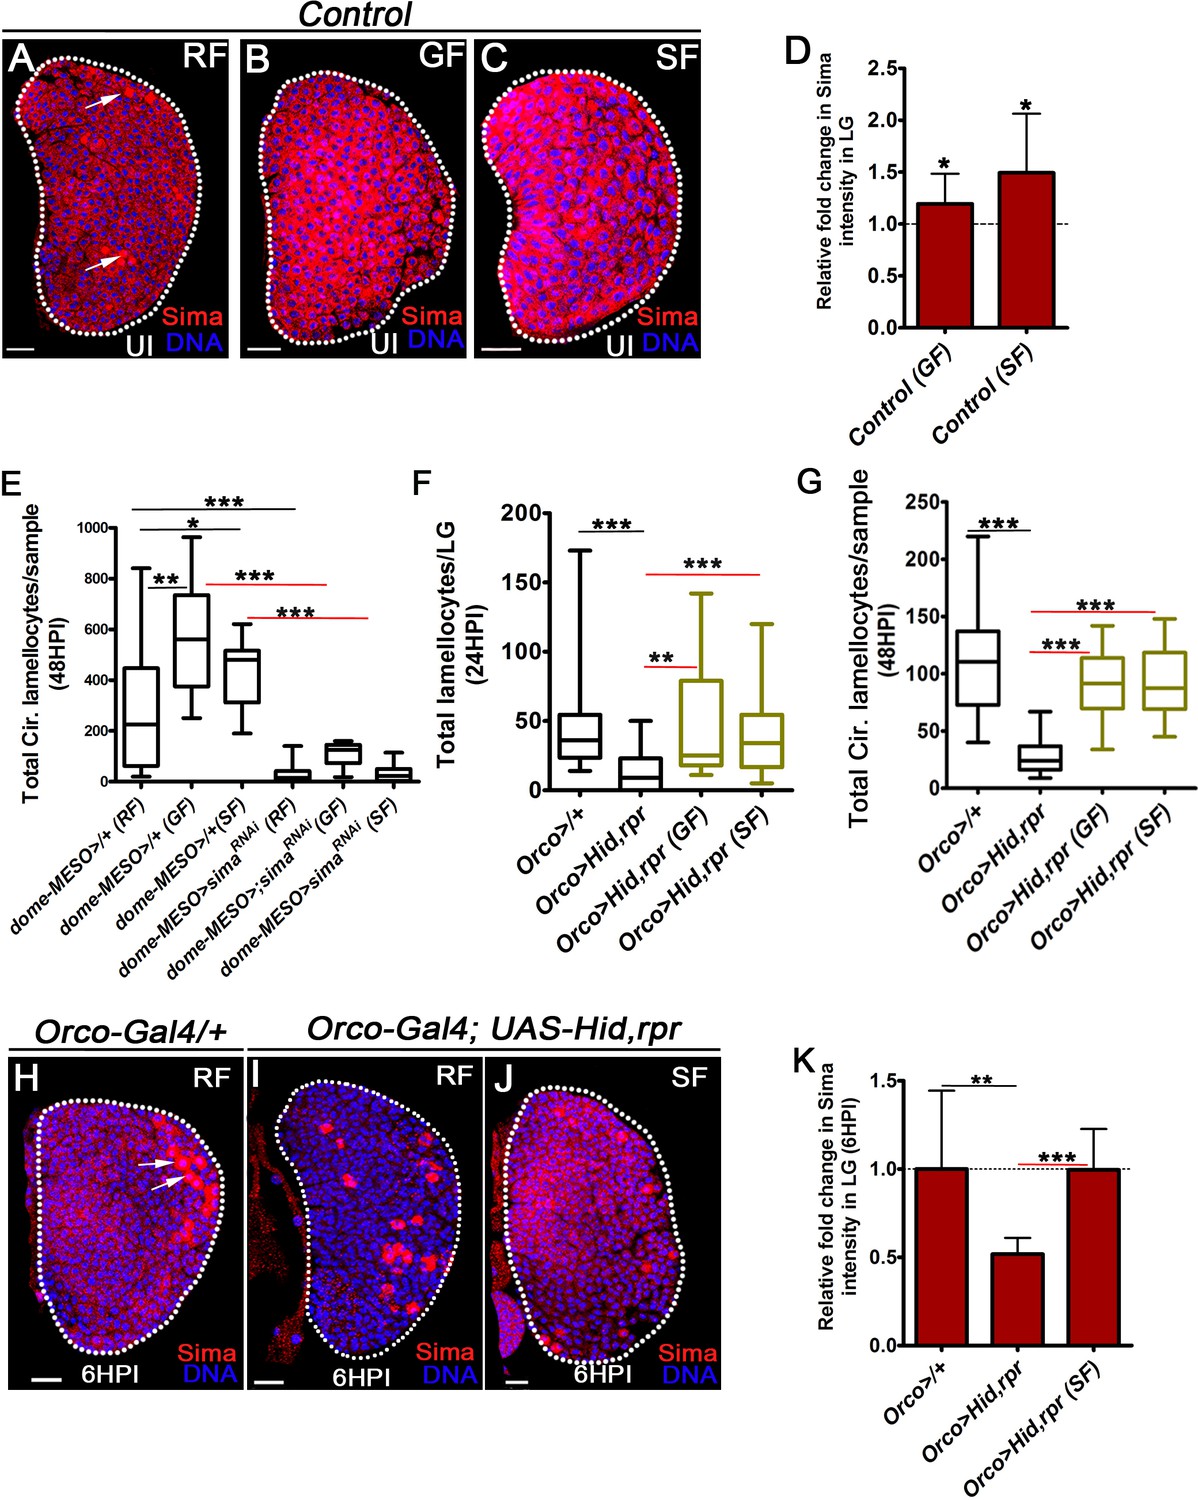
Olfaction/GABA axis controls lamellocyte induction via modulating blood cell succinate and Sima levels.
DNA is stained with DAPI (blue), RF is regular food, GF is GABA-supplemented food, SF is succinate supplemented food. UI is uninfected, HPI indicates hours post wasp-infection. In lymph gland, lamellocytes analyzed at 24HPI and in circulation at 48HPI. In panels A-C, H-J scale bar = 20 µm). In panels (D and K) mean ± standard deviation (mean ± SD) is shown and in panels (E–G) median in box plots are shown and vertical bars represent upper and lowest cell counts. Statistical analysis in panels (D and K) is unpaired t-test, two-tailed and in panels (E–G) is Mann-Whitney test, two-tailed. ‘n’ represents the total number of larvae analyzed and for lymph gland ‘n’ represents lymph gland lobes analyzed. White dotted lines demarcate lymph glands and black dotted line in panels (D and K) represent base-line expression in controls. For better representation of the lymph gland primary lobes, the images shown have been edited for removal of adjacent tissues (like dorsal vessel and ring gland). (A–C) Compared to basal Sima expression in (A) control 3rd instar larval lymph gland, elevated levels of Sima protein is detected in lymph glands obtained from animals raised on (B) GABA supplemented food, GF and (C) succinate supplemented food, SF. (D) Relative fold change in Sima expression in control lymph gland (Hml△-Gal4, UAS-GFP/+) on GABA (GF) and succinate supplemented food (SF). Elevated sima expression is detected in lymph gland on GABA supplemented food, GF (n = 22, *p=0.0167), compared to regular food, RF (n = 19) and succinate supplemented food, SF (n = 23, *p=0.0219) compared to regular food, RF (n = 10) controls. (E) Quantification of total circulating lamellocyte numbers per sample in dome-MESO-Gal4; UAS-GFP/+ on RF (control, n = 42), GF (n = 9, **p=0.0022), and SF (n = 7, *p=0.0321). dome-MESO-Gal4; UAS-GFP; UAS-simaRNAi on RF (n = 29, ***p<0.0001), GF (n = 9, ***p=0.0004), and SF (n = 24, ***p<0.0001) does not show lamellocyte expansion when compared with respective controls, dome-MESO-Gal4; UAS-GFP/+ on RF, GF, and SF. (F) Quantifications of lamellocyte count in lymph gland in control Orco-Gal4/+ (n = 17), Orco-Gal4, UAS-Hid, rpr on RF (n = 19, ***p<0.0001) and its rescue on GF (n = 13, **p=0.0029) and SF (n = 18, ***p=0.0004). (G) Quantifications showing total circulating lamellocyte counts per sample in control Orco-Gal4/+ (n = 34), Orco-Gal4, UAS-Hid, rpr on RF (n = 36, ***p<0.0001) and its rescue on GF (n = 16, ***p<0.0001) and SF (n = 20, ***p<0.0001). (H–J) Representative lymph gland images showing Sima expression in infected states (6HPI). Compared to (H) basal Sima expression(red) in blood cells except in crystal cells (white arrows) in control, Orco-Gal4/+, (I) Orco-Gal4, UAS-Hid, rpr animals show reduced Sima protein expression, (J) which is restored with succinate supplementation (SF). (K) Relative fold change in Sima expression in lymph glands lobes at 6HPI of Orco>/+ on RF (n = 12), Orco>UAS-Hid, rpr on RF (n = 11, **p=0.002), Orco>UAS-Hid, rpr on SF (n = 12, ***p<0.0001).
-
Figure 4—figure supplement 1—source data 1
Contains numerical data plotted in Figure 4—figure supplement 1D,E,F,G and K.
- https://cdn.elifesciences.org/articles/60376/elife-60376-fig4-figsupp1-data1-v2.xlsx
Figure 5 with 2 supplements
Physiological role for odors in blood cell immunity.
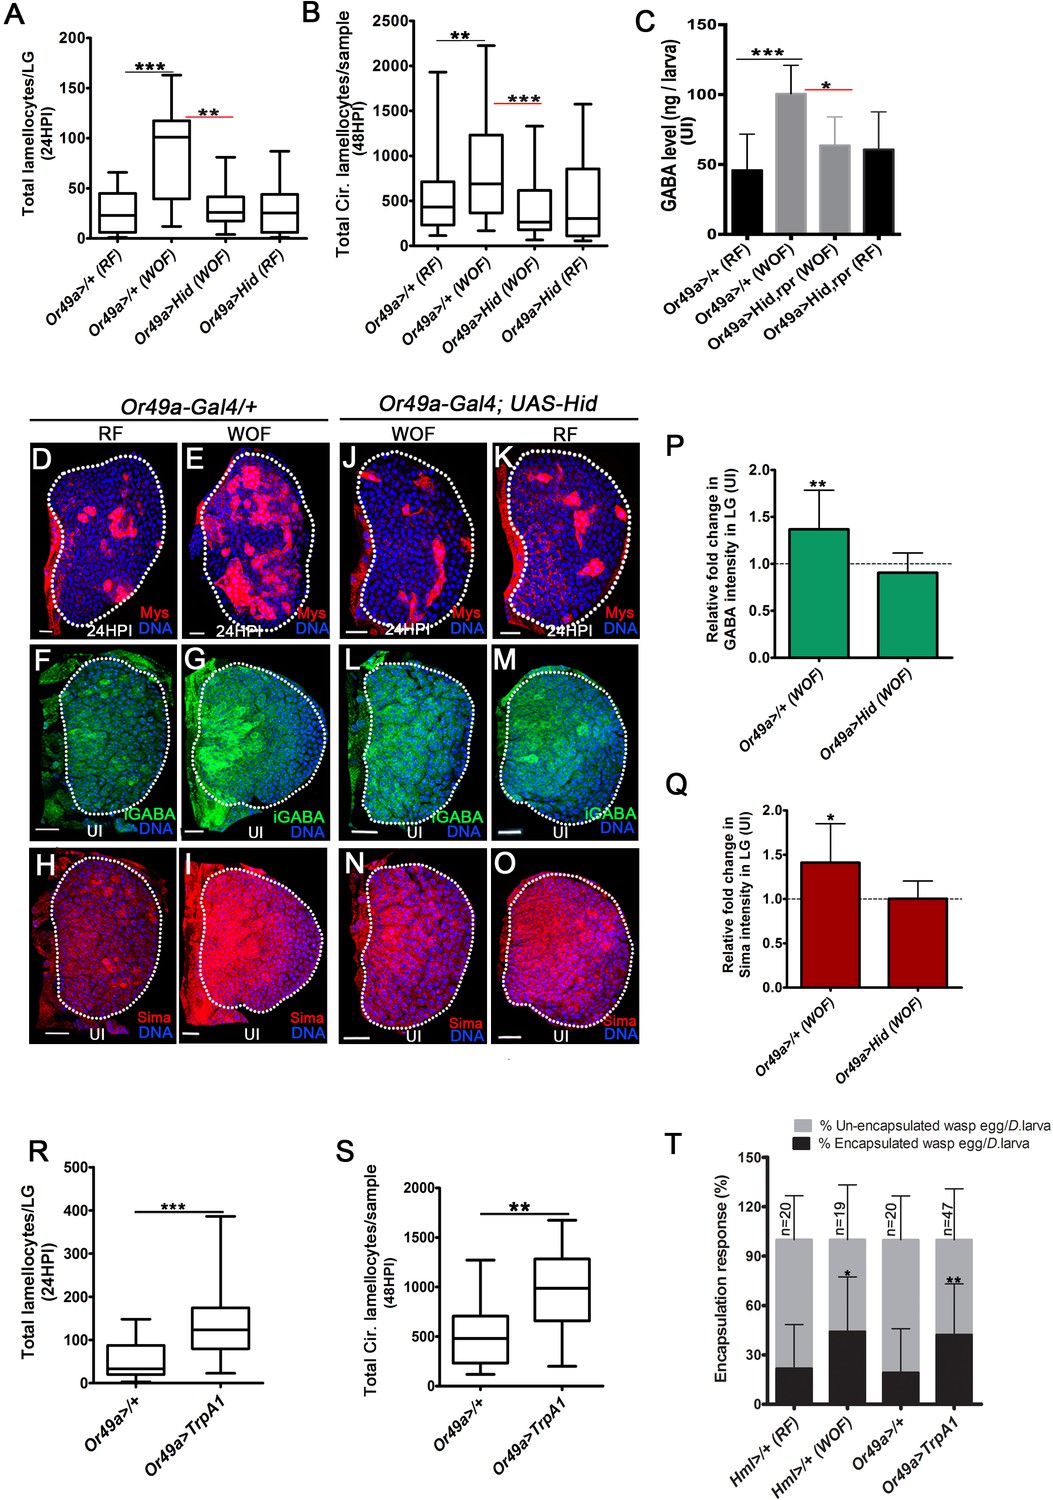
DNA is marked with DAPI (blue), iGABA (green), Sima protein (red), and Myospheroid (Mys) staining (red) is employed to mark the lamellocytes in lymph gland Scale bars in panels D-O = 20 µm. RF is regular food, WOF is wasp-odor food and HPI indicates hours post wasp-infection. In lymph gland, lamellocytes analyzed at 24HPI and in circulation at 48HPI. In A, B, R and S median is shown as box plots and vertical bars represent the upper and lowest cell-counts. In panels C, P, Q, and T mean with standard deviation is shown. Statistical analysis, in panels A, B, R, and S is Mann-Whitney test, two-tailed and in panels C, P, Q, and T is unpaired t-test, two-tailed. ‘n’ represents total number of larvae analyzed, and for lymph gland ‘n’ represents lymph gland lobes analyzed. ns is nonsignificant. White dotted lines demarcate lymph glands. For better representation of the lymph gland primary lobes, the images shown, have been edited for removal of adjacent tissues (like dorsal vessel and ring gland). (A) Quantifications of lymph gland lamellocyte numbers. Compared to controls (Or49a-Gal4/+) raised on RF (n = 23), animal raised on WOF show increase in lamellocytes number (n = 17, ***p<0.0001). However, such increase not observed in Or49a-Gal4, UAS-Hid larvae when raised on WOF (n = 13, **p=0.0015) compared to Or49a-Gal4, UAS-Hid raised on RF (n = 20). (B) Quantifications of total circulating lamellocyte numbers per larvae. Compared to control (Or49a-Gal4/+) raised on RF (n = 38), animal raised on WOF show increase in lamellocytes number (n = 35, **p=0.0085); however, such increase was not observed in Or49a-Gal4, UAS-Hid larvae when raised on WOF (n = 29, ***p=0.0003) compared to Or49a-Gal4, UAS-Hid raised on RF (n = 29). (C) Quantifications of hemolymph GABA from uninfected 3rd instar larvae on RF (Or49a-Gal4/+, n = 27), WOF (Or49a-Gal4/+, n = 30 ***p=0.0008), Or49a-Gal4, UAS-Hid, rpr on WOF (n = 30 *p=0.011) and Or49a-Gal4, UAS-Hid, rpr on RF (n = 27). Refer Supplementary file 4 for absolute amounts. (D–E) Compared to (D) control (Or49a-Gal4/+) lymph gland lamellocyte response, (E) WOF (Or49a-Gal4/+) animals show increased number of lamellocytes. (F–G) Compared to (F) control (Or49a-Gal4/+) lymph gland iGABA levels, (G) WOF (Or49a-Gal4/+) animals show elevated levels of iGABA. (H–I) Compared to (H) control (Or49a-Gal4/+) lymph gland Sima protein expression, (I) WOF (Or49a-Gal4/+) animals show increased Sima expression. (J–K) WOF condition failed to increase the lamellocyte numbers in (J) WOF (Or49a-Gal4; UAS-Hid), when compared to (K) RF (Or49a-Gal4; UAS-Hid) animals. (L–O) iGABA levels and Sima expression are also comparable in (L, N) WOF (Or49a-Gal4; UAS-Hid), when compared to (M, O) RF (Or49a-Gal4; UAS-Hid) animals. See corresponding quantifications in (P and Q). (P) Relative fold change in iGABA intensity of uninfected Or49a>/+ on WOF (n = 14, **p=0.008), and Or49a>Hid on WOF (n = 9, ns) in comparison to RF (Or49a>/+, n = 11), and RF (Or49a>Hid, n = 5), respectively. (Q) Relative fold change in Sima protein intensity of uninfected Or49a>/+ on WOF (n = 14, *p=0.011), and Or49a>Hid on WOF (n = 9, ns) in comparison to RF (Or49a>/+, n = 11) and RF (Or49a>Hid, n = 5), respectively. (R) Quantifications of lymph gland lamellocyte numbers. Compared to control (Or49a-Gal4/+, n = 41), forced activation of odorant receptor neuron (ORN), Or49a (Or49a-Gal4; UAS-TrpA1 n = 41, ***p<0.0001) show increase in lamellocytes numbers in the lymph gland. (S) Quantifications of total circulating lamellocytes. Compared to control (Or49a-Gal4/+, n = 19), increase in lamellocytes number is seen upon forced activation of Or49a-Gal4; UAS-TrpA1 (n = 17, **p=0.001). (T) Quantification of encapsulation response. Compared to control on RF (Hml>/+, n = 20), increased encapsulation response (%) is seen in WOF animals (Hml>/+, n = 19, *p=0.0256), a similar increase is also seen upon forced activation of ORN, Or49a (Or49a-Gal4; UAS-TrpA1, n = 47, **p=0.0068), as compared to control (Or49a-Gal4>/+, n = 20).
-
Figure 5—source data 1
Contains numerical data plotted in Figure 5A,B,C,P,Q,R,S and T.
- https://cdn.elifesciences.org/articles/60376/elife-60376-fig5-data1-v2.xlsx
Figure 5—figure supplement 1
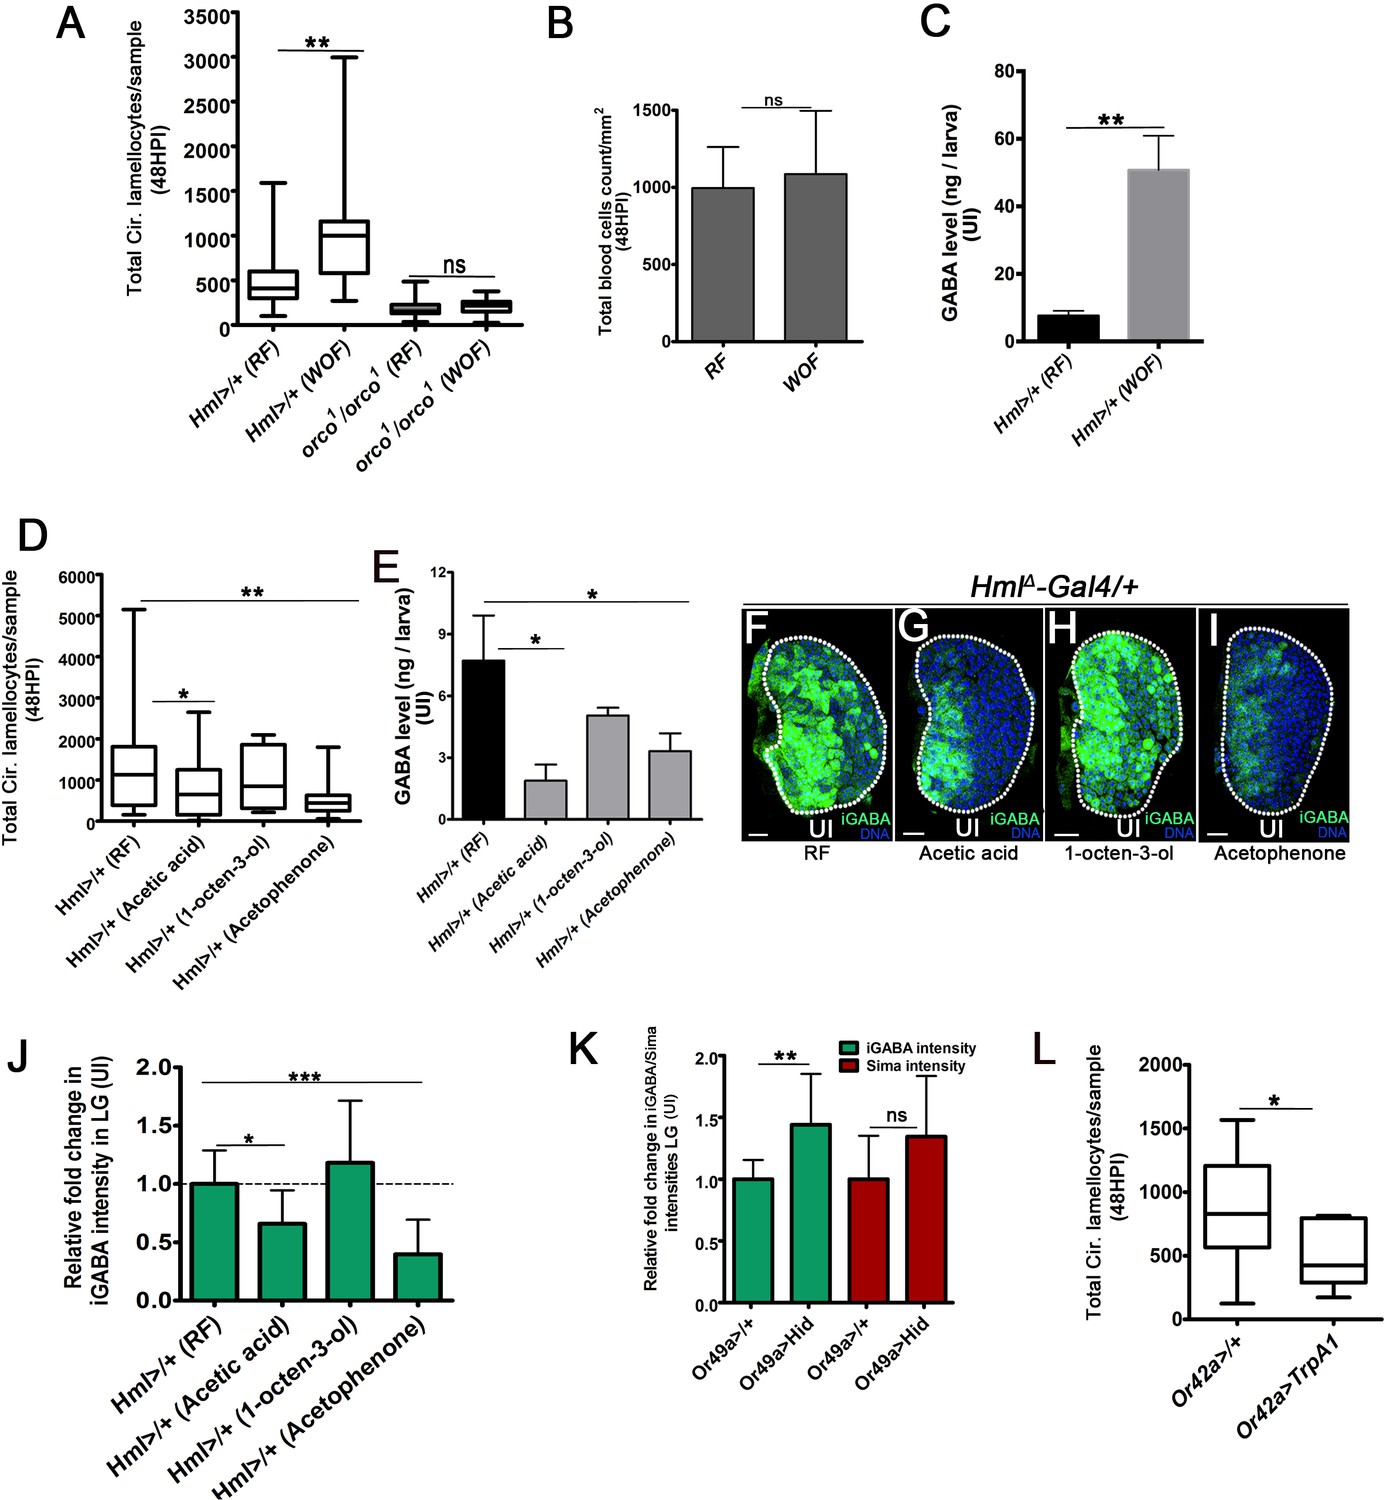
Physiological control of cellular immunity by pathogenic wasp-odors.
DNA marked with DAPI (blue), iGABA (green). HPI indicates hours post wasp-infection, RF is regular food, WOF is wasp-odor food. Lamellocytes analyzed at in circulation at 48HPI. Scale bars in panels F-I = 20 µm. In (A, D and L) median is shown in box plots and vertical bars represent upper and lowest cell counts. In (B, C, E, J and K) mean ± standard deviation (mean ± SD) is shown. Statistical analysis in panels (A, D and L) is Mann-Whitney, two-tailed and in panels (B, C, E, J and K) is unpaired t-test, two-tailed and ‘n’ represents the total number of larvae analyzed and for lymph gland ‘n’ represents lymph gland lobes analyzed. White dotted lines demarcate lymph glands and black dotted line in panel j represents base-line expression in controls. For better representation of the lymph gland primary lobes, the images shown, have been edited for removal of adjacent tissues (like dorsal vessel and ring gland). (A) Total circulating lamellocyte quantification in RF (Hml△-Gal4, UAS-GFP/+, control, n = 19) and WOF (Hml△-Gal4, UAS-GFP/+, n = 19, **p=0.009), orco1/orco1 on RF (n = 27) and orco1/orco1 on WOF (n = 25, ns compared to orco1/orco1 on RF). (B) Quantifications of total circulating blood cell numbers per mm2 in animals at 48 HPI. No significant difference in overall cell density is detected in Hml△-Gal4, UAS-GFP/+ on RF (control, n = 12) and WOF (n = 12, ns). (C) Compared to hemolymph GABA levels in larvae raised on RF, WOF larvae have elevated systemic GABA. Quantifications of hemolymph GABA from 3rd instar larvae on RF (control, Hml△-Gal4, UAS-GFP/+, n = 15) and WOF (Hml△-Gal4, UAS-GFP/+, n = 15 **p=0.002). Refer Supplementary file 4 for absolute amounts. (D) Compared to total circulating lamellocyte counts per sample (Hml△-Gal4, UAS-GFP/+) reared on RF (control, n = 30), a reduction is observed on acetic acid (n = 31, *p=0.049). 1-octen-3-ol (n = 10, ns) showed no difference, a significant reduction was seen with acetophenone (n = 23, **p=0.006). (E) Quantifications of hemolymph GABA from 3rd instar larvae on RF (Hml△-Gal4, UAS-GFP/+, n = 10), acetic acid (n = 15, *p=0.021), 1-octen-3-ol (n = 15, ns) and acetophenone (n = 15, *p=0.045). Refer Supplementary file 4 for absolute amounts. (F–I) iGABA levels in lymph gland lobes obtained from 3rd instar animals (Hml△-Gal4, UAS-GFP/+) reared in different odor conditions. Compared to (F) RF, (G) acetic acid showed reduction, (H) 1-octen-3-ol showed no change and (I) acetophenone showed reduction in iGABA levels. (J) Quantifications of lymph gland iGABA levels shown in F–I as mean intensity plots. Hml△-Gal4, UAS-GFP/+ on RF (control, n = 17), Hml△-Gal4, UAS-GFP/+ on acetic acid (n = 8, *p=0.0109), 1-octen-3-ol (n = 11, ns), and acetophenone (n = 10, ***p<0.0001). (K) Relative fold change in iGABA (green bars) and Sima protein (red bars) expression upon blocking Or49a function in lymph gland lobes. GABA and Sima expression in Or49a>/+ (control, n = 11) and Or49a>UAS-Hid (n = 5, **p=0.0065 for iGABA levels and ns for Sima). (L) Quantifications of total circulating lamellocytes seen upon forced activation of (L) Or42a-Gal4/+ (control, n = 17), Or42a-Gal4; UAS-TrpA1 (n = 10, *p=0.03).
-
Figure 5—figure supplement 1—source data 1
Contains numerical data plotted in Figure 5—figure supplement 1A,B,C,D,E,J,K and L.
- https://cdn.elifesciences.org/articles/60376/elife-60376-fig5-figsupp1-data1-v2.xlsx
Figure 5—figure supplement 2
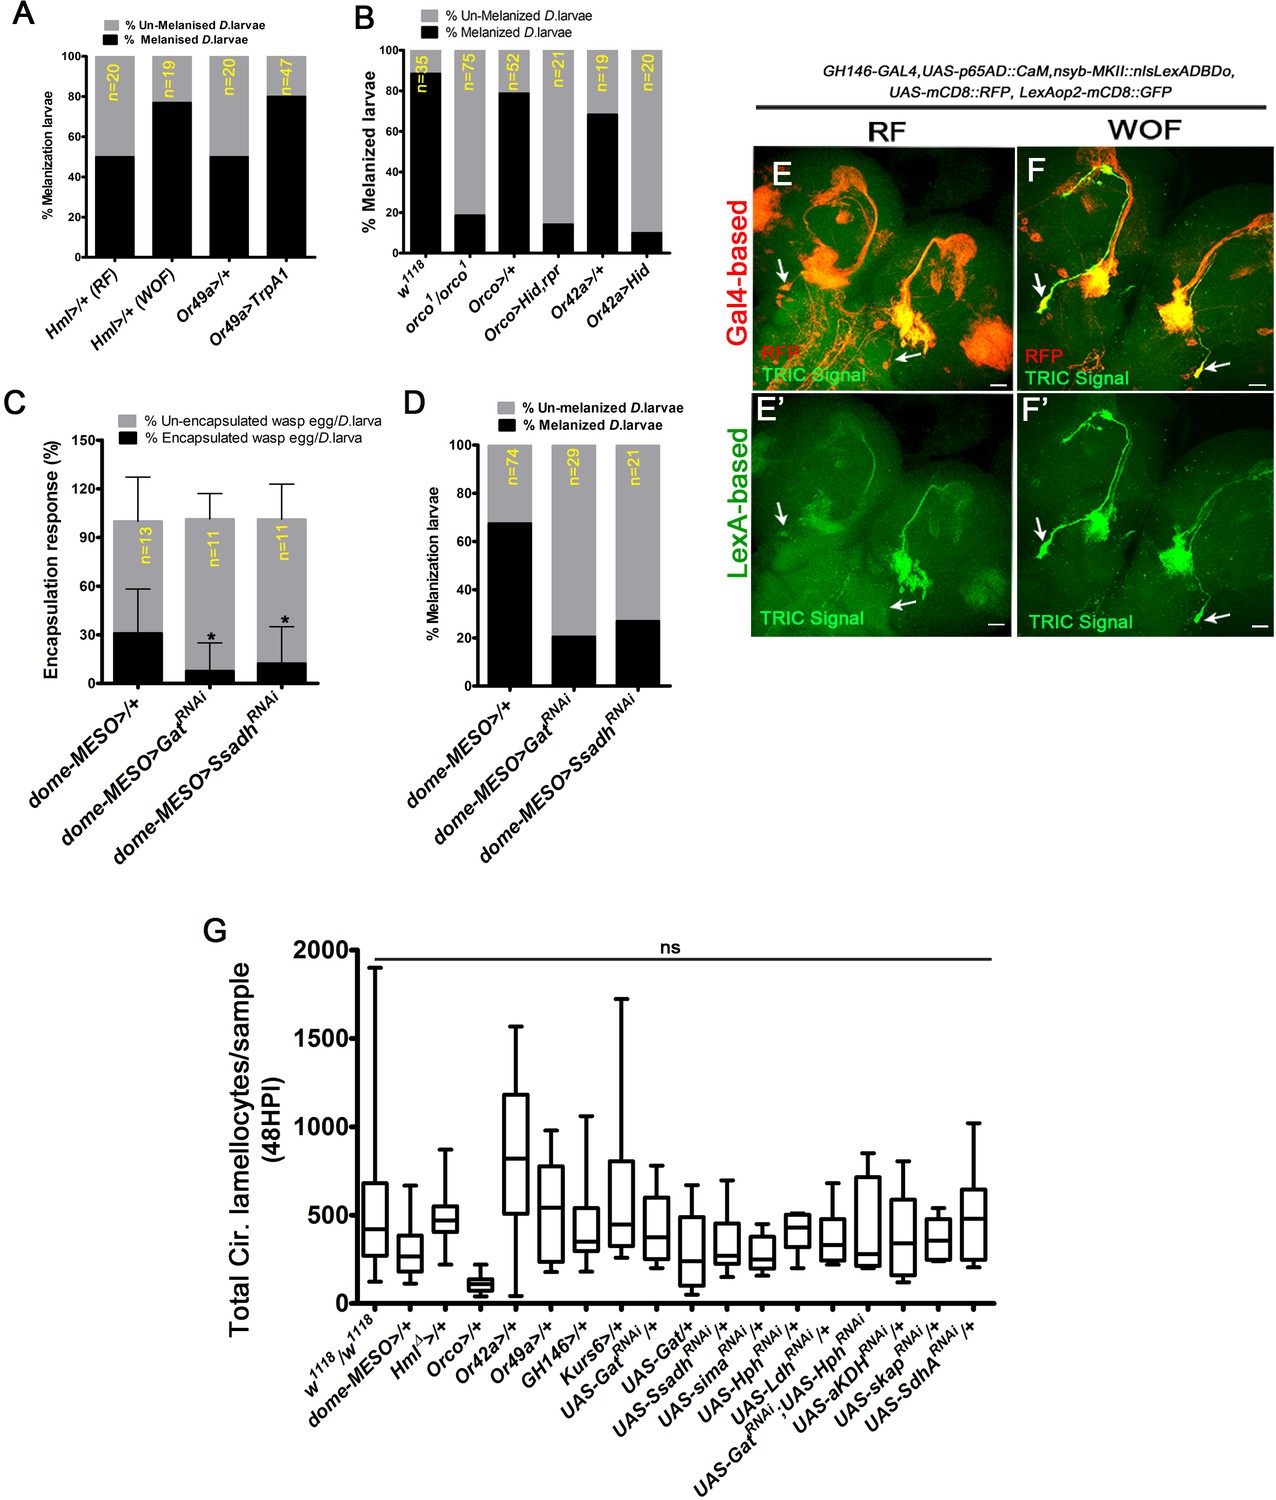
Specific activation of projection neurons (PNs) by wasp odors.
HPI indicates hours post wasp-infection. RF is regular food, WOF is wasp-odor food. In panels (E–F’) scale bar = 20 µm. In panel (C), mean ± standard deviation (mean ± SD) is shown and statistical analysis used is unpaired t-test, two-tailed. In panel (G), median in box plots is shown and vertical bars represent upper and lowest cell-counts and statistical analysis is Mann-Whitney test, two-tailed. ns is nonsignificant. (A) Quantification of percentage melanization response (% melanized larvae). Compared to control on RF (Hml△-Gal4, UAS-GFP/+, n = 20), increased melanization response (%) is seen in WOF animals (Hml△-Gal4, UAS-GFP/+, n = 19). A similar increase is also seen upon forced activation of Or49a (Or49a-Gal4; UAS-TrpA1, n = 47), when compared to its control (Or49a-Gal4/+, n = 20). (B) Quantification of percentage melanization response (% melanized larvae). orco1/orco1 (n = 75) compared to control W1118 (n = 35), Orco-Gal4; UAS-Hid, rpr (n = 21), compared to control Orco-Gal4>/+ (n = 52) and Or42a-Gal4; UAS-Hid (n = 20) compared to control Or42a-Gal4/+ (n = 20) show a reduction in melanization response. (C) Quantification of percentage encapsulation response. Compared to control (dome-MESO-Gal4, UAS-GFP/+, n = 13), decreased encapsulation response (%) is detected in dome-MESO-Gal4, UAS-GFP; UAS-GatRNAi (n = 11,*p=0.0145) and dome-MESO-Gal4, UAS-GFP; UAS-SsadhRNAi (n = 11, *p=0.049). (D) Quantification of percentage melanization response (% melanized larvae). Compared to control (dome-MESO-Gal4, UAS-GFP/+, n = 74), decreased melanization response is detected in dome-MESO-Gal4, UAS-GFP; UAS-GatRNAi, (n = 29) and dome-MESO-Gal4, UAS-GFP; UAS-SsadhRNAi (n = 21). (E–F’) Differential control of PN activity by odors. PN activity was assessed by monitoring intracellular calcium signaling using the transcriptional reporter, TRIC, GAL4-based, and LexA-based (nsyb-MKII::nlsLexADBDo, lexAop2-mCD8::GFP, UAS-p65AD::CaM, UAS-mCD8::RFP,) crossed to GH146-Gal4. (E, E’) PN neurons (marked with RFP in red) showing TRIC activity (GFP) detected in 3rd instar larval brain tissue. Compared to (E, E’) control in RF, (F, F’) WOF condition shows elevated TRIC activity in a specific subset of PN-neurons (marked by white arrows). (G) Quantifications of total circulating lamellocytes numbers in all the Gal4 lines used in this study, RNAi constructs without the Gal4 and the genetic rescue constructs. All the lines have been crossed-out to w1118 (not significant, ns in comparison to w1118).
-
Figure 5—figure supplement 2—source data 1
Contains numerical data plotted in Figure 5—figure supplement 2A,B,C,D and G.
- https://cdn.elifesciences.org/articles/60376/elife-60376-fig5-figsupp2-data1-v2.xlsx
Figure 6
Developmental control of immune-competency by environmental odors.
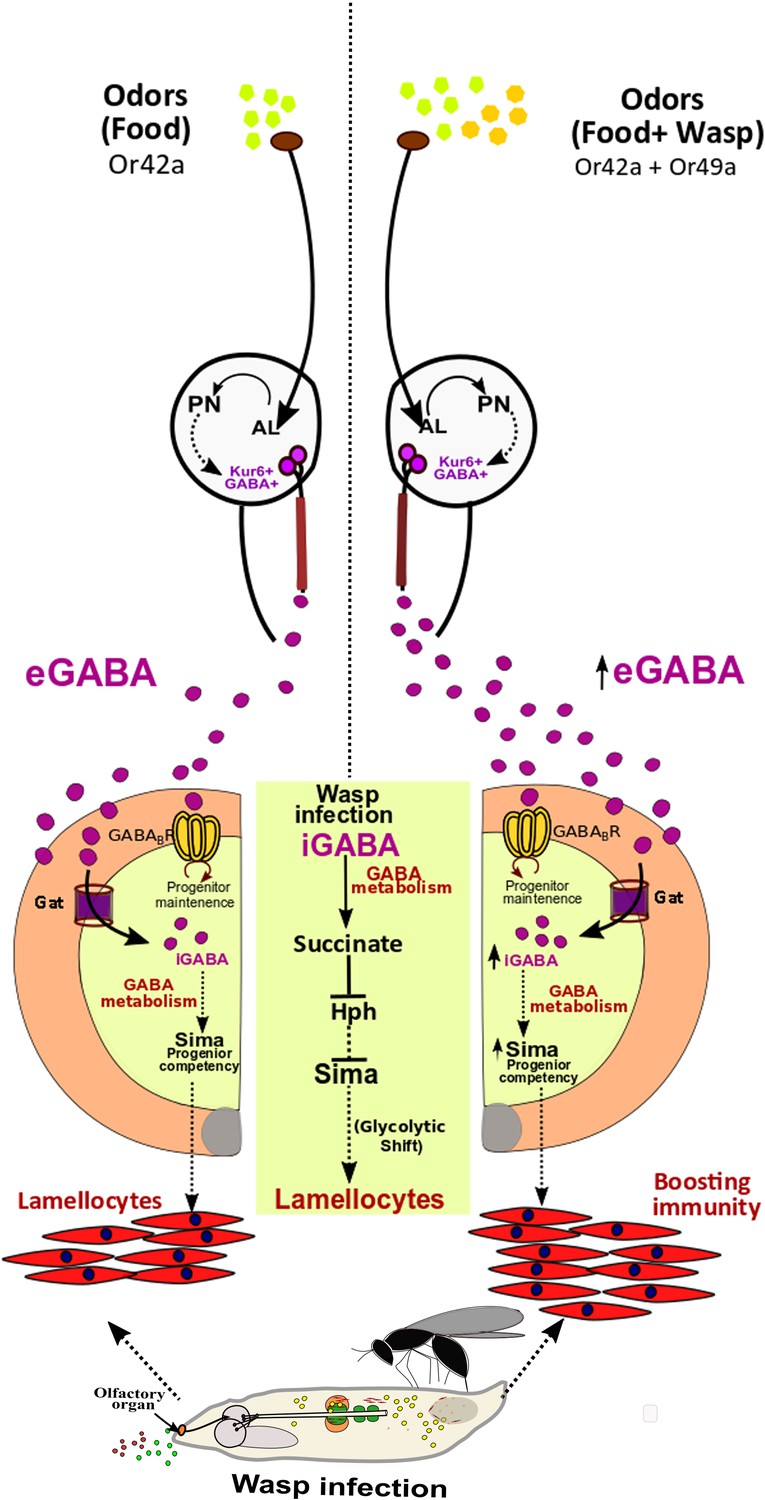
Drosophila larvae spend most of their time dwelling in food. The odors derived from this eco-system defines an integral immune-component during hematopoiesis. Sensing food odors via Or42a stimulates projection neurons (PN) leading to downstream activation of Kurs6+GABA+ neurosecretory cells, which mediate release of GABA (eGABA) into the hemolymph. eGABA is internalized by lymph gland blood-progenitor cells via GABA-transporter (Gat) and its subsequent intracellular catabolism leads to stabilization of Sima protein in them. This establishes their immune-competency to differentiate into lamellocytes. Physiologically, this sensory odor axis is co-opted to detect environmental pathogenic wasp-odors. Upon detection of wasp odors via Or49a in the preconditioned media (WOF), a combinatorial stimulation of both Or42a and Or49a, elevates neuronal GABA release, leading to increase blood cell iGABA and Sima expression. This developmentally establishes superior immune-competency to withstand the immune-challenge by parasitic wasps.
Author response image 1

Author response image 2
Author response image 3

Tables
Key resources table
| Reagent type (species) or resource | Designation | Source or reference | Identifiers | Additional information |
|---|---|---|---|---|
| Genetic reagent (D. melanogaster) | dome-MESO-Gal4, UAS-EYFP | U. Banerjee | ||
| Genetic reagent (D. melanogaster) | Tep4-Gal4, UAS-mCherry | U. Banerjee | ||
| Genetic reagent (D. melanogaster) | Hml△-Gal4, UAS-2xEGFP | S.Sinenko | ||
| Genetic reagent (D. melanogaster) | UAS-Gat | M. Freeman (Muthukumar et al., 2014), (Mazaud et al., 2019) | ||
| Genetic reagent (D. melanogaster) | UAS-Hph | C.Frei | ||
| Genetic reagent (D. melanogaster) | Kurs6-Gal4 | G. Korge | ||
| Genetic reagent (D. melanogaster) | Kurs6-Gal4; mCD8GFP | Banerjee Lab | ||
| Genetic reagent (D. melanogaster) | Orco-gal4 | Bloomington Drosophila Stock Center | BL 26818 RRID:BDSC_26818 | |
| Genetic reagent (D. melanogaster) | Or49a-Gal4 | Bloomington Drosophila Stock Center | BL 9985 RRID:BDSC_9985 | |
| Genetic reagent (D. melanogaster) | Or42a-Gal4 | Bloomington Drosophila Stock Center | BL 9969 RRID:BDSC_9969 | |
| Genetic reagent (D. melanogaster) | GH146-Gal4 | Shim et al., 2013 | ||
| Genetic reagent (D. melanogaster) | UAS-2xEGFP | Bloomington Drosophila Stock Center | BL 6658 RRID:BDSC_6658 | |
| Genetic reagent (D. melanogaster) | orco1 | Bloomington Drosophila Stock Center (Shim et al., 2013) | BL 23129 RRID:BDSC_23129 | |
| Genetic reagent (D. melanogaster) | UAS-Hid, rpr | Nambu J.R. (Wing et al., 1998) | ||
| Genetic reagent (D. melanogaster) | UAS-Hid | Bloomington Drosophila Stock Center | BL65403 RRID:BDSC_65403 | |
| Genetic reagent (D. melanogaster) | UAS-TrpA1 | Bloomington Drosophila Stock Center | BL 26263 RRID:BDSC_26263 | |
| Genetic reagent (D. melanogaster) | TRIC | Bloomington Drosophila Stock Center (Gao et al., 2015) | BL61680 RRID:BDSC_61680 | |
| Genetic reagent (D. melanogaster) | : Gad1RNAi | Bloomington Drosophila Stock Center (Shim et al., 2013) | BL 28079 RRID:BDSC_28079 | |
| Genetic reagent (D. melanogaster) | ChATRNAi | Bloomington Drosophila Stock Center (Shim et al., 2013) | BL25856 RRID:BDSC_25856 | |
| Genetic reagent (D. melanogaster) | GABABR1RNAi | Bloomington Drosophila Stock Center (Shim et al., 2013) | BL 28353 RRID:BDSC_28353 | |
| Genetic reagent (D. melanogaster) | GatRNAi | Bloomington Drosophila Stock Center (Stork et al., 2014) | BL 29422 RRID:BDSC_29422 | |
| Genetic reagent (D. melanogaster) | GatRNAi | Vienna Drosophila RNAi Center (Stork et al., 2014) | VDRC:v13359/GD FlyBase ID:FBgn0039915 | |
| Genetic reagent (D. melanogaster) | SsadhRNAi | Vienna Drosophila RNAi Center | VDRC:v106637/KK FlyBase ID:FBgn0039349 | |
| Genetic reagent (D. melanogaster) | SsadhRNAi | Bloomington Drosophila Stock Center | BL55683 RRID:BDSC_55683 | |
| Genetic reagent (D. melanogaster) | SsadhRNAi | Vienna Drosophila RNAi Center | VDRC: v14751/GD FlyBase ID:FBgn0039349 | |
| Genetic reagent (D. melanogaster) | CG3379RNAi (aKDH) | Bloomington Drosophila Stock Center | BL 34101 RRID:BDSC_34101 | |
| Genetic reagent (D. melanogaster) | skapRNAi | Bloomington Drosophila Stock Center | BL 55168 RRID:BDSC_55168 | |
| Genetic reagent (D. melanogaster) | SdhARNAi | Vienna Drosophila RNAi Center | VDRC:v330053 FlyBase ID:FBgn0261439 | |
| Genetic reagent (D. melanogaster) | simaRNAi | Bloomington Drosophila Stock Center (Wang et al., 2016) | BL33894 RRID:BDSC_33894 HMS00832 | |
| Genetic reagent (D. melanogaster) | HphRNAi | Vienna Drosophila RNAi Center (Mukherjee et al., 2011) | VDRC:v103382/KK FlyBaseID:FBgn0264785 | |
| Genetic reagent (D. melanogaster) | LdhRNAi | Bloomington Drosophila Stock Center (Li et al., 2017) | BL33640 RRID:BDSC_33640 | |
| Antibody | Anti-P1 (Mouse) | I. Ando | IF(1:100) | |
| Antibody | Anti-Pxn (Rabbit) | J. Shim | IF(1:2000) | |
| Antibody | Anti-PPO (Rabbit) | H. Müller | IF(1:1000) | |
| Antibody | Anti-Hnt (Mouse) | Developmen tal Studies Hybridoma Bank | DSHB Cat# 1g9, RRID:AB_528278 | IF(1:100) |
| Antibody | Anti-Mys (Mouse) | CF.6G11; Developmen tal Studies Hybridoma Bank | Cat#CF6G11 RRID:AB_528310 | IF(1:100) |
| Antibody | Anti-GABA (Rabbit) | Sigma-Aldrich | Cat# A2052 | IF(1:100) |
| Antibody | Anti-Sima (Guinea pig) | U. Banerjee | IF(1:100) | |
| Antibody | Anti-Gat (Rabbit) | M. Freeman (Muthukumar et al., 2014) | IF(1:5000) | |
| Antibody | Anti-pCaMKII (Rabbit) | Cell Signaling (Shim et al., 2013) | Cat# 3361 | IF(1:100) |
| Antibody | Anti-wingless (Mouse) | Developmen tal Studies Hybridoma Bank | Cat#4D4 RRID:AB_528512 | IF(1:10) |
| Antibody | Anti-Ci (Rat) | Developmen tal Studies Hybridoma Bank | Cat#2A1 RRID:AB_2109711 | IF(1:5) |
| Antibody | Anti-Antp | Developmen tal Studies Hybridoma Bank | Cat#8C11 RRID:AB_528083 | IF(1:100) |
| Phalloidin | Sigma-Aldrich | Cat# 94072 | 1:100 |
Additional files
-
Supplementary file 1
Table representing total lamellocytes counts in lymph gland tissues from uninfected wandering 3rd instar larvae.
- https://cdn.elifesciences.org/articles/60376/elife-60376-supp1-v2.docx
-
Supplementary file 2
Table representing blood cell counts and lamellocytes count (per mm2) in circulation from uninfected wandering 3rd instar larvae.
- https://cdn.elifesciences.org/articles/60376/elife-60376-supp2-v2.docx
-
Supplementary file 3
Table representing lymph gland area quantifications.
- https://cdn.elifesciences.org/articles/60376/elife-60376-supp3-v2.docx
-
Supplementary file 4
Table representing hemolymph GABA measurements.
- https://cdn.elifesciences.org/articles/60376/elife-60376-supp4-v2.docx
-
Supplementary file 5
Table representing crystal cell counts in lymph gland.
- https://cdn.elifesciences.org/articles/60376/elife-60376-supp5-v2.docx
-
Transparent reporting form
- https://cdn.elifesciences.org/articles/60376/elife-60376-transrepform-v2.docx
Download links
A two-part list of links to download the article, or parts of the article, in various formats.
Downloads (link to download the article as PDF)
Open citations (links to open the citations from this article in various online reference manager services)
Cite this article (links to download the citations from this article in formats compatible with various reference manager tools)
Metabolic control of cellular immune-competency by odors in Drosophila
eLife 9:e60376.
https://doi.org/10.7554/eLife.60376


