Condensation tendency and planar isotropic actin gradient induce radial alignment in confined monolayers
- Department of Mechanical and Industrial Engineering, University of Massachusetts, United States
- Department of Mathematical Sciences, Worcester Polytechnic Institute, United States
- Department of Biomedical Engineering, University of Massachusetts, United States
- Department of Chemical Engineering, University of Massachusetts, United States
Figures
Figure 1 with 6 supplements
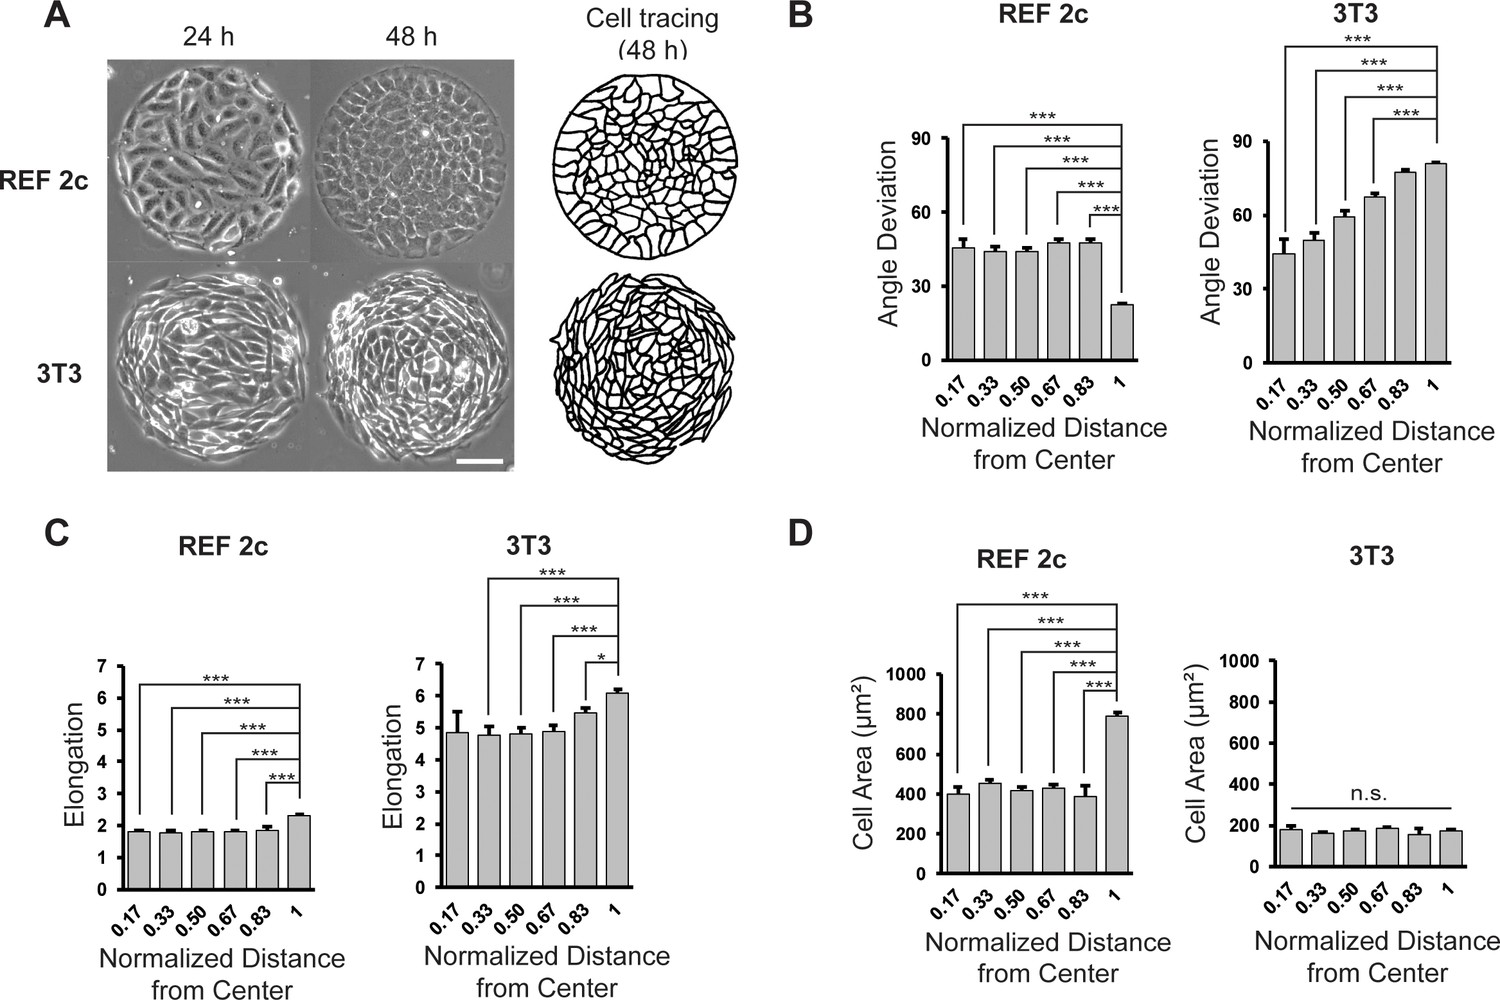
REF 2c cells align radially on circular mesoscale patterns.
(A) Phase images showing REF 2c and 3T3 cells cultured on patterns for 24 and 48 hr. Scale bar: 100 µm. Cell tracing showed the cell boundaries at 48 hr. (B) REF 2c and 3T3 cell angle deviation at 48 hr as a function of normalized distance from the center of the pattern. n = 16 patterns. (C) REF 2c and 3T3 cell elongation at 48 hr as a function of the normalized distance from the center of the pattern. n = 16 patterns. (D) REF 2c and 3T3 cell area at 48 hr as a function of normalized distance from the center of the pattern. Cell area is defined as the area of the ellipse-fitted cells. n = 16 patterns. Data are represented as mean ± s.e.m. *, p < 0.05; ***, p < 0.001; n.s., p > 0.05.
Figure 1—figure supplement 1
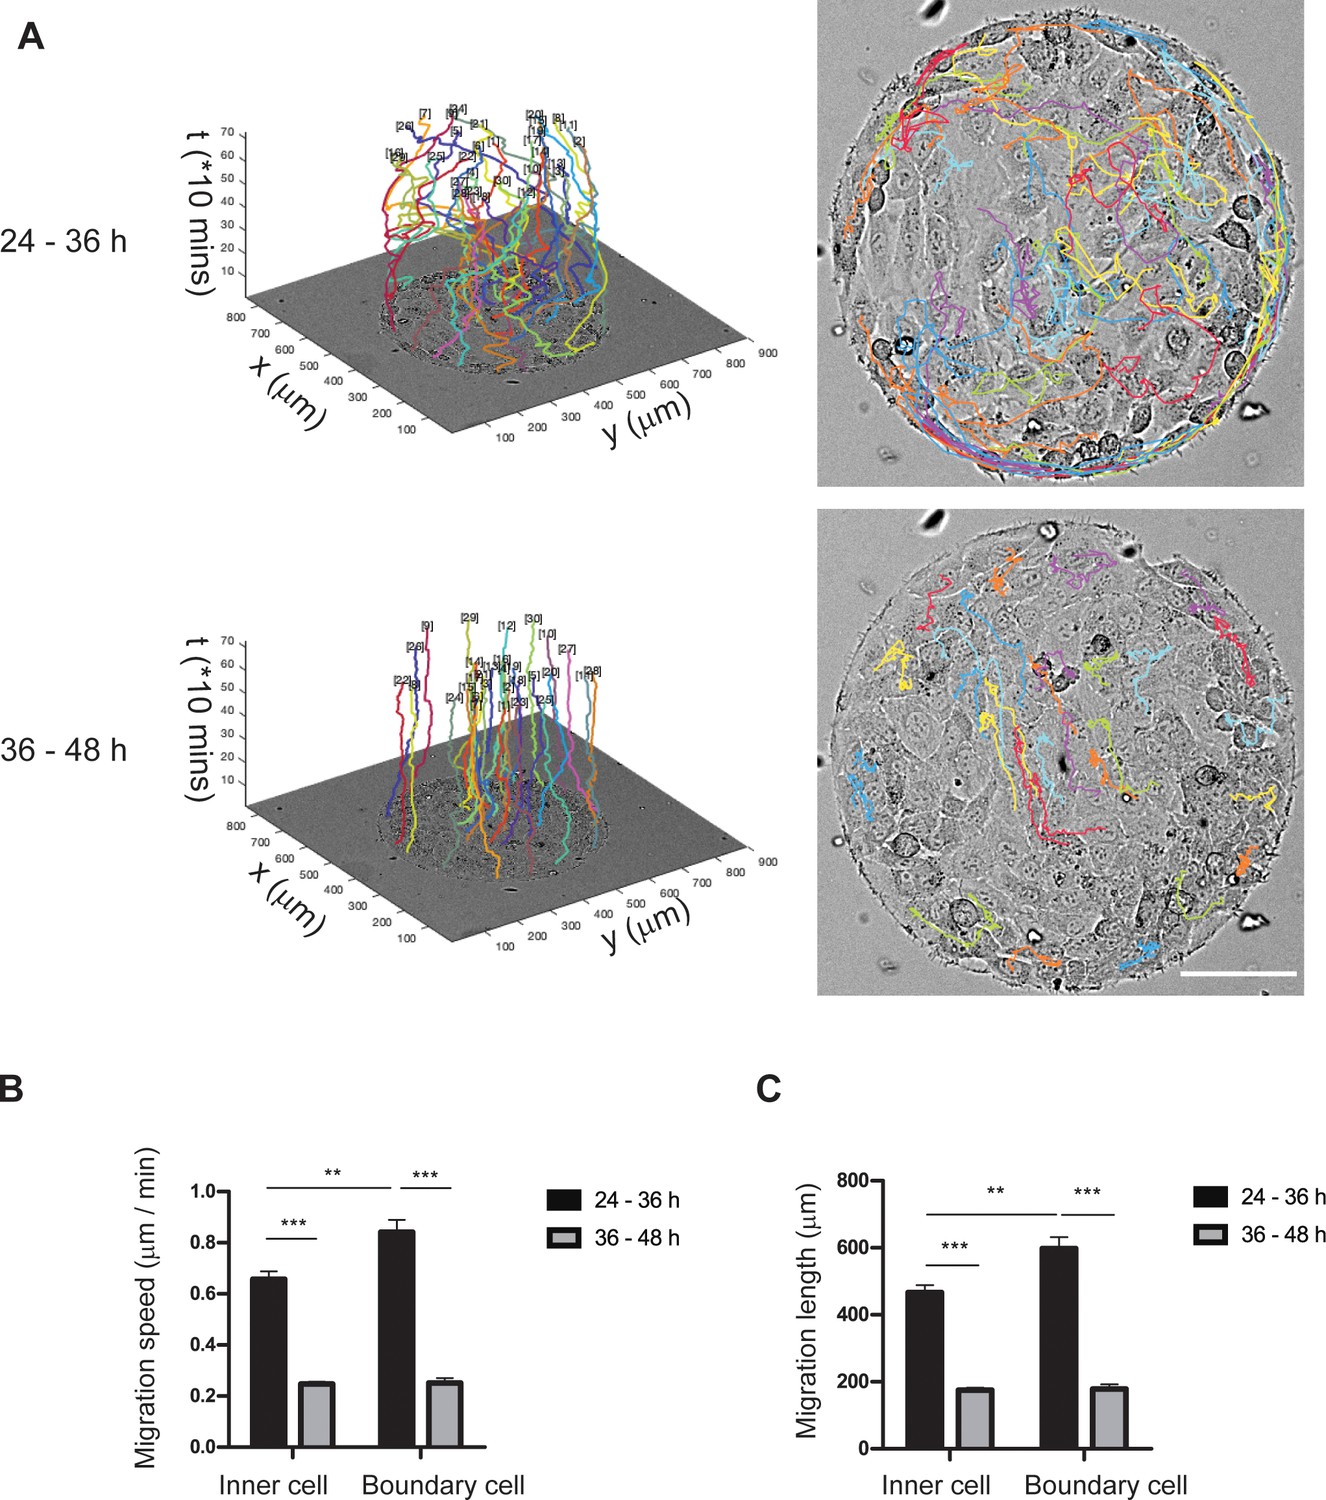
Migration of REF 2c cells drastically decreased 36 hr after cell seeding.
(A) The 3D and 2D migration trajectories of REF 2c cells over 24–36 hr (n = 42) and 36–48 hr (n = 30) after seeding. Scale bar, 100 μm. (B-C) Migration speed (B) and migration length (C) of inner and boundary cells over 24–36 hr (inner cell, n = 21; boundary cell, n = 21) and 36–48 hr (inner cell, n = 15; boundary cell, n = 15) after seeding. Data are presented as mean ± s.e.m. **, p < 0.01; ***, p < 0.001.
Figure 1—figure supplement 2
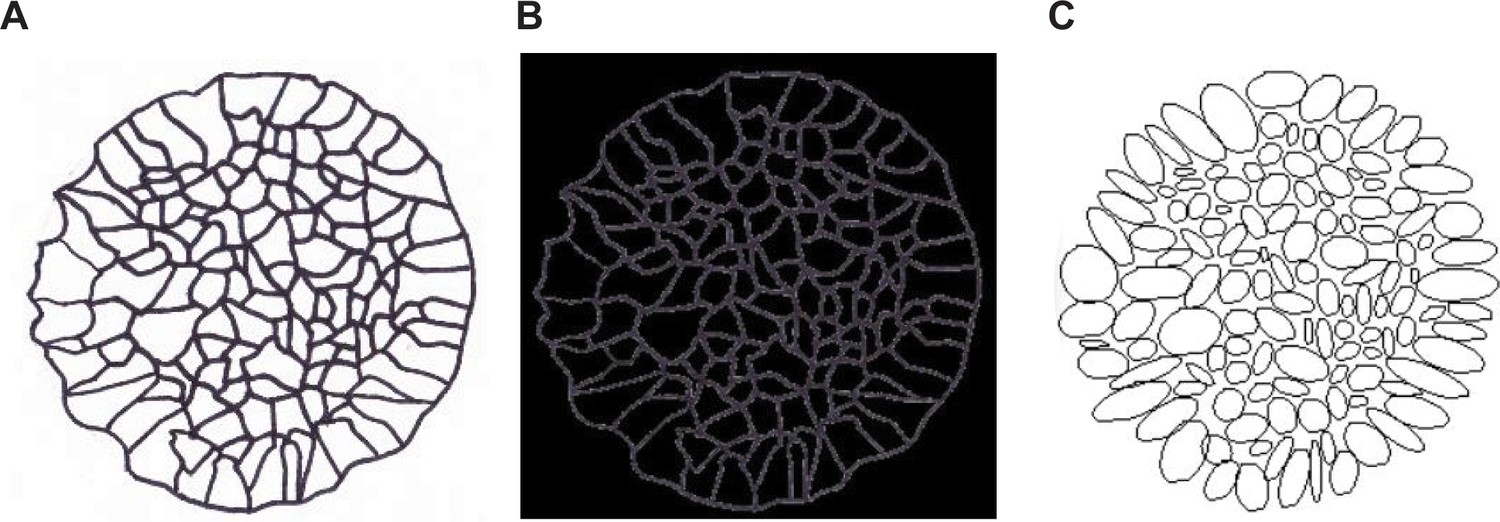
Image analysis method for the quantification of angle deviation, cell elongation, and cell area.
(A) Each cell from the phase contract images was hand-traced to produce a clear outline. (B) Tracing was imported into ImageJ and thresholded to create a black background with white cell outlines. (C) Ellipses were created using the ‘analyze particles’ tool. Location of pattern centroid was also measured using the circle fit tool. Ellipse attributes (centroid, angle, axes lengths, area) combined with the pattern centroid were used to find cell angle deviation from the radial direction, cell area, and cell elongation as a function of distance from the center of the pattern.
Figure 1—figure supplement 3
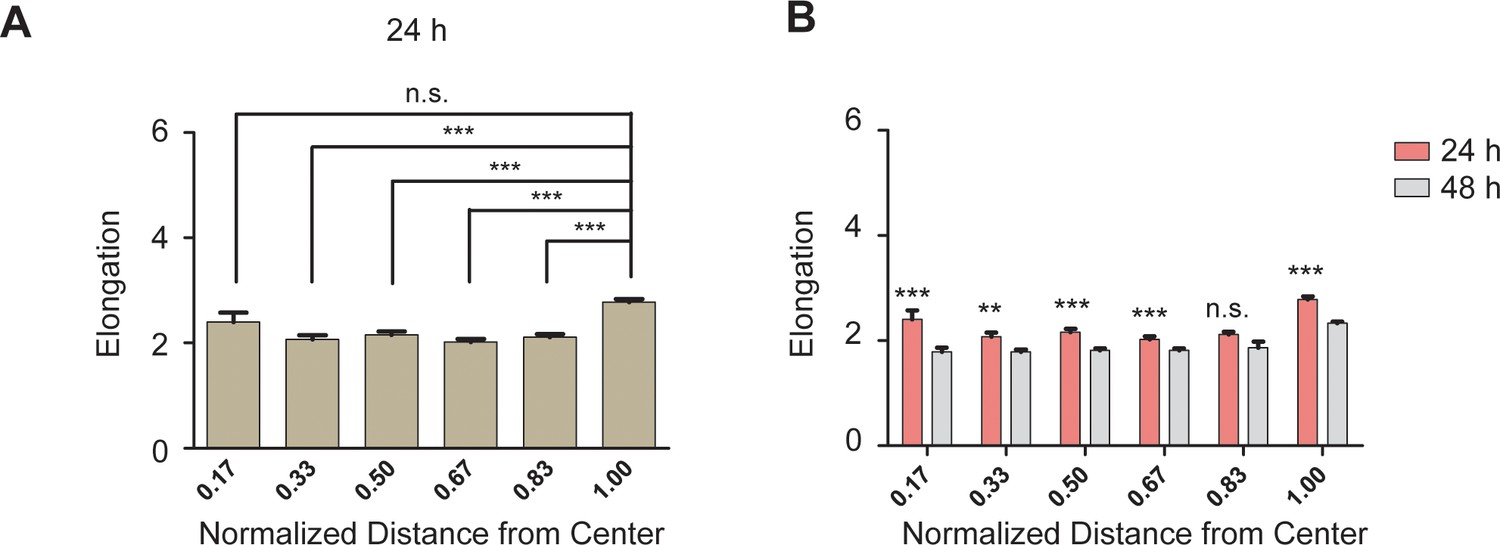
REF 2c cells became more compact at 48 hr compared with 24 hr.
(A) Bar plot showing the elongation of REF 2c cells cultured on patterns for 24 hr as a function of normalized distance from the center of the pattern. n = 15 patterns. (B) Bar plot showing statistical comparison of the elongation between 24 hr and 48 hr. Data are represented as mean ± s.e.m. **, p < 0.01; ***, p < 0.001; n.s., p > 0.05.
Figure 1—figure supplement 4
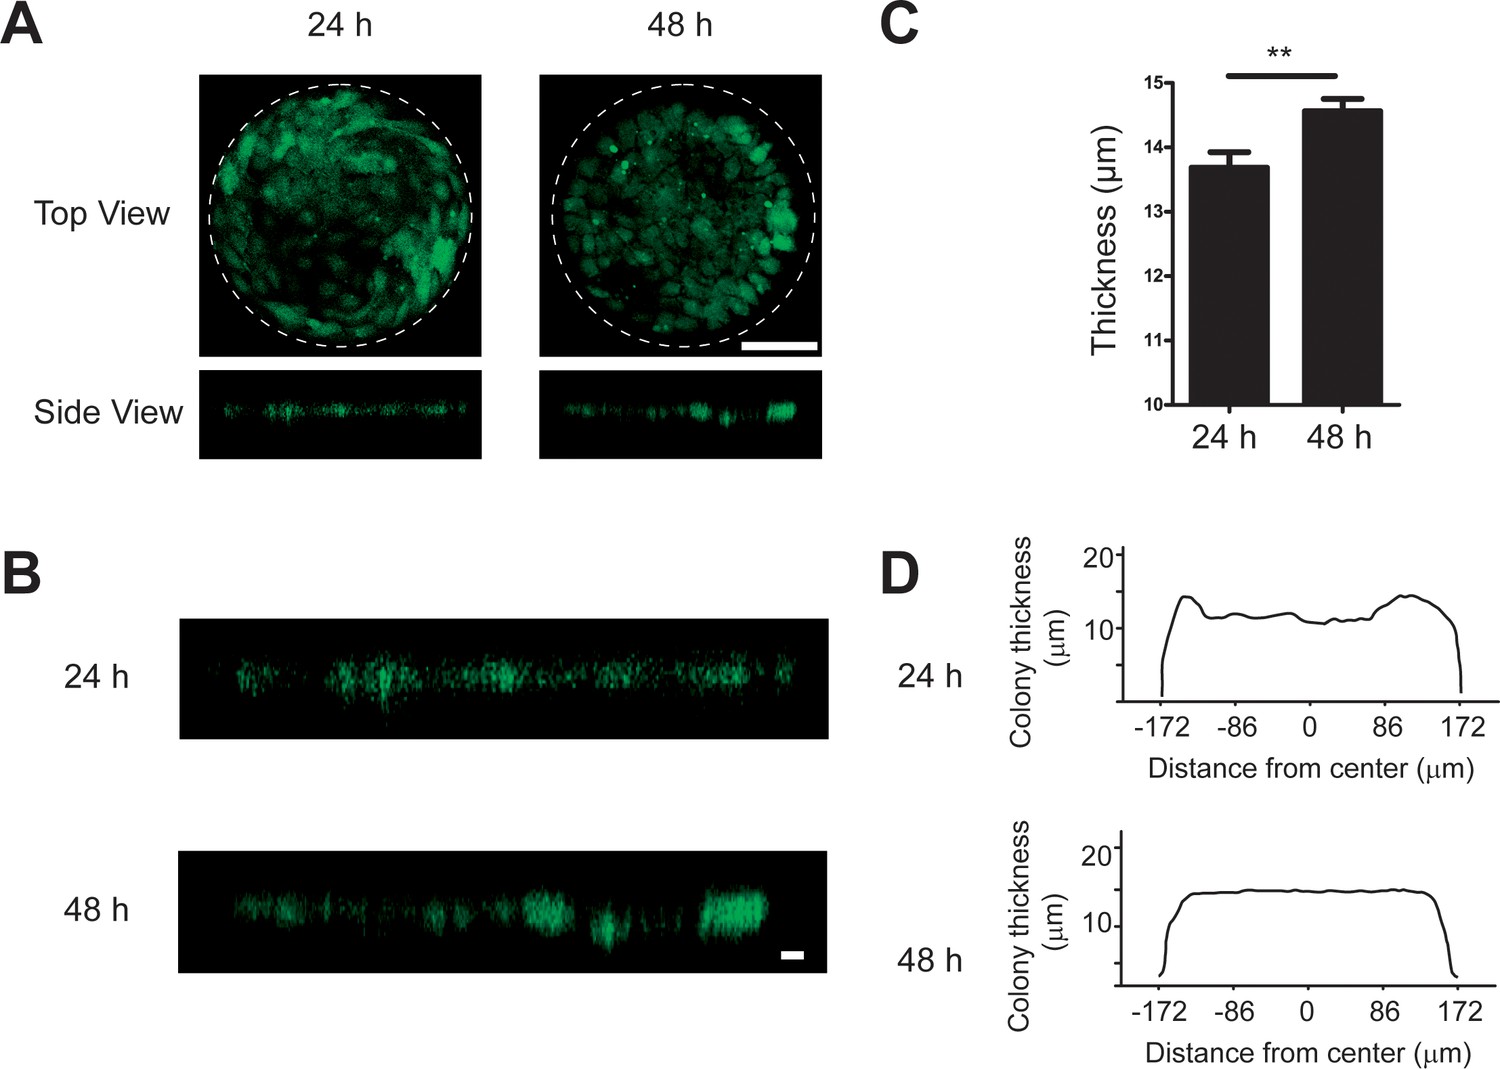
The thickness of micropatterned REF 2c colony increased from 24 hr to 48 hr.
(A) The top view and side view of REF 2c labeled with CellTracker-Green dye at 24 hr and 48 hr. Scale bar, 100 μm. (B) Zoomed side view of REF 2c labeled with CellTracker-Green dye at 24 hr and 48 hr. Scale bar, 10 μm. (C) Bar plot showing the tissue thickness at 24 hr (n = 12) and 48 hr (n = 12). **, p < 0.01. (D) Plot showing the mean thickness across the REF colony at 24 hr (n = 12) and 48 hr (n = 12).
Figure 1—figure supplement 5
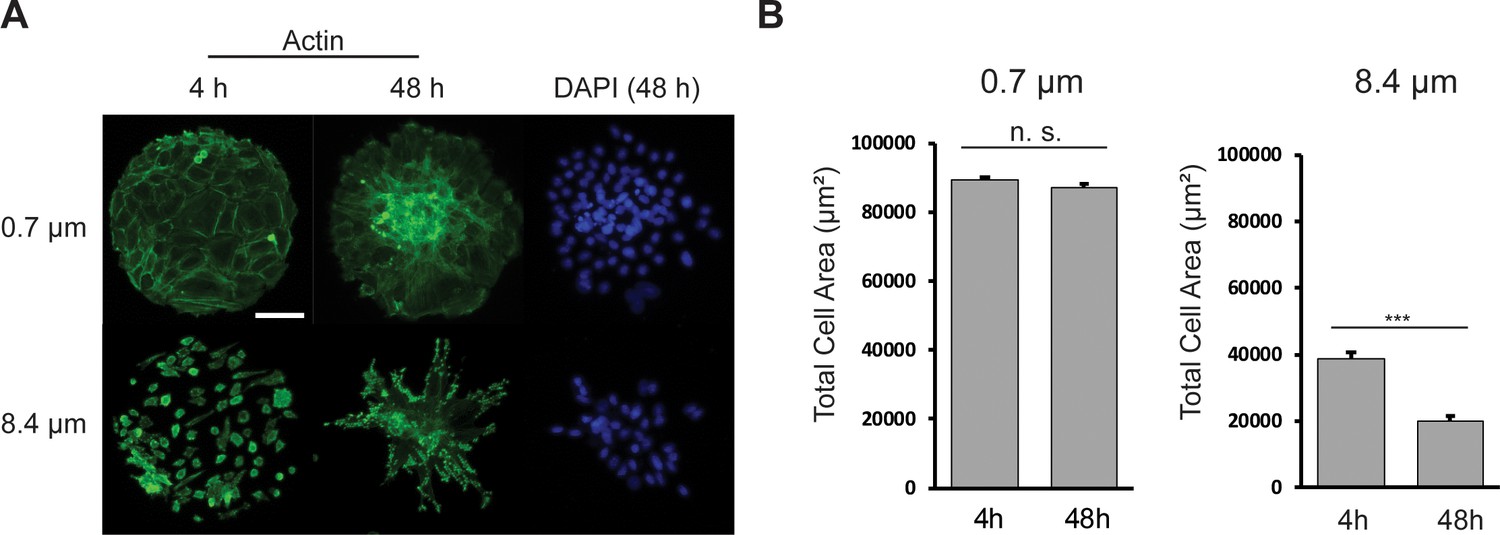
REF 2c cells condense on soft substrates.
(A) Representative actin (green) and DAPI (blue) images of REF 2c on PMA substrates with different post heights. Cells were fixed and imaged at 4 hr and 48 hr, respectively. Scale bar: 100 μm. (B) Total cell area on each micropattern as functions of time and substrate stiffness. n = 20 patterns for each condition. Data are presented as mean ± s.e.m. ***, p < 0.001; n.s., p > 0.05.
Figure 1—video 1
A time-lapsed recording of the REF 2c cells migrating on a circular pattern from 24 hr to 48 hr after cell seeding.
Figure 2 with 4 supplements
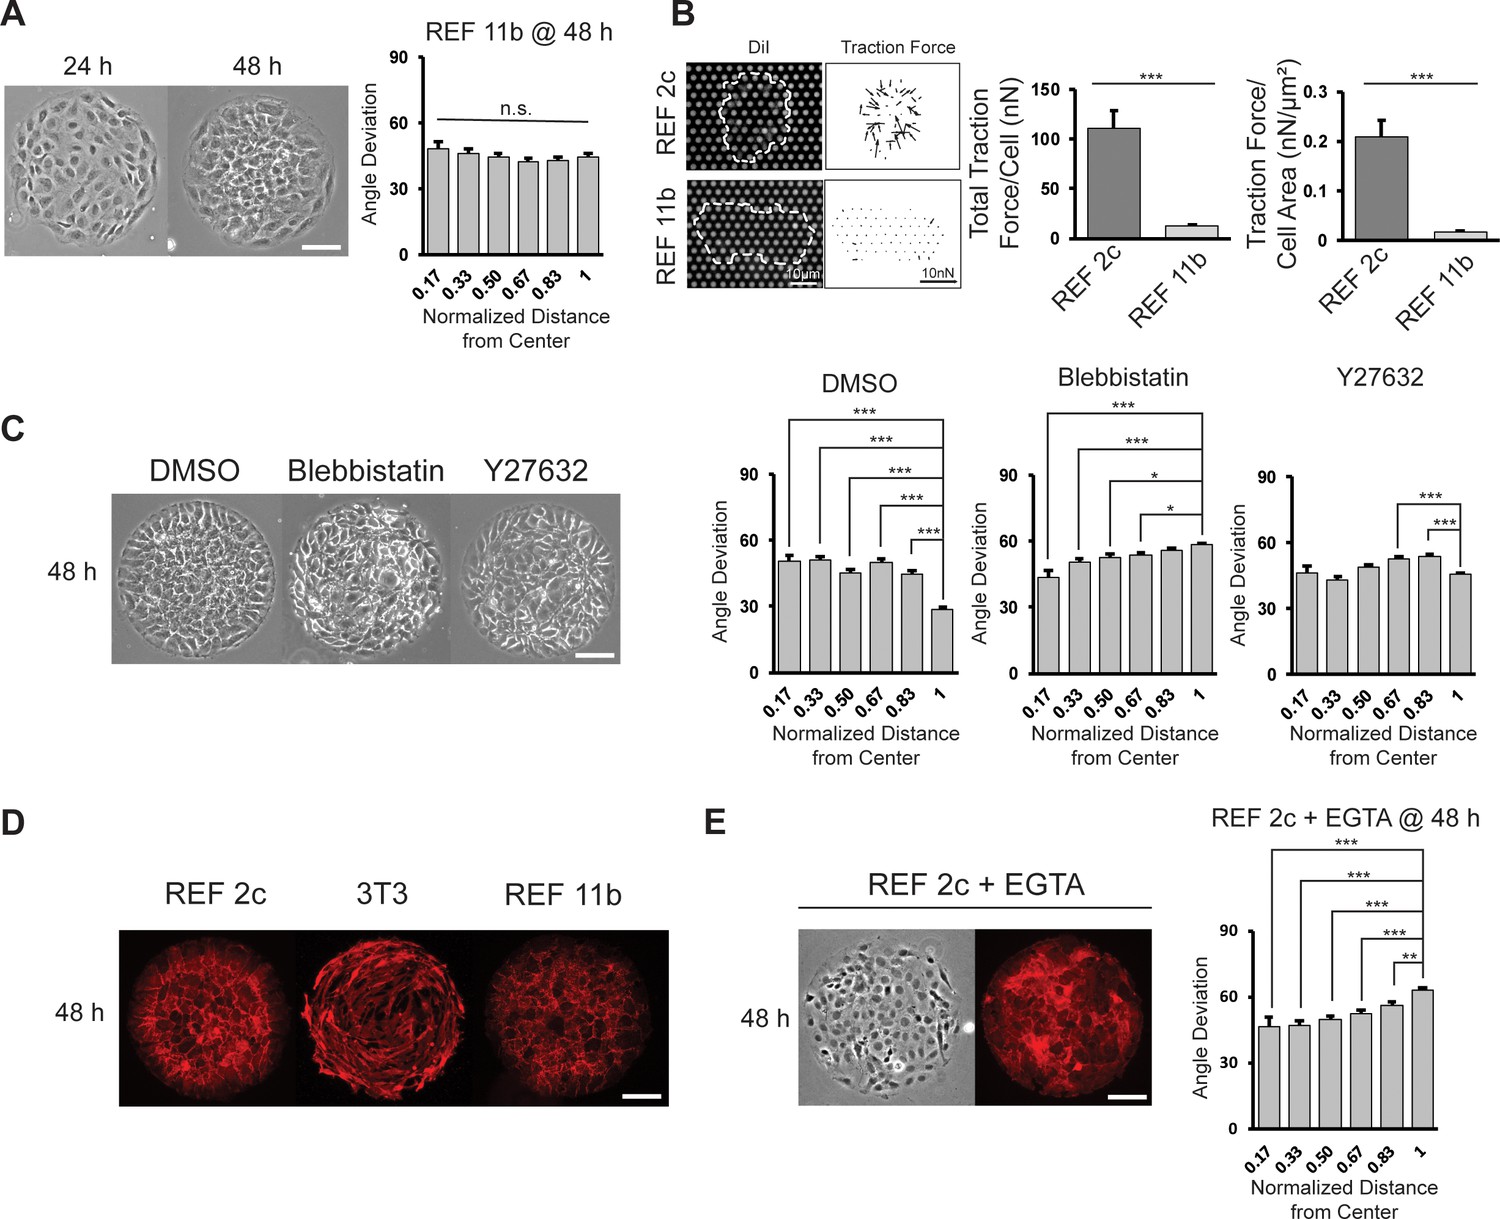
Effect of cell contractility and cell-cell adhesion on cell alignment.
(A) Phase images of REF 11b at 24 hr and 48 hr after cell seeding. Average cell angle deviation is quantified with respect to distance from the center of the pattern. n = 16 patterns. Scale bar: 100 μm. (B) Representative images showing single REF cells cultured on PMA substrates and vector map of deduced traction forces. Plots show the total traction force per cell and traction force per cell area of individual REF 2c and 11b cells. n = 15 cells per subclone. (C) Phase images of REF 2c treated with DMSO, Blebbistatin, and Y27632 at 48 hr. Average cell angle deviation is quantified with respect to distance from the center of the pattern. n = 16 patterns per group. Scale bar: 100 μm. (D) Immunofluorescence images showing the expression of β-catenin in REF 2c, 3T3, and REF 11b cells at 48 hr. Scale bar: 100 μm. (E) Phase and fluorescence images showing cell orientation and β-catenin expression in EGTA treated REF 2c cells at 48 hr. Average cell angle deviation is quantified with respect to distance from the center of the pattern. Scale bar: 100 μm. Data are represented as mean ± s.e.m. *, p < 0.05; **, p < 0.01; ***, p < 0.001; n.s., p > 0.05.
Figure 2—figure supplement 1
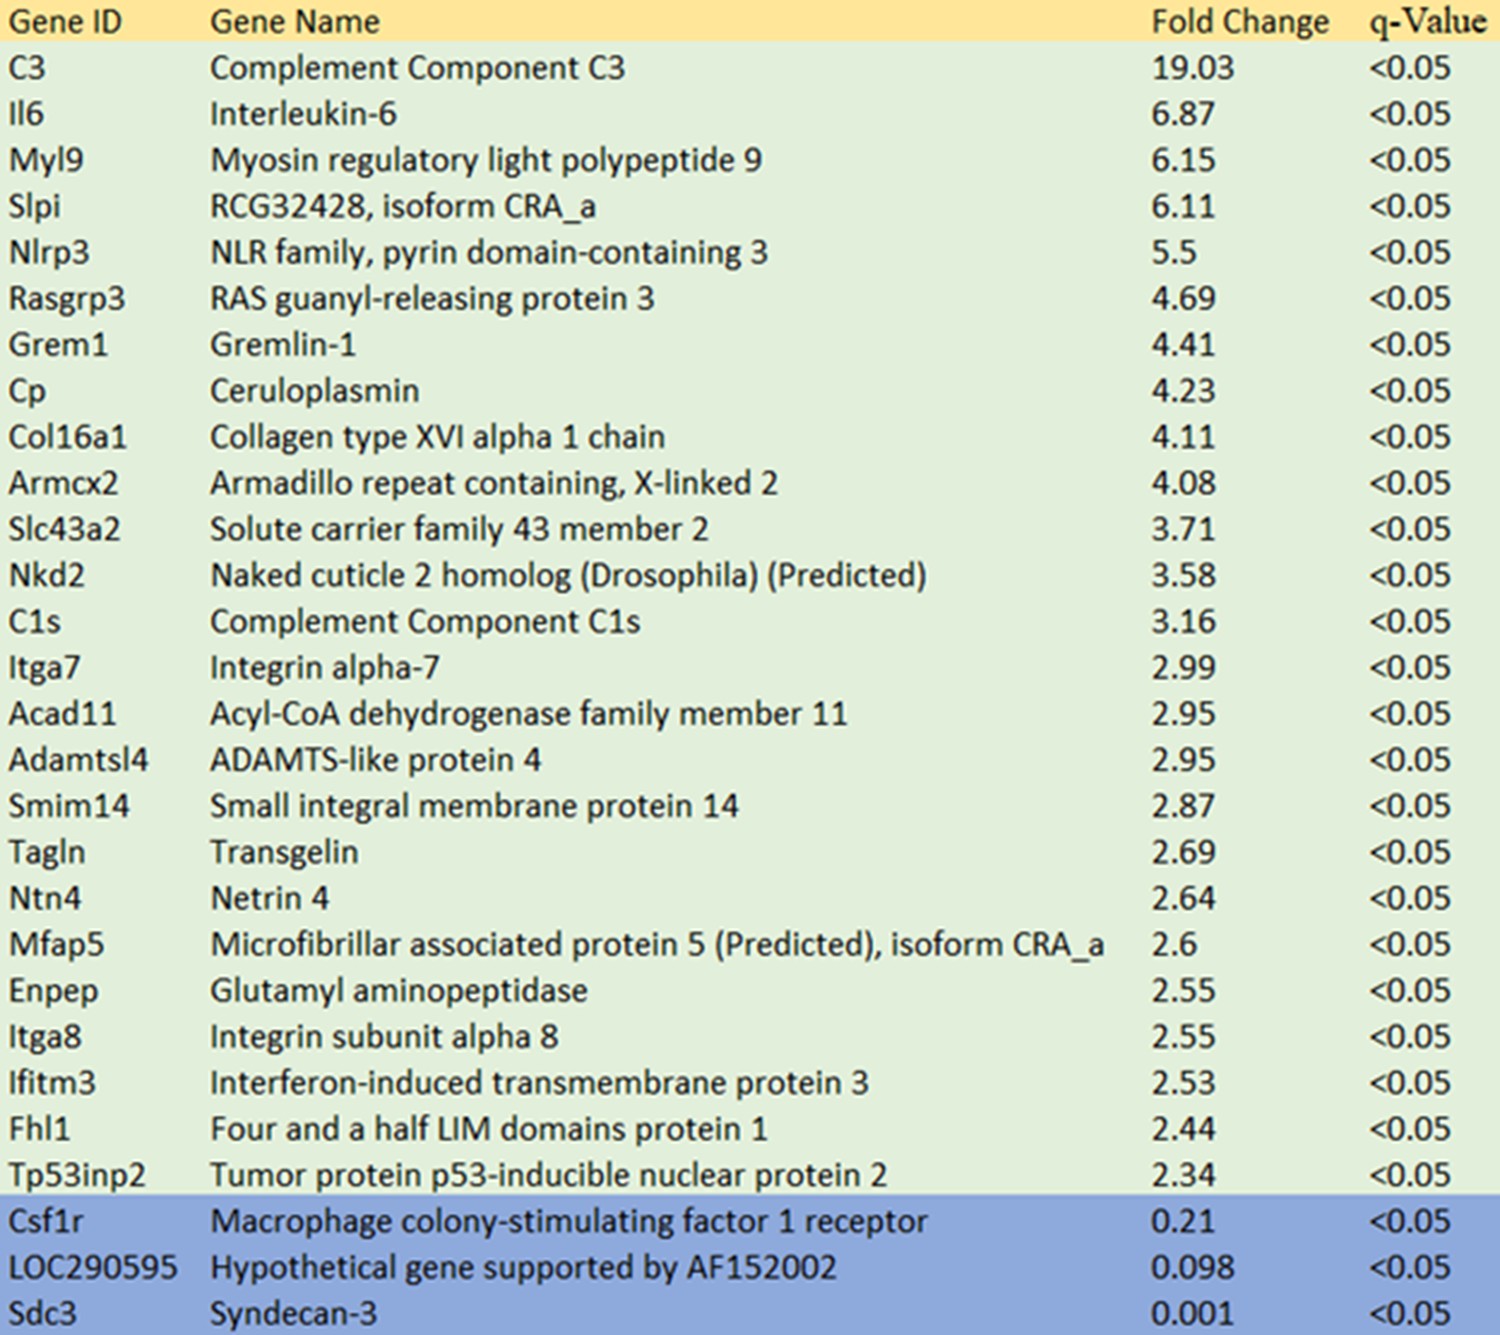
Summary of gene expression differences in REF 11b compared to REF 2c.
Figure 2—figure supplement 2
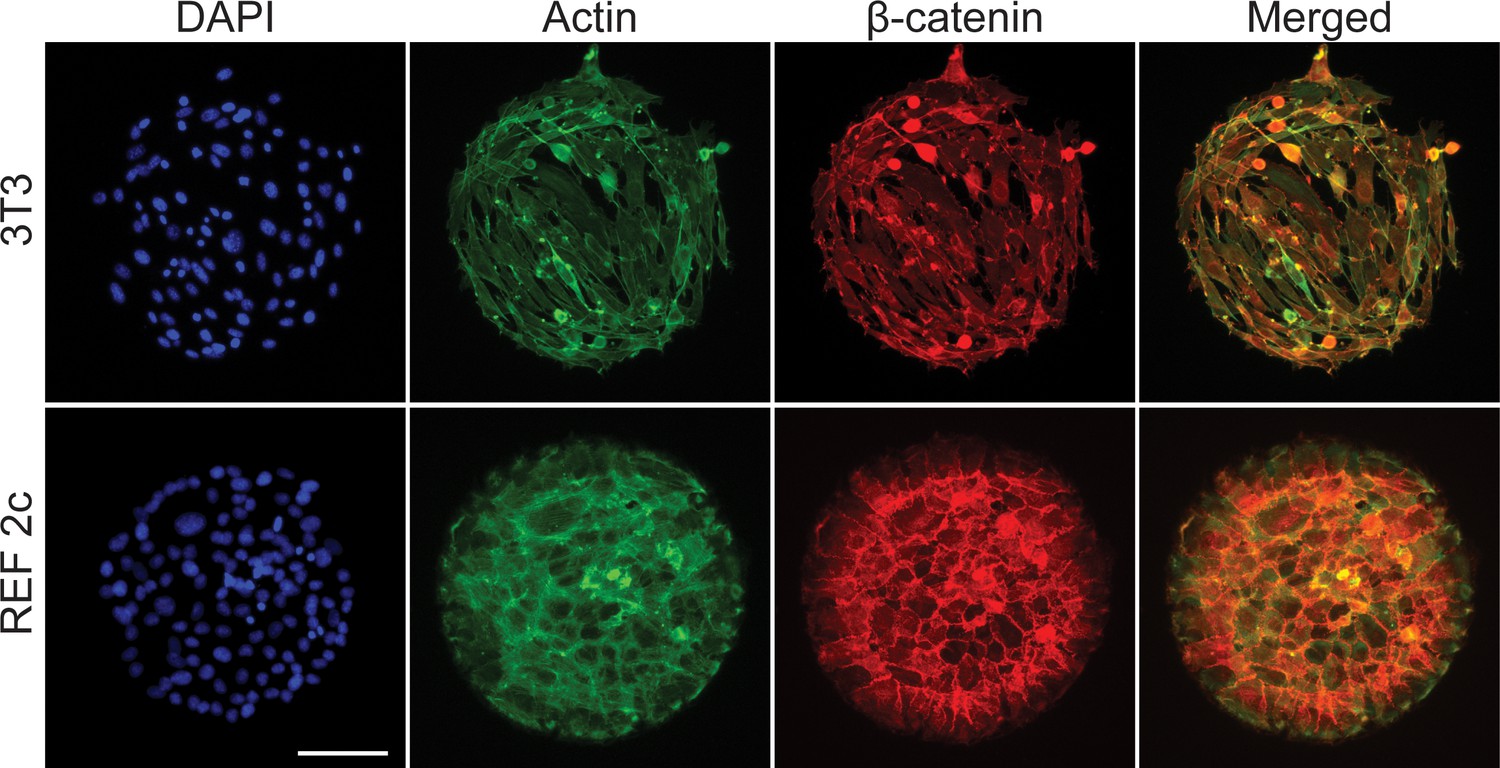
The cell morphology and distribution of β-catenin and actin are distinct between patterned 3T3 and REF 2c cells.
Representative fluorescence images showing cell nuclei, Actin, β-catenin, and merged actin and β-catenin. Scale bar: 100 μm.
Figure 2—figure supplement 3
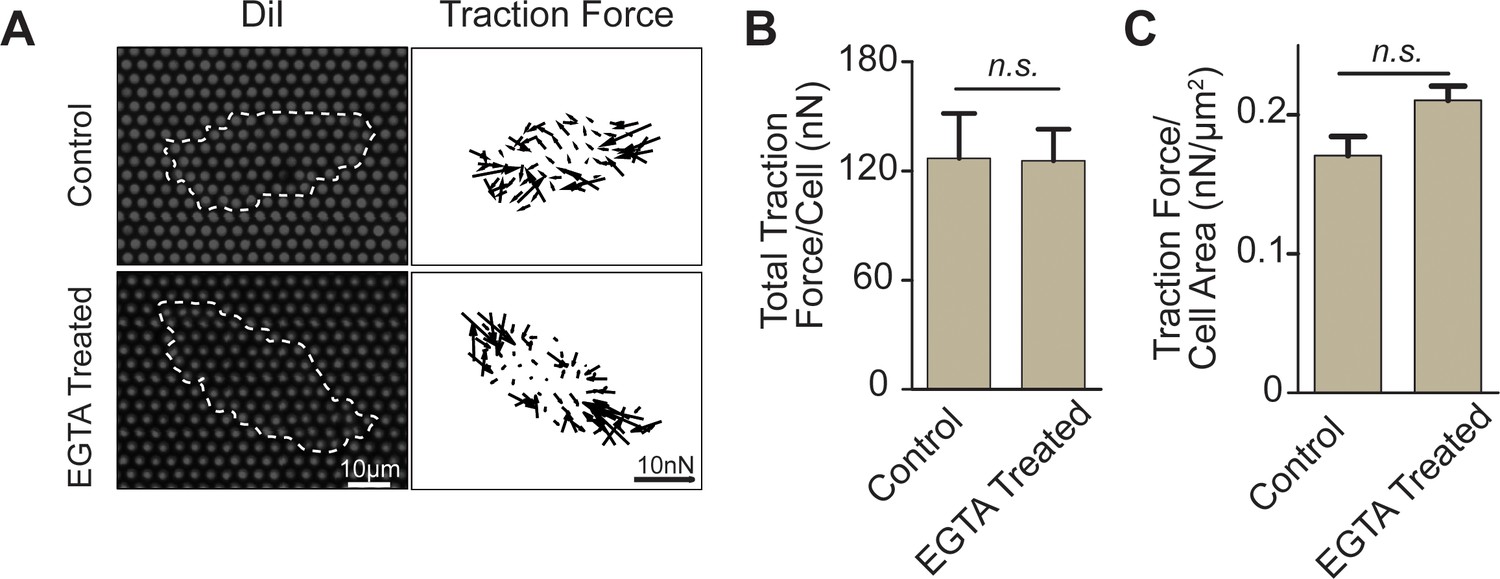
EGTA treatment did not interfere cell-matrix interactions.
(A) Fluorescence images and vector maps showing the traction forces of single REF 2c cells cultured on PMA substrates and treated with vehicle control or EGTA. (B-C) Bar plots showing the total traction force per cell (B) or total traction force per cell area (C) for control and EGTA treated cells. At least 15 cells were analyzed per condition. Data are presented as mean ± s.e.m. n.s., p > 0.05.
Figure 2—figure supplement 4
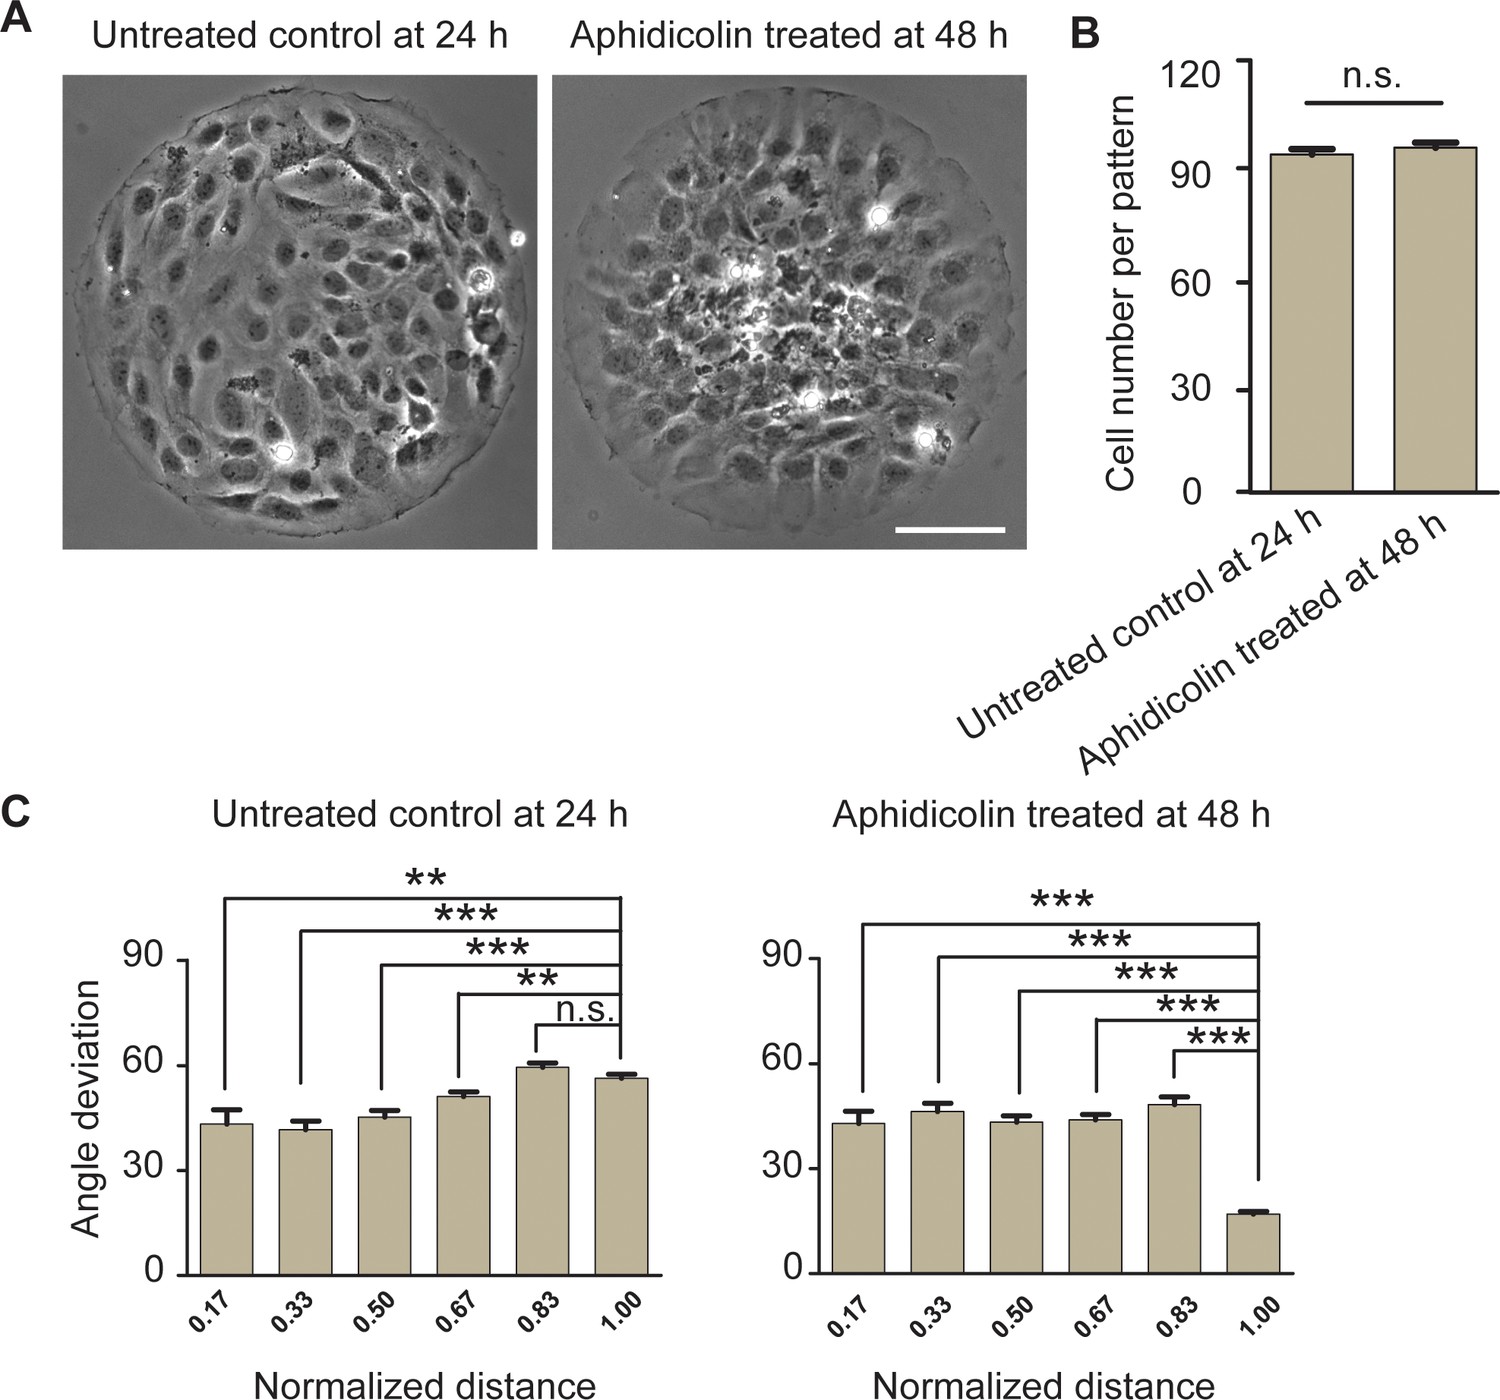
Inhibiting cell proliferation does not change radial alignment of REF 2c cells.
(A) Phase images showing untreated cells at 24 hr and aphidicolin treated cells at 48 hr on patterned surfaces. Scale bar: 100 μm. (B) Bar plots showing cell numbers per pattern for untreated cells at 24 hr and aphidicolin-treated cells at 48 hr. (C) Angle deviation of cells as a function of distance from the center of the pattern for untreated control and aphidicolin-treated cells. Data are presented as mean ± s.e.m. **, p < 0.01, ***, p < 0.001; n.s., p > 0.05.
Figure 3 with 4 supplements
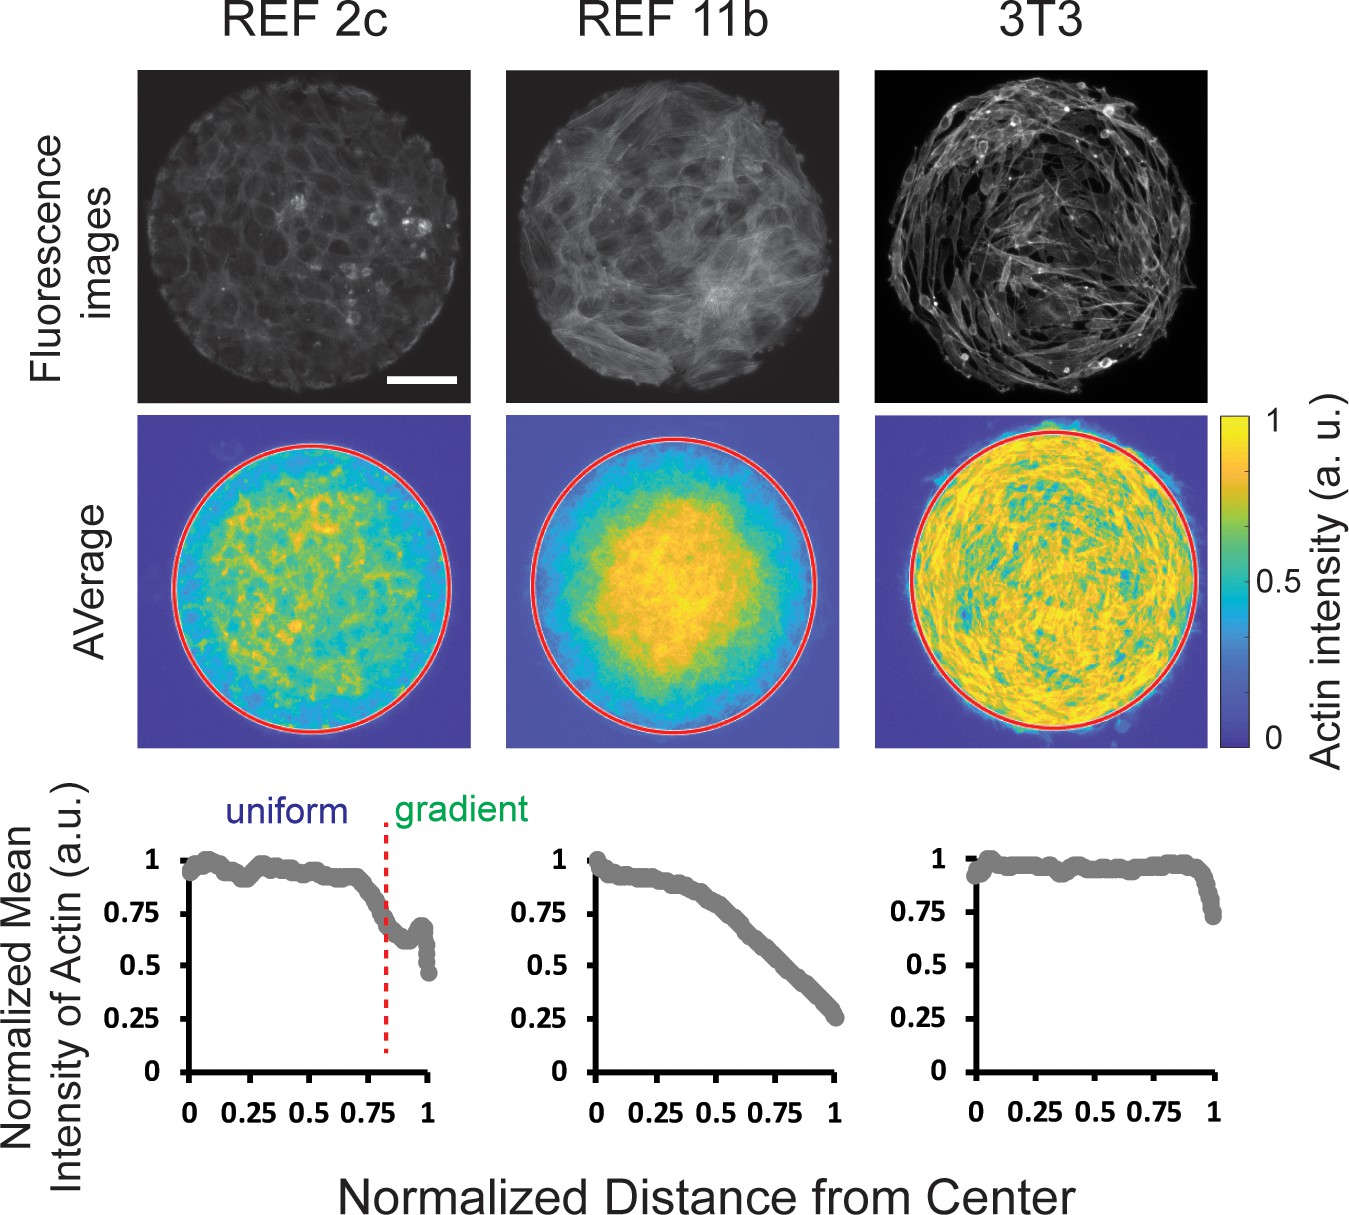
Tissue-scale actin intensity gradients were observed in patterned REF cells but not in 3T3 cells.
Top: fluorescence images showing the actin staining of REF 2c, REF 11b, and 3T3 cells. Scale bar: 100 μm. Middle: colorimetric maps showing the average actin intensity profiles obtained by overlapping actin staining images. n = 20 patterns per group. Bottom: normalized mean intensity of these overlapping images plotted as a function of the normalized distance from the center of the pattern.
Figure 3—figure supplement 1
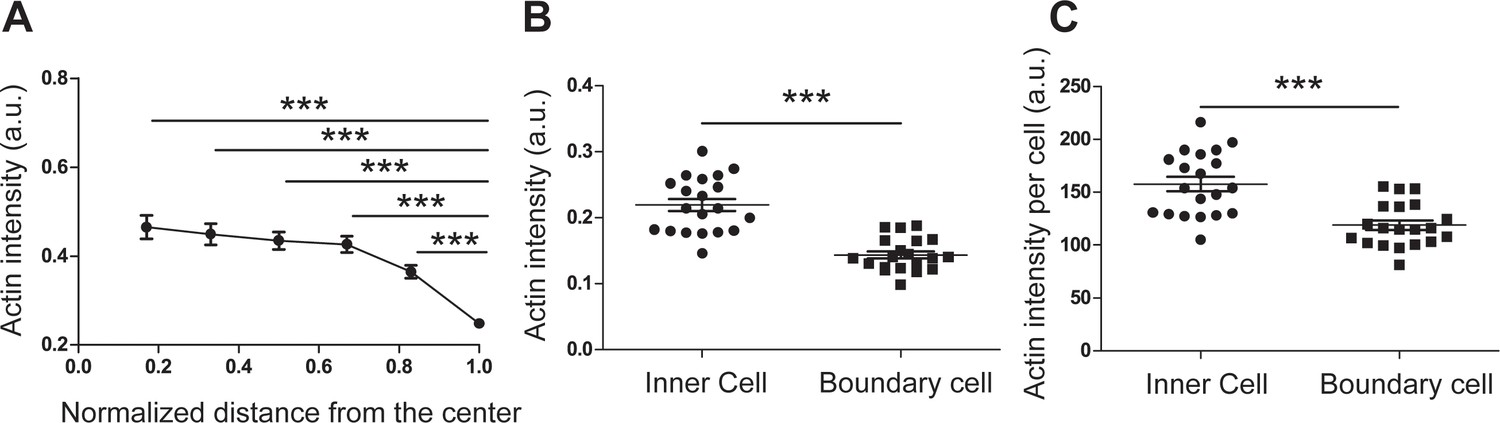
Quantification of the actin intensity of patterned REF 2c cells confirmed the actin gradient.
(A) Bar plot showing actin intensity as a function of distance from the pattern center. The whole pattern was divided into six zones with the same width. The intensities were all normalized to the maximum intensity in the analyzed 20 patterns. (B) Dot plots showing the average actin intensity in the boundary cells (cells located in the outmost zone) and inner cells (cells located in the rest zones). (C) Dot plots showing the average actin intensity per cell in the inner cells and boundary cells. The actin intensity per cells were determined by normalization using cell numbers in each layer. n = 20 pattens. Data are presented as mean ± s.e.m. ***, p < 0.001.
Figure 3—figure supplement 2
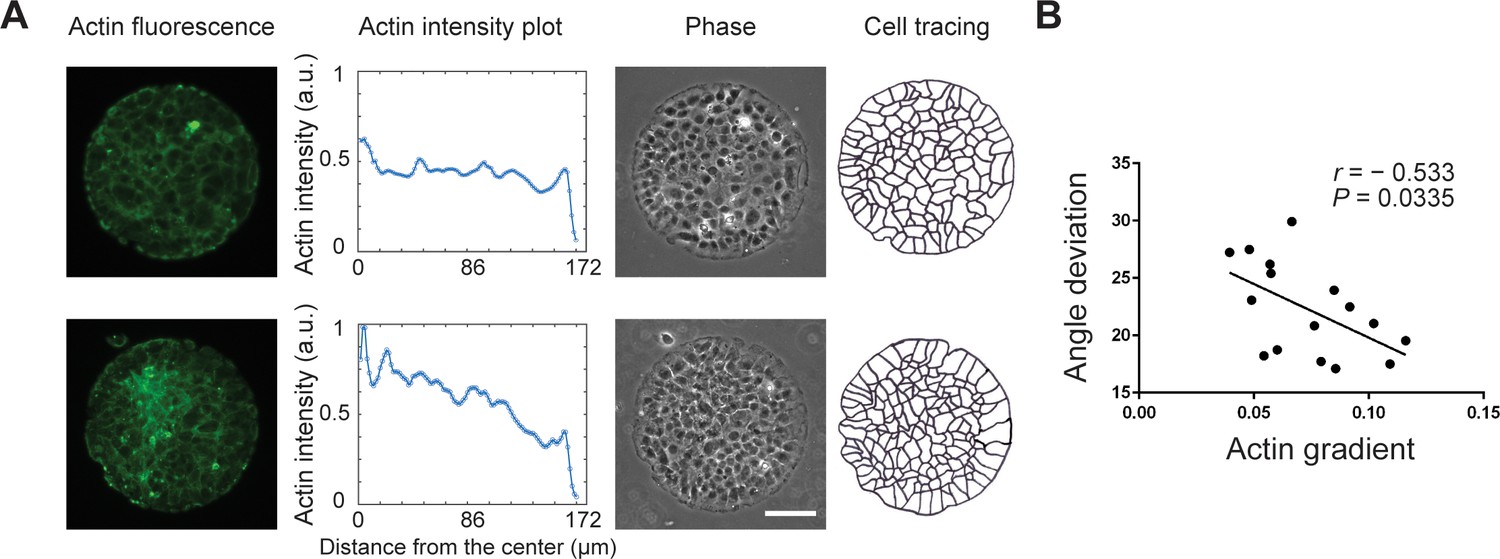
The correlation between actin gradient and radial alignment of REF 2c cells.
(A) Actin fluorescence images and actin intensity plots of two typical colonies with different actin gradients (the left two panels). The phase and cell tracing images showing the radial alignment of boundary cells on patterned surfaces (the right two panels). Scale bar: 100 μm. (B) The scatterplot showing actin gradient (defined by the average intensity difference between the outmost cell layer and the inner cells) versus angle deviation of REF 2c cells on the pattern boundary. n = 16 colonies. r, Pearson correlation coefficient.
Figure 3—figure supplement 3
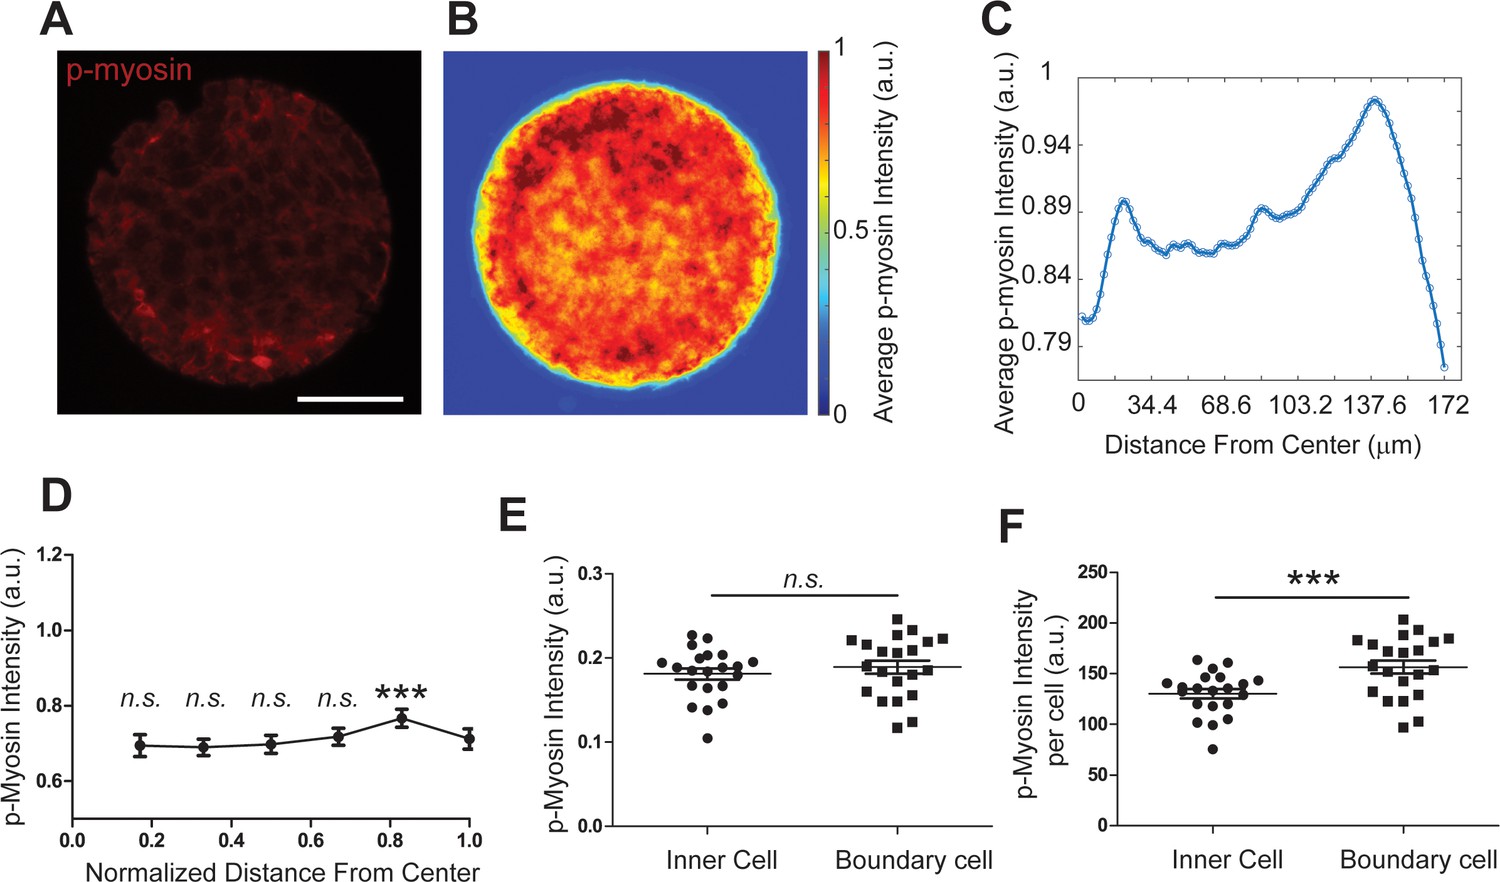
Myosin-mediated total cell contractility slightly increased near pattern boundary.
(A-C) Representative fluorescence image, heatmap, and intensity plots showing the average phosphorylated-myosin intensity as a function of distance from the pattern center, from a total of 27 images. The intensity of p-myosin peaked at 138 µm, which is within the boundary cell layer. (D) Line plot showing the average phosphorylated-myosin intensity by dividing the whole pattern into six zones. The intensities were all normalized to the maximum intensity in the analyzed 20 patterns. Myosin intensities in inner zones were compared with the outmost zone. (E) Dot plots showing the average phosphorylated-myosin intensity in the inner cells and boundary cells. (F) Dot plot showing the average phosphorylated-myosin intensity per cell in the inner cells and boundary cells. The phosphorylated-myosin intensity per cell is determined by normalization using cell numbers in each layer. Data are presented as mean ± s.e.m., ***, p < 0.001; n.s., p > 0.05.
Figure 3—figure supplement 4
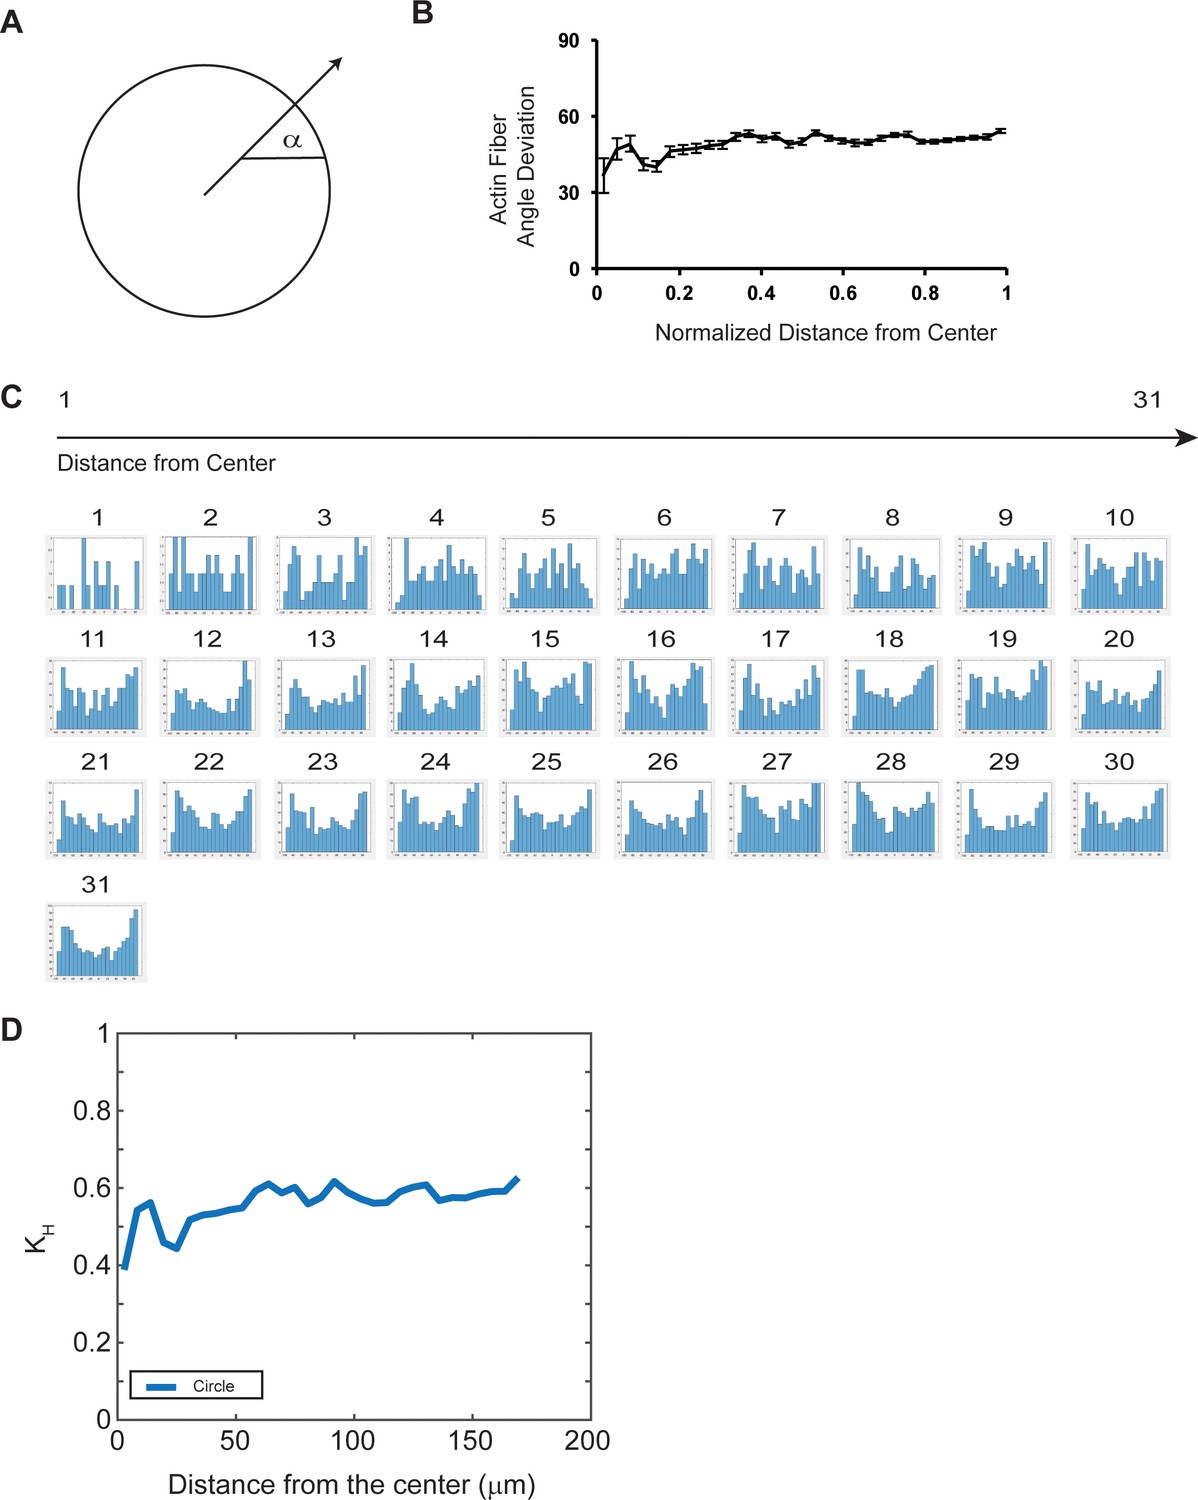
Isotropic actin network in REF 2c circular patterns.
(A) Schematic of fiber angle deviation calculation. (B) Actin fiber angle deviation as a function of normalized distance from center of the pattern. Data is presented as mean ± s.e.m. (C) Histograms of the actin fiber orientation distribution as a function of distance from the center of the pattern. n = five patterns. (D) Structure parameter (kH) as a function of the distance from the pattern center (see Materials and methods for kH). n = five patterns.
Figure 4 with 9 supplements
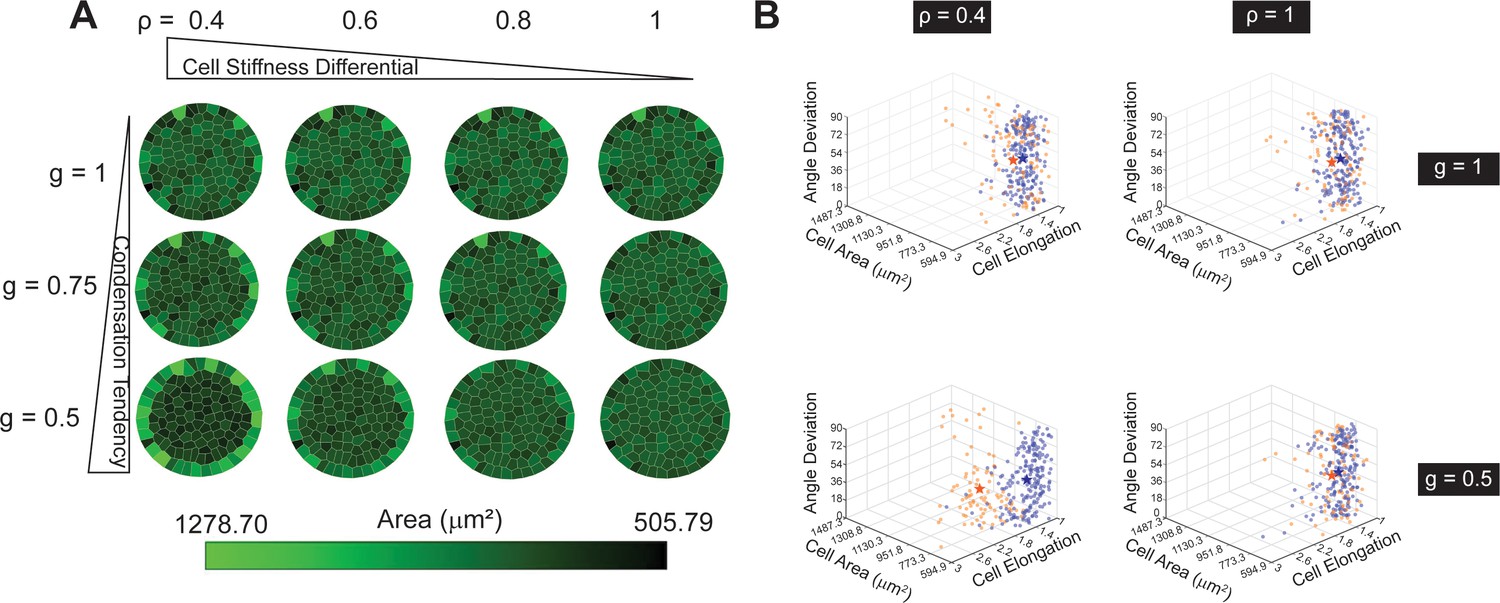
Condensation tendency and cell stiffness differential explain the radial-alignment boundary.
(A) Voronoi cell modeling results from varying condensation tendency parameter and cell stiffness differential parameter . Smaller and contribute to larger cell area along the boundary. (B) 3D Scatter plots of three cell-morphological parameters: angle deviation, cell area, and cell elongation. The three parameters on inner (orange) and boundary cells (blue) become significantly different when both and are small (e.g. and ; the stars represent the mean values among each cell group). n = 5 patterns.
Figure 4—figure supplement 1
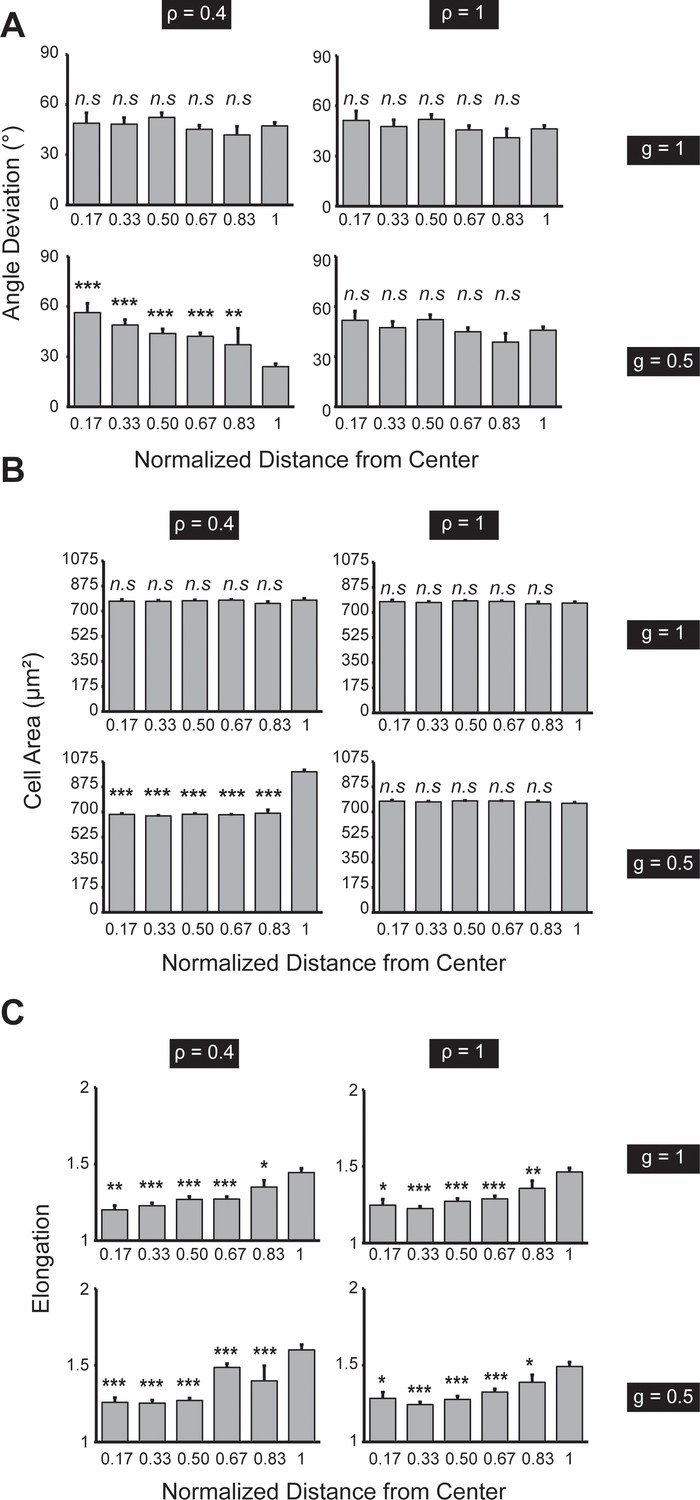
Quantitative analysis of the Voronoi cell modeling for circularly patterned cells.
(A) Angle deviation is only polarized when both and are small (e.g. and plotted as a function of distance from the center of the pattern). n = 5 patterns. (B) Cell area is only polarized when both and are small. n = 5 patterns. (C) Boundary cell is more elongated when both and are small. n = 5 patterns. Data were compared with the outmost zone. Data are represented as mean ± s.e.m. *, p < 0.05, **, p < 0.01, ***, p < 0.001.
Figure 4—figure supplement 2
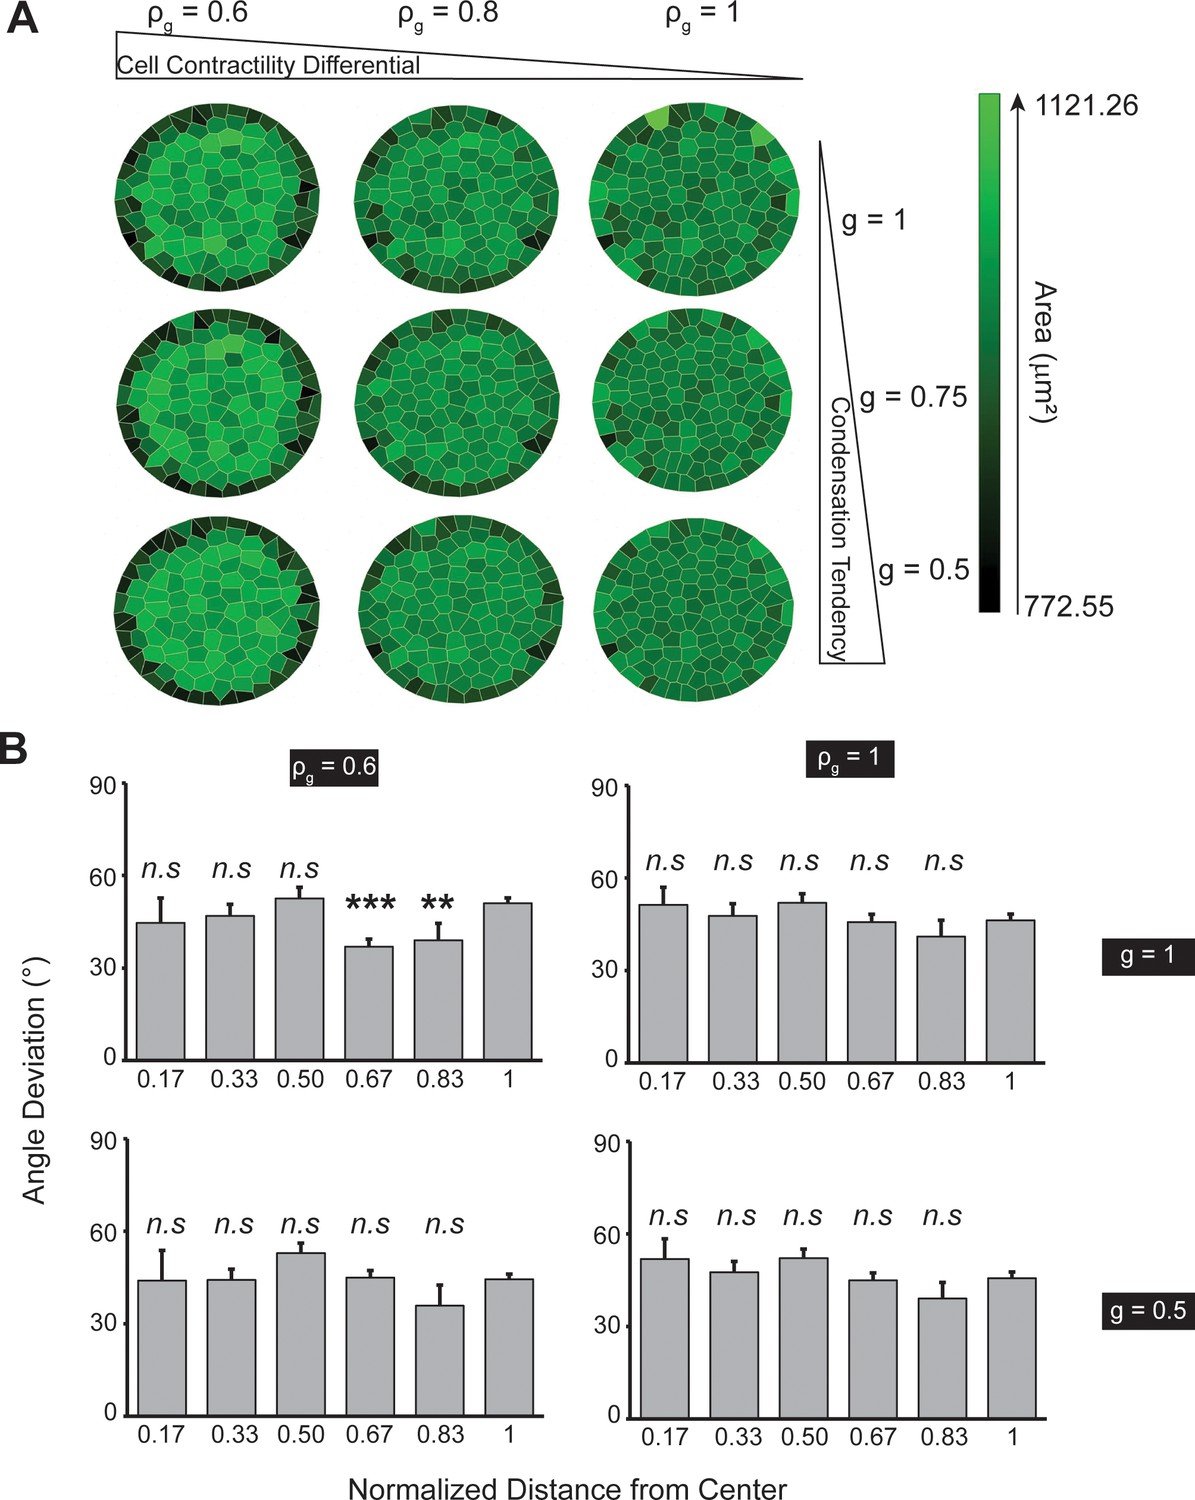
Increased boundary contractility is not essential to the radial-alignment boundary.
(A) Voronoi cell modeling results from varying condensation tendency parameter and cell contractility differential parameter . Smaller (higher global contractility) and (higher contractility differential) only contribute to smaller cell areas along the boundary. (B) Bar plots showing the cell angle deviation as a function of distance from the pattern center, suggesting the change of the two parameters do not result in radial alignment. Data were compared with the outmost zone. See Materials and methods for . Data are presented as mean ± s.e.m.; n.s., p > 0.05.
Figure 4—figure supplement 3
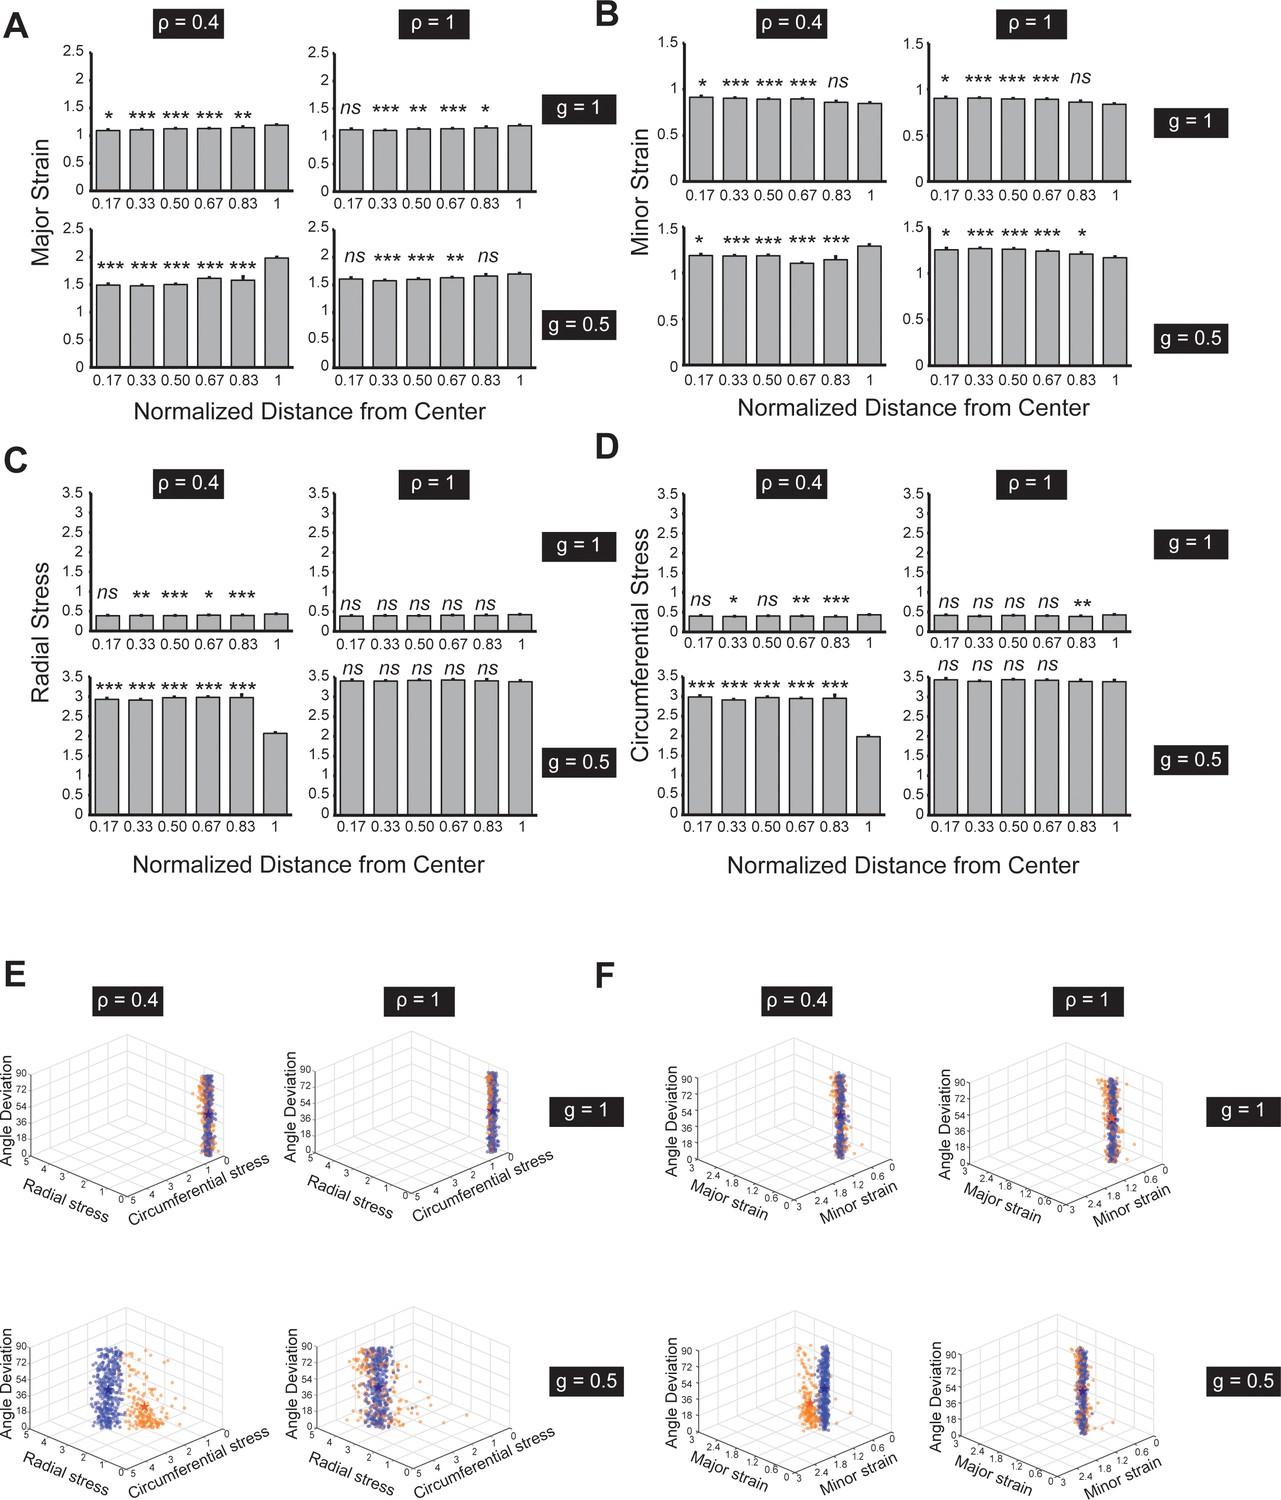
Stress and strain analysis of the simulation from the Voronoi cell modeling for circularly patterned cells.
(A-B) Larger contractility () contributes to overall larger strains (both major and minor strains) in the pattern. The cell strains are only polarized at the boundary with large contractility and stiffness differential ( and ). (C-D) Larger contractility () contributes to overall larger tensile stresses (both major and minor stresses) in the pattern. The cell stresses are only polarized at the boundary with large contractility and stiffness differential ( and ). (E) 3D Scatter plots of angle deviation, radial stress, and circumferential stress among cells. The three parameters on inner (orange) and boundary cells (blue) become significantly different when both and are small (e.g. and ; the stars represent the mean values among each cell group). (F) 3D Scatter plots of angle deviation, major and minor strains among cells. The three parameters on inner (orange) and boundary cells (blue) become significantly different when both and are small. See Materials and methods for stress and strain quantifications. n = 5 patterns. Data are represented as mean ± s.e.m. *, p < 0.05, **, p < 0.01, ***, p < 0.001, n.s., p > 0.05.
Figure 4—figure supplement 4
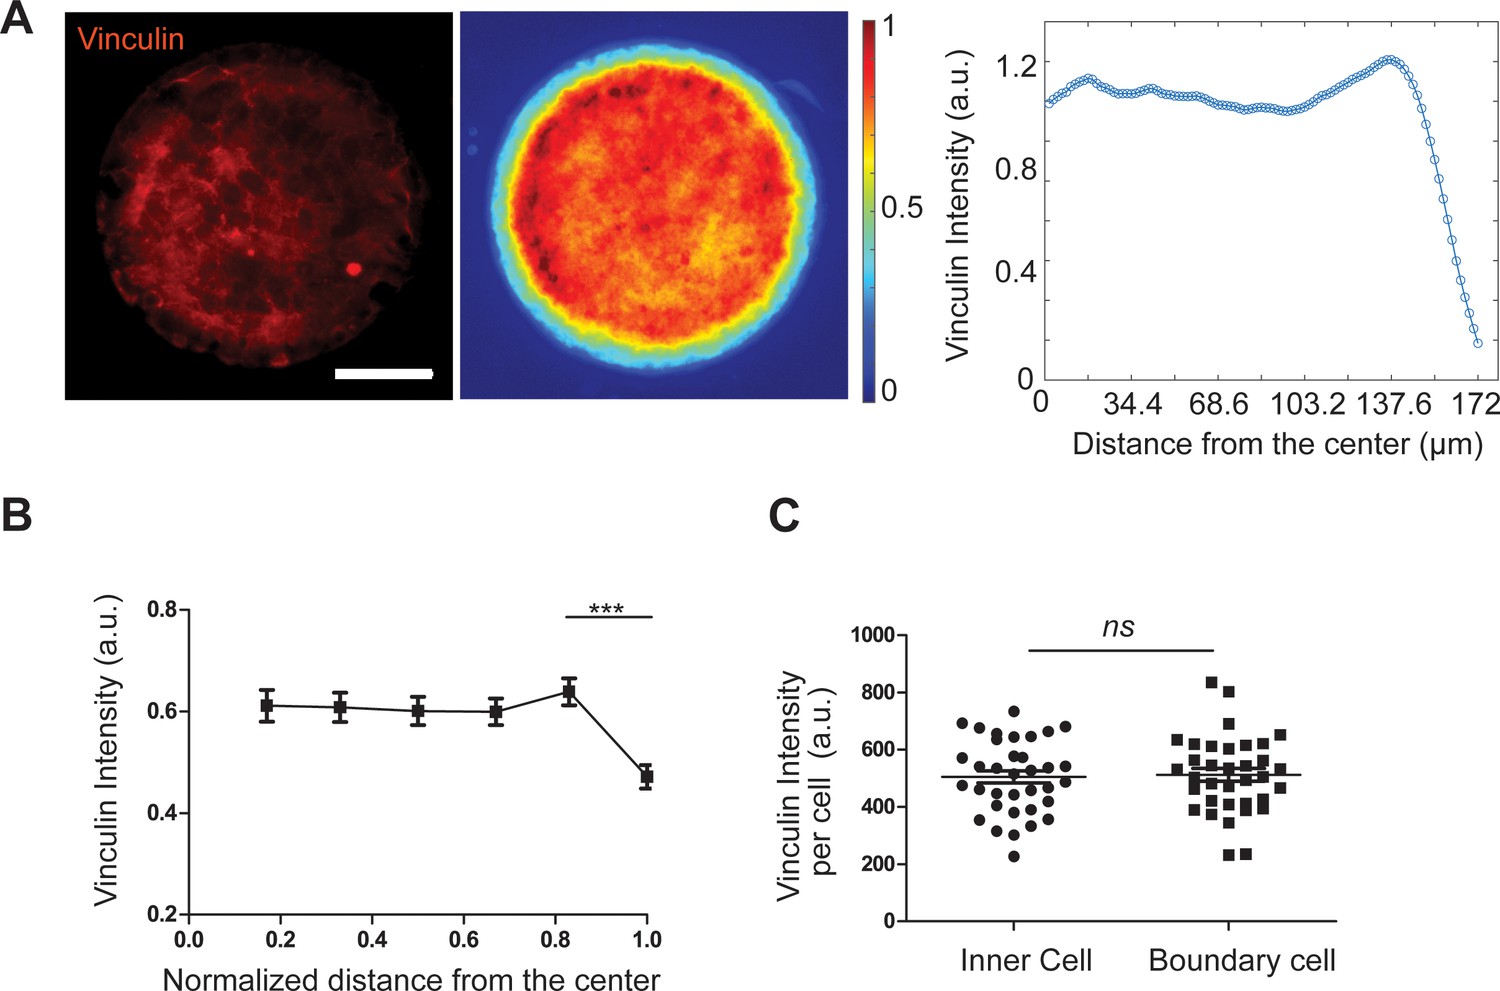
Uniform vinculin expression in patterned REF 2c cells.
(A-C) Representative fluorescence image (A), colorimetric map (B), and intensity plot (C) showing the average vinculin intensity as a function of distance from pattern center. Data were collected from a total of 36 images. (D) Dot plots showing the vinculin intensity per cell in the inner cells and boundary cells in the outmost layer. Data are presented as mean ± s.e.m.; n.s., p > 0.05.
Figure 4—figure supplement 5
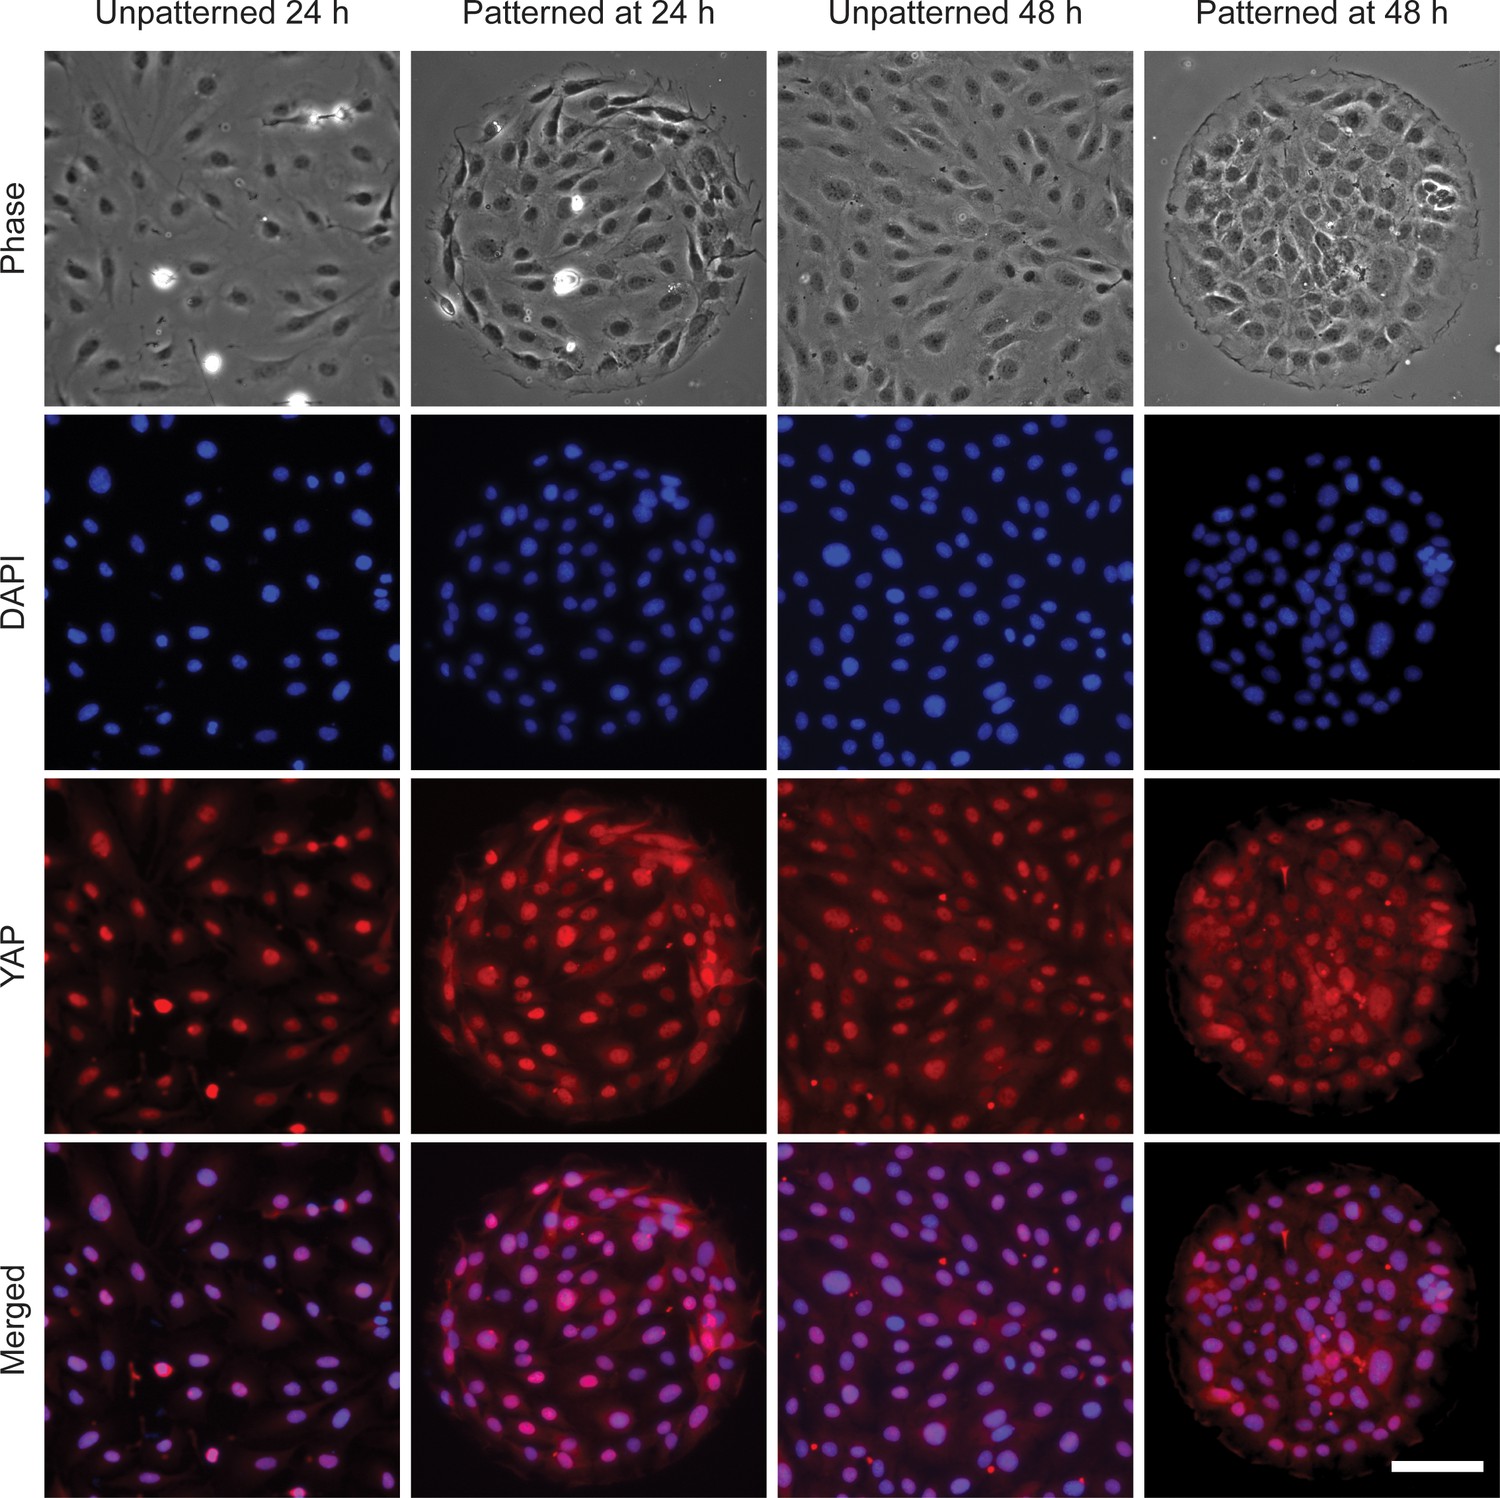
YAP is activated in REF 2c cells.
Representative phase-contrast and fluorescence images showing cell nuclei, YAP, and merged signals for unpatterned or patterned REF 2c cells at 24 hr or 48 hr. Scale bar: 100 μm.
Figure 4—figure supplement 6
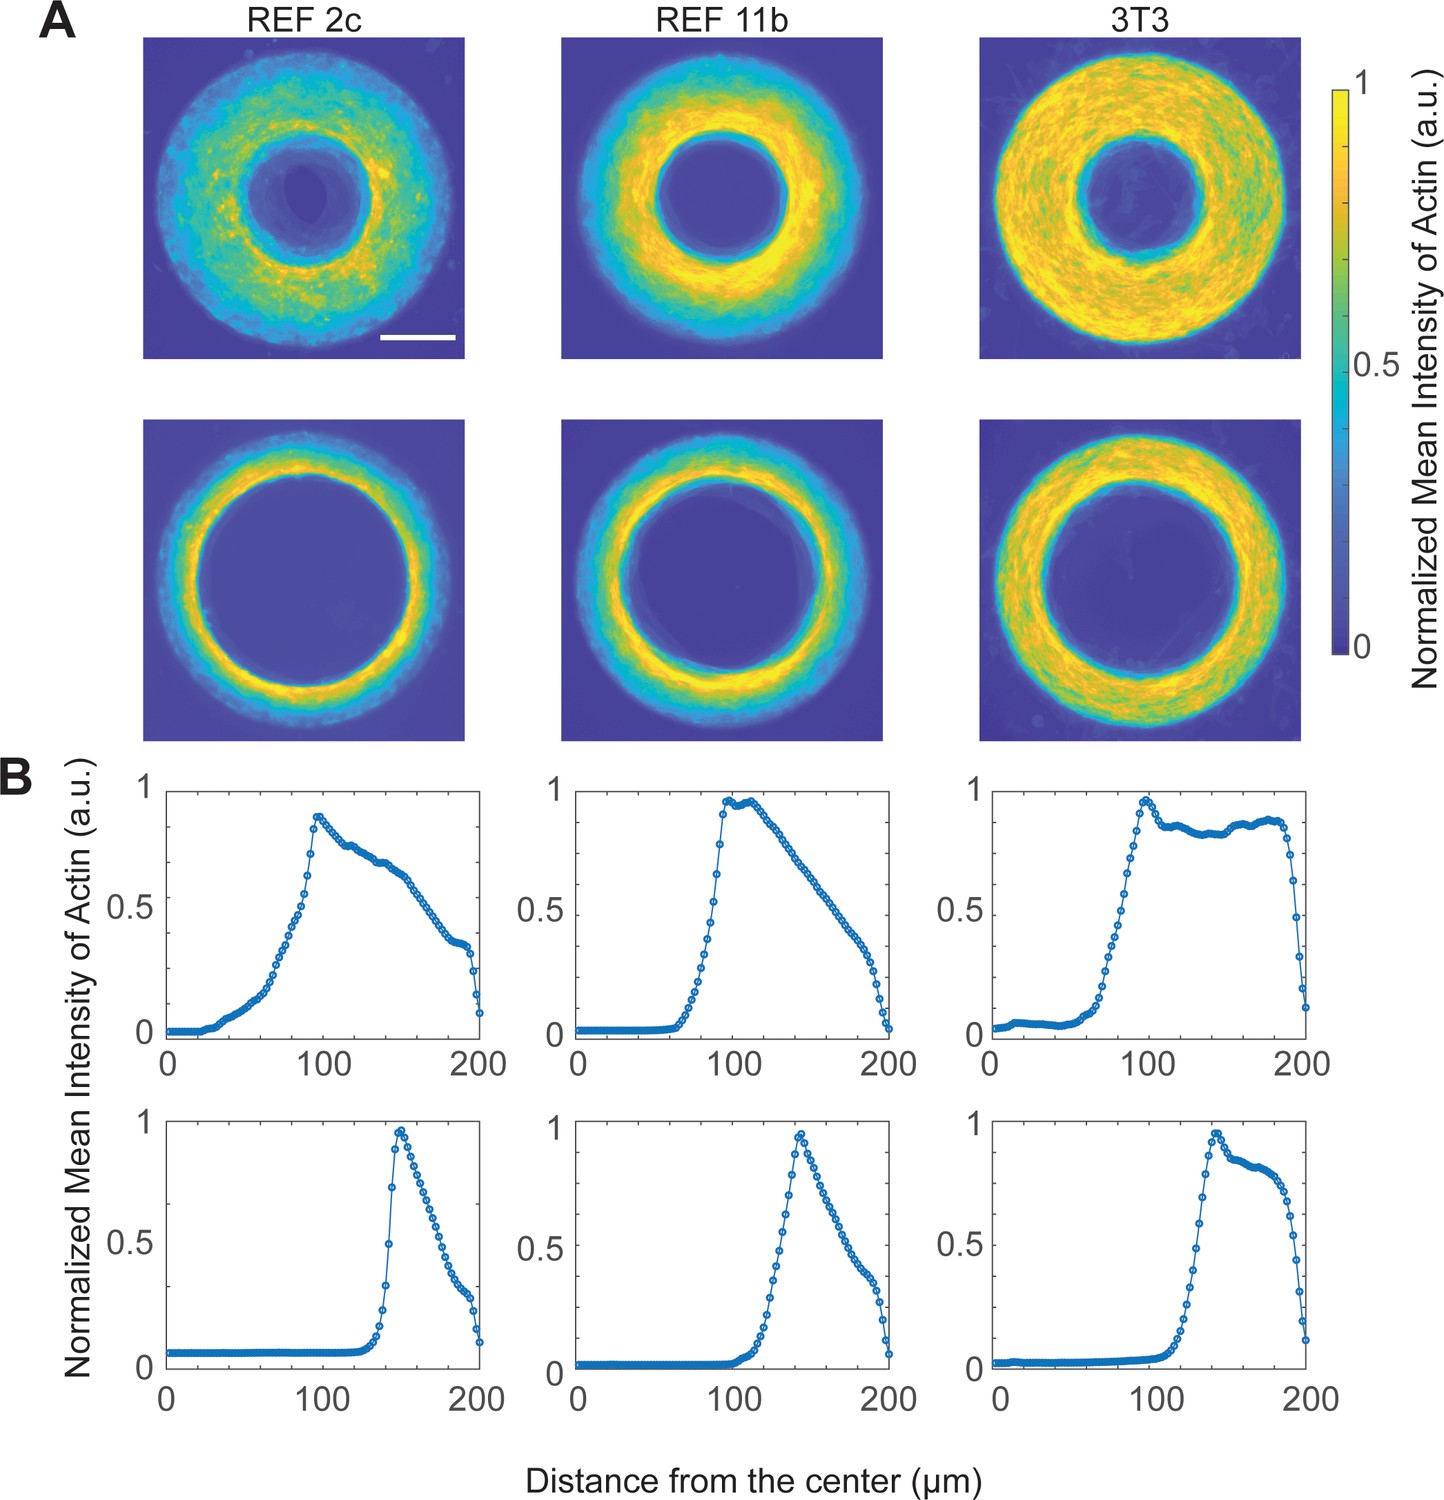
Actin distribution of REF 2c, REF 11b and 3T3 cells confined on ring-shaped patterns.
Colorimetric maps (A) and intensity plots (B) showing the average actin intensity as a function of distance from the center of ring-shaped patterns of REF 2c (n = 19 thick ring patterns, n = 20 thin ring patterns), REF 11b (n = 20 both patterns), and 3T3 cells (n = 20 both patterns). Scale bar: 100 μm.
Figure 4—figure supplement 7
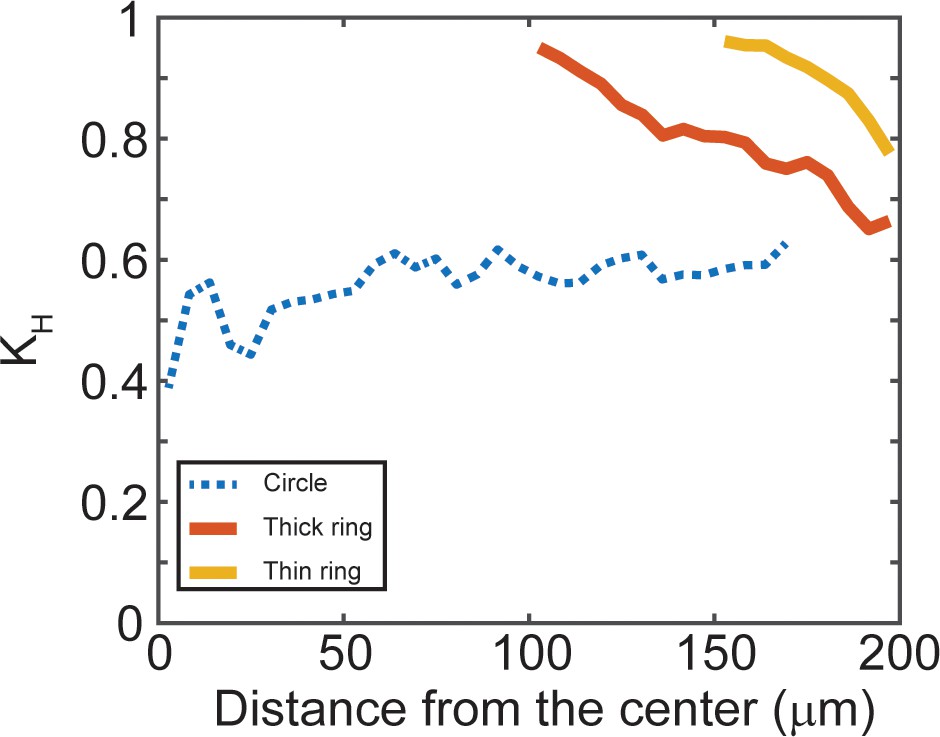
Ring-shape micropatterns present circumferentially oriented actin network.
Structure parameter (kH) as functions of the distance from the pattern centers for ring patterns. The closer kH is to 1, the more circumferentially aligned the actin bundles are (see Materials and methods for more details of kH). n = 5 patterns.
Figure 4—figure supplement 8
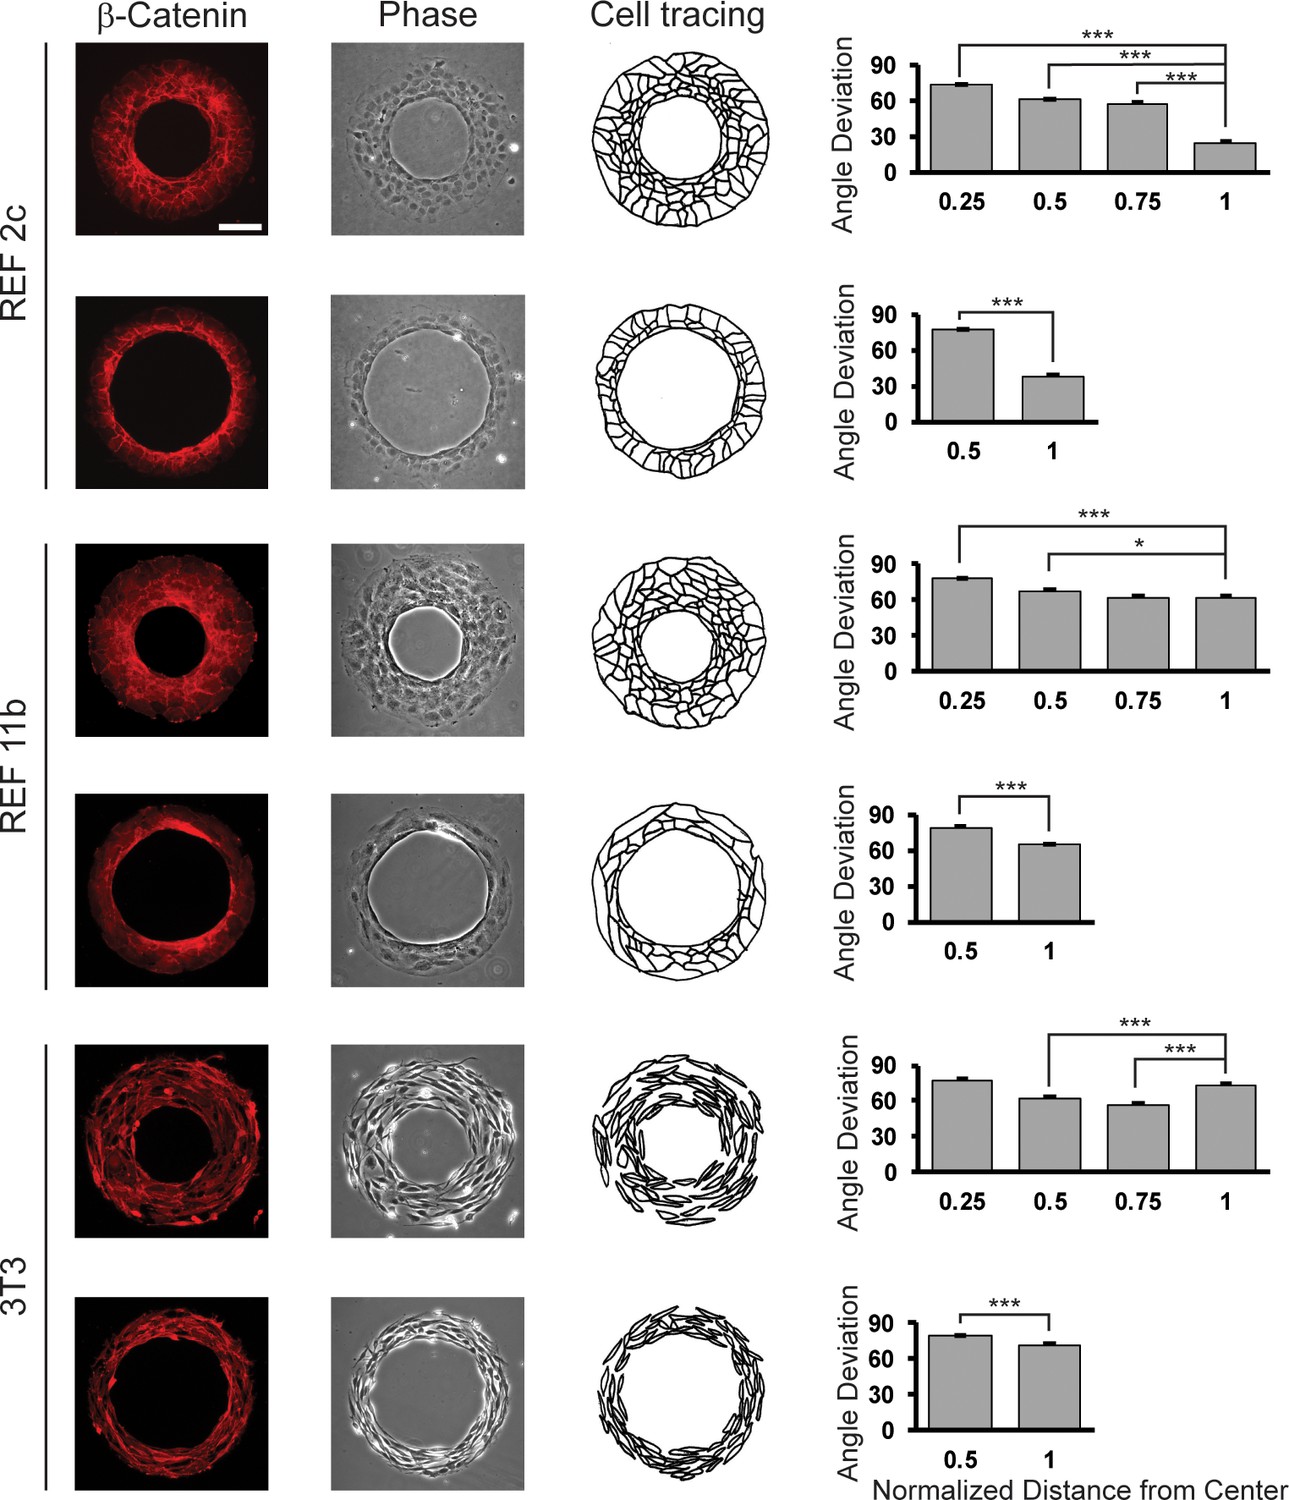
Cell alignment on ring-shaped patterns.
Fluorescent images showing β-catenin signals, phase contrast images, and schematics of REF 2c, REF 11b, and 3T3 cells at 48 hr. Angle deviation is quantified as a function of normalized distance from center. n = 16 patterns per group. Scale bar: 100 μm. Data are represented as mean ± s.e.m. *, p < 0.05, ***, p < 0.001.
Figure 4—figure supplement 9
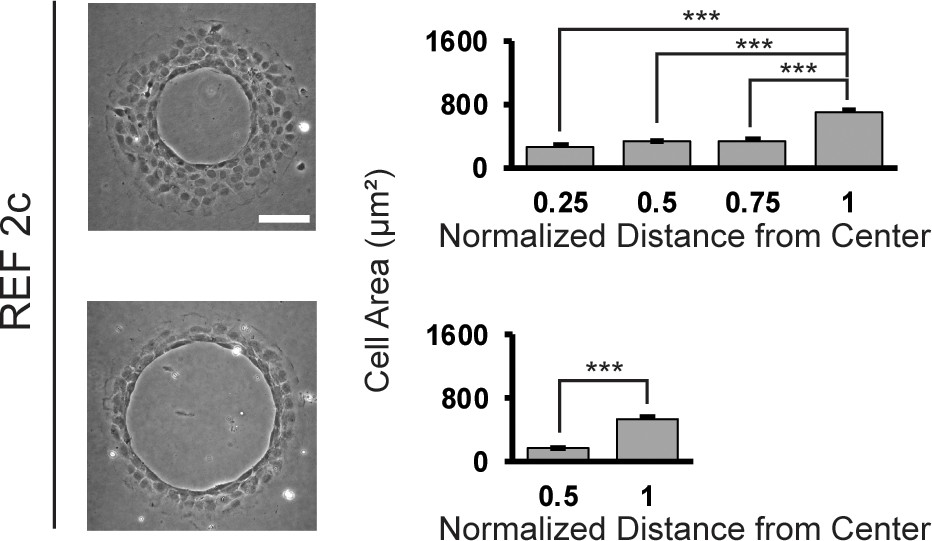
Cell area of REF 2c cells on ring patterns.
Cell area is plotted as a function of distance from the center of the pattern for thick and thin rings. Data are represented as mean ± s.e.m. ***, p < 0.001.
Additional files
Download links
A two-part list of links to download the article, or parts of the article, in various formats.
Downloads (link to download the article as PDF)
Open citations (links to open the citations from this article in various online reference manager services)
Cite this article (links to download the citations from this article in formats compatible with various reference manager tools)
Condensation tendency and planar isotropic actin gradient induce radial alignment in confined monolayers
eLife 10:e60381.
https://doi.org/10.7554/eLife.60381


