Synergy between Wsp1 and Dip1 may initiate assembly of endocytic actin networks
- Department of Chemistry and Biochemistry, Institute of Molecular Biology, University of Oregon, United States
- Department of Cell and Developmental Biology, SUNY Upstate Medical University, United States
Figures
Figure 1 with 5 supplements

Wsp1 plays a role in the initiation of endocytic actin patches.
(A) Equatorial plane images of Fim1-GFP in Schizosaccharomyces pombe cells taken using spinning disk confocal microscopy. Scale Bar: 5 µm. (B) Plot showing the relative Fim1-GFP intensity in S. pombe mutant endocytic patches over their lifetimes. Traces represent the average of 16–18 endocytic patches. Intensity plots were aligned based on their peak values and normalized based on the peak value of the Fim1-GFP signal in the wild-type strain. Standard deviation is shown as shaded region around each trace. (C) Plot comparing the assembly time of Fim1-GFP in endocytic patches in wild-type cells to wsp1∆CA, dip1∆, and wsp1∆CA dip1∆ mutants. Error bars: standard error from 16 to 18 patches. (D) Plot comparing the endocytic patch initiation rate in wild-type cells to wsp1∆CA, dip1∆, and wsp1∆CA dip1∆ mutants. Error bars: standard error from 10 cells. (E) Plot comparing the endocytic actin patch density in wild-type cells to wsp1∆CA, dip1∆, and wsp1∆CA dip1∆ mutants as determined based on the number of Fim1-GFP-marked cortical puncta. Error bars: standard error from 10 cells. (F) Plot showing the percentage of endocytic patches internalized in wild-type and mutant S. pombe cells. Error bars: standard error from 10 to 22 cells. p-values: *<0.05, **<0.01, ***<0.001.
-
Figure 1—source data 1
Analysis of spinning disk confocal videos of S. pombe source data.
- https://cdn.elifesciences.org/articles/60419/elife-60419-fig1-data1-v2.xlsx
Figure 1—figure supplement 1
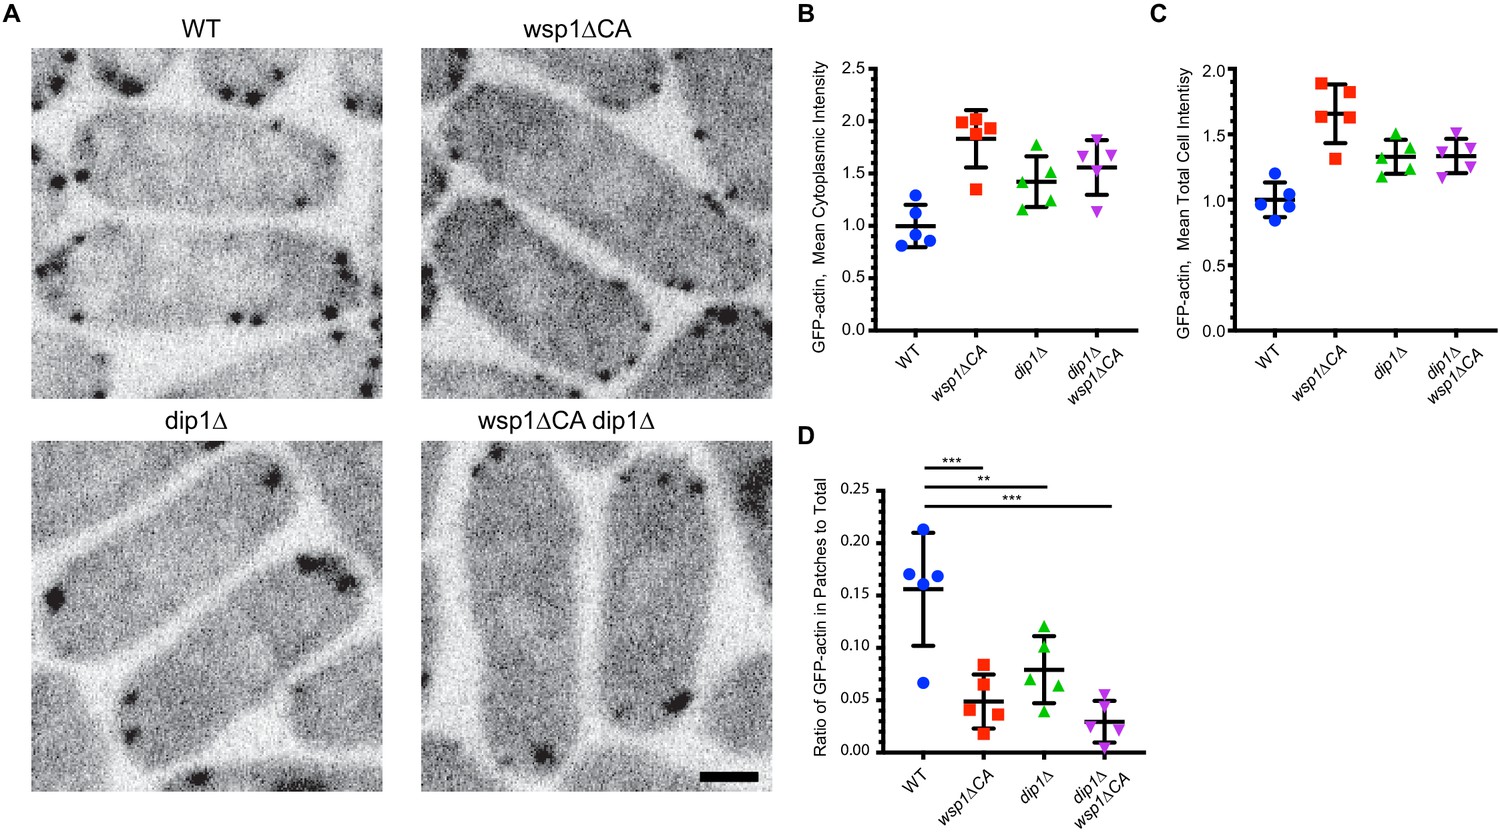
Nucleation promoting factor (NPF) mutations do not deplete the pool of soluble actin monomers in the cytoplasm.
(A) Central confocal slices of wild-type and mutant strains expressing GFP-actin via the arp3 promoter at the leu1 locus. Scale bar: 2 µm. (B) Quantification of the mean cytoplasmic intensity of GFP-actin in wild-type and mutant strains in a central confocal slice. The contribution of autofluorescence was eliminated by subtracting the cytoplasmic signal from an image of an untagged wild-type strain collected with the same parameters. (C) Quantification of the mean total cell intensity of GFP-actin for wild-type and mutant strains in a central confocal slice, corrected as described in B. (D) Quantification of the ratio of total fluorescence intensity of GFP-actin in patches versus the total GFP-actin intensity in the cell. In all panels, error bars show the standard deviation from the mean. p-values: **<0.01, ***<0.001.
Figure 1—video 1
Spinning disk confocal microscopy video of Fim1-GFP in wild-type Schizosaccharomyces pombe cells.
Images of the cell medial plane were taken once every second and are displayed here at 10× collection speed (related to Figure 1). Scale bar: 5 µM. 10 fps.
Figure 1—video 2
Spinning disk confocal microscopy video of Fim1-GFP in dip1∆ Schizosaccharomyces pombe cells.
Images of the cell medial plane were taken once every second and are displayed here at 10× collection speed (related to Figure 1). Scale bar: 5 µM. 10 fps.
Figure 1—video 3
Spinning disk confocal microscopy video of Fim1-GFP in wsp1∆CA Schizosaccharomyces pombe cells.
Images of the cell medial plane were taken once every second and are displayed here at 10× collection speed (related to Figure 1). Scale bar: 5 µM. 10 fps.
Figure 1—video 4
Spinning disk confocal microscopy video of Fim1-GFP in dip1∆ wsp1∆CA Schizosaccharomyces pombe cells.
Images of the cell medial plane were taken once every second and are displayed here at 10× collection speed (related to Figure 1). Scale bar: 5 µM. 10 fps.
Figure 2 with 2 supplements

Wsp1-VCA increases the number of linear filaments nucleated by Dip1-bound Arp2/3 complex.
(A) Time courses of polymerization of 3 µM 15% pyrene-labeled rabbit skeletal muscle actin in the presence of 10 nM Schizosaccharomyces pombe Arp2/3 complex (SpArp2/3 complex) and 0–30 µM S. pombe Dip1 (Dip1) with or without 1 µM S. pombe Wsp1-VCA (Wsp1-VCA). (B) Plot of the maximum polymerization rates in pyrene-labeled actin polymerization assays as described in A. Data were fit to a hyperbolic equation as described in Materials and methods and in Supplementary file 1. Only a subset of the reactions included in this titration is shown in the time courses in A. (C) Total internal reflection fluorescence (TIRF) microscopy images of actin polymerization assays containing 100 nM SpArp2/3, 6 nM Alexa Fluor 568-labeled SpDip1 (568-Dip1)(magenta) and 1.5 µM 33% Oregon Green-labeled actin (green) with or without 1 µM SpWsp1-VCA or 1 µM GST-SpWsp1-VCA. The panels are aligned by the reaction times noted above each column. White arrows indicate actin filament pointed ends bound by 568-Dip1. Scale bar: 2 µm. (D) Quantification of the percentage of linear actin filament pointed ends bound by 568-Dip1 2 min and 30 s into actin polymerization assays in C. Branched actin filaments were not included in the calculation. Dip1 binds very weakly to Arp2/3 complex on the ends of preexisting actin filaments under these conditions, so nearly all (~97%) of the pointed ends decorated with Dip1 represent actin filaments nucleated by Dip1-bound Arp2/3 complex (Balzer et al., 2018). The total number of linear actin filaments was corrected to account for an approximately twofold decrease in the number of spontaneously nucleated actin filaments caused by inhibition of spontaneous nucleation by GST-Wsp1-VCA or Wsp1-VCA (see Figure 2—figure supplement 1). Error bars represent the mean with standard error. p-values: ****<0.0001. (E) TIRF microscopy images of actin polymerization assays containing 250 nM SpArp2/3, 6 nM 568-Dip1 (magenta), and 1.5 µM 33% Oregon Green-labeled actin (green) in the presence or absence of 250 nM GST-SpWsp1-VCA. The panels are aligned by the reaction times noted above each column. White arrows indicate actin filament pointed ends bound by 568-Dip1. Scale bar: 3 µm. (F) Quantification of the percentage of linear actin filament pointed ends bound by 568-Dip1 2 min and 30 s into actin polymerization assays in E. Calculation of the percent bound was carried out as in D. Error bars represent the mean with standard error. p-values: ****<0.0001. (G) Time courses of polymerization of 3 µM 15% pyrene-labeled actin in the presence of 10 nM SpArp2/3 complex and 0–20 µM Dip1 with or without 200 nM GST-SpWsp1-VCA. (H) Plot of the maximum polymerization rate in pyrene-labeled actin polymerization assays containing GST-Wsp1-VCA and Dip1 as described in G. Only a subset of the reactions included in this titration is shown in the time courses in A. The fits for reactions without Wsp1 or with Wsp1-VCA (panel B) are shown for comparison. See Supplementary file 1 for details on parameters of fits.
-
Figure 2—source data 1
Analysis of TIRF microscopy videos source data.
- https://cdn.elifesciences.org/articles/60419/elife-60419-fig2-data1-v2.xlsx
Figure 2—figure supplement 1
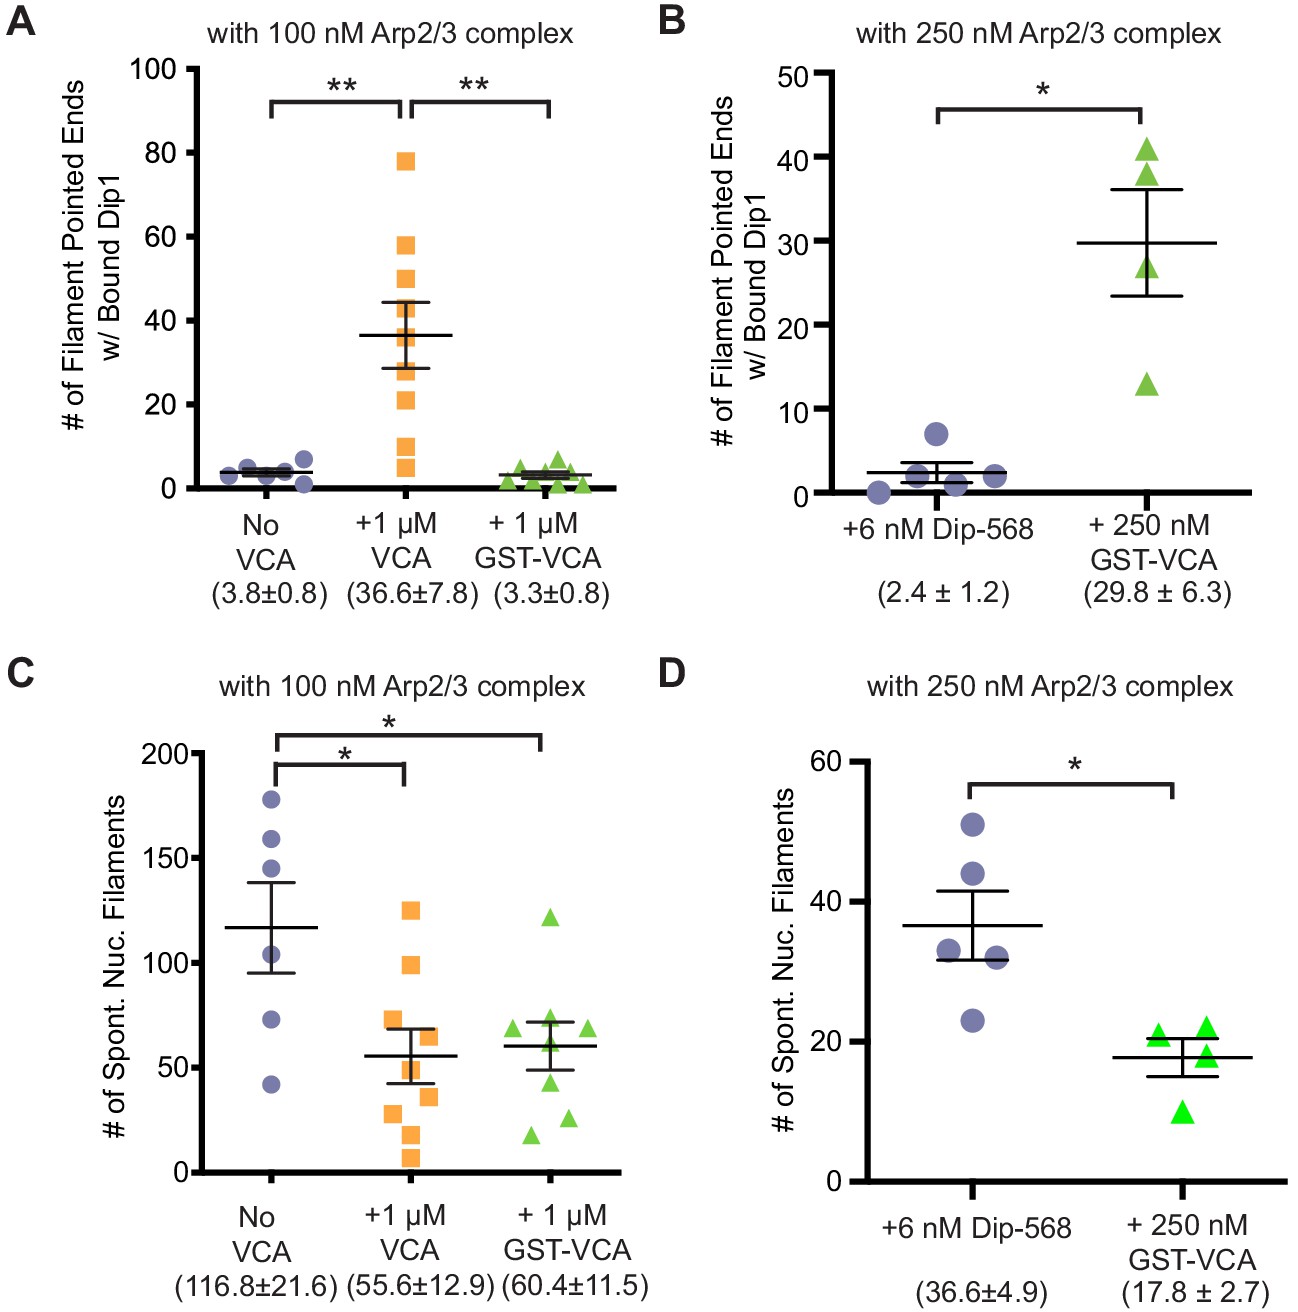
Quantification of raw number of Dip1 bound and spontaneously nucleated actin filaments.
(A,B) Quantification of the total number of filaments within a field with Alexa-568 Dip1 bound 2 min and 30 s after initiating the reactions shown in Figure 2C or 2E (100 nM or 250 nM Arp2/3 complex). (C,D) Quantification of the total number of spontaneously nucleated filaments within a field with Alexa-568 Dip1 bound 2 min and 30 s after initiating the reactions shown in Figure 2C (100 nM Arp2/3 complex). Filaments without Dip1 bound were assumed to be spontaneously nucleated. Error bars show the standard error of the mean. p-values: **<0.01, *<0.05.
Figure 2—video 1
Total internal reflection fluorescence (TIRF) microscopy video of actin polymerization assays containing 100 nM SpArp2/3, 6 nM Alexa Fluor 568-labeled SpDip1 (568-Dip1)(magenta), and 1.5 µM 33% Oregon Green-labeled actin (green).
The video on the left is collected in the absence of SpWsp1-VCA while the video on the right contains 1 µM Wsp1-VCA (related to Figure 2). Scale bars: 10 µM. 15 fps.
Figure 3 with 2 supplements
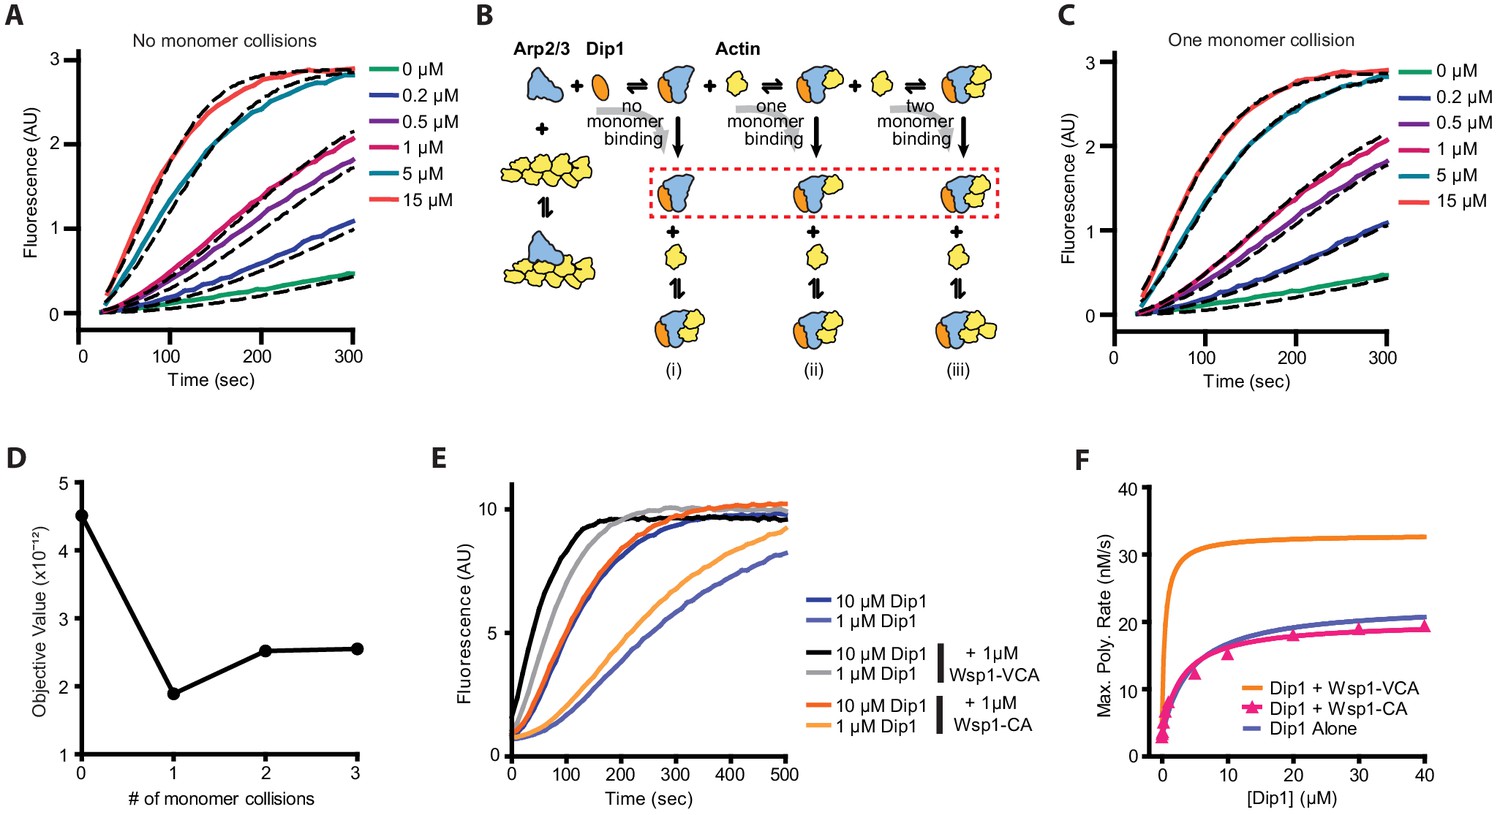
Monomer recruitment by Wsp1-VCA is required for maximal co-activation of Arp2/3 complex with Dip1.
(A) Plot of time courses of polymerization of 3 µM 15% pyrene-labeled actin in the presence of 50 nM SpArp2/3 complex and 0–15 µM Dip1 (solid colored lines). Dashed lines over each trace show the best fits from the no monomer collision model in B. Only a subset of the reactions and fits used in the simulation is shown. For the complete dataset see Figure 3—figure supplement 1. (B) Schematic showing kinetic pathways used to fit the experimental polymerization time courses. Dashed red lines indicate the nucleus in each of the three pathways tested. For additional details see Figure 3—figure supplements 1 and 2 and Supplementary file 2. (C) Plot of time courses of pyrene actin polymerization (solid lines) as in A, with dashed lines over each trace indicating the best fits from the one monomer binding model in B. (D) Plot of the objective value obtained from the fits of the pyrene-labeled actin polymerization data in A and C with models containing 0–3 monomer binding events before formation of the nucleus. The objective value represents the normalized mean square weighted sum of squares (see Materials and methods). (E) Time courses of polymerization of 3 µM 15% pyrene-labeled actin containing 10 nM SpArp2/3 complex and 1 µM or 10 µM Dip1 with or without 1 µM SpWsp1-CA or 1 µM SpWsp1-VCA. (F) Plot of the maximum polymerization rates of pyrene-labeled actin polymerization assays as shown in E. The fits for reactions without Wsp1 or with Wsp1-VCA (Figure 2B) are shown for comparison. Data points were fit as described in the Materials and methods. See Supplementary file 1 for details on parameters of fits.
-
Figure 3—source data 1
Source data for pyrene actin polymerization time courses and simulations.
- https://cdn.elifesciences.org/articles/60419/elife-60419-fig3-data1-v2.xlsx
Figure 3—figure supplement 1
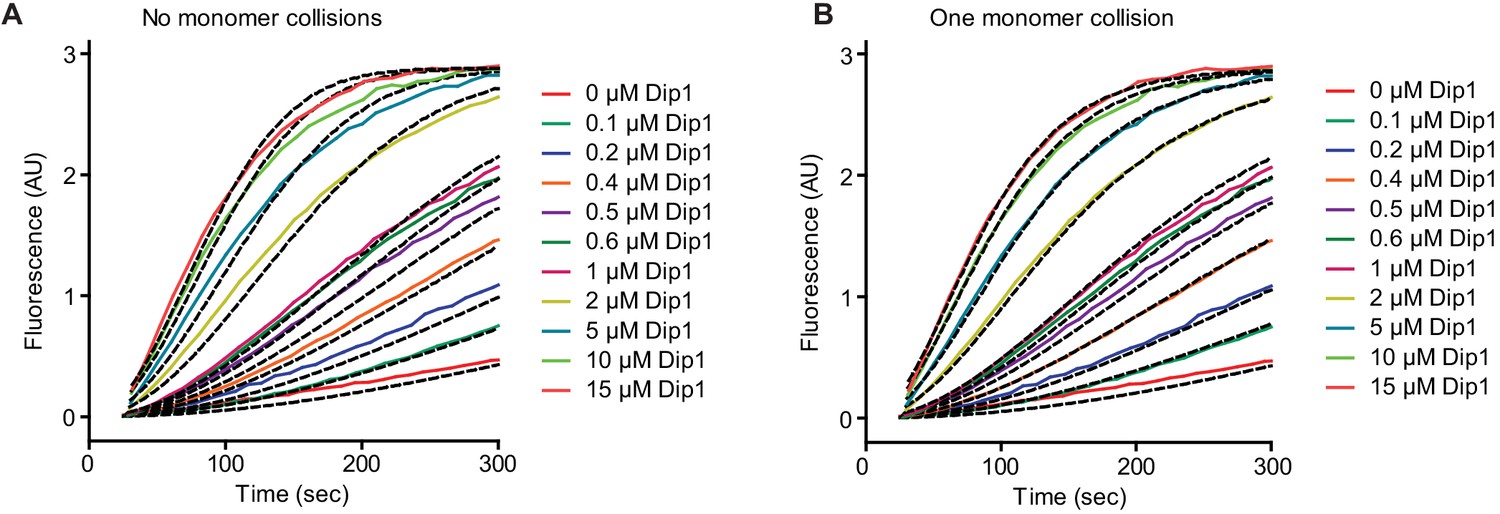
Simulated and measured time courses of actin polymerization reactions containing Dip1 and Arp2/3 complex.
(A) Time courses of polymerization of 3 µM 15% pyrene-labeled actin in the presence of 50 nM SpArp2/3 complex and a range of Dip1 from 0 to 15 µM (solid lines). Dashed lines indicate the best fits from the no monomer-binding kinetic model. (B) Time courses of actin polymerization assays as described in A. Dashed lines over each trace indicate the best fits from the one monomer binding model.
Figure 3—figure supplement 2
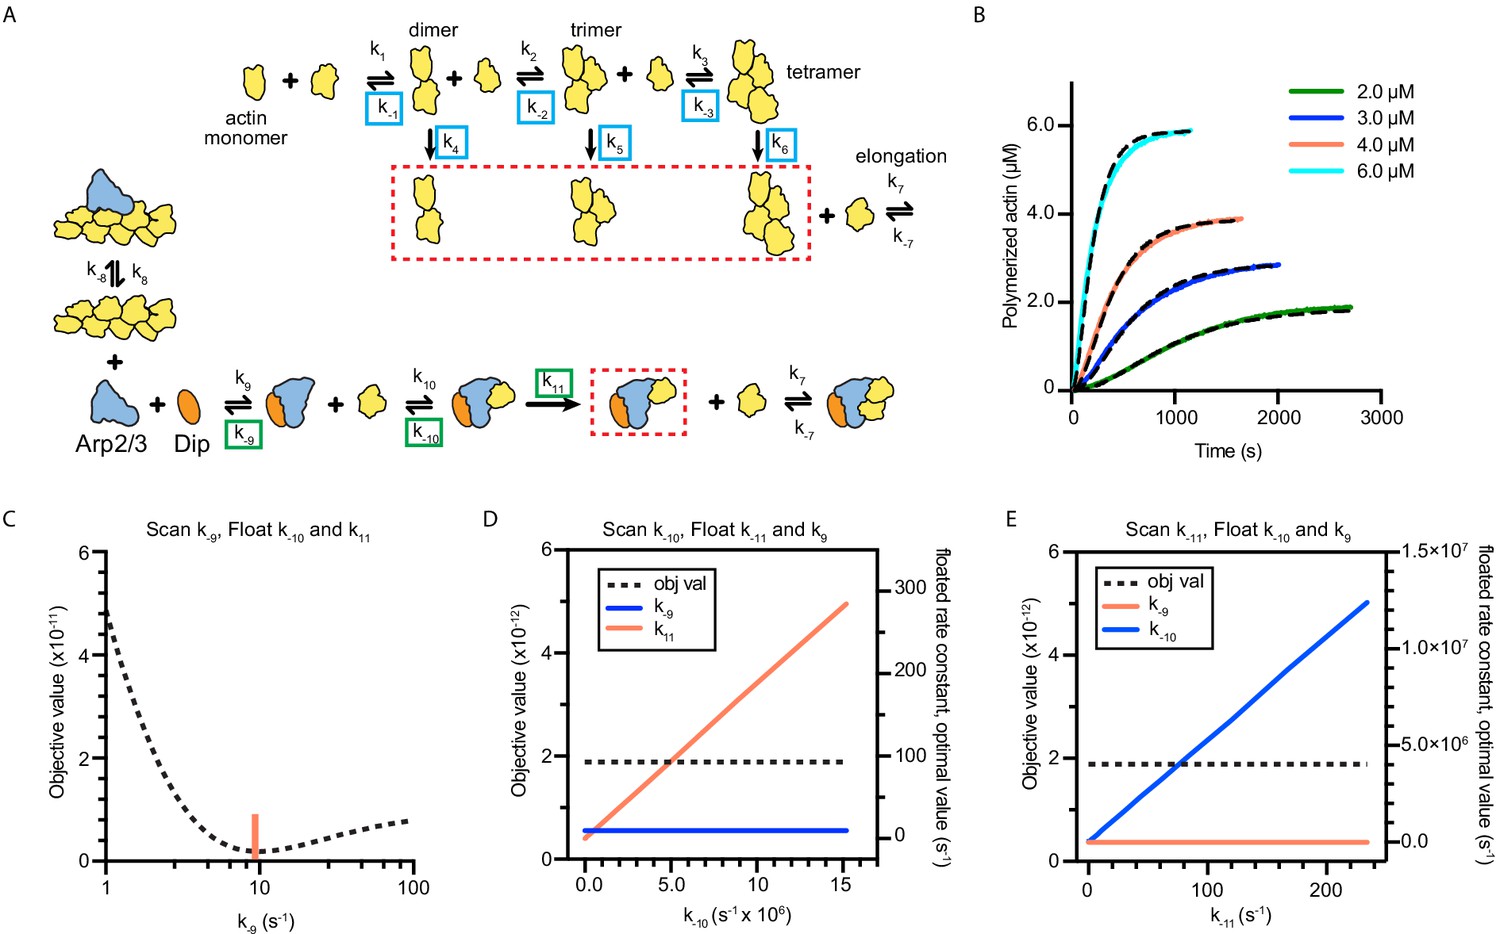
Full models used to fit actin polymerization time courses in reactions containing Dip1 and Arp2/3 complex with sensitivity analysis of floated parameters.
(A) Kinetic pathways for the spontaneous nucleation of actin filaments (top) and for the activation of Arp2/3 complex by Dip1 via the single monomer-binding pathway (bottom). Rate constants that were floated in the actin alone simulations (see panel B and Materials and methods) are boxed in cyan. Rate constants that were floated in the Dip1-mediated Arp2/3 complex activation simulations are boxed in green. See Materials and methods for more information and Supplementary file 2 for the values used for each reaction parameter in the simulations. (B) Time courses of polymerization of 15% pyrene-labeled actin at the indicated concentrations (solid lines). Dashed lines show simulated polymerization time courses based on the spontaneous nucleation and elongation model depicted in panel A. (C) Plot of the quality of fit (objective value) versus k−9 for simulations of the time courses of actin polymerization in the presence of Dip1 and Arp2/3 complex. The rate constants k−10 and k11 were allowed to float in these simulations. The red vertical line shows the value for the best fit. (D) Plot of the objective value of the fit versus k−10 for simulations of the time courses of actin polymerization in the presence of Dip1 and Arp2/3 complex. The rate constants k−9 and k11 were allowed to float in these simulations. Note that a range of values of k−10 fits the data. (E) Plot of the quality of fit (objective value) versus k11 for simulations of the time courses of actin polymerization in the presence of Dip1 and Arp2/3 complex. The rate constants k−9 and k−10 were allowed to float in these simulations. Note that a range of values of k11 fit the data.
Figure 4 with 2 supplements
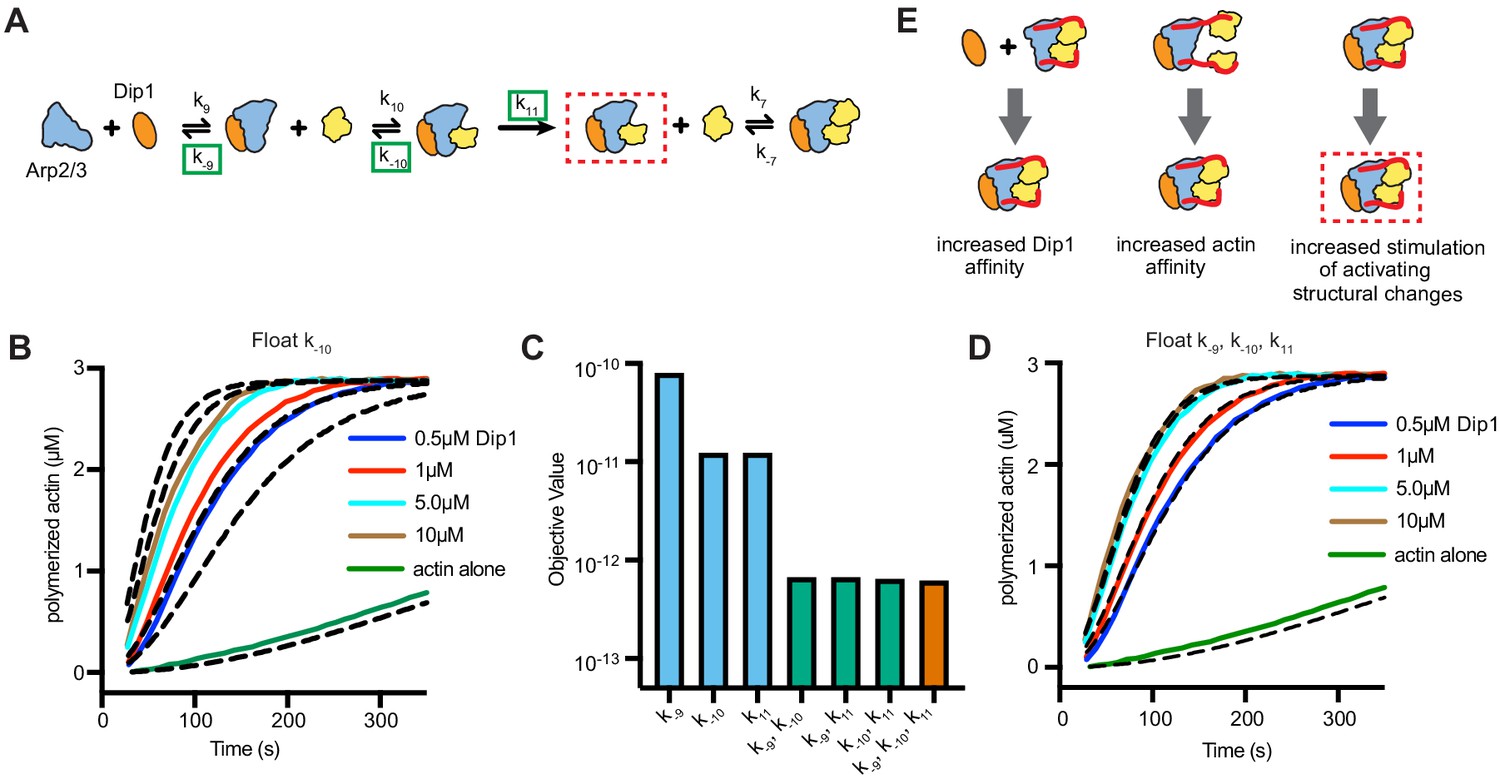
Wsp1-bound monomer recruitment accelerates multiple steps of the Dip1-mediated activation pathway.
(A) Simplified kinetic model of synergistic activation of Arp2/3 complex by Dip1 and Wsp1 based on the Dip1 alone ‘one monomer-binding’ activation pathway from Figure 3B. Note that Wsp1-VCA is not explicitly included in the model. Rate constants boxed in green were floated to fit time courses of reactions that contained both Dip1 and monomeric Wsp1-VCA. The purpose of this simplified model is to test the potential influence of Wsp1-mediated actin monomer recruitment on the steps of Dip1-mediated activation of Arp2/3 complex highlighted in E. (B) Plot of time courses of polymerization of 3 µM 15% pyrene-labeled actin in the presence of 50 nM SpArp2/3 complex, 1 µM Wsp1-VCA, and a range of Dip1 from 0.5–10 µM (solid colored lines). Dashed lines over each trace indicate the best fits from the model where only the off rate constant of the actin monomer bound to Dip1-Arp2/3 complex (k−10) was floated. (C) Objective values obtained from models floating the indicated parameters. The objective value represents the normalized mean square weighted sum of squares (see Materials and methods). (D) Plot of time courses shown in B with dashed lines over each trace indicating the best fits from a model in which k−9, k−10, and k11 were floated. (E) Depiction of the steps in Dip1-mediated activation of Arp2/3 complex that may be influenced by monomer recruitment. Dashed red lines in A and E indicate the nucleation competent state.
-
Figure 4—source data 1
Source data for pyrene actin polymerization time courses and simulations in Figure 4.
- https://cdn.elifesciences.org/articles/60419/elife-60419-fig4-data1-v2.xlsx
Figure 4—figure supplement 1
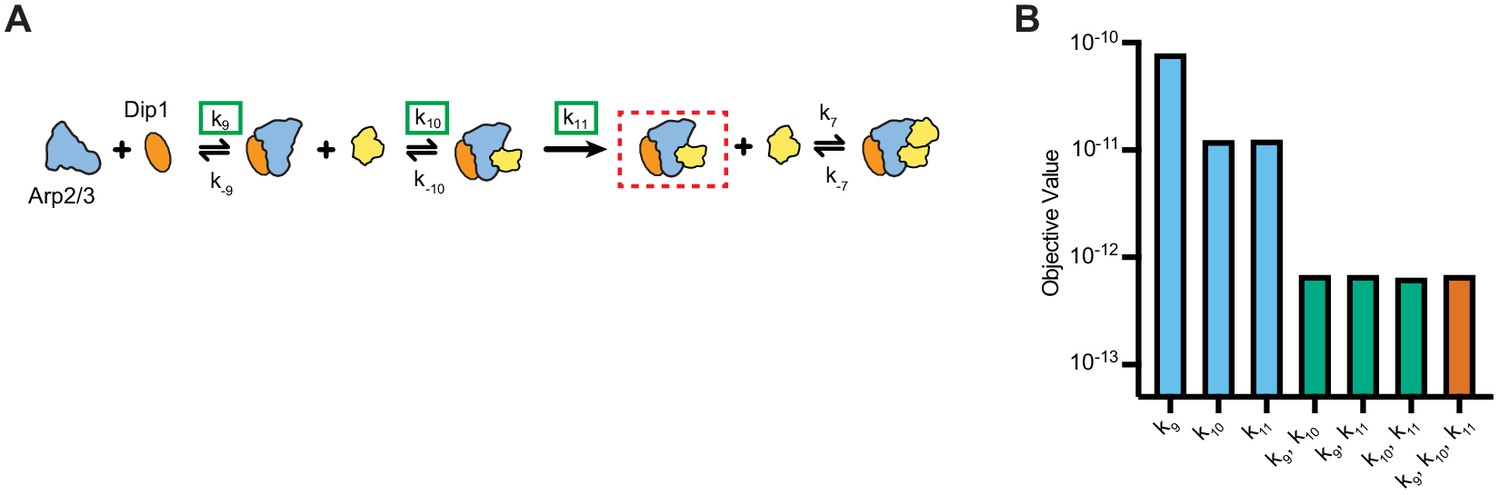
Floating the association rate constants k9 and k10 in kinetic simulations of synergistic activation by Dip1 and Wsp1.
(A) Simplified kinetic model of synergistic activation of Arp2/3 complex by Dip1 and Wsp1 based on the Dip1 alone ‘one monomer-binding’ activation pathway from Figure 3B. Note that Wsp1-VCA is not explicitly included in the model. Rate constants boxed in green were floated to fit time courses of reactions that contained both Dip1 and monomeric Wsp1-VCA. (B) Objective values obtained from models floating the indicated parameters. The objective value represents the normalized mean square weighted sum of squares (see Materials and methods).
Figure 4—figure supplement 2

Additional experimental methods to determine how Wsp1 accelerates Dip1-mediated activation of Arp2/3 complex.
(A) Schematic of short pitch crosslinking assay using dual cysteine engineered Arp2/3 complex and bis-maleimidoethane (BMOE). (B) Quantification of western blots of crosslinking reactions in which BMOE was added to a dual cysteine engineered Arp2/3 complex (1 μM) and 200 μM ATP in the presence or absence of 10–20 μM Wsp1-VCA, 45–50 μM Dip1, and 15 μM LatA-actin, as indicated. Reactions were incubated for 1 min at room temperature. Error bars show standard deviation. p-values: **<0.1, ***<0.001. (C) Western blot of GST-Wsp1-VCA pulldown assays. Binding reactions contained 235 μM GST-Wsp1-VCA on glutathione sepharose beads, 50 μM Dip1, 9.1 μM SpArp2/3(Arp3ΔC) complex, and 25 μM LatB-actin (from rabbit skeletal muscle) as indicated. The SpArp2/3(Arp3ΔC) mutant complex was used for these assays because it binds more tightly to Wsp1-VCA (Rodnick-Smith et al., 2016a). (D) Quantification of the fraction of Dip1 pelleted in reactions described in C. Error bars show the mean with standard deviation.
Figure 5
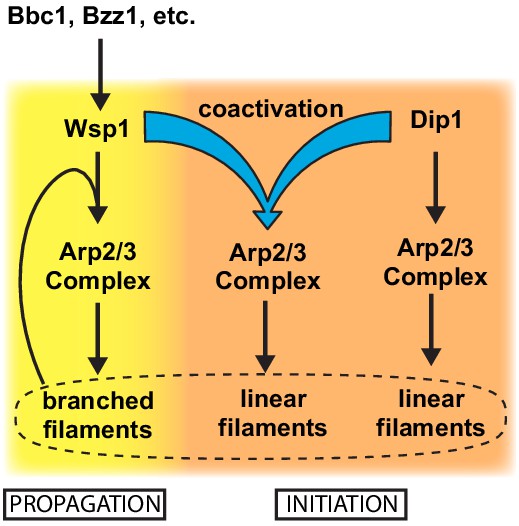
Dip1 and Wsp1 regulation may be coordinated through co-activation of Arp2/3 complex.
Schematic of the activation pathways of Arp2/3 complex by Dip1 and Wsp1. Nucleation of linear actin filaments by Arp2/3 complex is critical for initiation of actin networks, while branching nucleation promotes propagation of actin networks. Regulatory factors required for Wsp1 activation can indirectly trigger Dip1 activity by stimulating co-activation of Arp2/3 complex by both nucleation promoting factors.
Tables
Key resources table
| Reagent type (species) or resource | Designation | Source or reference | Identifiers | Additional information |
|---|---|---|---|---|
| Antibody | Anti-Dip1 (rabbit polyclonal) | GenScript (custom) | n/a | WB (1:5000) |
| Antibody | Anti-ScArp3 (goat polyclonal) | Santa Cruz | Cat# sc-11973 | WB (1:1000) |
Additional files
-
Supplementary file 1
Summary of the fits of maximum polymerization rate data in Figure 2 panel B,H and Figure 3 panel F.
The best-fit values for the maximum polymerization rate at saturation (Max. Poly. Ratesat) and the concentration of Dip1 (µM) needed to reach half-saturated max polymerization rate for Dip1 alone or in the presence of Wsp1-VCA, GST-Wsp1-VCA, or Wsp1-CA. Data were fit to the following equation: Max poly rate = (max poly ratemax× [Dip1])/(K1/2 + [Dip1]) + y-intercept. The y-intercept was set as the maximum polymerization rate in the absence of Dip1 for each condition.
- https://cdn.elifesciences.org/articles/60419/elife-60419-supp1-v2.docx
-
Supplementary file 2
Summary of values used in simulations of actin polymerization time courses in Figure 3.
Rate constants were set based on previous published values or optimization of parameters using simple models generated in this study, as described in the main text and methods or indicated by the given reference. Units for kon are M−1s−1 except for reactions 4, 5, 6, and 11 where the units are s−1. * indicates that a range of values for these parameters can yield a good fit to the experimental data (see Figure 3—figure supplement 2).
- https://cdn.elifesciences.org/articles/60419/elife-60419-supp2-v2.docx
-
Supplementary file 3
Comparison of optimized (fitted) values using single monomer-binding model to simulate polymerization time courses in the presence or absence of Wsp1.
The table depicts a subset of Supplementary file 2 reaction rate constants that were floated in the one monomer-binding model to determine the best fit parameter values for datasets with Arp2/3 complex and Dip1 with or without Wsp1. Units for kon are M−1s−1 except for reaction 11, where units are s−1. * indicates that a range of values can yield a good fit to the experimental data (see Figure 3—figure supplement 2).
- https://cdn.elifesciences.org/articles/60419/elife-60419-supp3-v2.docx
-
Supplementary file 4
Schizosaccharomyces pombe and Saccharomyces cerevisiae strains used in this study.
- https://cdn.elifesciences.org/articles/60419/elife-60419-supp4-v2.docx
-
Transparent reporting form
- https://cdn.elifesciences.org/articles/60419/elife-60419-transrepform-v2.docx
Download links
A two-part list of links to download the article, or parts of the article, in various formats.
Downloads (link to download the article as PDF)
Open citations (links to open the citations from this article in various online reference manager services)
Cite this article (links to download the citations from this article in formats compatible with various reference manager tools)
Synergy between Wsp1 and Dip1 may initiate assembly of endocytic actin networks
eLife 9:e60419.
https://doi.org/10.7554/eLife.60419


