Myogenin is an essential regulator of adult myofibre growth and muscle stem cell homeostasis
- Randall Centre for Cell and Molecular Biophysics, King’s College London, United Kingdom
- Blizard Institute, Barts and The London School of Medicine and Dentistry, Queen Mary University of London, United Kingdom
Figures
Figure 1 with 1 supplement
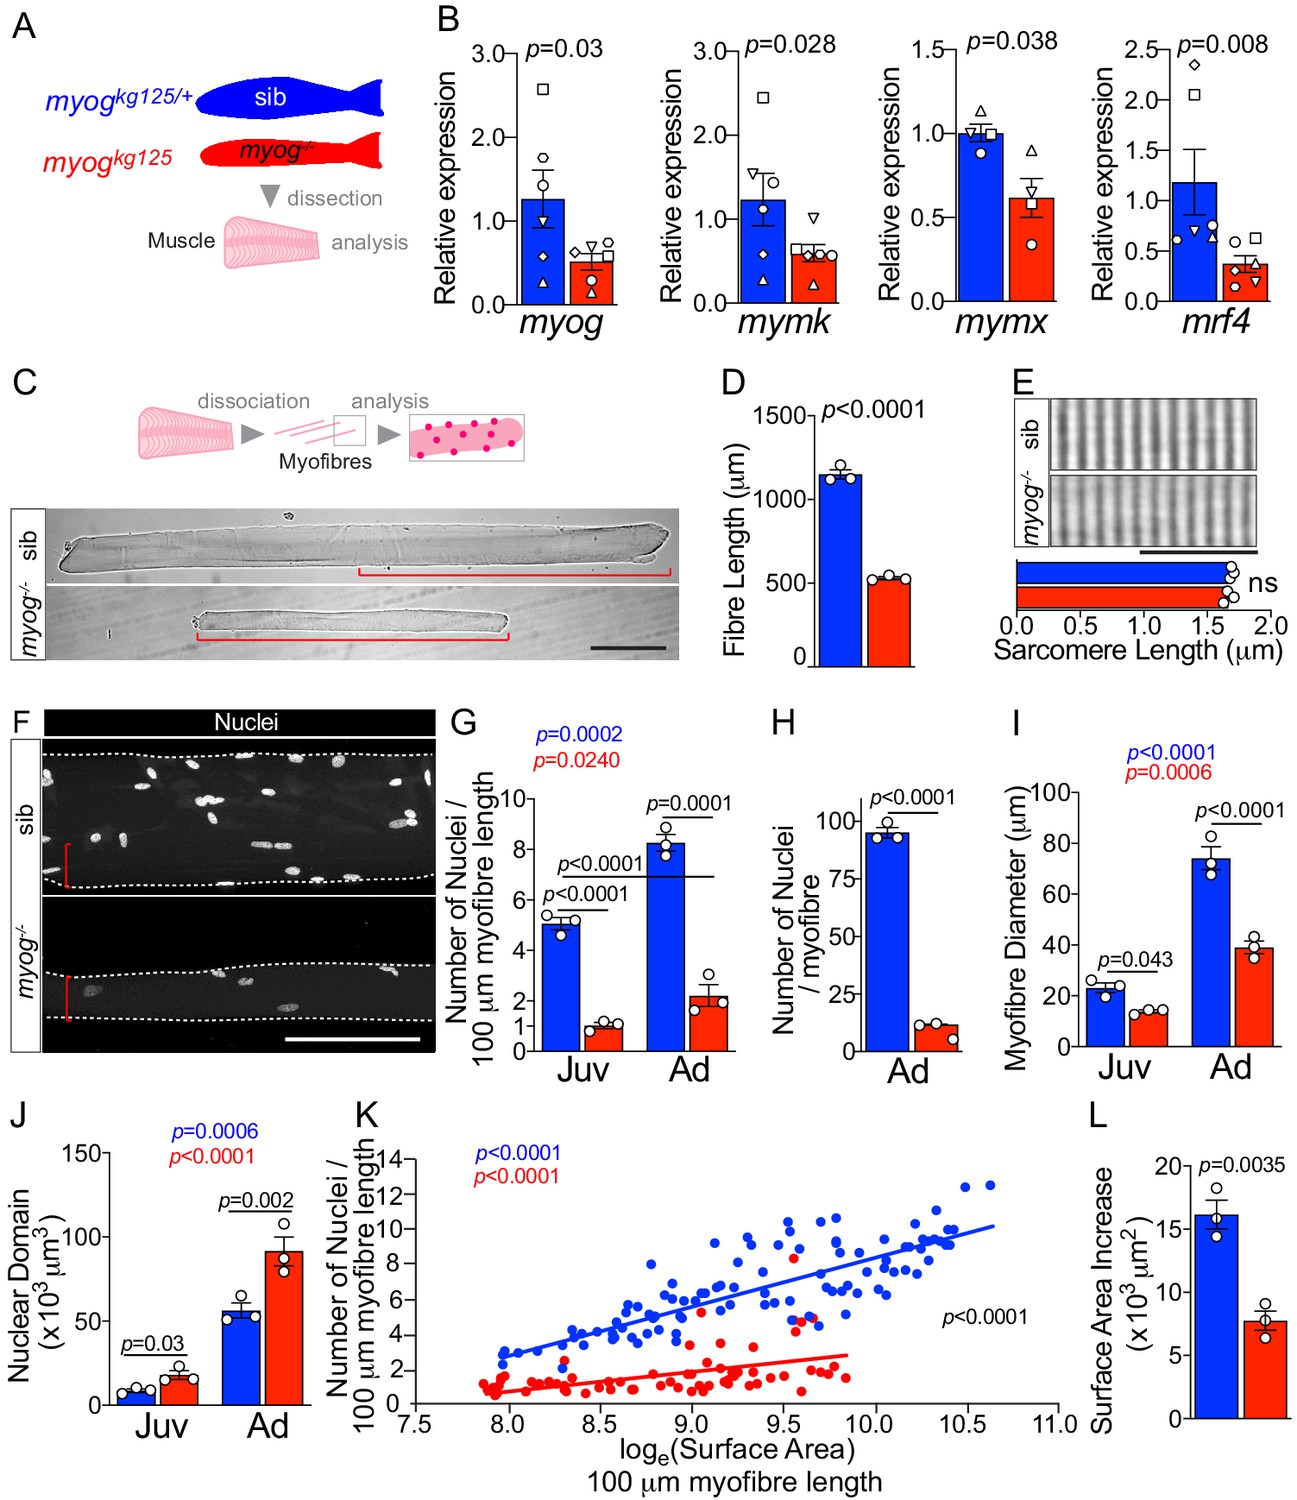
Myogenin is required for normal myofibre size and nuclear accretion.
(A) Schematic of trunk muscle processing for analysis, pink represents fish fillet. Colours identify sib (myogkg125/+, blue) or myog-/- (myogkg125, red) samples throughout the figure. (B) qPCR analysis shows downregulation of myog, mymk, mymx and mrf4 mRNAs in adult myog-/-. Symbol shapes denote paired sib and myog-/- samples, n = 4–6 fish/genotype, paired t-test. (C) Schematic of myofibre isolation for morphometric analysis (top) and representative images (bottom) showing smaller myog-/- myofibre (red brackets) compared to age-matched sib. Scale bar = 100 μm. (D) Measure of absolute myofibre length, n = 3 fish/genotype, n = 110–120 myofibres/fish, unpaired t-test. (E) Representative images and measure of unaltered sarcomere length on freshly isolated myofibres, n = 3 fish/genotype, n = 10 myofibres/fish, unpaired t-test. Scale bar = 10 µm. (F) Representative images of isolated fixed adult myofibres show size reduction in myog-/- (red brackets). Scale bar = 100 µm. (G–J) Quantification of number of nuclei/100 µm (G), absolute number of nuclei per myofibre (H), myofibre diameter (I), and nuclear domain size (myofibre volume per nucleus) (J) showing significant changes in myofibres from juvenile (Juv, 1 month-old) and adult (Ad, 8 months-old) stages within (coloured p) or among (black p) genotypes. n = 3 fish/genotype, n = 30–50 adult myofibres/fish, n = 15–20 juvenile myofibres/fish, one-way ANOVA. (K) Relationship of number of nuclei and loge(Surface Area) indicates different growth mode between sib and myog-/- (i.e. significant slope difference, black p), despite significant correlation of loge(SA) with nuclear number within genotype (coloured p) (see Materials and methods). (L) Increase in Surface Area (SA) from juvenile to adult stage (=Ad_SA – Juv_SA) indicates reduced growth rate in myog-/-. Data from Figure 1—figure supplement 1E, unpaired t-test. All graphs report mean ± SEM. Statistical significance within (coloured p) or between (black p) genotypes is indicated.
Figure 1—figure supplement 1

Myogkg125 mutant adult and juvenile myofibres are smaller.
(A) Fraction of adult myofibres (%) with indicated length in sib (blue, myogkg125/+) and myog-/- (red, myogkg125). n = 3 fish/genotype, n = 110–120 myofibres/fish, p-value indicates probability of rejecting null hypothesis of no difference between myog-/- and sib in χ2 test. (B) Measurement of 1-month-old juvenile myofibre length, n = 3 fish/genotype, unpaired t-test (left) and fraction of juvenile myofibres (%) with indicated length in sib (blue) and myog-/- (red), n = 3 fish/genotype, n = 15–20 juvenile myofibres/fish, p-value indicates probability of rejecting null hypothesis of no difference between myog-/- and sib in χ2 test. (right). (C) Measure of absolute adult myofibre length, n = 3 fish/genotype, n = 100 myofibres/fish, unpaired t-test; sib (blue, myogfh265/+), hypomorphic mutant (cyan, myogfh265). (D) Representative images showing sib and myog-/- juvenile myofibres (left), scale bar = 100 µm. Quantification of absolute number of nuclei per juvenile myofibre. n = 3 fish/genotype, n = 15–20 myofibres/fish, unpaired t-test. (E–F) Quantification of average surface area/100 µm myofibre length (E) and SADS (Surface Area Domain Size) (F) showing significant changes at juvenile (Juv) and adult (Ad) stages within (coloured p) or among (black p) genotypes. n = 3 fish/genotype, n = 30–50 adult myofibre/fish, n = 15–20 juvenile myofibre/fish, one-way ANOVA.
Figure 2 with 1 supplement

Lack of Myogenin alters MuSC number and localisation.
Colours identify sib (blue) or myog-/- (red) samples throughout the figure. (A) qPCR analysis showing upregulation of pax7a, pax7b, myf5 and unaltered myod in adult myog-/- mutant muscle. Symbol shapes denote paired sib and myog-/- samples, n = 6 fish/genotype, paired t-tests. (B) Schematic of myofibre isolation for GFP+ve cells analysis from pax7a:GFP;myog-/- and sib muscles. (C) Representative images showing GFP+ve cells on sib (blue arrowhead) or myog-/- (red arrowheads) on isolated myofibres. Scale bar = 100 µm. (D) Representative immunodetection of GFP (green), DP312 (Pax3/Pax7; magenta) and nuclei (white) on GFP+ve (positive, green panel) cells or GFP-ve (negative, grey panel) nuclei on freshly isolated adult sib or myog-/- myofibres. Scale bar = 5 µm. Quantification of DP312 immunostaining on pax7a:GFP MuSCs confirms the stem cell identity of both sib (n = 36/genotype) and myog-/- (n = 67/genotype) GFP+ve cells, n = 3 fish/genotype unpaired t-test. (E,F) Quantification of absolute number of GFP+ve cells (bona fide MuSC) per myofibre and myonuclear domain size. n = 3 fish/genotype, n = 20–30 myofibres/fish, unpaired t-test. (G) Pie charts showing the fraction of nuclei (left) and fraction of myofibres (right) with the indicated number of nuclei in GFP+ve cells (left) or cells/myofibre (right) in sib (blue circles) and myog-/- (red circles). Data from Figure 2—figure supplement 1G. p-values indicate probability of rejecting null hypothesis of no difference between myog-/- and sib in χ2 tests. (H) Diagram of measurement of GFP+ve cell distance from nearest myofibre-end (top). Each myofibre was segmented into tenths, where 1/10 and 5/10 corresponded to the segments nearest to and furthest from the myofibre-end, respectively. Quantification of fraction of MuSC located within each myofibre segment (bottom, see Materials and methods and Figure 2—figure supplement 1H). n = 3 fish/genotype, n = 30–50 MuSCs, p-value indicates probability of rejecting null hypothesis of no difference between myog-/- and sib in χ2 test. (I) Representative images showing localisation of the GFP+ve cell on sib (blue rectangle) or myog-/- (red rectangle) mono-MuSC myofibres (with only one GFP+ve cell). Scale bar = 100 μm (=20 µm in 2x-zoom). (J) Quantification of fraction of MuSC located within each 10 µm segment from mono-MuSC myofibre-end. n = 3 fish/genotype, n = 15–25 MuSCs, black p-value indicates probability of rejecting null hypothesis of no difference between myog-/- and sib in χ2 test. Coloured p-values indicate one-way ANOVA analysis of non-random MuSC distribution in 10 µm segments within each genotype. Magenta inset reports fraction of sib and myog-/- MuSC within the 0–9 and 10–19 µm segments, unpaired t-test. Symbols show results for individual fish. All graphs report mean ± SEM.
Figure 2—figure supplement 1
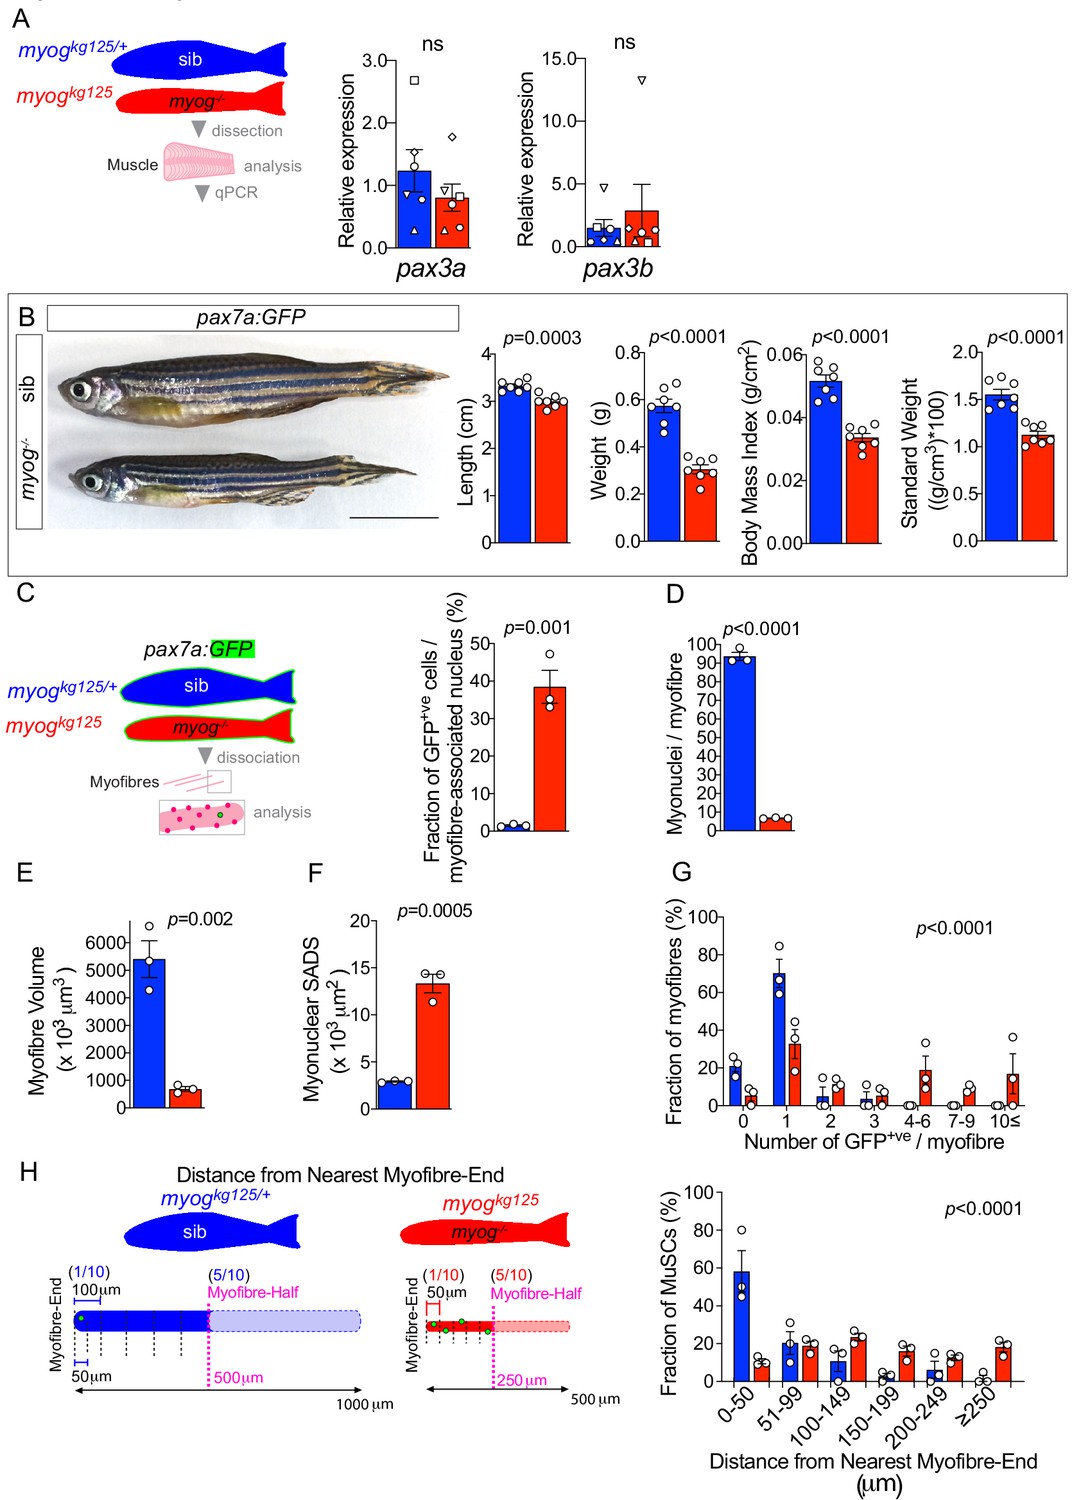
pax7a:GFP;myogkg125 muscle is smaller and displays altered MuSC cellularity and unchanged Pax3 genes expression.
(A) Schematic of trunk muscle processing for qPCR analysis (left), sib (blue), myog-/- (red). Expression of pax3a and pax3b mRNAs is unchanged in myog-/- muscle (right). Symbol shapes denote paired sib and myog-/- samples, n = 6 fish/genotype, paired t-test. (B) Representative images of adult pax7a:GFP;myog+/- (sib) and pax7a:GFP;myog-/- (left). Scale bar = 1 cm. Quantification showing reduced length, weight, body mass index and standard weight in myog-/- compared to co-reared sibs (right), n = 7, unpaired t-test. (C) Schematic of pax7a:GFP adult trunk muscle processing for MuSC analysis (left). Fraction of GFP+ve cells (bona fide MuSCs) per myofibre-associated nucleus is significantly increased in myog-/- muscle (right). n = 3 fish/genotype, unpaired t-test. (D) Quantification of absolute number of (non-MuSC, GFP-ve) myonuclei per adult myofibre. n = 3 fish/genotype, n = 20–30 myofibres/fish, unpaired t-test. (E,F) Quantification of absolute myofibre volume and myonuclear SADS (Surface Area Domain Size). n = 3 fish/genotype, n = 20–30 myofibres/fish, unpaired t-test. (G) Fraction of myofibres (%) with indicated number of GFP+ve cells (MuSCs), n = 3 fish/genotype, n = 20–30 myofibres/fish,p-value indicates probability of rejecting null hypothesis of no difference between myog-/- and sib in χ2 test. (H) Schematic of GFP+ve cell distance to nearest myofibre-end measurement (left). Note that while average half-length (in magenta) of sib myofibre (blue diagram) is 500 µm, myog-/- myofibre average half-length is 250 µm (red diagram). To compare absolute distance to myofibre-end, each myofibre was segmented into 50 µm segments and the fraction of GFP+ve cells (%) within each distance segment from nearest myofibre-end plotted, n = 3 fish/genotype, n = 20–30 MuSCs/fish, p-value indicates probability of rejecting null hypothesis of no difference between myog-/- and sib in χ2 test. Note that in sibs almost no GFP+ve MuSCs were located in the central 50% of their myofibre. All graphs report mean ± SEM.
Figure 3 with 1 supplement
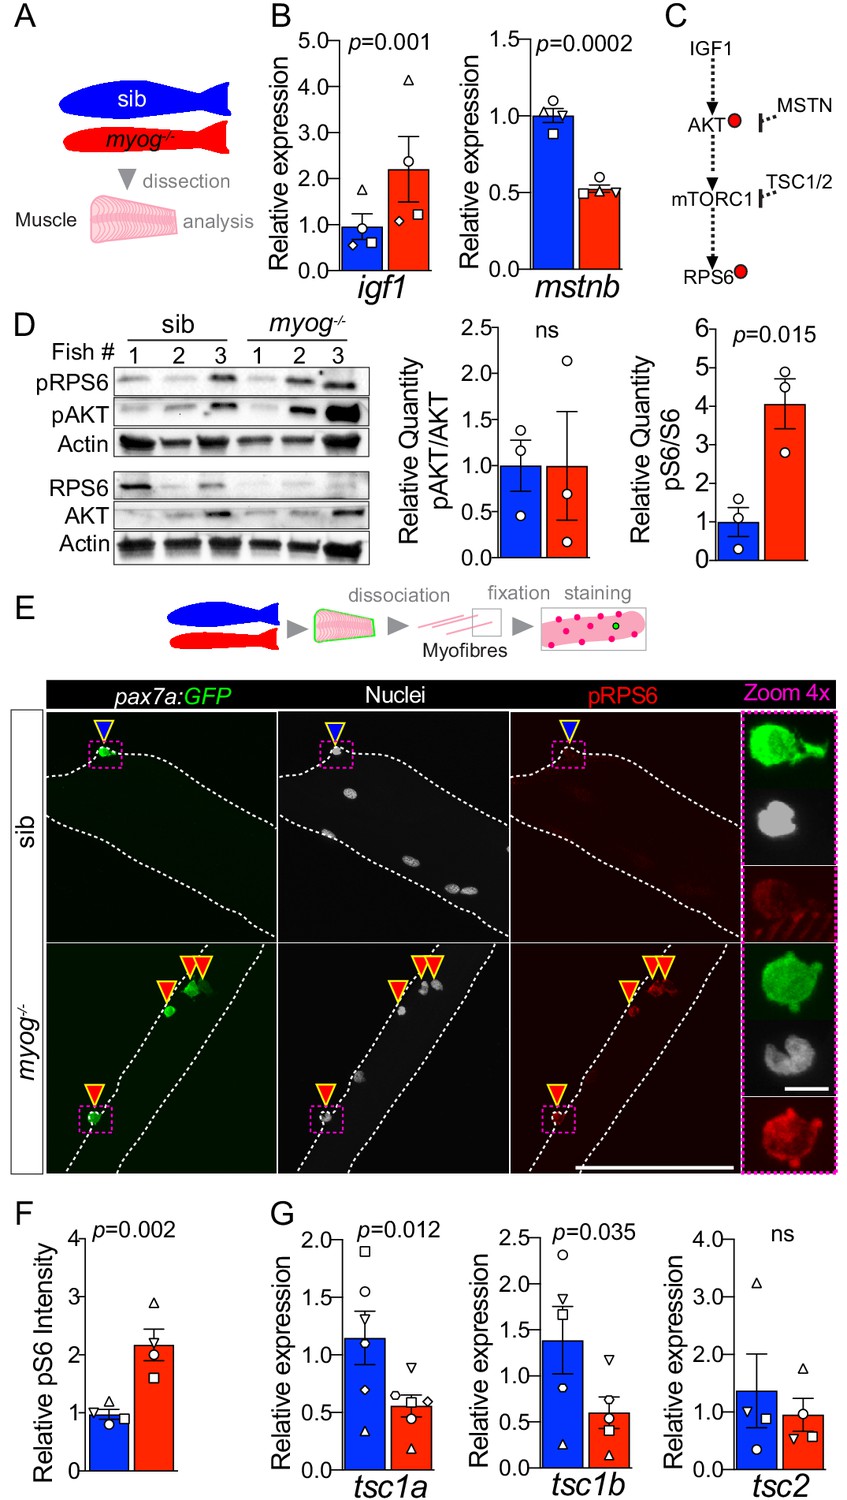
Myog-/- mutant muscle and MuSCs display enhanced mTORC1 signalling.
(A) Schematic of adult trunk muscle processing for analysis. Colours identify sib (blue) or myog-/- (red) samples throughout the figure. (B) qPCR analysis shows upregulation of igf1 and downregulation of mstnb in myog-/- muscle. Symbol shapes denote paired sib and myog-/- samples, n = 4 fish/genotype, paired t-test. (C) Summary of mTORC1 pathway with analysed components, positive (arrows) or negative (bars) effects are indicated. Dashed lines indicate other molecules involved; red dots represent phosphorylation events. (D) Western blot (left) and quantification (right) of phosphorylated/pan AKT (pAKT, Ser473) ratio and phosphorylated/pan RPS6 (pRPS6, Ser240/244). pRPS6 is increased in myog-/- muscle, n = 3 fish/genotype, unpaired t-test. Actin immunoreactivity was used to normalise pan and phospho signals to protein loading prior to calculation of sample-specific phospho/pan ratio. (E) Representative images of myofibre immunostained for GFP (green), pRPS6 (red) and nuclei (white) fixed freshy immediately after isolation. Arrowheads indicate MuSCs on sib (blue) or myog-/- (red) myofibres. Dashed magenta squares highlight 4x-magnified cells. Scale bar = 100 µm (=5 µm in 4x-zoom). (F) Quantification of pRPS6 intensity shows increase in myog-/- MuSCs. Symbol shapes denote paired sib and myog-/- samples, n = 4 fish/genotype, n = 20–30 MuSCs/fish, paired t-test. (G) qPCR analysis showing downregulation of tsc1a and tsc1b mRNAs but unaltered tsc2 mRNA in myog-/- muscle. Symbol shapes denote paired sib and myog-/- samples, n = 4–6 fish/genotype, paired t-test. All graphs report mean ± SEM.
Figure 3—figure supplement 1

Myog-/- mutant muscle displays unaltered igfr1a and igfr1b mRNA expression.
Schematic of adult trunk muscle processing for qPCR analysis (left). Summary of mTORC1 pathway with analysed members, positive (arrows) or negative (bars) effects are indicated (centre). Dashed lines indicate other molecules involved, plain arrow indicate direct effect, red dots represent phosphorylation. Igfr1a and igfr1b are unchanged in myog-/- muscle compared to sib (right). Symbol shapes denote paired sib and myog-/- samples, n = 5 fish/genotype, paired t-test.
Figure 4 with 1 supplement
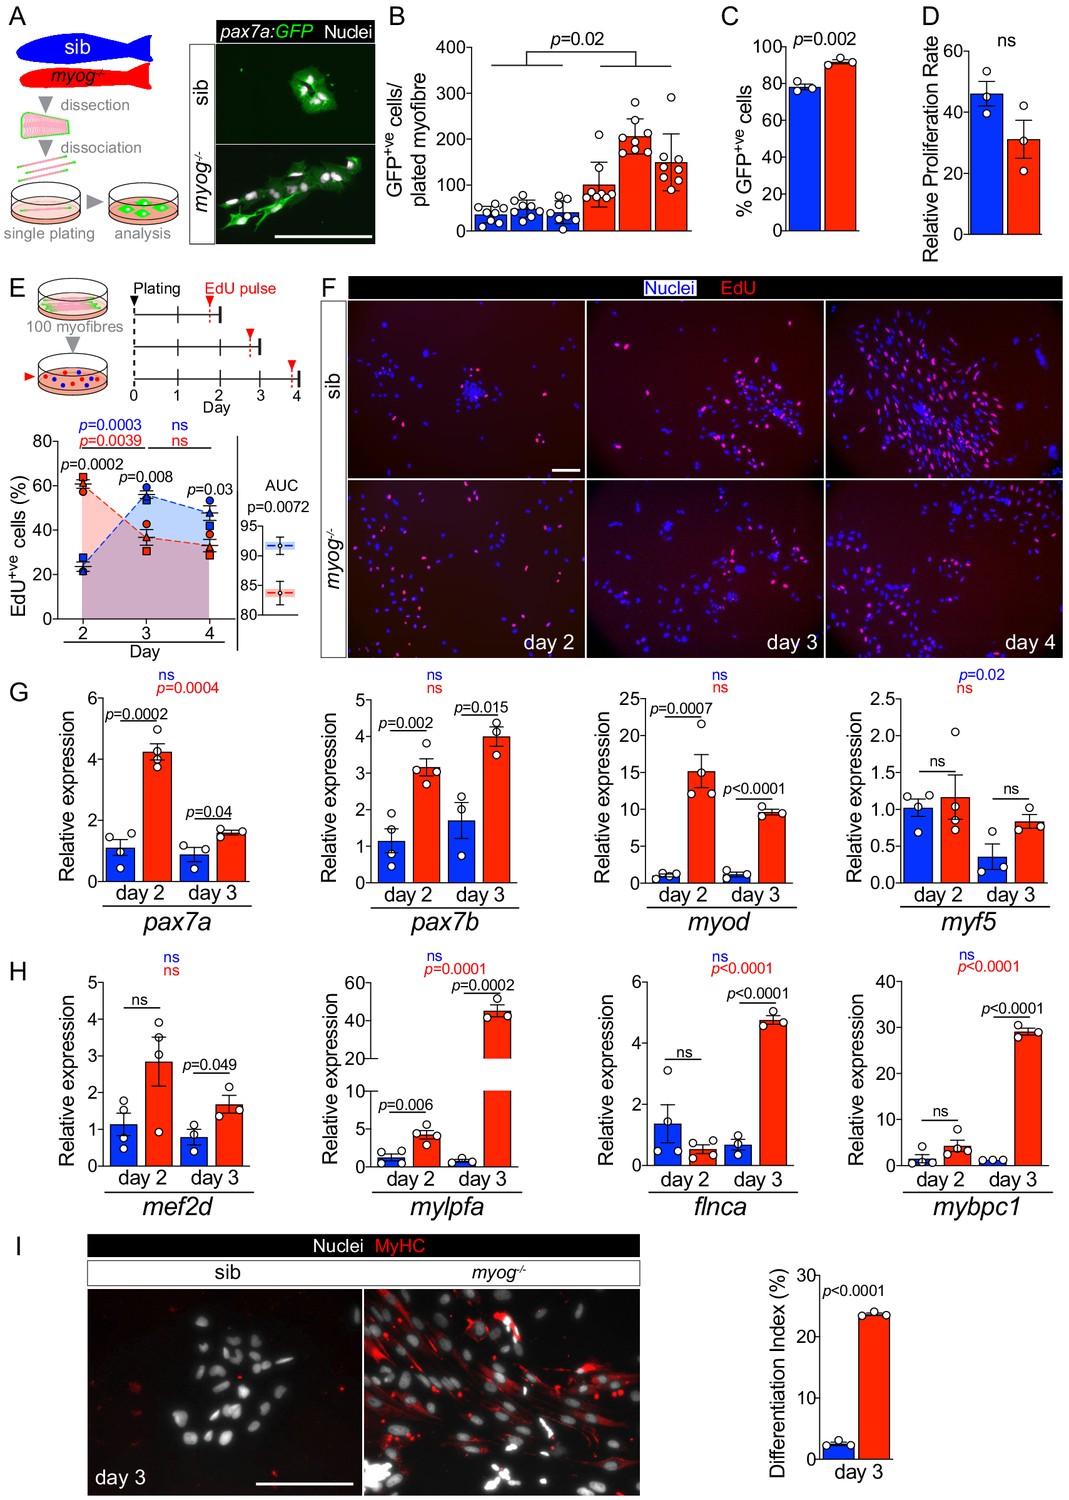
Myog-/- mutant MPCs exhibit faster entrance into proliferation phase.
(A) Schematic of adult single myofibre culture and representative immunodetection of GFP (green) and nuclei (white) on cultured MPCs. Colours identify sib (blue) or myog-/- (red) samples throughout the figure. (B) Quantification of GFP+ve cells obtained by single myofibre culture revealed increased MPCs yield from myog-/- after 4 days in growth medium, n = 3 fish/genotype, n = 8 myofibres/fish. Unpaired t-test on average MPCs/fish/genotype. (C) Fraction of GFP+ve cells out of total number of cells obtained in B. n = 3 fish/genotype, unpaired t-test. (D) Relative proliferation rate of sib or myog-/- MPCs calculated as the ratio of the average number of GFP+ve MPCs/plated-myofibre obtained on day 4 in culture divided by the average number of GFP+ve MuSCs/myofibre, unpaired t-test. (E) Diagram of myofibres culture and EdU pulse regime (top). Quantification of fraction of EdU+ve MPCs at indicated time points (bottom left), symbol shapes denote MPCs obtained from paired sib and myog-/- samples, n = 3. Measurement of Area Under Curve (AUC, coloured area underneath dashed blue or red lines) to compare overall proliferation dynamics indicates reduction in myog-/- MPCs (bottom right), unpaired t-test. (F) Representative images of sib and myog-/- MPC numbers and EdU incorporation at indicated times in culture, showing detection of EdU (red) and nuclei (blue). (G) qPCR analysis showing expression dynamics of pax7a, pax7b, myod and myf5 mRNAs in sib and myog-/- MPCs cultured for 2 (n = 4) or 3 days (n = 3), unpaired t-test. (H) qPCR analysis indicating upregulation of mef2d, mylpfa, flnca and mybpc1 mRNAs in myog-/- MPCs cultured in growth medium for 2 (n = 4) or 3 days (n = 3), unpaired t-test. (I) Representative immunodetection of MyHC (red) and nuclei (white) on sib or myog-/- MPCs at 3 days in growth medium for 3 days (left). Extent of differentiation (Index (%), see Materials and methods) is higher in myog-/- than in sib MPCs (right). All graphs report mean ± SEM. Statistical significance within (coloured p) or between (black p) genotypes is indicated. Scale bars = 100 µm.
Figure 4—figure supplement 1
Characteristics of cultured MPCs and mRNA analysis.
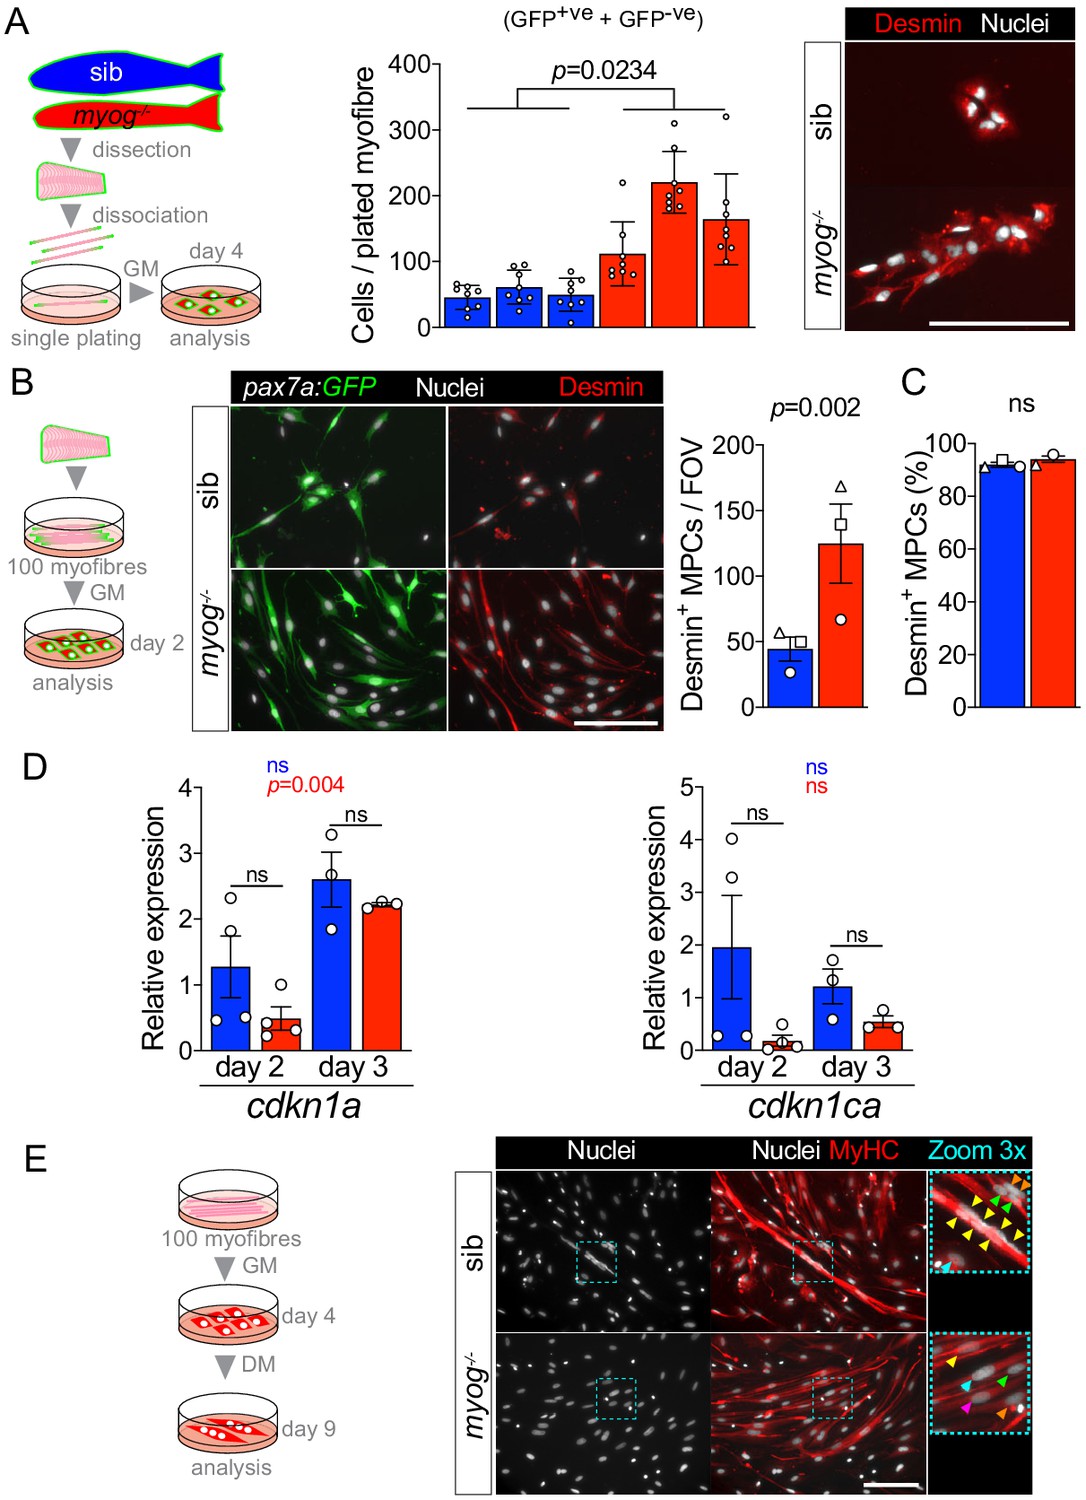
(A) Schematic of single myofibre culture and analysis of derived MPCs after 4 days from plating in growth medium (left). Total number of cells (= GFP+ve + GFP-ve) is increased in myog-/- (centre). n = 3 fish/genotype, n = 8 myofibre/fish. Unpaired t-test on average number of cells/fish/genotype. Representative immunostaining of Desmin (red) and nuclei (white) confirming myogenic identity of both sib and myog-/- cells from single-plated myofibres at 4 days (right). (B) Schematic of 90–100 myofibres culture in growth medium (GM) and analysis of derived MPCs (left). Representative immunostaining of Desmin (red), GFP (green) and nuclei (white) confirming myogenic identity of both sib and myog-/- cells after 2 days of culture (centre). Myog-/- myofibres yielded higher number of Desmin+ MPCs per field of view (FOV). Symbol shapes denote paired sib and myog-/- samples, n = 3 fish/genotype, paired t-test (right). (C) 90–100 myofibres cultured from each genotype yielded over 90% of Desmin+ cells, confirming high purity of the MPC population, n = 3 fish/genotype, unpaired t-test. (D) qPCR analysis shows expression dynamics of cdkn1a (p21) and cdkn1ca (p57) mRNAs in sib and myog-/- MPCs cultured for 2 (n = 4) or 3 days (n = 3), unpaired t-test. Statistical significance within (coloured p) or between (black p) genotypes is indicated. (E) Schematic of 90–100 myofibres culture and analysis of derived MPCs cultured for 5 days in differentiation medium (DM), following expansion for 4 days in growth medium (GM) (left). Representative immunostaining of MyHC (red), nuclei (white) confirming that fusion into multinucleated myotubes occurred only in sib MCPs, whereas differentiated myog-/- cells remained mostly mononucleated, as reported previously (Ganassi et al., 2018) (right). Dashed cyan squares highlight 3x-magnified cells, coloured arrowheads indicate nuclei of each separate differentiated cell. All graphs report mean ± SEM. Scale bars = 100 µm.
Tables
Key resources table
| Reagent type (species) or resource | Designation | Source or reference | Identifiers | Additional information |
|---|---|---|---|---|
| Genetic reagent (D. rerio) | myogfh265, (AB) | Hughes/Moens Labs, Hinits et al., 2011 | myogfh265; RRID:ZFIN_ZDB-GENO-200128-7 | |
| Genetic reagent (D. rerio) | myogkg125, (TL) | Hughes Lab, Ganassi et al., 2018 | myogkg125/+ (sib) myog-/- (mut); RRID:ZFIN_ZDB-GENO-200128-8 | |
| Genetic reagent (D. rerio) | TgBAC(pax7a:GFP)t32239Tg, (AB) | Nüsslein-Volhard Lab, Mahalwar et al., 2014 | pax7a:GFP; RRID:ZFIN_ZDB-GENO-170316-2 | |
| Genetic reagent (D. rerio) | myogkg125;TgBAC (pax7a:GFP)t32239Tg, (AB) | This paper | pax7a:GFP;myogkg125 | Generated from outcrossing myogkg125 onto pax7a:GFP |
| Antibody | Anti-phospho-S6 ribosomal protein (Ser 240/244) (Rabbit monoclonal) | Cell Signalling | #5364; D68F8; RRID:AB_10694233 | (1:1000) IF (1:2000) WB |
| Antibody | Anti-S6 ribosomal protein (pan) (Mouse monoclonal) | Cell Signalling | #2317; 54D2; RRID:AB_2238583 | (1:1000) |
| Antibody | Anti-phospho-Akt (Ser473) (Rabbit monoclonal) | Cell Signalling | #4060; D9E; RRID:AB_2315049 | (1:1000) |
| Antibody | Anti-Akt (pan) (Mouse monoclonal) | Cell Signalling | #2920; 40D4; RRID:AB_1147620 | (1:1000) |
| Antibody | Anti-beta-Actin (Mouse monoclonal) | Sigma Aldrich | #A5316; AC-74; RRID:AB_476743 | (1:500) |
| Antibody | HRP goat-anti mouse IgG(H+L) (Goat polyclonal) | Sigma Aldrich | #AP308P; RRID:AB_92635 | (1:5000) |
| Antibody | HRP goat anti -abbit IgG (H+L) (Goat polyclonal) | Sigma Aldrich | #AP307P; RRID:AB_11212848 | (1:5000) |
| Antibody | Anti-Pax3/Pax7 DP312 (Mouse monoclonal) | Nipam Patel, UC Berkeley, USA | DP312 | (1:50) |
| Antibody | A4.1025 anti-Myosin heavy chain (Mouse monoclonal) | Hughes Lab, Blagden et al., 1997 Developmental Studies Hybridoma Bank (DSHB) Merck | DSHB #A4.1025; Merck #05–716; RRID:AB_309930 | (1:5) |
| Antibody | MF20 anti-Myosin heavy chain (Mouse monoclonal) | Developmental Studies Hybridoma Bank (DSHB) | #MF20; RRID:AB_2147781 | (1:300) |
| Antibody | Anti-Desmin (Mouse monoclonal) | Sigma Aldrich | #D8281; RRID:AB_476910 | (1:100) |
| Antibody | Anti-GFP (Chicken polyclonal) | Abcam | #13970; RRID:AB_300798 | (1:400) |
| Antibody | Alexa Fluor 488 goat anti-chicken IgY (H+L) (Goat polyclonal) | Invitrogen | #A11039; RRID:AB_2534096 | (1:1000) |
| Antibody | Alexa Fluor 555 goat anti-rabbit IgG (H+L) (Rabbit polyclonal) | Invitrogen | #A27039; RRID:AB_2536100 | (1:1000) |
| Other | Hoechst 33342 nuclear stain | Thermo Fisher | #H3570 | (10 µg/ml) |
| Commercial assay or kit | Click-iT Plus EdU Cell Proliferation Kit for Imaging, Alexa Fluor 594 dye | Invitrogen | #C10639 | Used according to supplier instruction |
| Software, algorithm | Generalised linear models (GLS) | Adapted from: Pinheiro et al., 2020; Zeileis, 2002; Ho et al., 2011 ; Sekhon, 2011 | Growth mode analysis |
Additional files
-
Supplementary file 1
List of qPCR primers used in the study.
- https://cdn.elifesciences.org/articles/60445/elife-60445-supp1-v2.docx
-
Transparent reporting form
- https://cdn.elifesciences.org/articles/60445/elife-60445-transrepform-v2.docx
Download links
A two-part list of links to download the article, or parts of the article, in various formats.
Downloads (link to download the article as PDF)
Open citations (links to open the citations from this article in various online reference manager services)
Cite this article (links to download the citations from this article in formats compatible with various reference manager tools)
Myogenin is an essential regulator of adult myofibre growth and muscle stem cell homeostasis
eLife 9:e60445.
https://doi.org/10.7554/eLife.60445


