Coupling between fast and slow oscillator circuits in Cancer borealis is temperature-compensated
- Biology Department and Volen Center, Brandeis University, United States
Figures
Figure 1
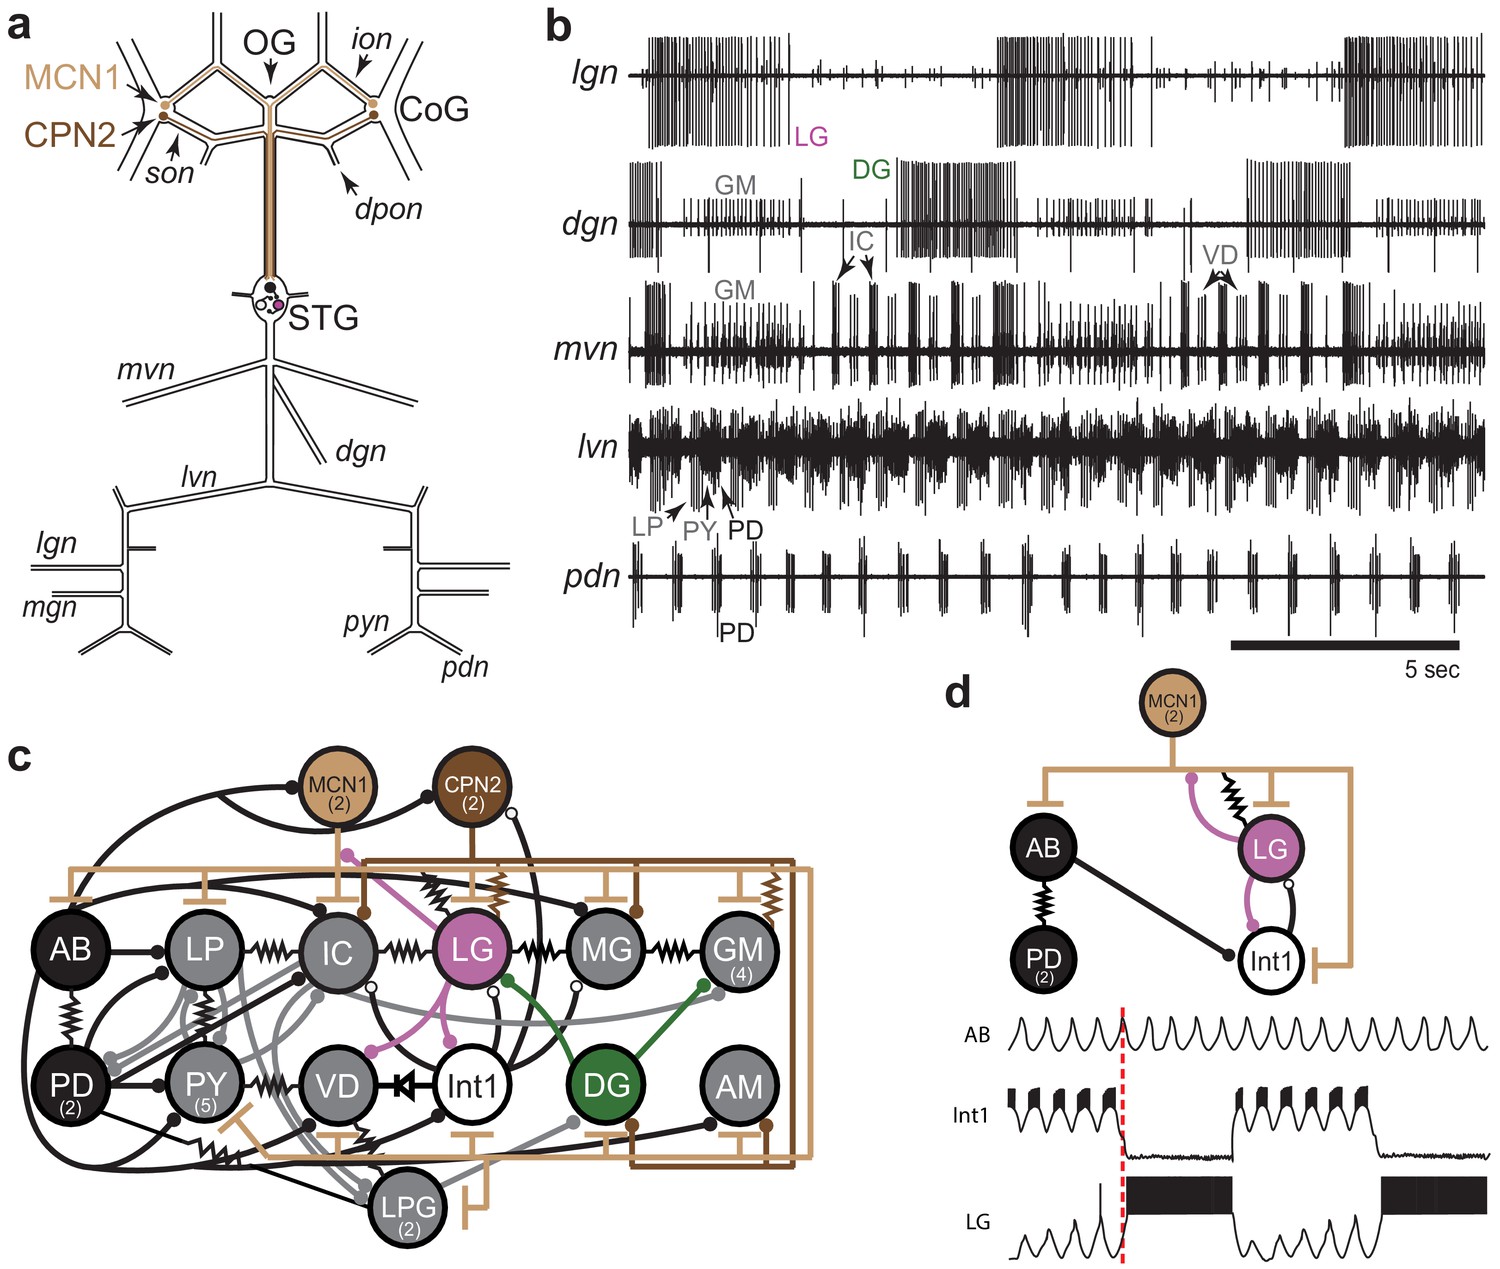
STG rhythmic motor patterns.
(a) Schematic of the STNS showing the locations of salient ganglia, nerves and projection neurons. Individual STG neurons are unambiguously identified on the basis of the motor nerves by which they project to specific stomach muscles. (b) Extracellular nerve recordings of both the gastric mill (lgn, dgn, mvn) and pyloric (lvn, pdn) rhythms. The gastric mill rhythm is seen as the alternating bursts of activity in the LG and DG neurons. The GM neurons are active late in the LG neuron burst. The IC and VD neurons are active in alternation with LG, but also show activity in time with the pyloric rhythm (lvn), with the PD neurons shown on the pdn. (c) Wiring diagram of the gastric mill, pyloric and gastropyloric neurons and the input they receive from MCN1 (tan) and CPN2 (brown; Marder and Bucher, 2007; Blitz, 2017). LG (pink) and DG (green) are both gastric mill neurons and AB-PD (black) are pyloric neurons. Colors used for these neurons are consistent in all figures. The resistor symbols denote electrical synapses, diode symbol denotes a rectifying junction, chemical inhibitory synapses are shown as filled circles and the T bars indicate chemical excitatory/modulatory synapses from MCN1. Neuron copy number is in parenthesis. (d) (Top) Simplified wiring diagram of MCN1 excitation of both pattern generating circuits and AB inhibition of Int1 (white; Coleman and Nusbaum, 1994; Bartos and Nusbaum, 1997). (Bottom) Cartoon voltage traces of AB, Int1 and LG, as they would appear during a gastric mill rhythm showing the relative burst timing between these neurons. As a consequence of a slow excitation from MCN1 to LG, the envelope of peak disinhibition of LG (from Int1) increases slowly over several cycles, eventually resulting in LG crossing threshold and bursting in time with the AB neuron. Note the slight delays between the peak of AB depolarization, the trough of Int1 inhibition from AB and the subsequent burst of LG as marked by the dashed line.
Figure 2 with 1 supplement
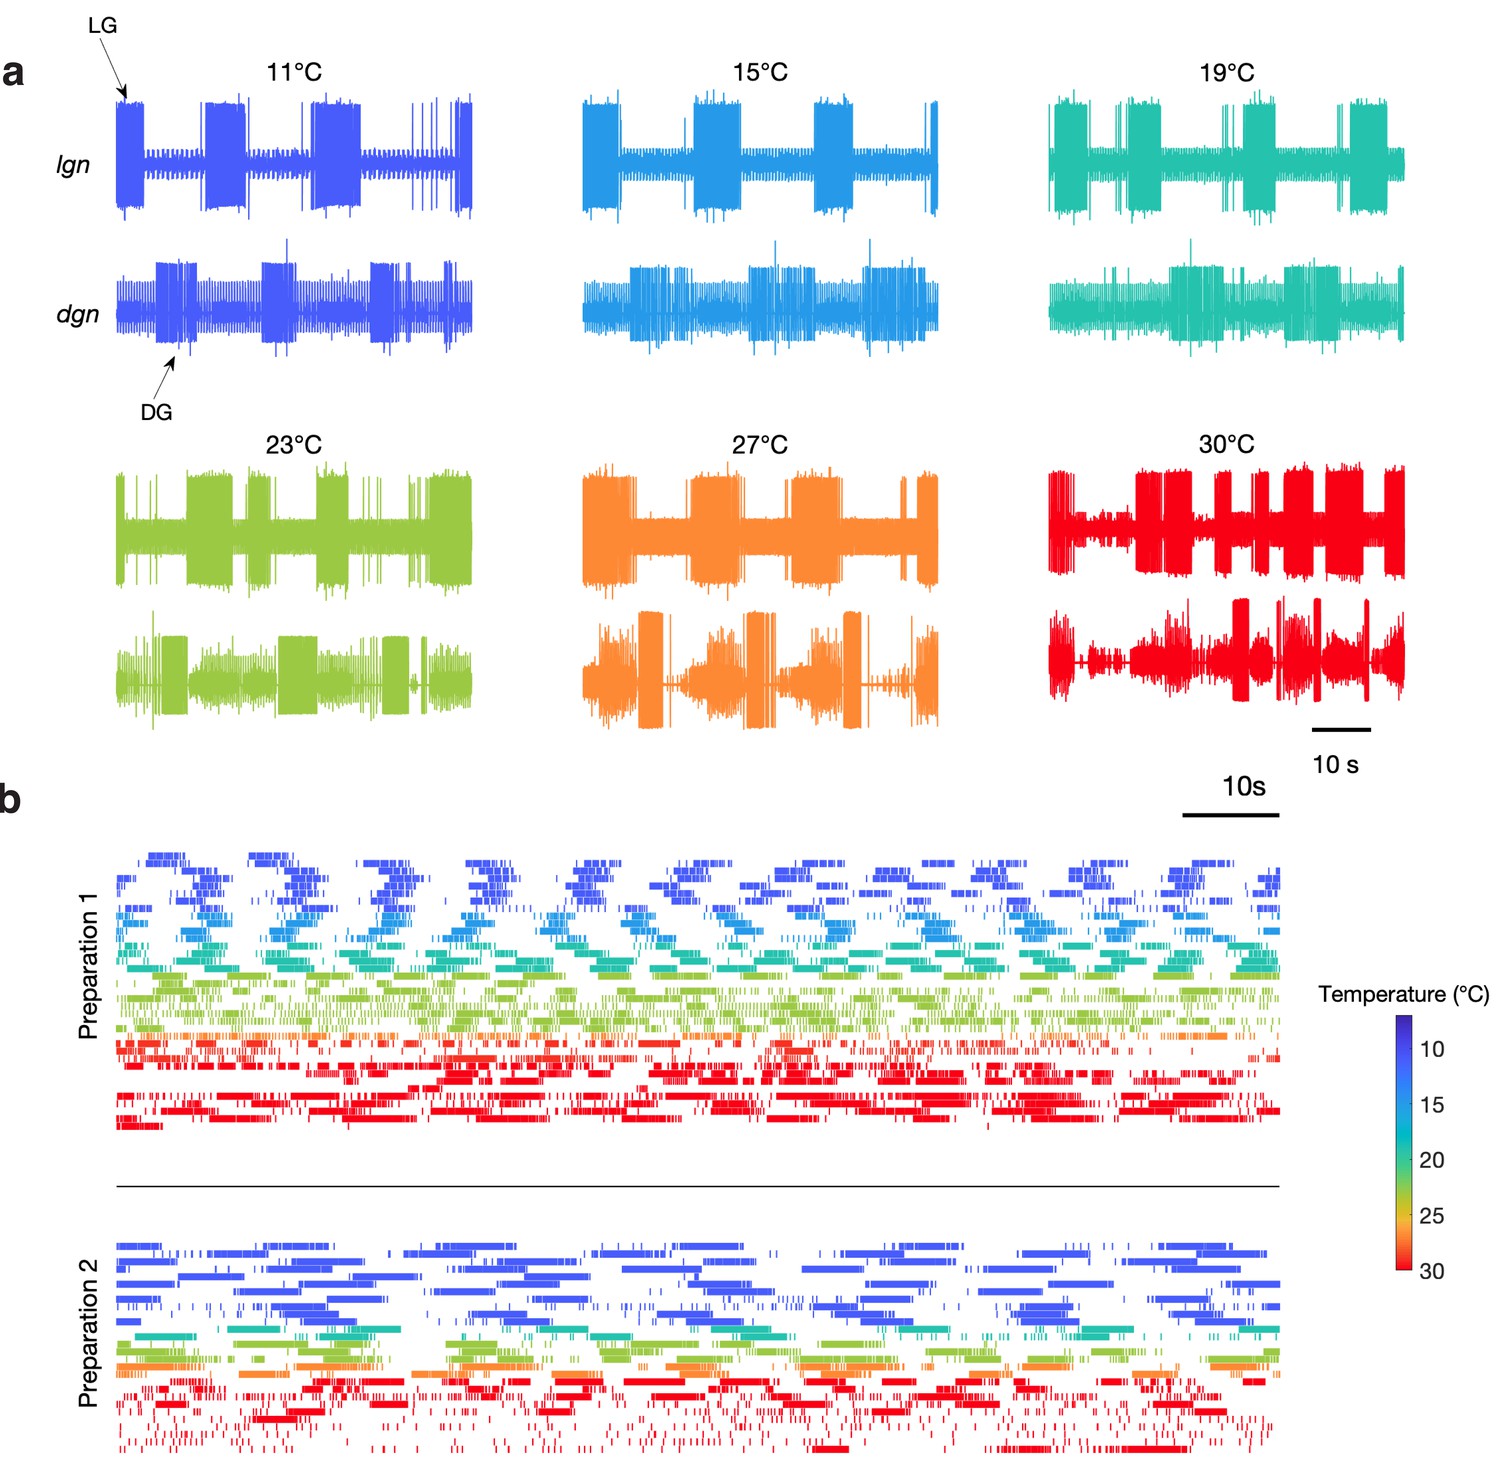
Spontaneous gastric mill rhythms over physiological temperature range.
(a) Extracellular recordings from the lgn and dgn at the temperatures indicated using the color code. (b) Spike rasters of LG from two preparations at the indicated colors to show the activity of these preparations over extended periods of time at the indicated temperatures. Traces in (a) and rasters in preparation 2 in (b) are from the same animal. Rasters with the same color are continuous recordings at the same temperature, and time wraps around the end of each raster and continues on the next line.
Figure 2—figure supplement 1

Spontaneous gastric activity in seven additional preparations.
Each panel shows rasters of the LG neuron from a single preparation at temperatures from 11°C to 30°C. Figure shows seven different preparations separated by black lines. LG was spontaneously active at temperatures as high as 30°C. Color of each row of raster indicates temperatures.
Figure 3 with 1 supplement
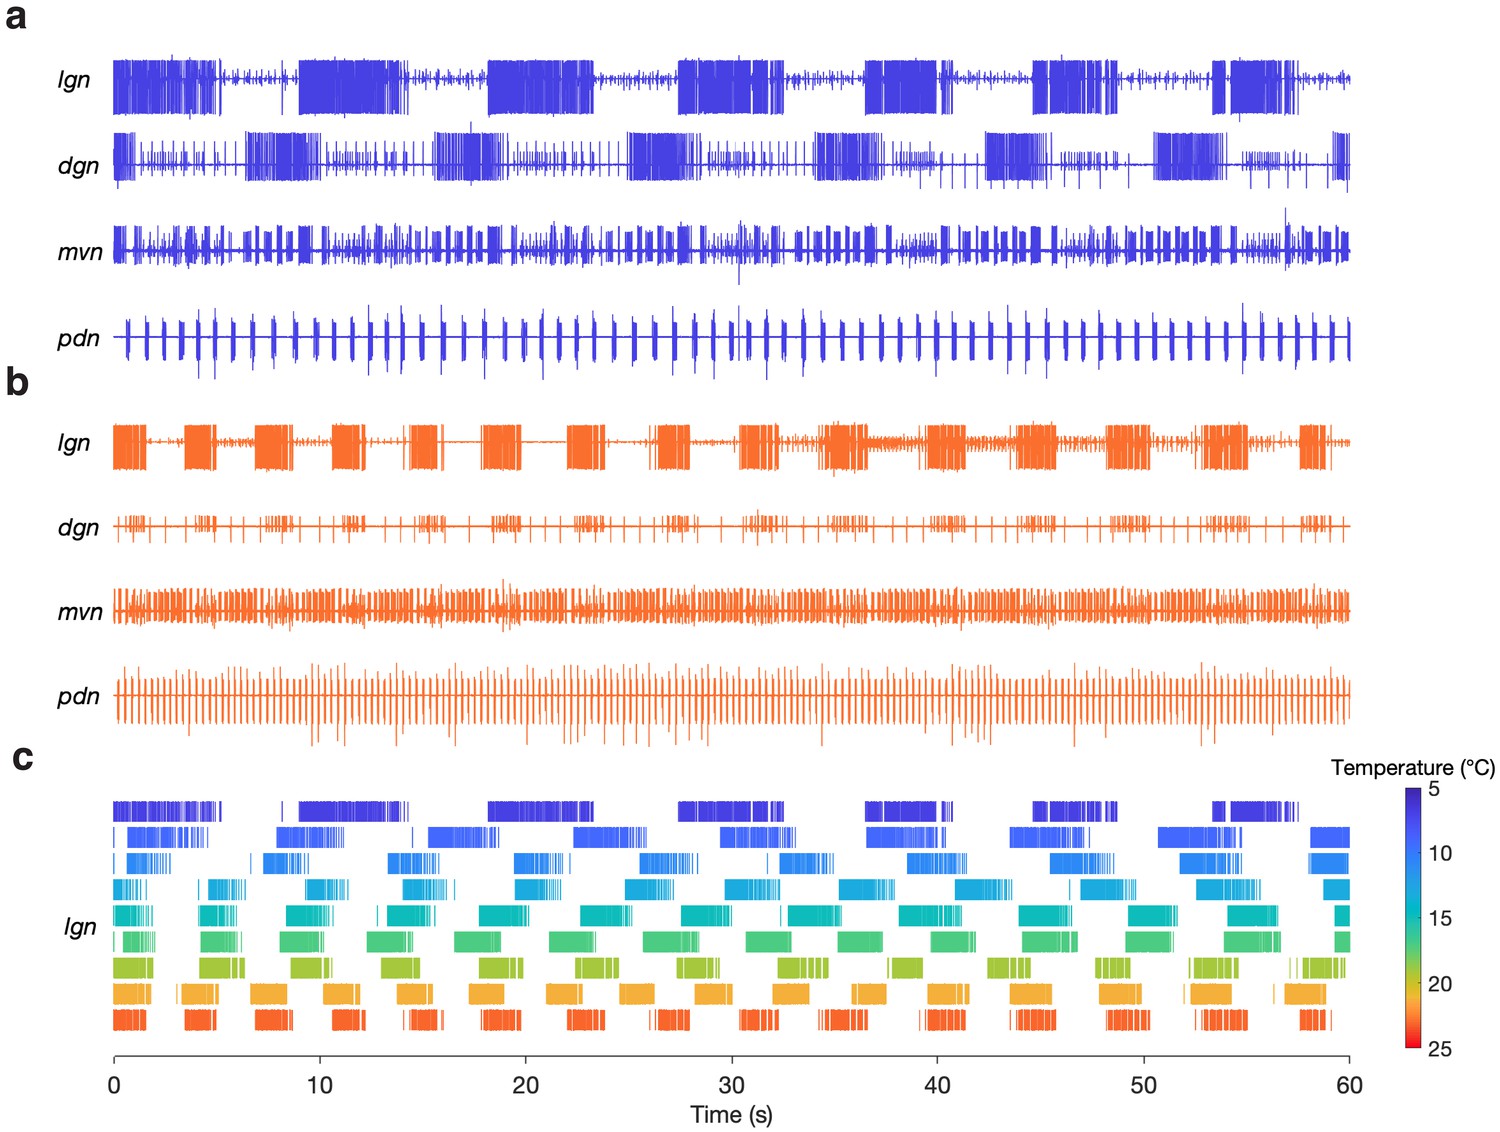
Gastric mill rhythms can be evoked by stimulation over physiological temperature range.
(a) Extracellular recordings from a preparation at 7°C (blue) and (b) 23°C (orange). Neuron action potentials described by their relative amplitudes on each nerve: lgn: LG (large bursting unit); dgn: DG (large, bursting unit; out of phase with LG: only on 7°C trace, has ceased bursting at 23°C), AGR (tonic), GM (small bursting unit; in-phase with LG); mvn: IC (large bursting unit), VD (medium bursting unit, antiphase with LG, alternates with IC), GM (small bursting unit; in-phase with LG); pdn: PD. (c) Spike rasters showing the activity of the LG neuron over the entire temperature range. The first row in (c) corresponds to (a) and the last row corresponds to (b).
Figure 3—figure supplement 1

Comparison of spontaneous and evoked gastric mill rhythms within the same preparation.
In 4 of 10 preparations, spontaneous gastric mill rhythms were observed at 11°C. (a) Extracellular traces showing activity on lgn, dgn, mvn and pdn nerves during spontaneous gastric mill activity (black) and after stimulation (blue). (b) Inter-spike intervals (ISIs) of LG neuron in the four preparations that showed spontaneous gastric mill activity. Black dots indicate ISIs from spontaneous activity and blue dots from evoked activity. (c) Comparison of burst period of LG during spontaneous and evoked bursting. Raw traces in (a) correspond to preparation 1 in (b).
Figure 4 with 2 supplements
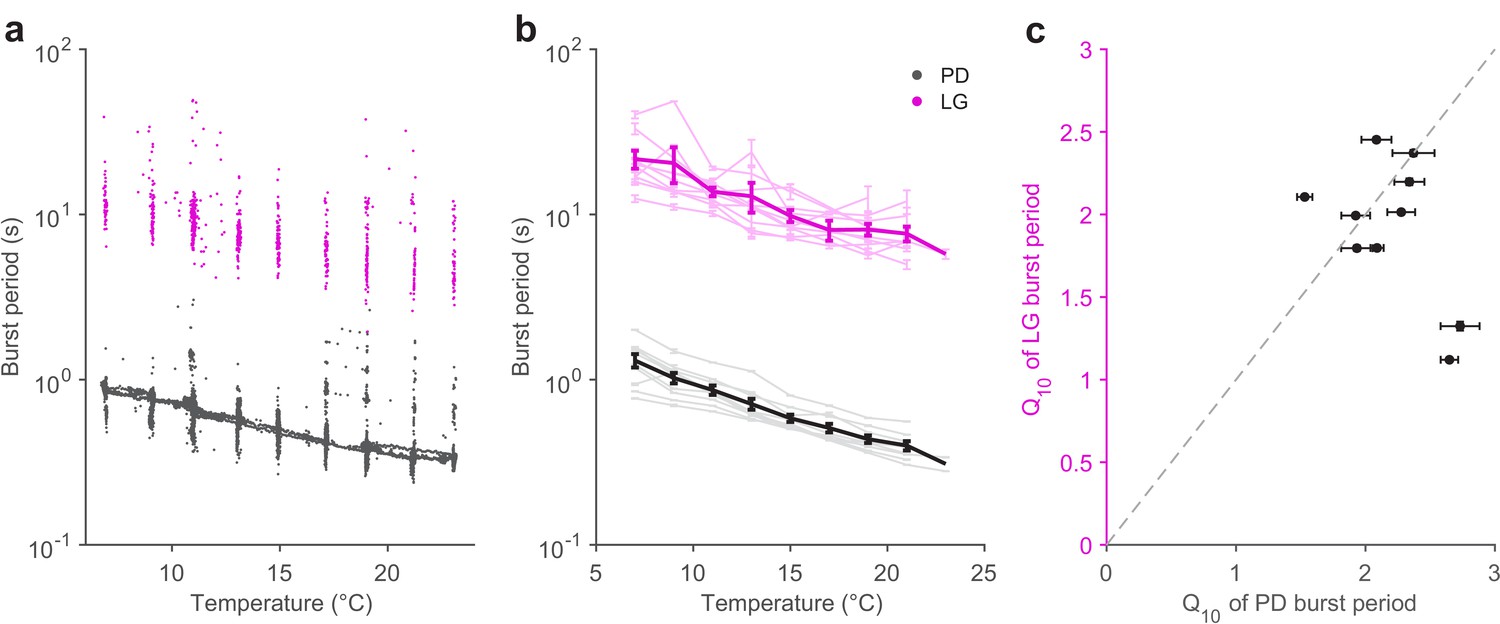
Pyloric and gastric mill periods are similarly temperature-sensitive.
(a) Burst period of PD (black) and LG (magenta) in a single preparation as a function of temperature. Each dot corresponds to a single burst. (b) Burst period of PD and LG for 10 preparations. Each line is a single preparation. Mean of all preparations shown in thick lines. (c) The apparent Q10 of the burst frequency of each preparation for the PD and LG neurons, representing the pyloric and gastric mill rhythms. The apparent Q10s of the two rhythms are not significantly different (paired t-test, ).
Figure 4—figure supplement 1
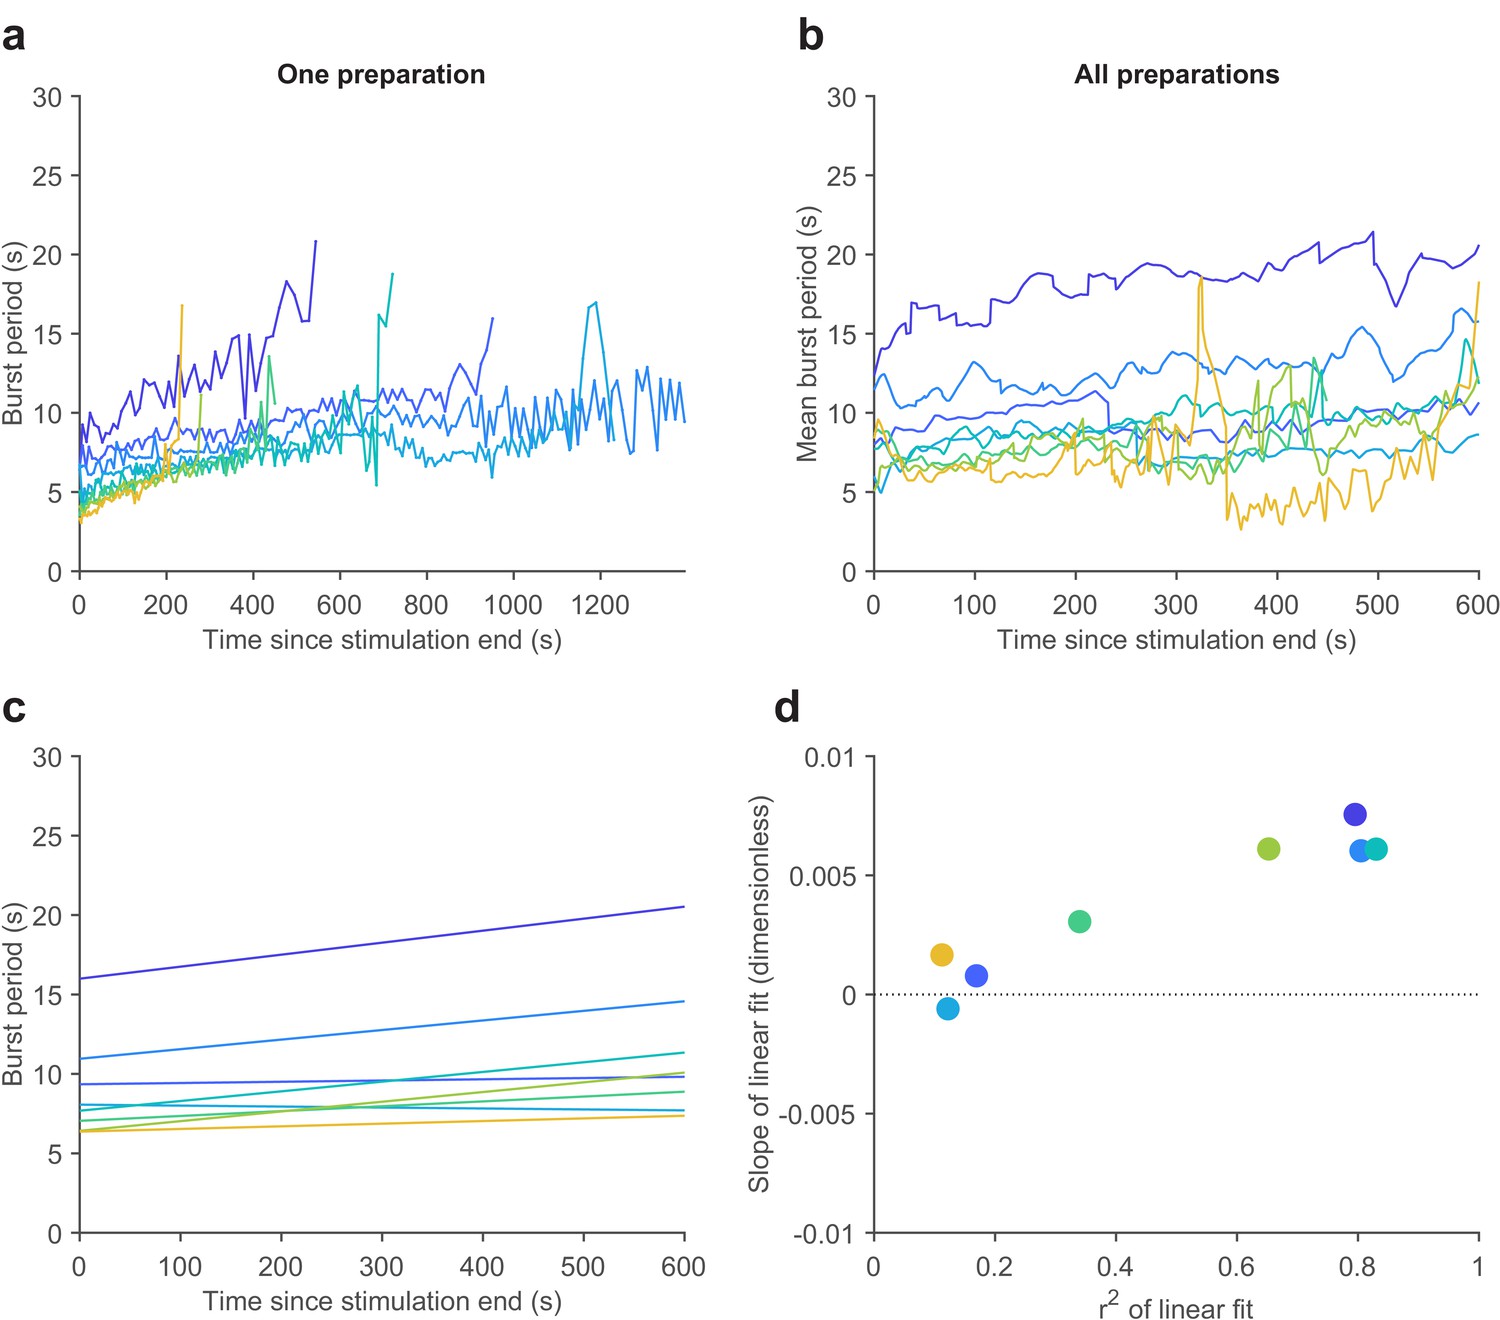
Gastric mill rhythms slow down with time after stimulation.
(a) Instantaneous LG burst period plotted against time for a single preparation. Each line shows LG burst period for each gastric mill rhythm. Lines are of varying length as gastric mill rhythm duration was different each time it is evoked (Materials and methods). Colors indicate temperature (7–21°C). (b) Mean LG burst period for the first 600 s post-stimulation for all 10 preparations. (c) Linear fits for average LG burst period across all preparations at each temperature. (d) Slopes of the linear fits in (c) plotted vs. r2 of each fit line.
Figure 4—figure supplement 2
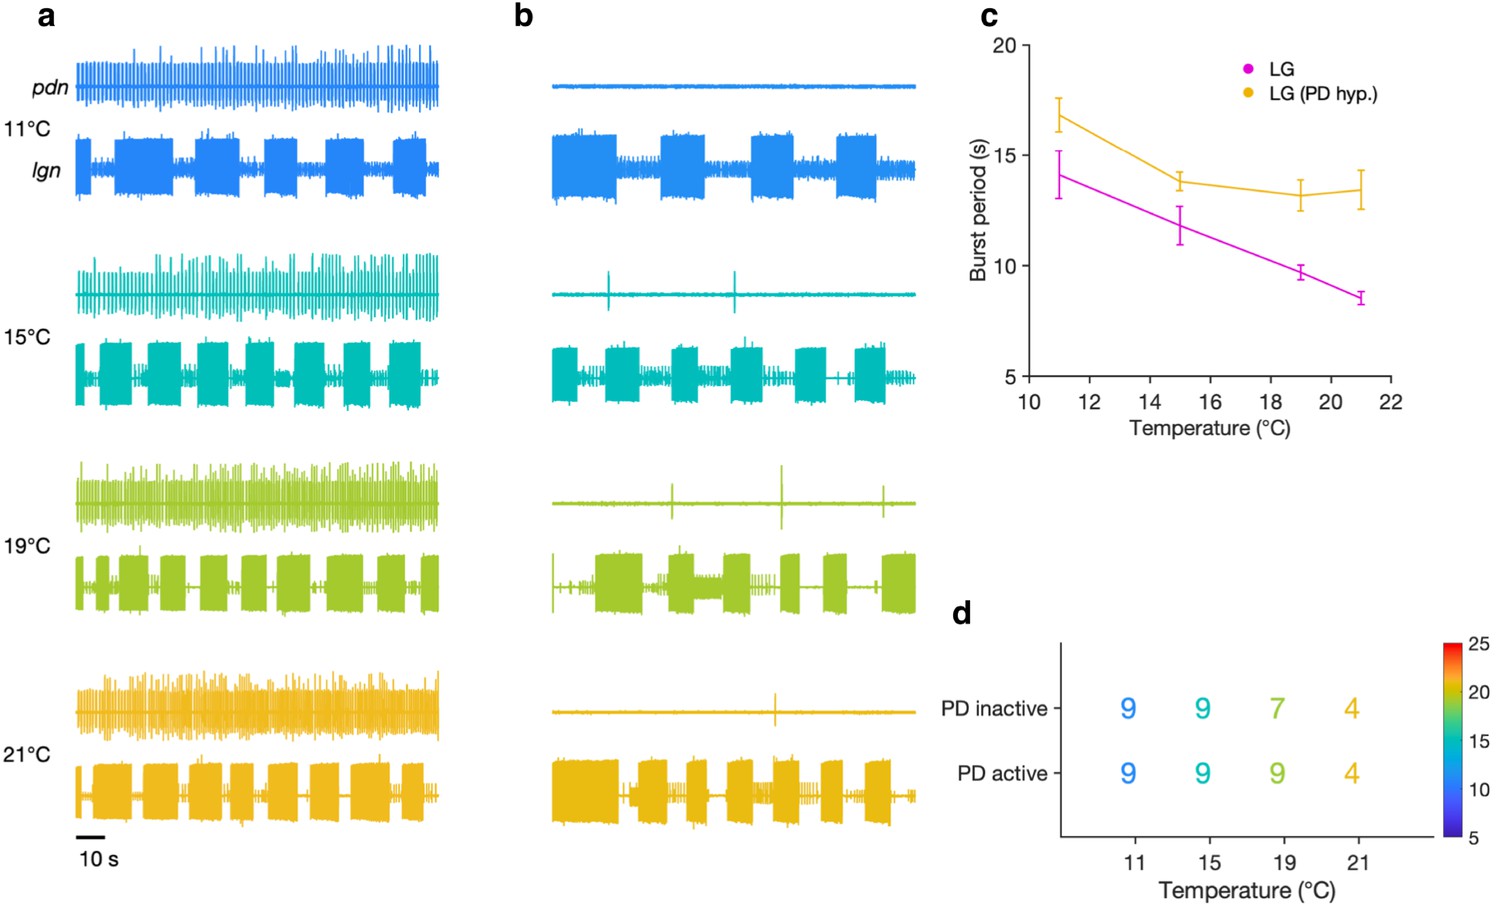
Evoked gastric mill rhythms persist when the pyloric pacemaker is suppressed.
Extracellular recordings of the lgn and pdn at 11°C, 15°C, 19°C, and 21°C with the pyloric pacemaker kernel active (a) and inactive (b) in a single preparation. (c) Burst period of LG with the pacemaker active (magenta) and inactive (yellow) at each temperature step for the preparation shown in (a) and (b) (mean ± SEM). (d) Number of preparations (out of nine total) in which a gastric mill rhythm could be evoked with the pacemaker kernel active (bottom row) and with AB/PD hyperpolarized (top row) for each temperature.
Figure 5
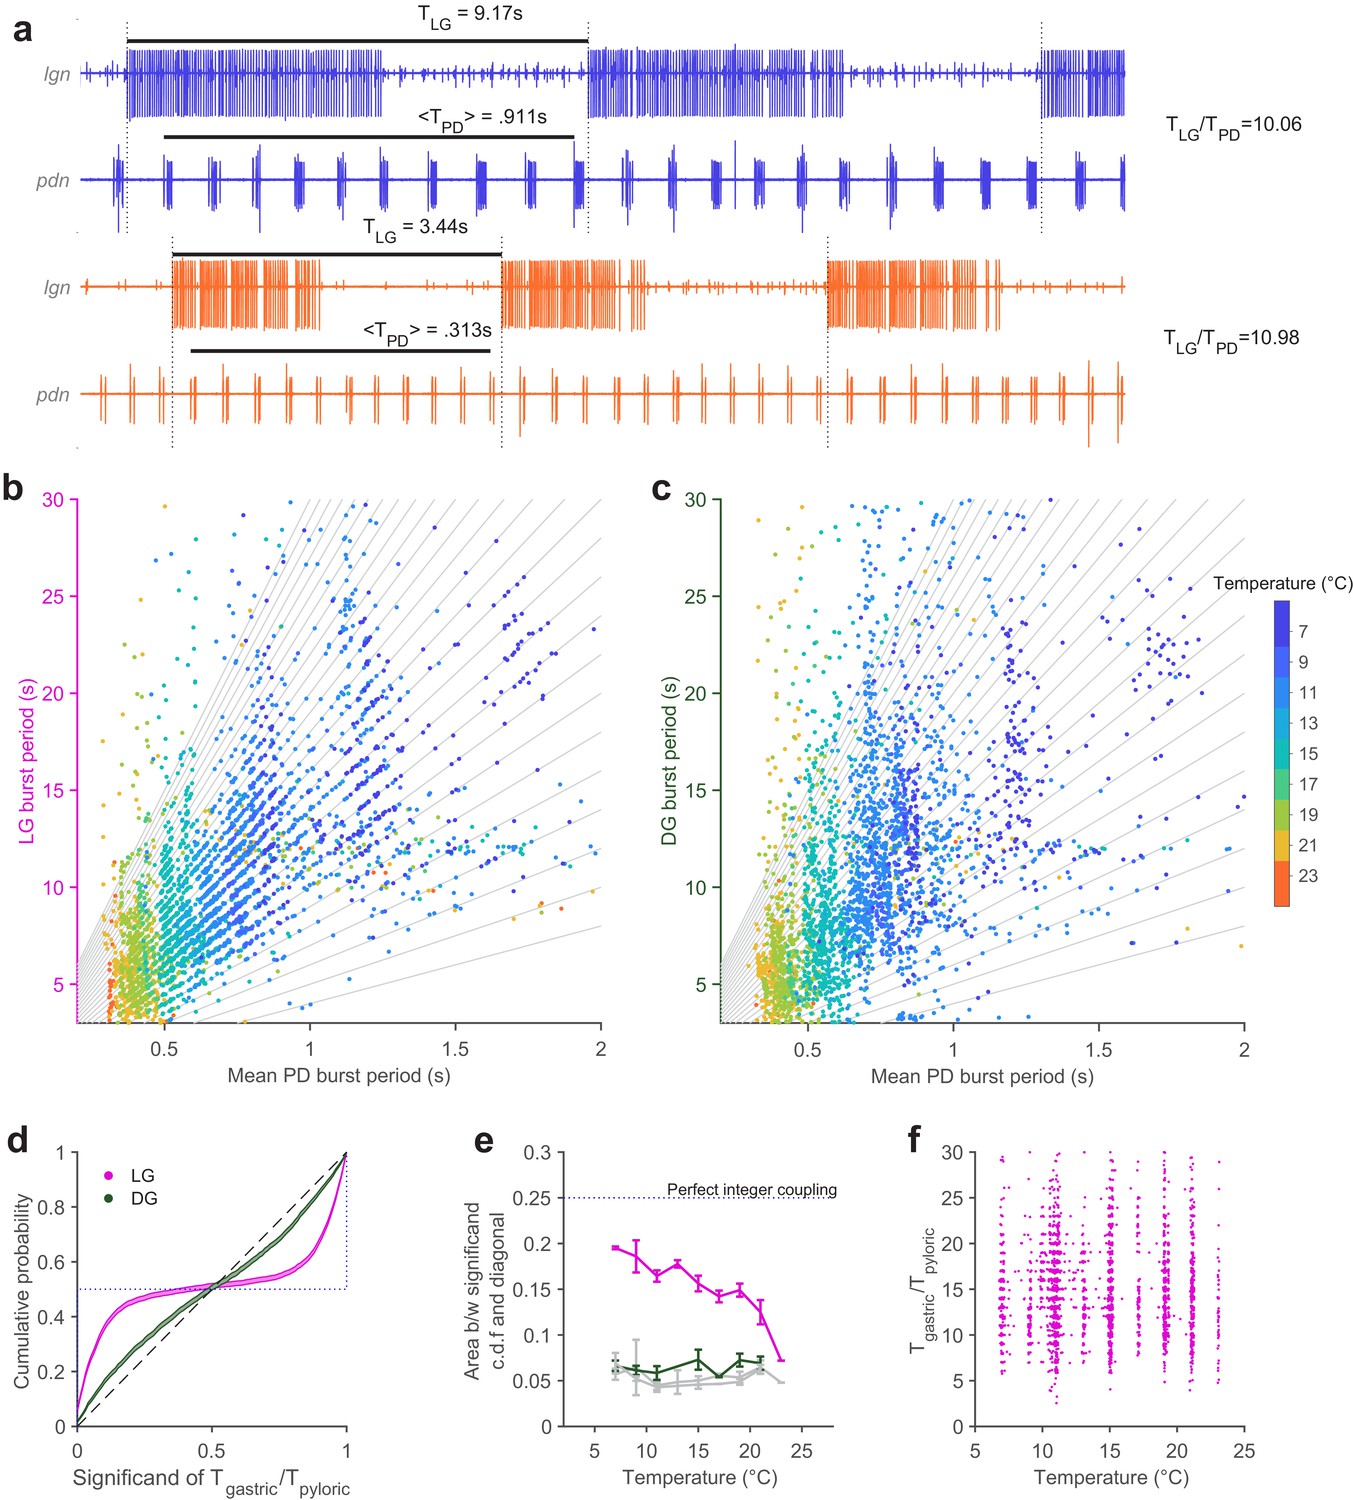
Integer coupling is maintained over physiological range.
(a) Extracellular recordings of pdn show bursting of LG and PD at 7°C (blue) and 23°C (orange). Black bars indicate burst period of LG and mean burst period of PD. LG (b) and DG (c) burst period as a function of mean PD period. In (b–c), gray lines have integer slopes and are not fits. (d) Cumulative probability distributions (c.d.f.s) of significand of ratio of gastric to pyloric period for LG (magenta) and DG (green) for all temperatures. Shading indicates confidence interval estimates from bootstrapping the data. Dashed diagonal line indicates a uniform distribution, and the dotted line indicates perfect integer coupling. (e) Area between significand c.d.f.s and diagonal (a measure of how integer-coupled the circuits are) as a function of temperature for all preparations. Gray lines are computed from shuffled data. LG and PD were significantly integer coupled between 7°C and 21°C (p < 10–5, D > 0.24, two-sample Kolmogorov-Smirnoff test), while DG and PD did not exhibit integer coupling. (f) Ratio of gastric to pyloric periods as a function of temperature. Apparent banding along the temperature axis is a consequence of the experimental protocol, where discrete temperature steps were used (Materials and methods). Ratios of LG to PD cycle period were n across temperature (p = 0.88, Spearman test).
Figure 6
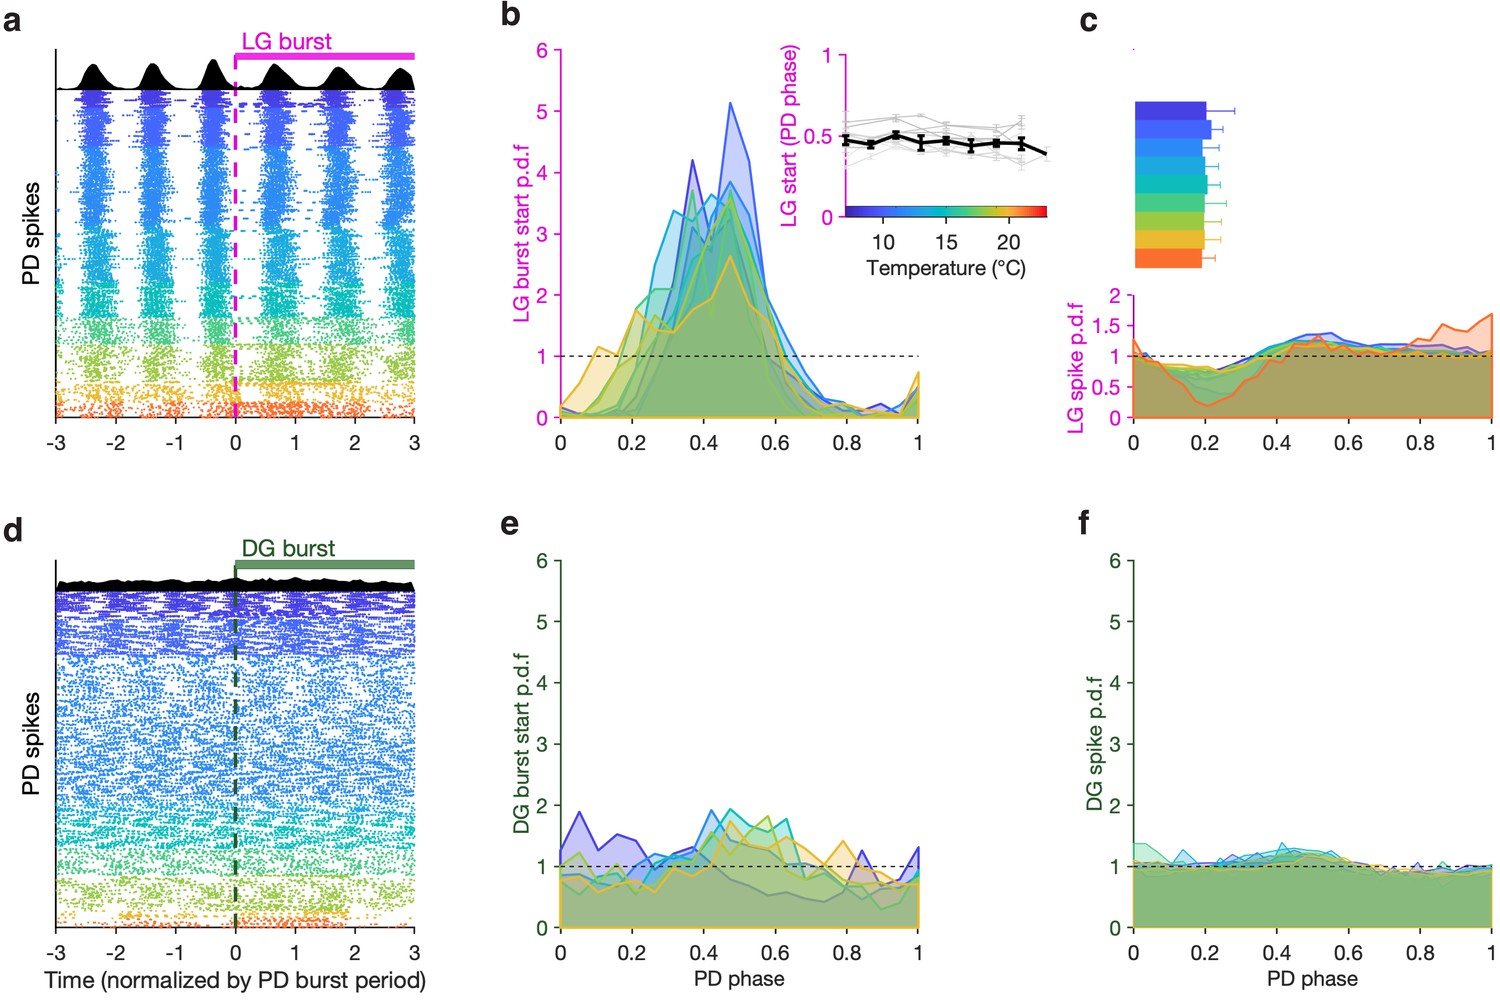
LG, but not DG, bursts and spikes are phase-locked to PD across temperatures.
(a) PD spike rasters aligned to LG burst starts (dashed line at 0) in a single preparation. Each row corresponds to an LG burst start, and time is normalized by PD burst period. Black histograms at the top show spike probability over all rasters. (b) LG burst start probability as a function of PD phase. Inset shows mean LG burst start phase a function of temperature (gray lines: individual preparations, black line: mean across all preparations). LG burst start probabilities were significantly different from a uniform distribution (p < 4 × 10⁻⁴, 7.5 < z < 45, Rayleigh test for non-uniformity). Phase offset between LG and PD was similar from 7°C to 21°C (inset, p = 0.46, Spearman test). (c) LG spike probability as a function of PD phase at various temperatures. Bars indicate PD spiking. (d–f) Similar to (a–c), but for DG. DG burst starts are not always significantly non-uniformly distributed, and the effect size is much smaller (p ∈ [0.001, 0.85], 0.15 < z < 13, Rayleigh test). Rasters in (a,d) are from the same preparation.
Additional files
Download links
A two-part list of links to download the article, or parts of the article, in various formats.
Downloads (link to download the article as PDF)
Open citations (links to open the citations from this article in various online reference manager services)
Cite this article (links to download the citations from this article in formats compatible with various reference manager tools)
Coupling between fast and slow oscillator circuits in Cancer borealis is temperature-compensated
eLife 10:e60454.
https://doi.org/10.7554/eLife.60454


