The effect of hybridization on transposable element accumulation in an undomesticated fungal species
- Institut de Biologie Intégrative et des Systèmes (IBIS), Université Laval, Canada
- Département de biochimie, microbiologie et bioinformatique, Université Laval, Canada
- Quebec Network for Research on Protein Function, Engineering, and Applications (PROTEO), Université Laval, Canada
- Université Laval Big Data Research Center (BDRC_UL), Canada
- Département de biologie, Université Laval, Canada
Figures
Figure 1
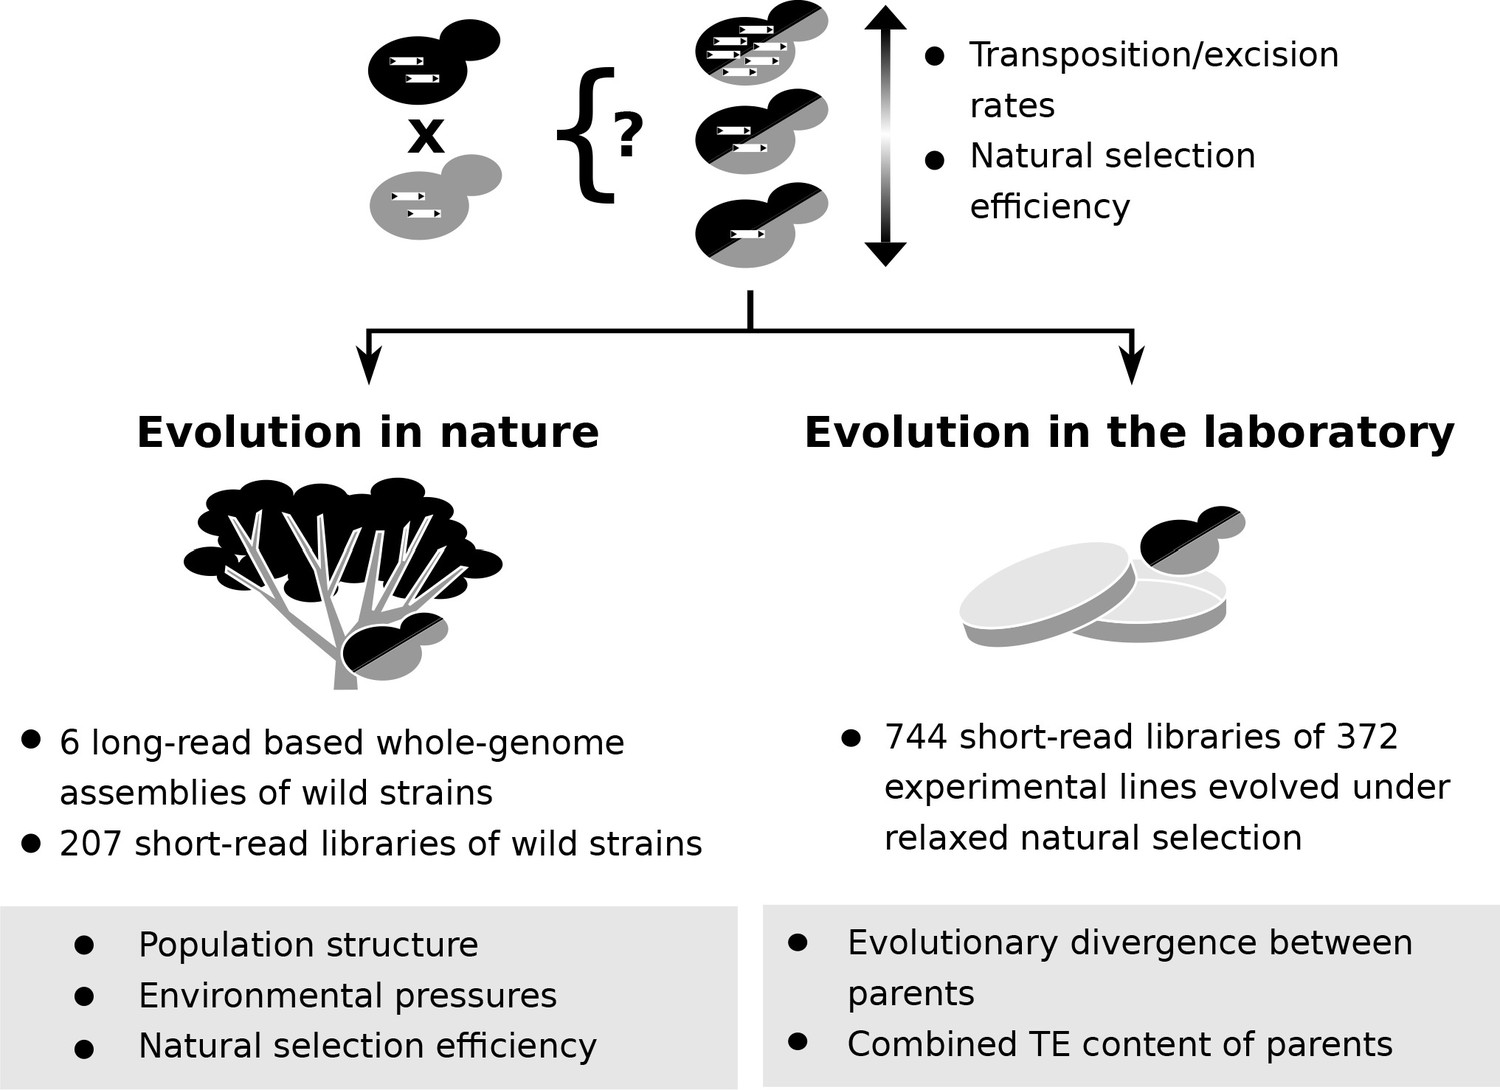
Population genomic data and laboratory evolution experiments allow to uncover the effects of various factors on transposable element (TE) accumulation in hybrids.
Upon hybridization, the TE content of a hybrid is determined by equal contributions from the TE contents of its parents. Subsequent evolution can either leave the hybrid TE content unchanged, or drive it to increase or decrease. These changes can be driven by biases in transposition or excision rates or by variation in natural selection efficiency. Two complementary approaches can be used to investigate which factors drive TE dynamics in hybrids. First, genomic data from natural populations can be harnessed to understand how population structure, environmental pressures and natural selection efficiency shaped natural variation in TE content. Second, evolution experiments in laboratory controlled conditions (constant environment and relaxed natural selection) allow to test the effect of properties of artificial hybrid genotypes on TE accumulation, namely evolutionary divergence between parents and initial TE content.
Figure 2 with 3 supplements
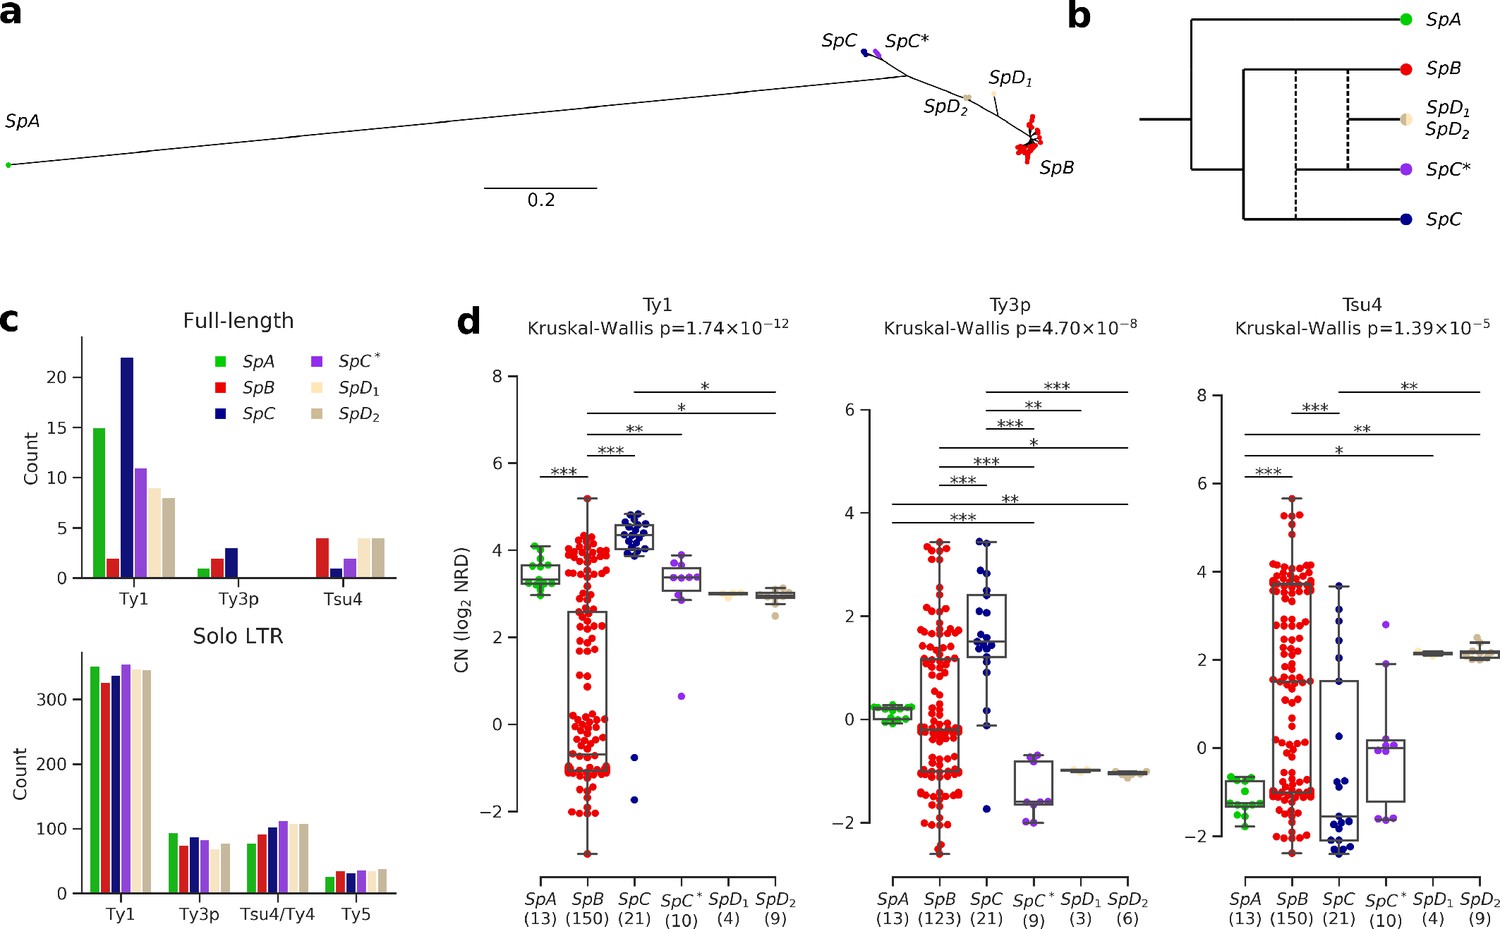
Ty elements showed no reactivation in hybrid lineages and contrasted abundances among pure lineages.
(a) Bayesian phylogenetic tree of the North American Saccharomyces paradoxus lineages based on genome-wide SNPs. (b) Schematic admixture graph showing the evolutionary relationships between pure and hybrid lineages as inferred by Eberlein et al., 2019; Leducq et al., 2016. Dotted lines represent admixture events. (c) Counts of full-length elements (top) and solo LTRs (bottom) in six whole-genome assemblies based on long reads. No full-length Ty4 or Ty5 were found in any assembly, thus these families were considered extinct. (d) Copy number (CN) variation in active Ty families (i.e. families which have full-length elements) measured as log2 normalized read depth (NRD) over Ty reference internal sequences for 207 diploid wild strains. Sample size for each lineage (excluding strains for which there was no coverage) is indicated between parentheses. Whiskers span 1.5 times the interquartile range. The p-values of Kruskal-Wallis tests are shown. Stars on bars show the results of Conover post-hoc tests. *: p<0.05, **: p<0.01, ***: p<0.001.
-
Figure 2—source data 1
Counts of Ty annotations by type from the six whole-genome assemblies.
- https://cdn.elifesciences.org/articles/60474/elife-60474-fig2-data1-v2.csv.zip
Figure 2—figure supplement 1
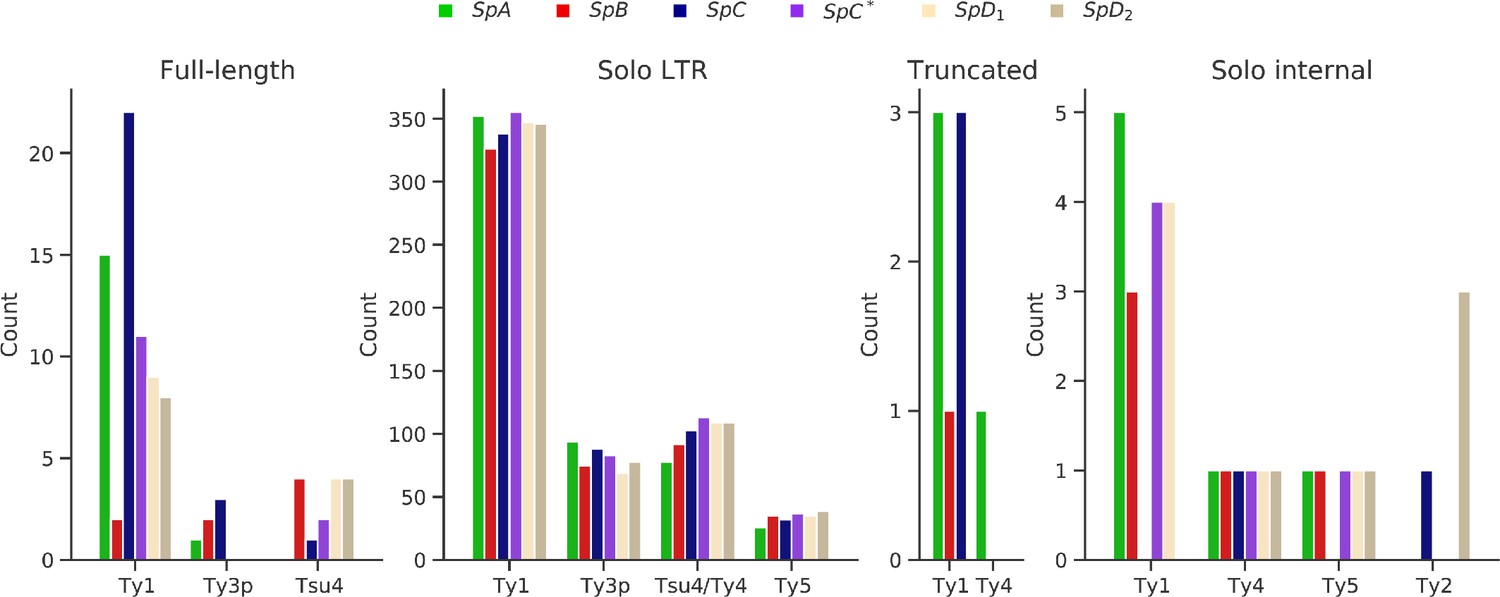
Counts of LTR retrotransposon annotations in the six whole-genome assemblies.
Figure 2—figure supplement 2
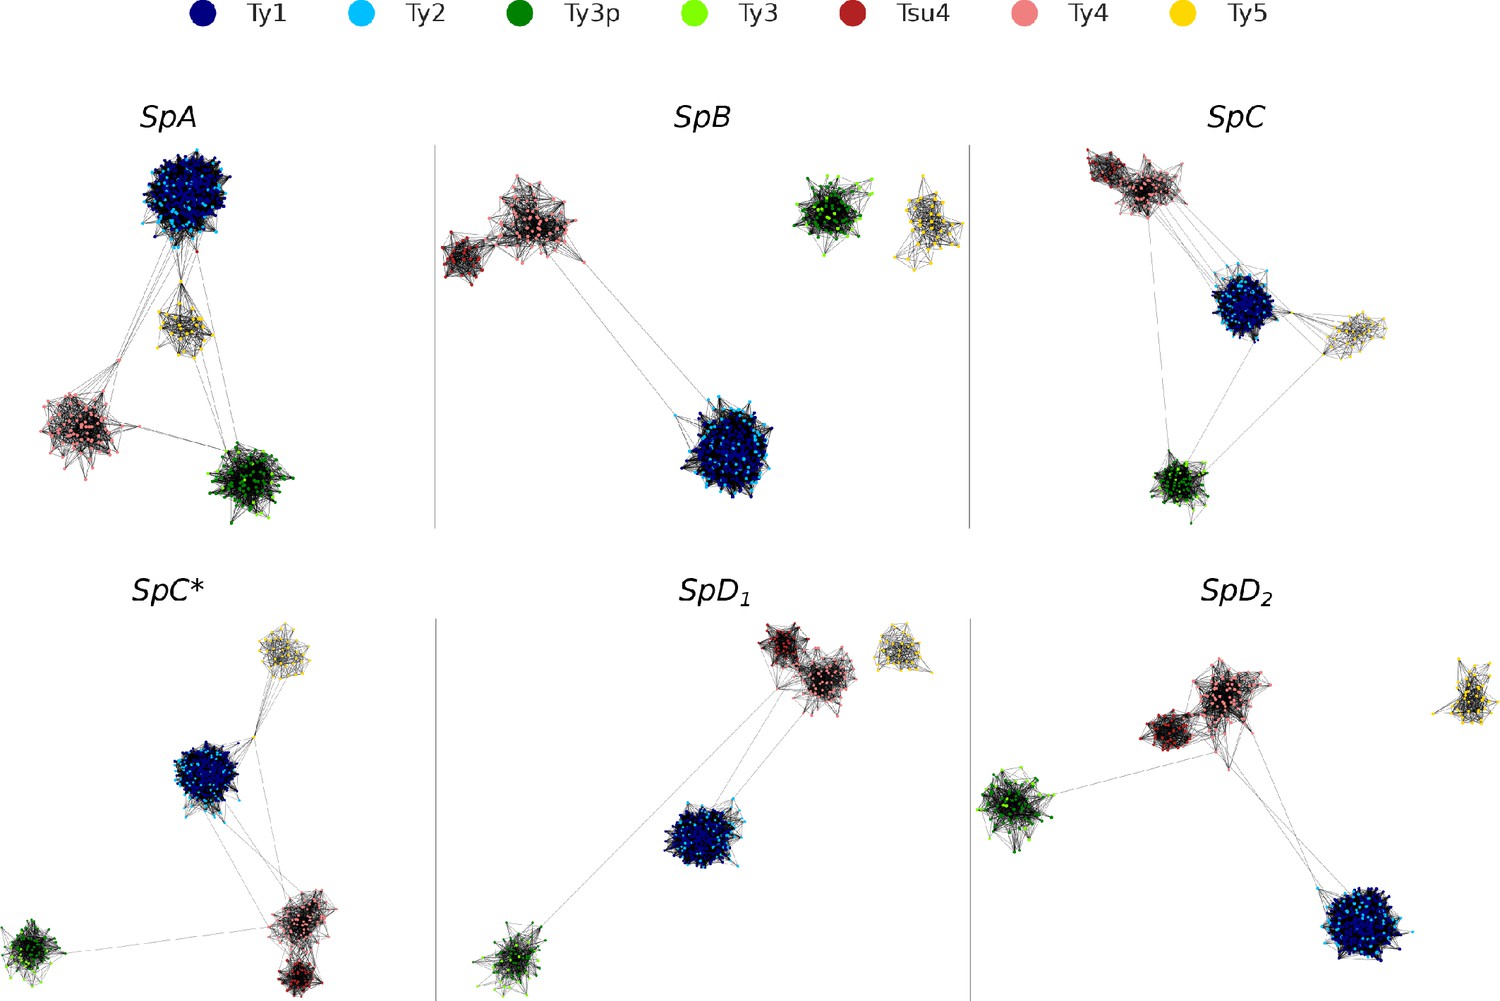
Long terminal repeat (LTR) sequence similarity networks.
Networks were built using blastn bit scores as a similarity metric, keeping the top 10% interactions for each node. Networks were plotted using Cytoscape with the Prefuse Force Directed layout algorithm.
Figure 2—figure supplement 3

Depth of coverage on reference internal sequences for Ty1, Ty3p, and Tsu4.
Row z-scores are shown for 200 bp-wide non-overlapping windows. Phylogenetic lineage assignment and Ty copy number (CN) (log2 normalized read depth) are shown in the two first columns. White bars correspond to CN = 0 (i.e. one copy).
Figure 3 with 3 supplements
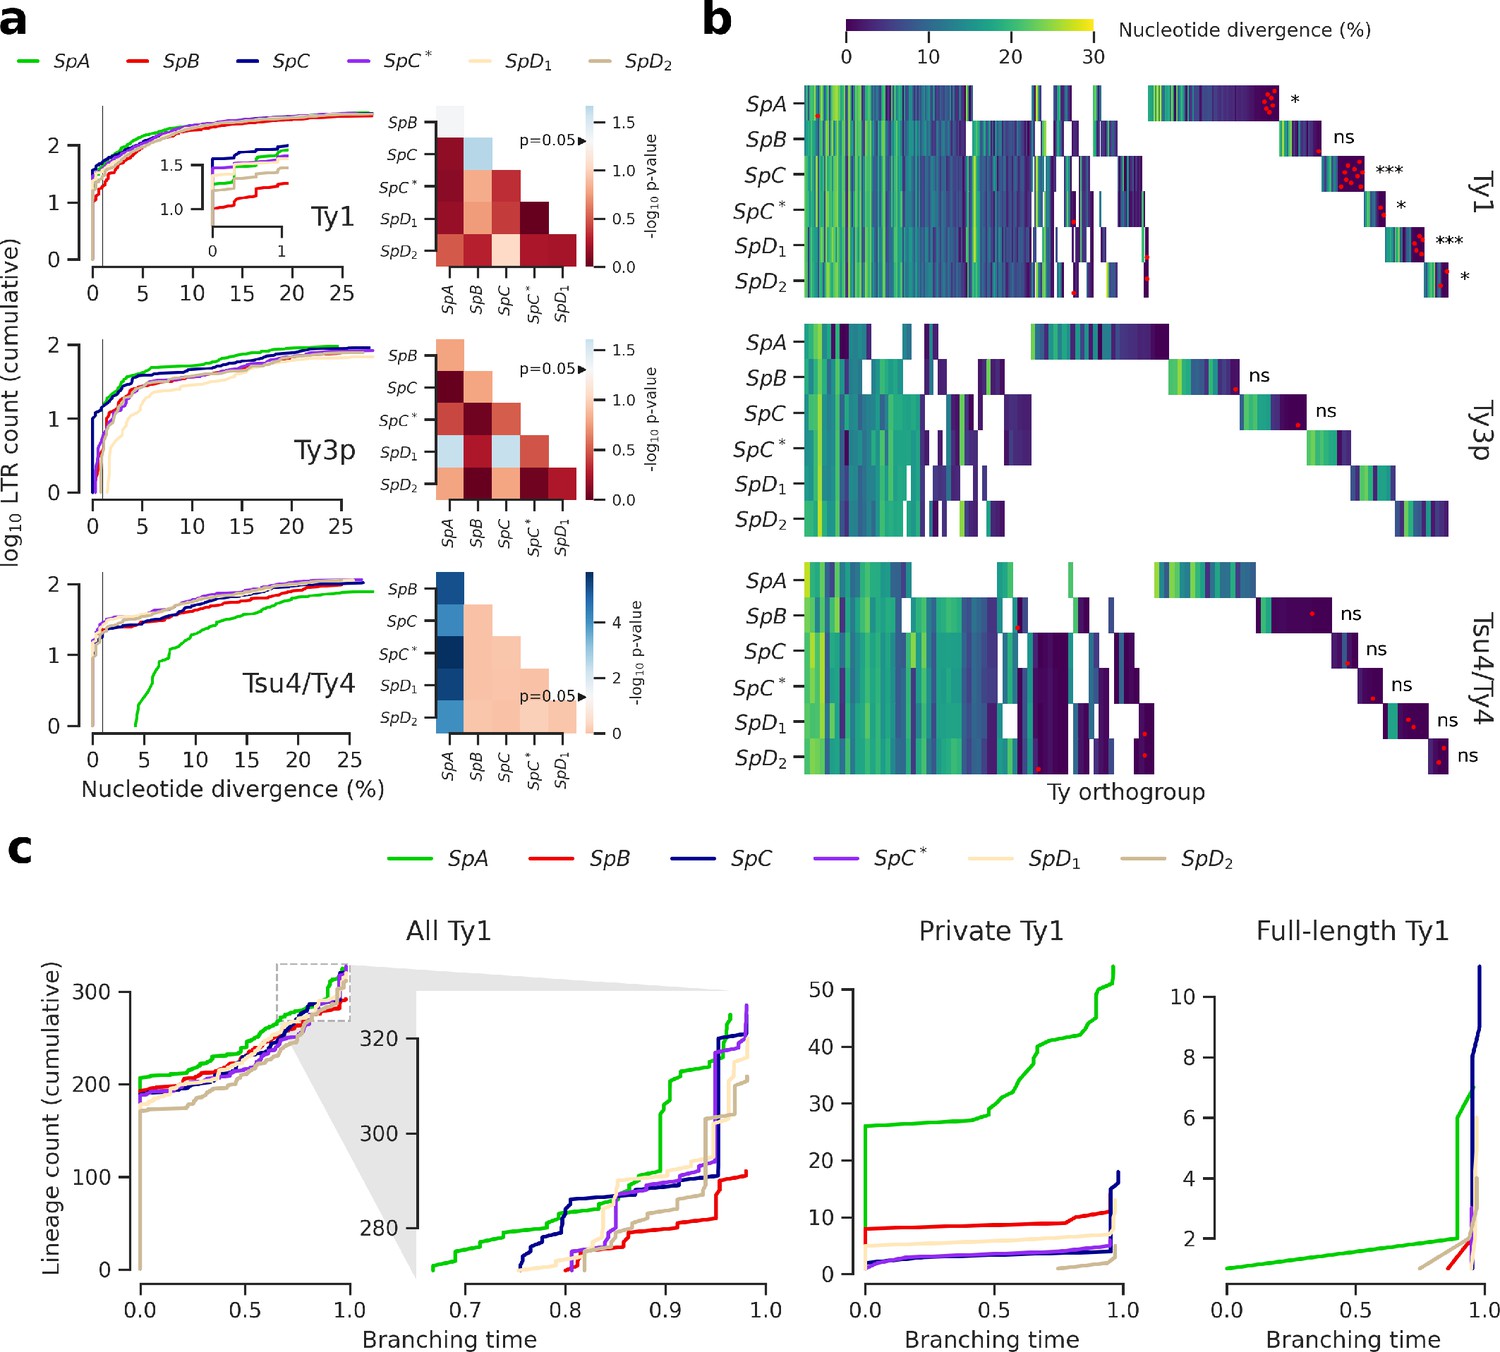
Evolutionary dynamics of Ty families in S. paradoxus.
(a) Distributions of minimum nucleotide divergence between long terminal repeat (LTR) sequences. Heatmaps show FDR-corrected p-values for pairwise Fisher’s exact tests between ratios of elements ≤1% and >1% nucleotide divergence. Color maps are centered at the significance threshold of 0.05. Blue cells depict statistically significant tests. See Figure 3—figure supplement 1 for other divergence thresholds. (b) LTR divergence and conservation levels. Horizontal positions depict Ty orthogroups clustered from conserved (left) to private (right). Color map shows minimum nucleotide divergence. Scattered red dots show LTRs that belong to full-length elements. FDR-corrected p-values of Fisher’s exact tests for the ratio of full-length elements in private orthogroups are shown. ns: p≥0.05, *: p<0.05, **: p<0.01, ***: p<0.001. (c) Lineages through time curves for Ty1 ultrametric bayesian phylogenetic trees, using a conserved Ty4 LTR orthogroup as an outgroup. Branching time is scaled such that values of one correspond to the present. From left to right, distributions show all LTRs (with a close-up on recent dynamics), LTRs from private elements and LTRs from full-length elements.
-
Figure 3—source data 1
Nucleotide divergence data for LTR sequences from the six whole-genome assemblies.
- https://cdn.elifesciences.org/articles/60474/elife-60474-fig3-data1-v2.csv.zip
-
Figure 3—source data 2
Ty orthogroups defined from the six whole-genome assemblies.
- https://cdn.elifesciences.org/articles/60474/elife-60474-fig3-data2-v2.csv.zip
-
Figure 3—source data 3
Branching times for Ty1 LTR sequences from the six whole-genome assemblies.
- https://cdn.elifesciences.org/articles/60474/elife-60474-fig3-data3-v2.csv.zip
Figure 3—figure supplement 1
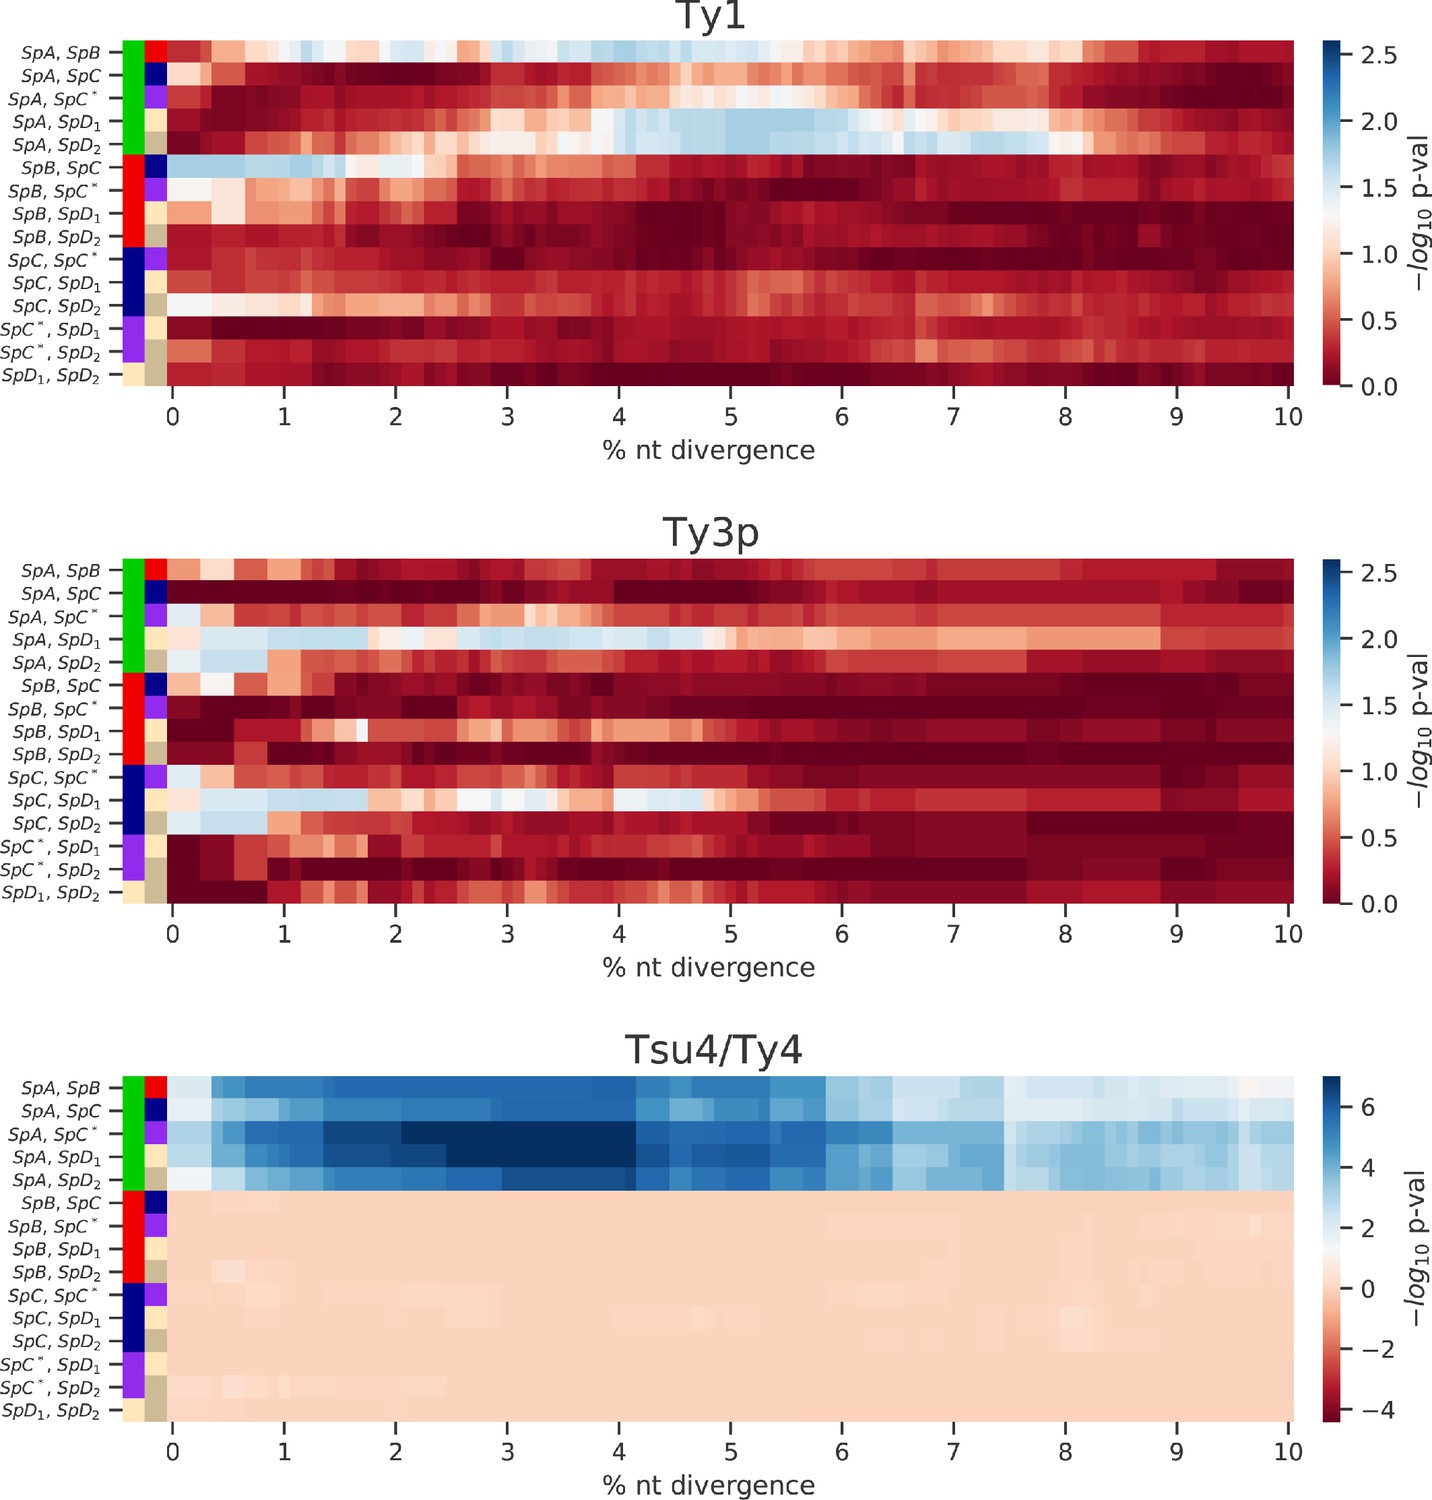
Enrichment of low-divergence peaks in distributions of minimum nucleotide divergence between long terminal repeat (LTR) sequences.
Heatmaps show FDR-corrected p-values for pairwise Fisher’s exact tests between ratios of elements below and strictly above thresholds of nucleotide divergence from 0% to 10%. Color maps are centered at the significance threshold of 0.05.
Figure 3—figure supplement 2
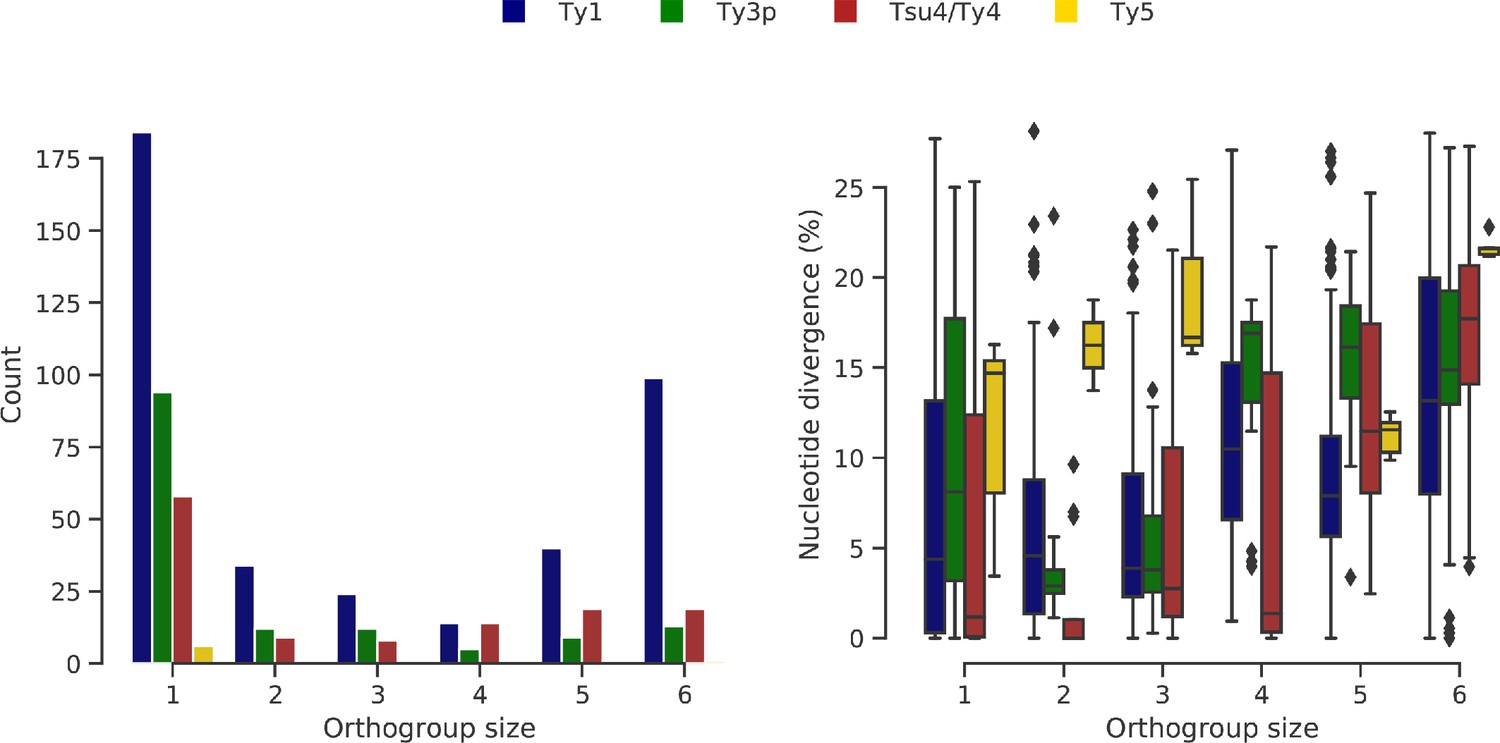
Ty orthogroups defined from the six genome assemblies.
(a) Distributions of Ty orthogroup sizes, from private (1) to conserved (6). (b) Distributions of nucleotide divergence to the most closely related long terminal repeat (LTR) sequence for each LTR within an orthogroup size category. Whiskers span 1.5 times the interquartile range.
Figure 3—figure supplement 3
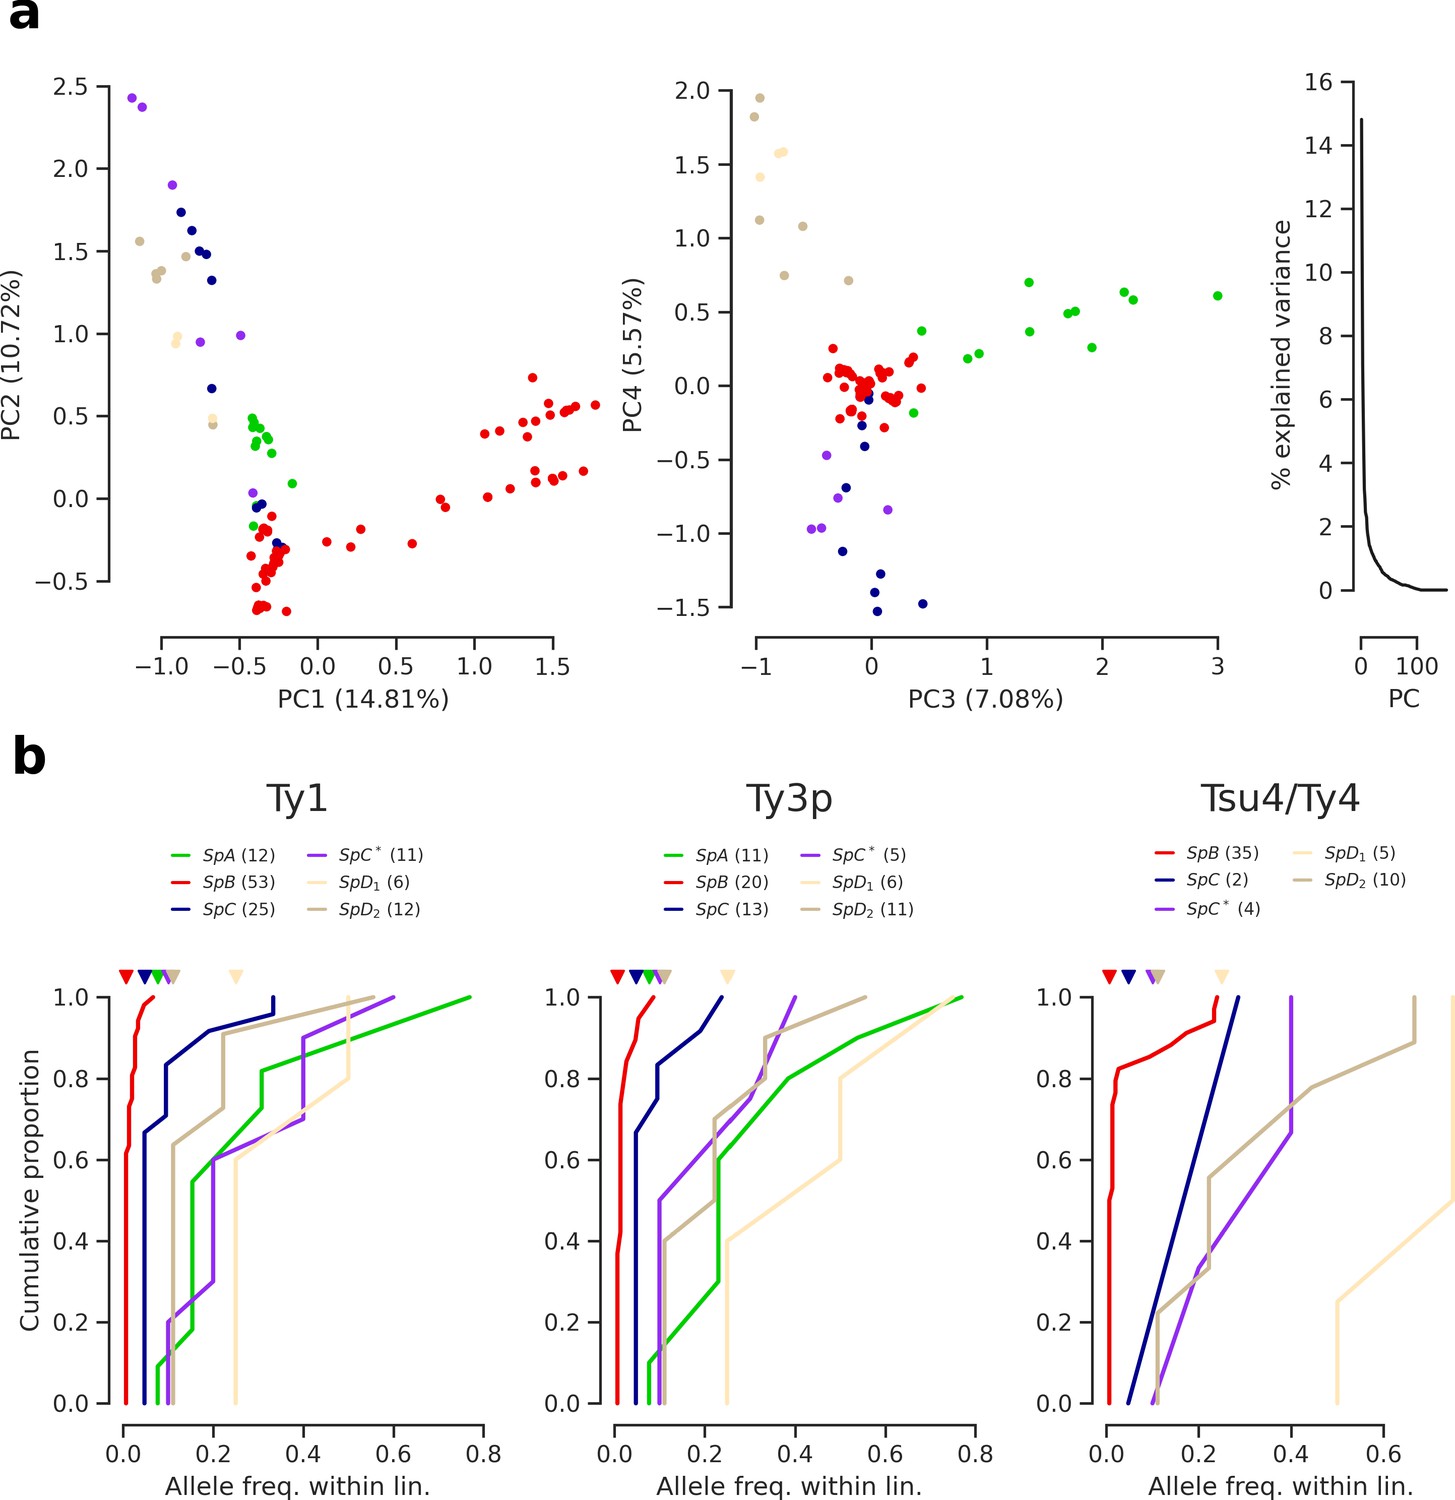
Population structure based on Ty insertions called from discordant short read mappings.
(a) Principal component analysis (PCA) on Ty insertion calls showing the first four principal components (PCs) and the distribution of explained variance. (b) Cumulative distirbutions of Ty allele frequencies within lineages. Triangle marks on the top indicate allele frequencies corresponding to one strain. Numbers in parentheses correspond to counts of alleles.
Figure 4 with 4 supplements
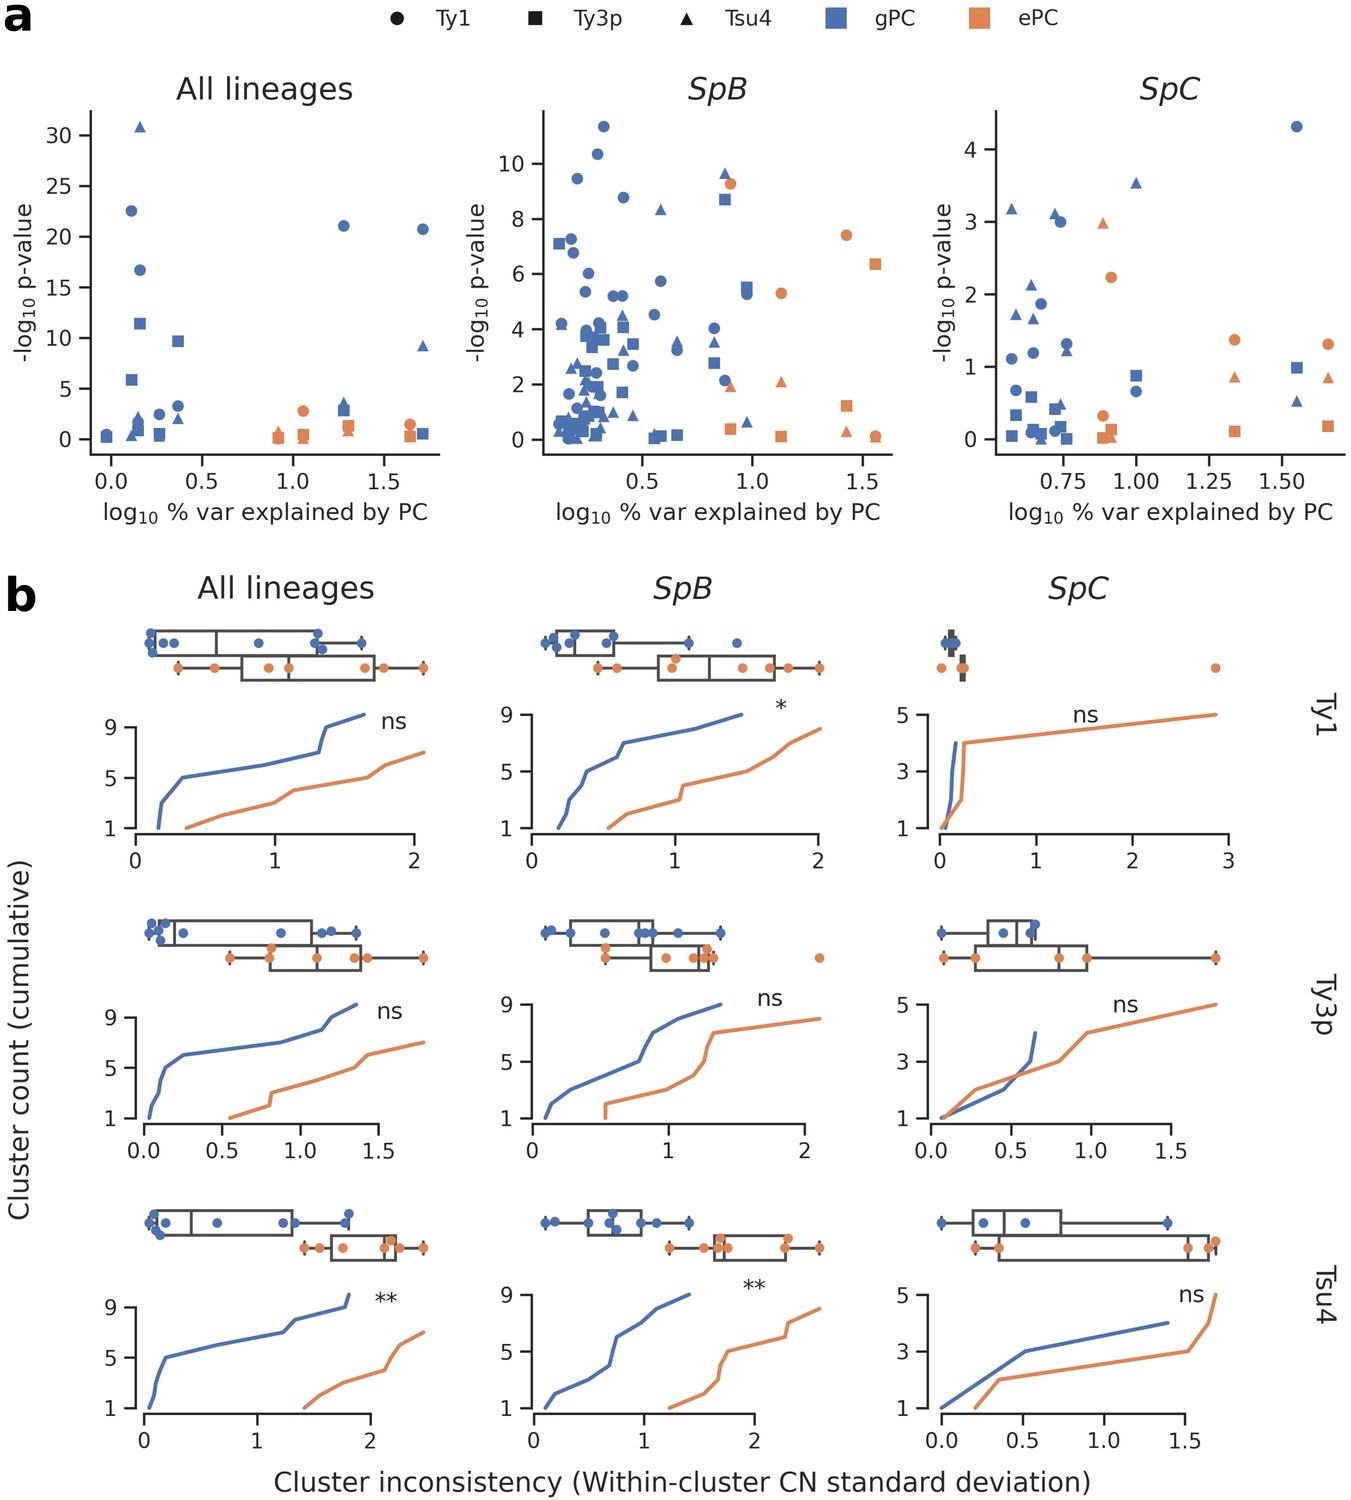
Associations between population structure, climatic variables and Ty CNs for all lineages (left), SpB only (middle), or SpC only (right).
(a) Linear models fitted on Ty CNs with gPCs and ePCs as independent variables. For each PC, the p-value in the linear model is plotted against the proportion of variance explained in the respective PCA. (b) Unsupervised clustering performed on either gPC or ePC coordinates. Cumulative distributions show the standard deviation in Ty CN within each gPC-cluster or ePC-cluster. Distributions are also shown as boxplots, with whiskers spanning 1.5 times the interquartile range. FDR-corrected p-values of two-tailed Mann-Whitney U tests between gPC-cluster and ePC-cluster CN distributions are shown. ns: p≥0.05, *: p<0.05, **: p<0.01.
-
Figure 4—source data 1
Parameter values for predictors of Ty CNs (gPCs and ePCs) fitted in linear models.
- https://cdn.elifesciences.org/articles/60474/elife-60474-fig4-data1-v2.csv.zip
-
Figure 4—source data 2
gPC-cluster and ePC-cluster membership for wild strains of S. paradoxus.
- https://cdn.elifesciences.org/articles/60474/elife-60474-fig4-data2-v2.csv.zip
Figure 4—figure supplement 1
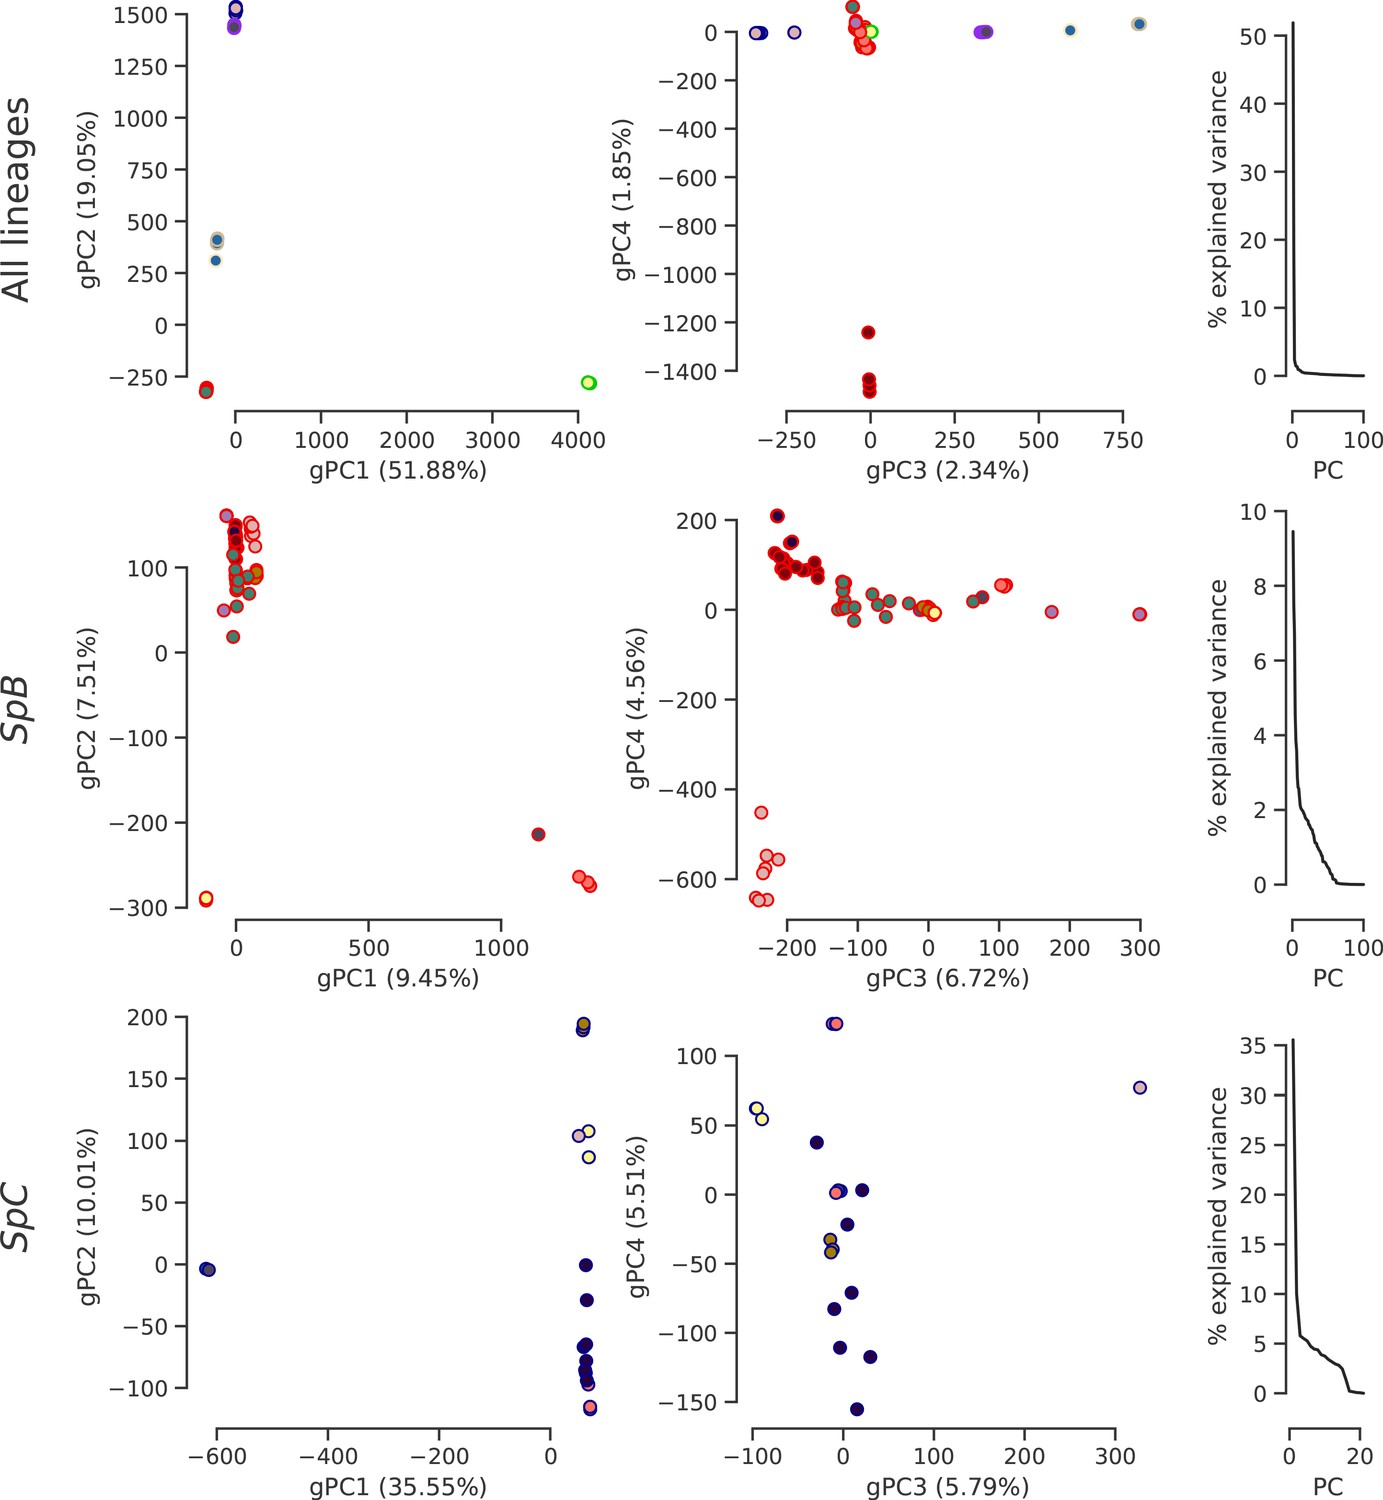
Population structure based on genome-wide SNPs.
PCA on SNP calls showing the first four PCs and the distribution of explained variance. Dot face colors correspond to the clusters used in Figure 4b and Figure 4—figure supplement 4, and dot edge colors correspond to the phylogenetic lineage assignment.
Figure 4—figure supplement 2
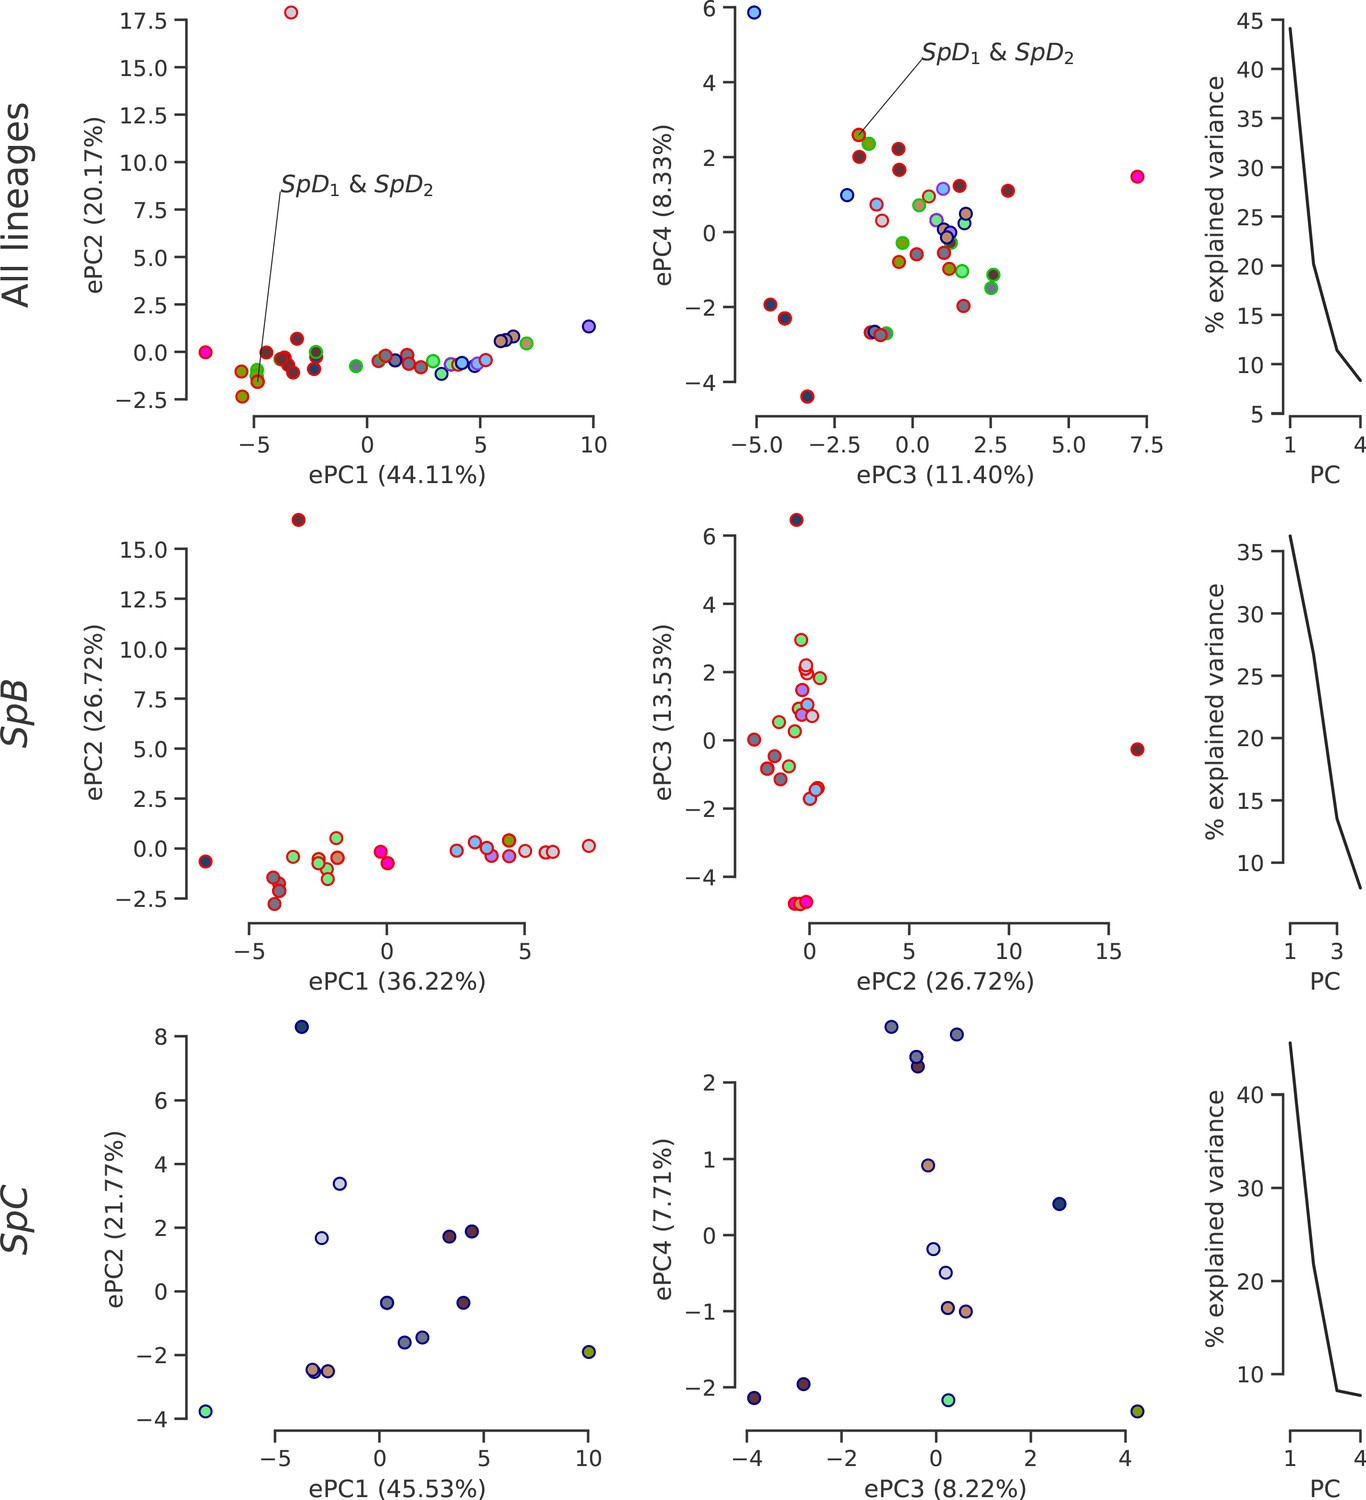
Climatic variation among natural lineages.
PCA was performed on high-resolution climatic data (Abatzoglou et al., 2018) at the sampling site of each strain. The first four or three PCs are plotted with the distribution of explained variance. Dot face colors correspond to the clusters used in Figure 4b and Figure 4—figure supplement 4, and dot edge colors correspond to the phylogenetic lineage assignment. The single sampling location of all SpD strains is labeled, as it overlaps with many SpB strains.
Figure 4—figure supplement 3
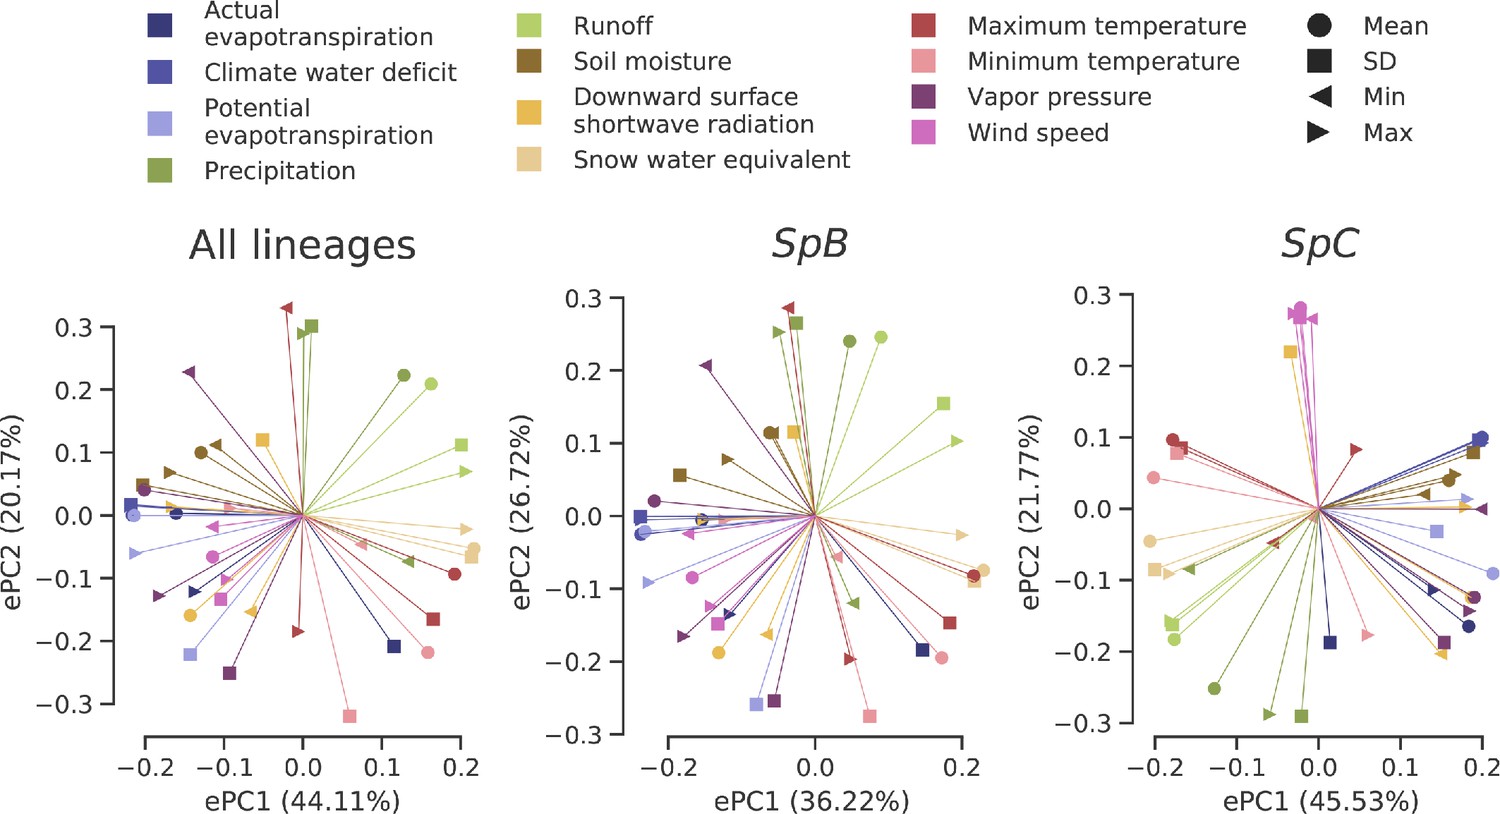
Loadings of the PCAs on climatic variation data.
Eigenvectors associated with the two first PCs of each dataset are plotted.
Figure 4—figure supplement 4
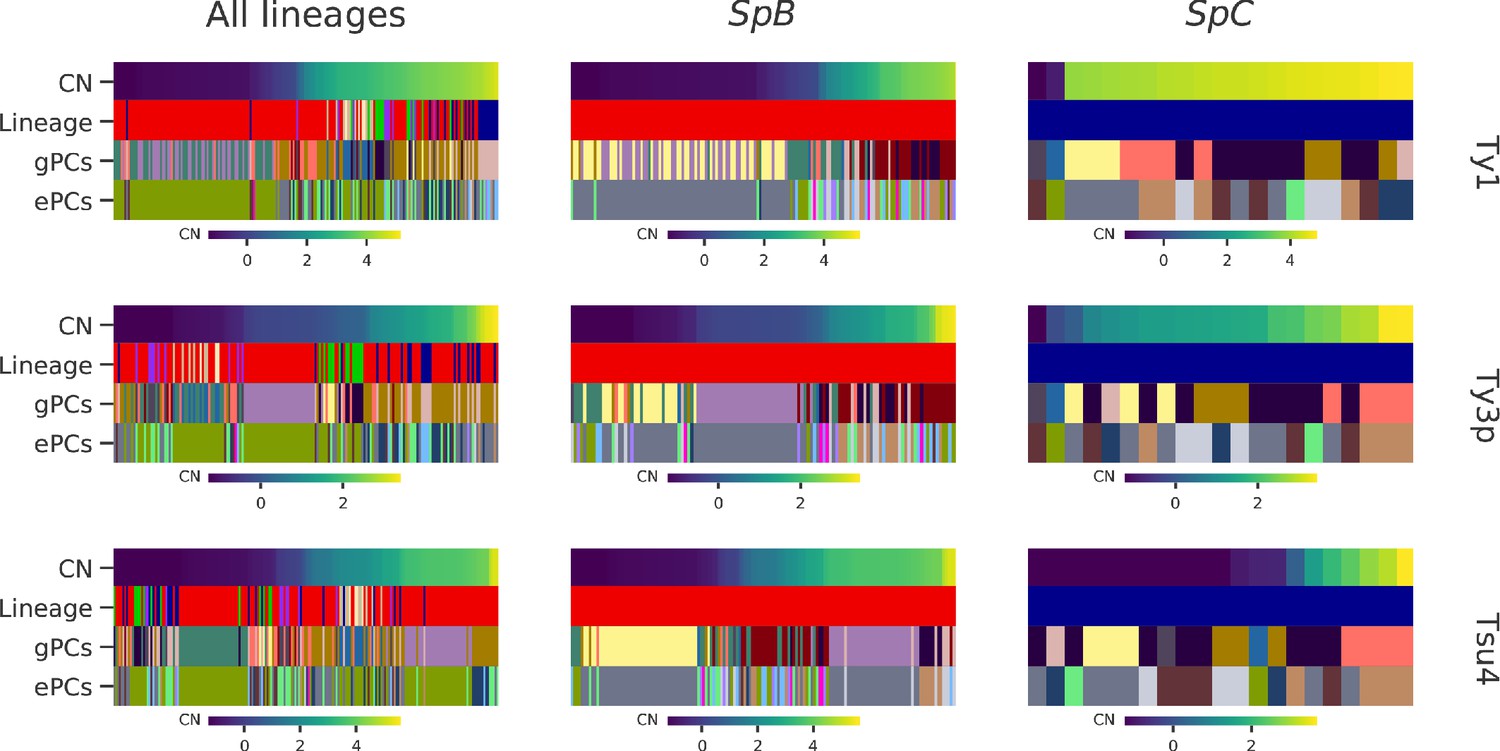
Strains clustering performed on either gPC or ePC coordinates.
Columns within a heatmap correspond to individual strains. Ty CNs are represented by top rows, using the continuous color maps defined below each case. ‘Lineage’ rows correspond to the established phylogenetic lineage assignment using the color code employed throughout this paper. ‘gPCs’ and ‘ePCs’ correspond to clusters on gPCs and ePCs respectively, with discrete colors indicating the membership to different clusters. Cluster color mappings are consistent within datasets (all lineages, SpB and SpC).
Figure 5 with 11 supplements
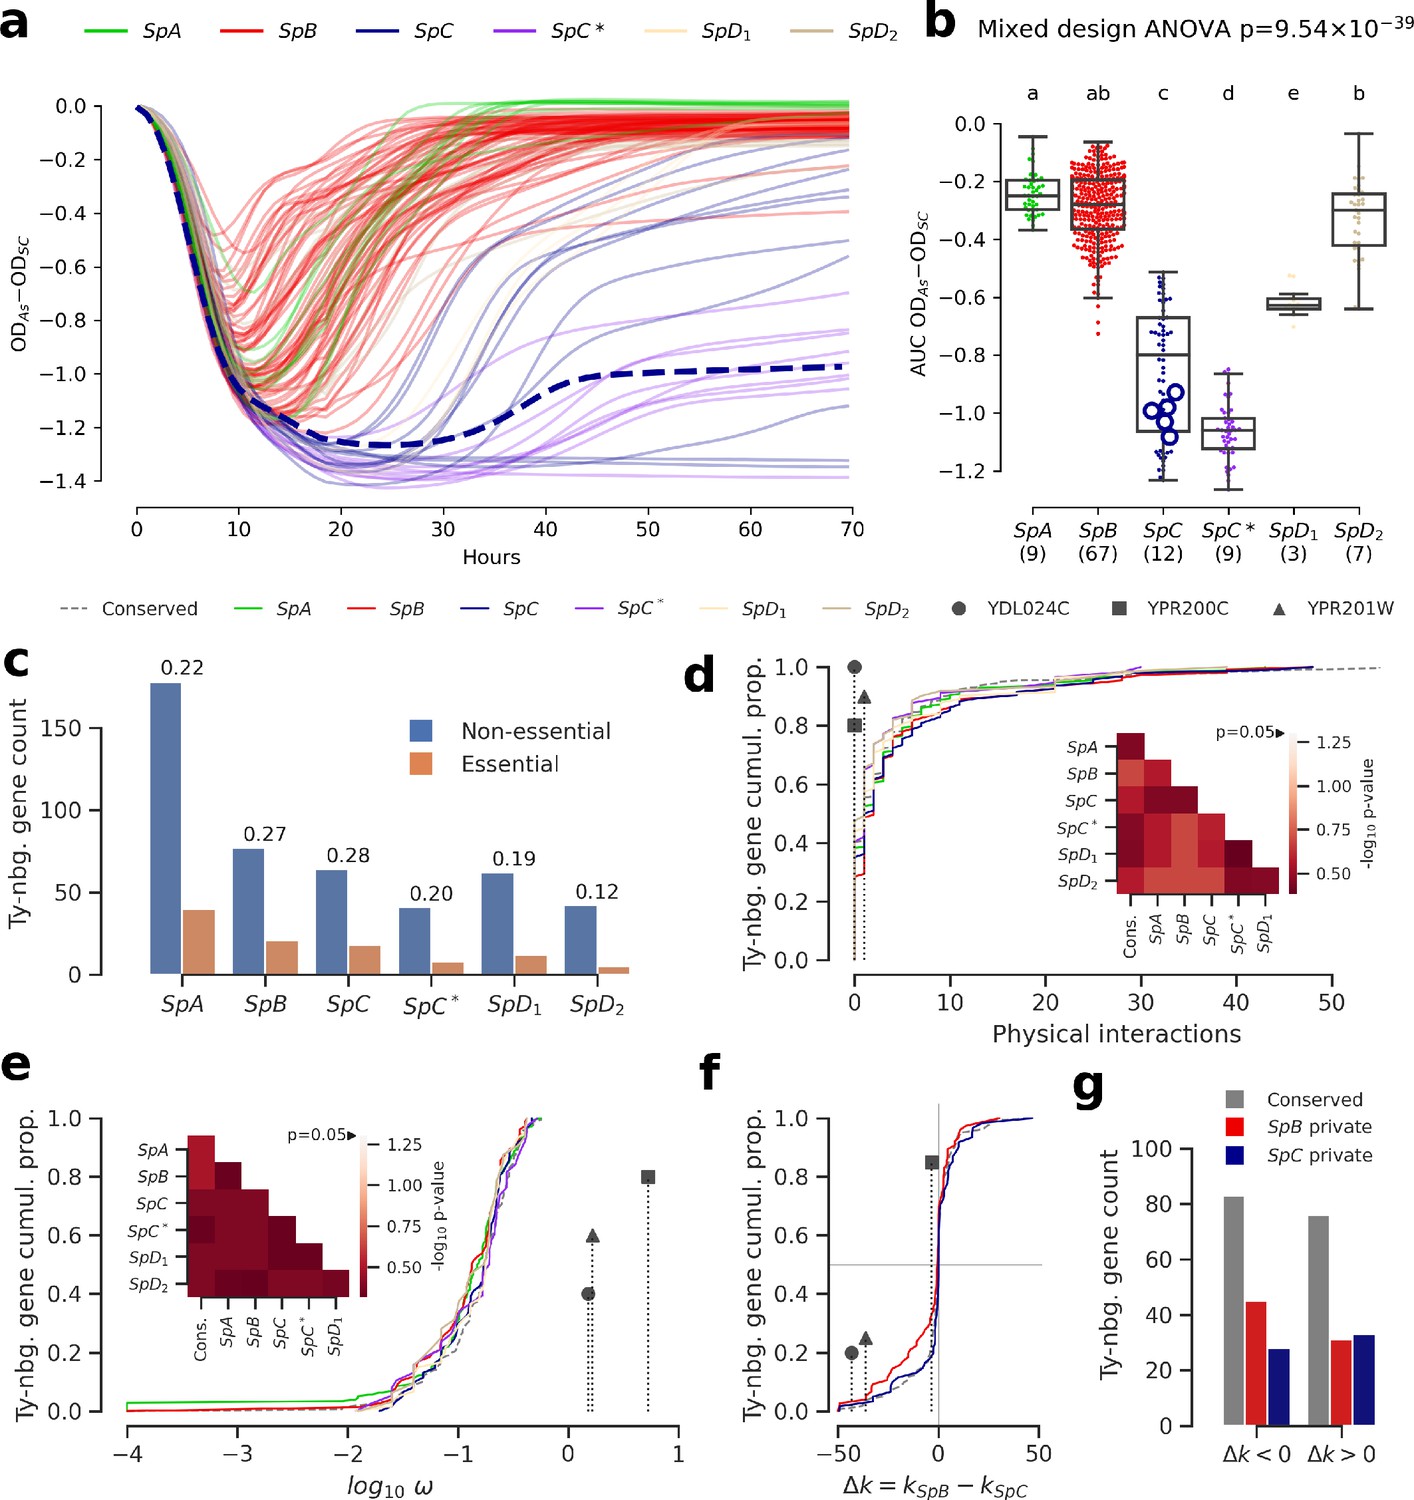
Genomic patterns of Ty insertions indicate that natural selection efficiency cannot explain CN variation in natural lineages.
(a) Difference between growth curves in 0.8 mM NaAsO2 (As) and control medium (synthetic complete, SC). Curves depict the difference in culture optical density (OD) through time, averaged across replicates and bins of four timepoints (one hour). 123 strains were assayed. SpC strain LL2011_004, which harbors a Ty1 insertion in ARR3, is represented by a dashed line. (b) Area under the curve (AUC) of the difference between growth curves in As and SC. Replicates of 107 strains that passed the criteria of number of replicates and homoscedasticity are shown. The number of strains per lineage is shown between parentheses. Replicates of the SpC strain LL2011_004 are highlighted with large empty circle symbols. Lowercase letters indicate groups that are not significantly different following Tukey’s HSD test. (c) Counts of essential and non-essential genes in the immediate vicinity of Ty insertions across the six whole-genome assemblies. Essential to non-essential ratios are shown on top of the bars. (d-e) Cumulative distributions of number of protein physical interactions (d) and ω (e) for genes neighboring conserved (dashed line) or private (solid lines) Ty insertions. Genes containing ORF-disrupting insertions are labeled with symbols. Heatmaps show FDR-corrected p-values for pairwise Mann-Whitney U tests between distributions. Color maps are centered at the significance threshold of 0.05. (f) Cumulative distributions of Δk between SpB and SpC. (g) Counts of neighboring genes with positive or negative Δk values.
-
Figure 5—source data 1
Growth data in SC and As for wild S. paradoxus strains.
- https://cdn.elifesciences.org/articles/60474/elife-60474-fig5-data1-v2.csv.zip
-
Figure 5—source data 2
Properties of genes neighboring Ty insertions in the six whole-genome assemblies.
- https://cdn.elifesciences.org/articles/60474/elife-60474-fig5-data2-v2.csv.zip
Figure 5—figure supplement 1
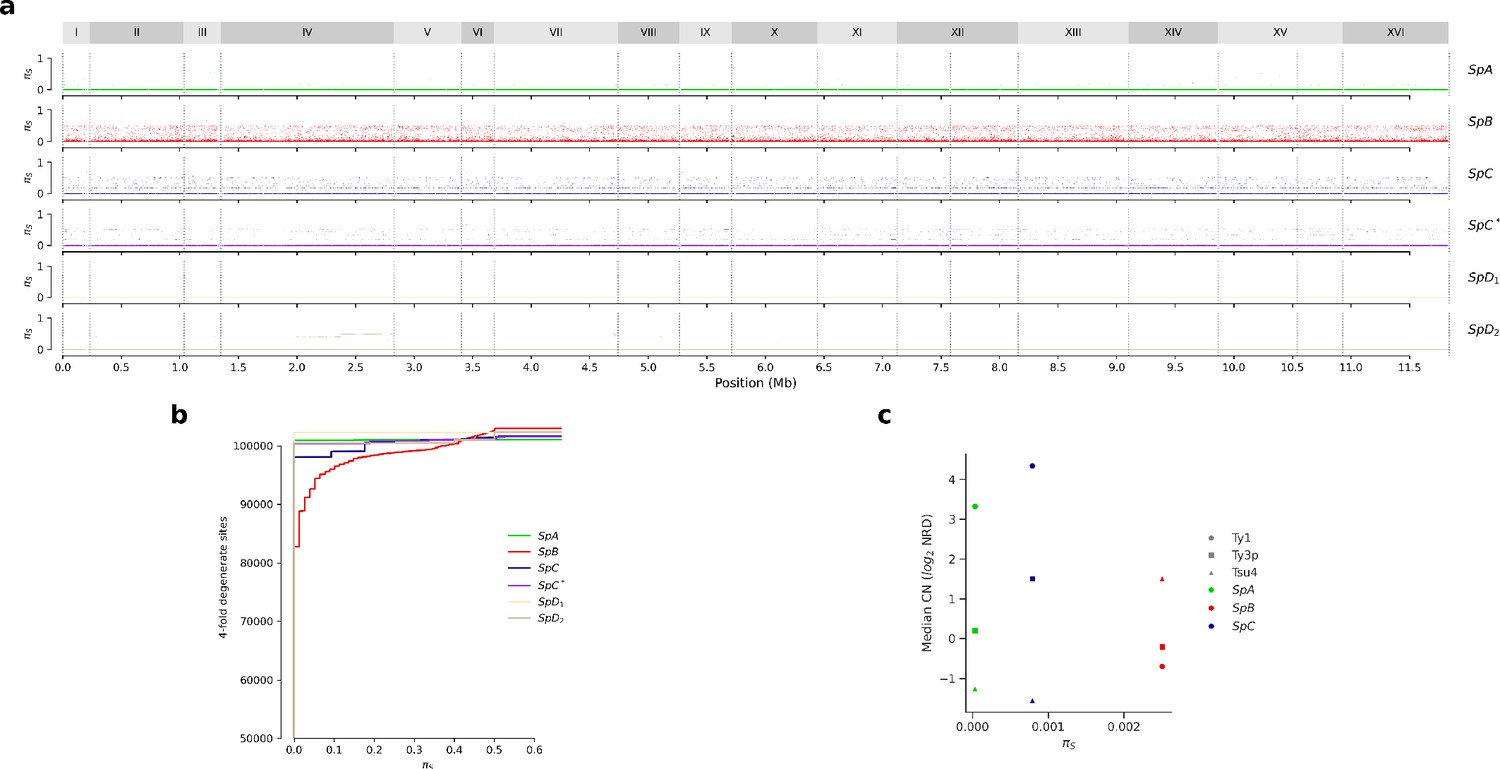
Synonymous diversity at fourfold degenerate codon positions (πS).
(a) Genome-wide πS. (b) Cumulative distributions of πS. (c) Median Ty CN per lineage as a function of πS.
Figure 5—figure supplement 2
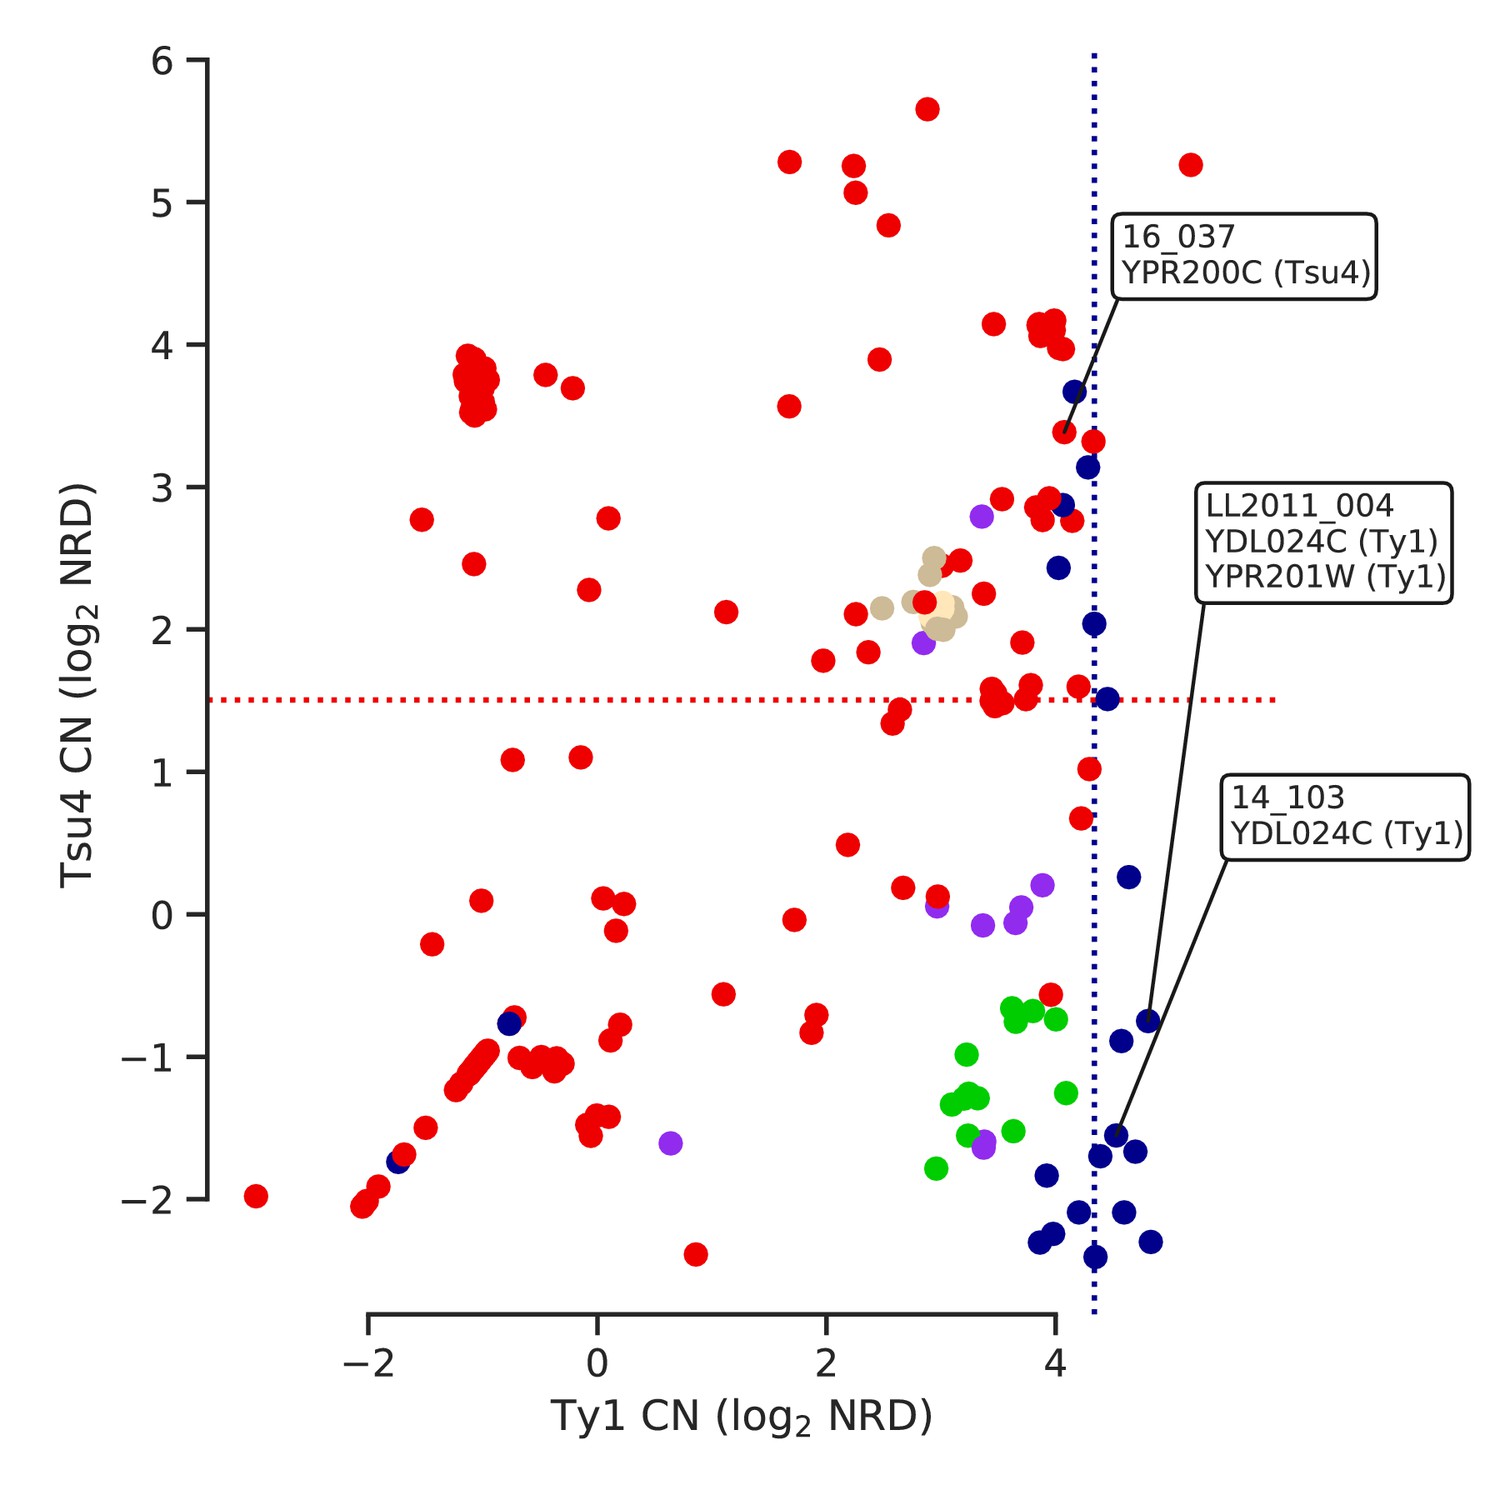
Ty copy numbers (CNs) of strains harboring ORF-disrupting insertions in relation with lineage-wide distributions of CN.
Strains with ORF-disrupting insertions are labelled with the corresponding gene and Ty family. Median Ty1 CN for SpC and median Tsu4 CN for SpB are shown as dotted lines.
Figure 5—figure supplement 3

Normalized depth of coverage at locus YDL024C-416.2 predicted to harbor Ty insertions.
Rows correspond to the 207 wild strains. Strains with predicted insertions are labelled on the y axes. Positions on the x axes correspond to 300 bp windows centered at the predicted locus.
Figure 5—figure supplement 4
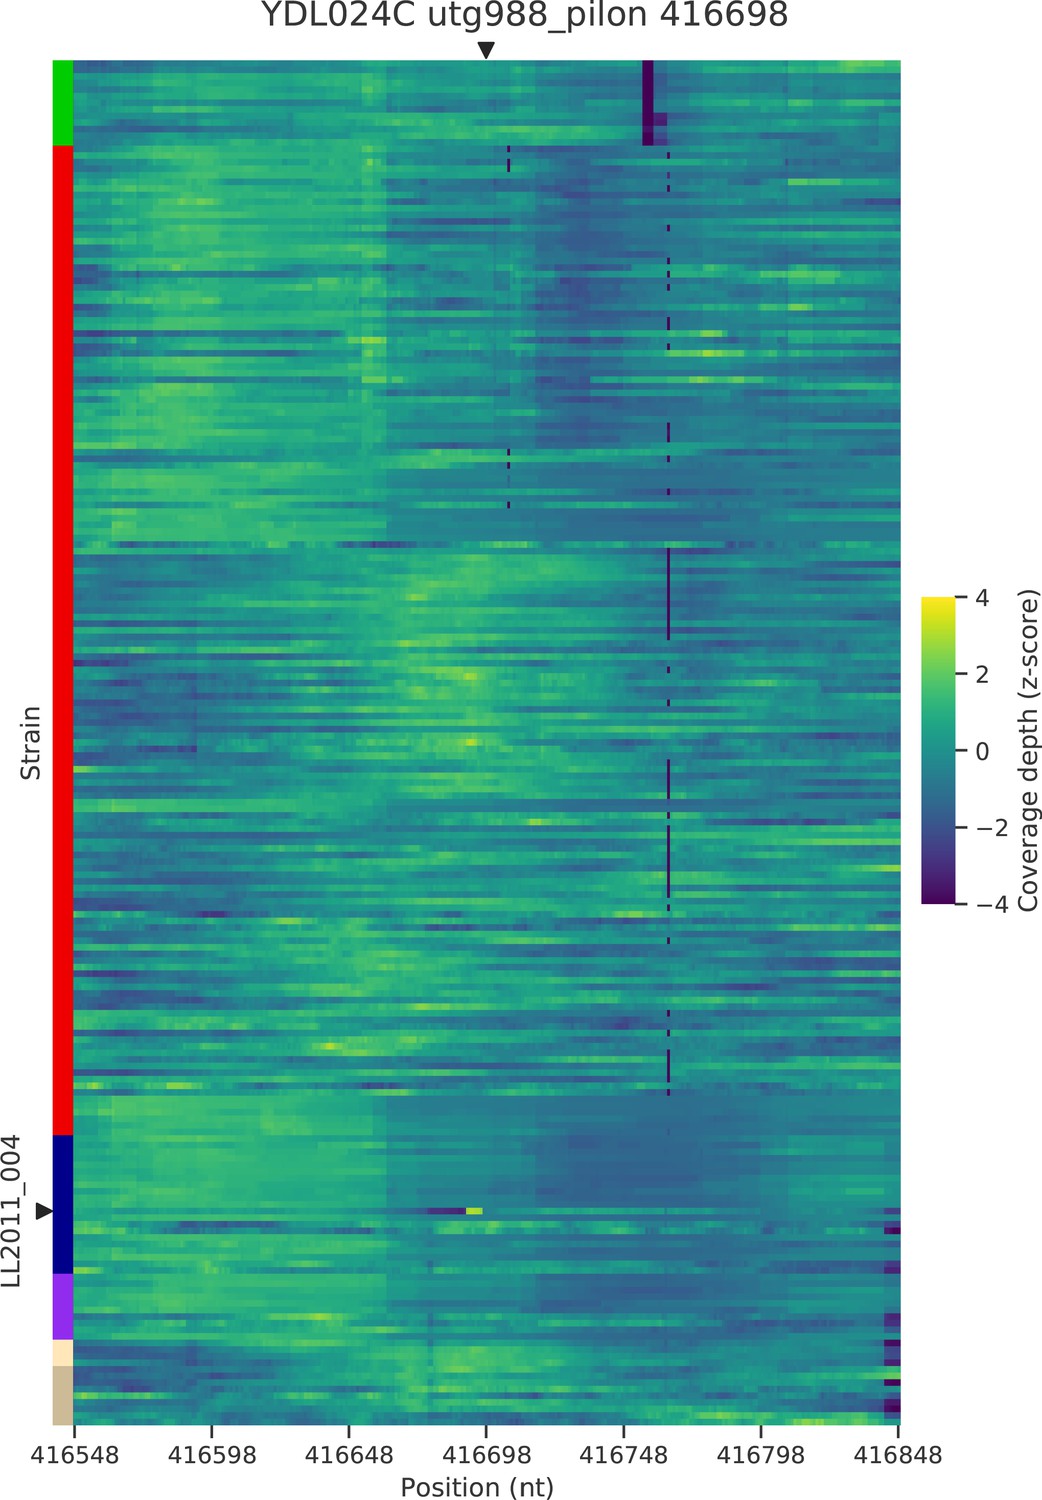
Normalized depth of coverage at locus YDL024C-416.7 predicted to harbor Ty insertions.
Rows correspond to the 207 wild strains. Strains with predicted insertions are labelled on the y axes. Positions on the x axes correspond to 300 bp windows centered at the predicted locus.
Figure 5—figure supplement 5
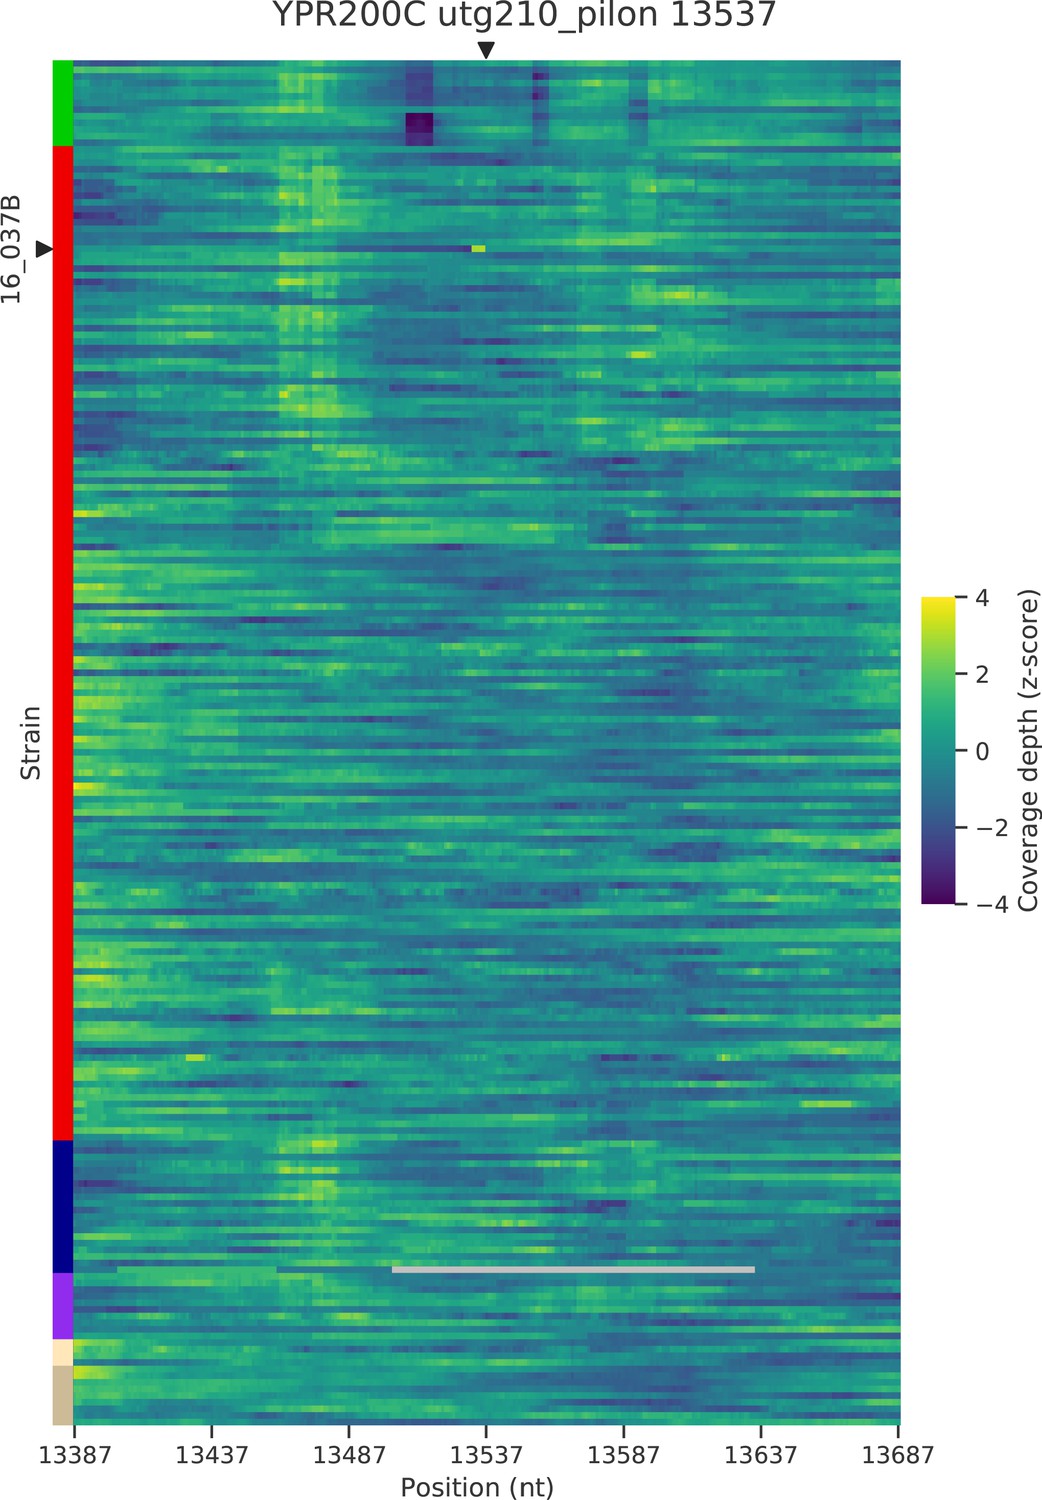
Normalized depth of coverage at locus YPR200C predicted to harbor Ty insertions.
Rows correspond to the 205 wild strains. Strains with predicted insertions are labelled on the y axes. Positions on the x axes correspond to 300 bp windows centered at the predicted locus.
Figure 5—figure supplement 6

Normalized depth of coverage at locus YPR201W predicted to harbor Ty insertions.
Rows correspond to the 206 wild strains. Strains with predicted insertions are labelled on the y axes. Positions on the x axes correspond to 300 bp windows centered at the predicted locus.
Figure 5—figure supplement 7

Determination of the optimal NaAsO2 concentration for growth measurements.
(a) Growth curve area under the curve (AUC) at various concentrations of arsenite. Three representative strains per lineage were assayed. (b) Growth curves showing optical density (OD) of cultures through time at 0, 0.4, 0.6, 0.8, and 1 mM NaAsO2. The SpC strain LL2011_004 (which harbors a Ty1 insertion in ARR3) is highlighted with dotted curves. 0.8 mM NaAsO2 was chosen as it best captures variation among SpC and SpC* strains.
Figure 5—figure supplement 8
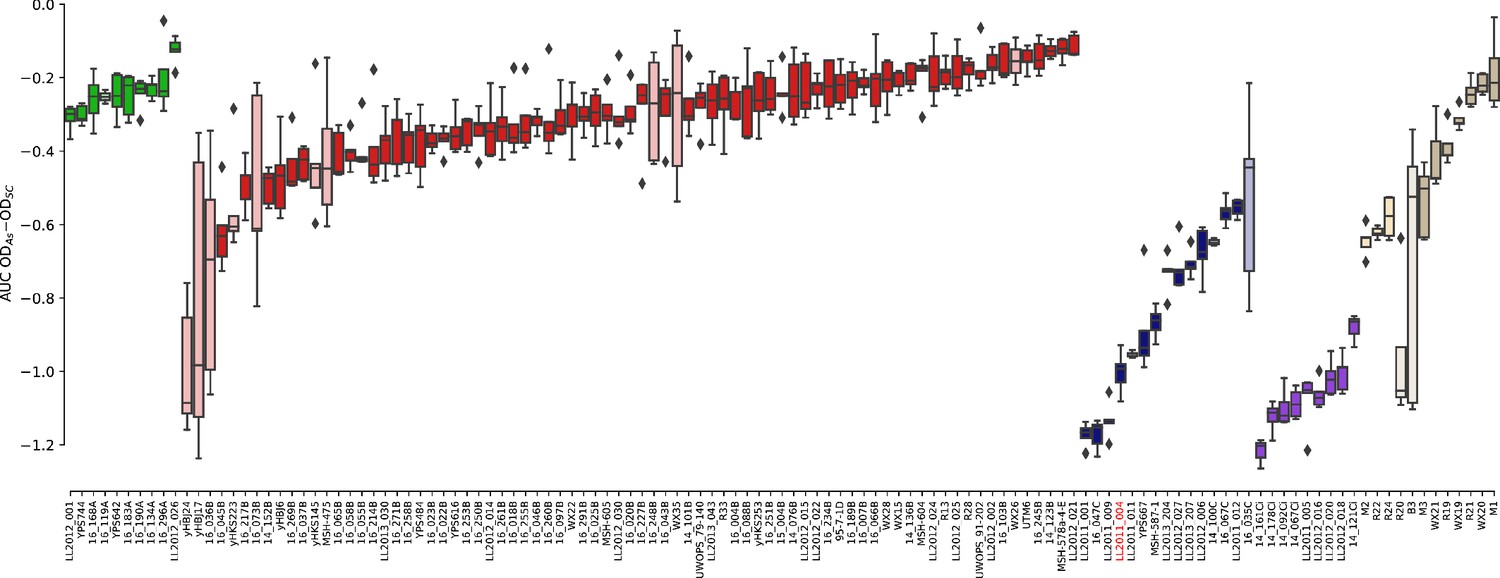
Growth measurements of the collection of 123 strains in 0.8 mM NaAsO2.
The difference between growth curves in 0.8 mM NaAsO2 (As) and control medium (synthetic complete, SC) for individual replicates of each strain is plotted. Boxes in light color represent strains that were excluded from the linear models due to outlier variance or insufficient number of replicates (see Materials and methods). Strain LL2011_004 is highlighted in red.
Figure 5—figure supplement 9
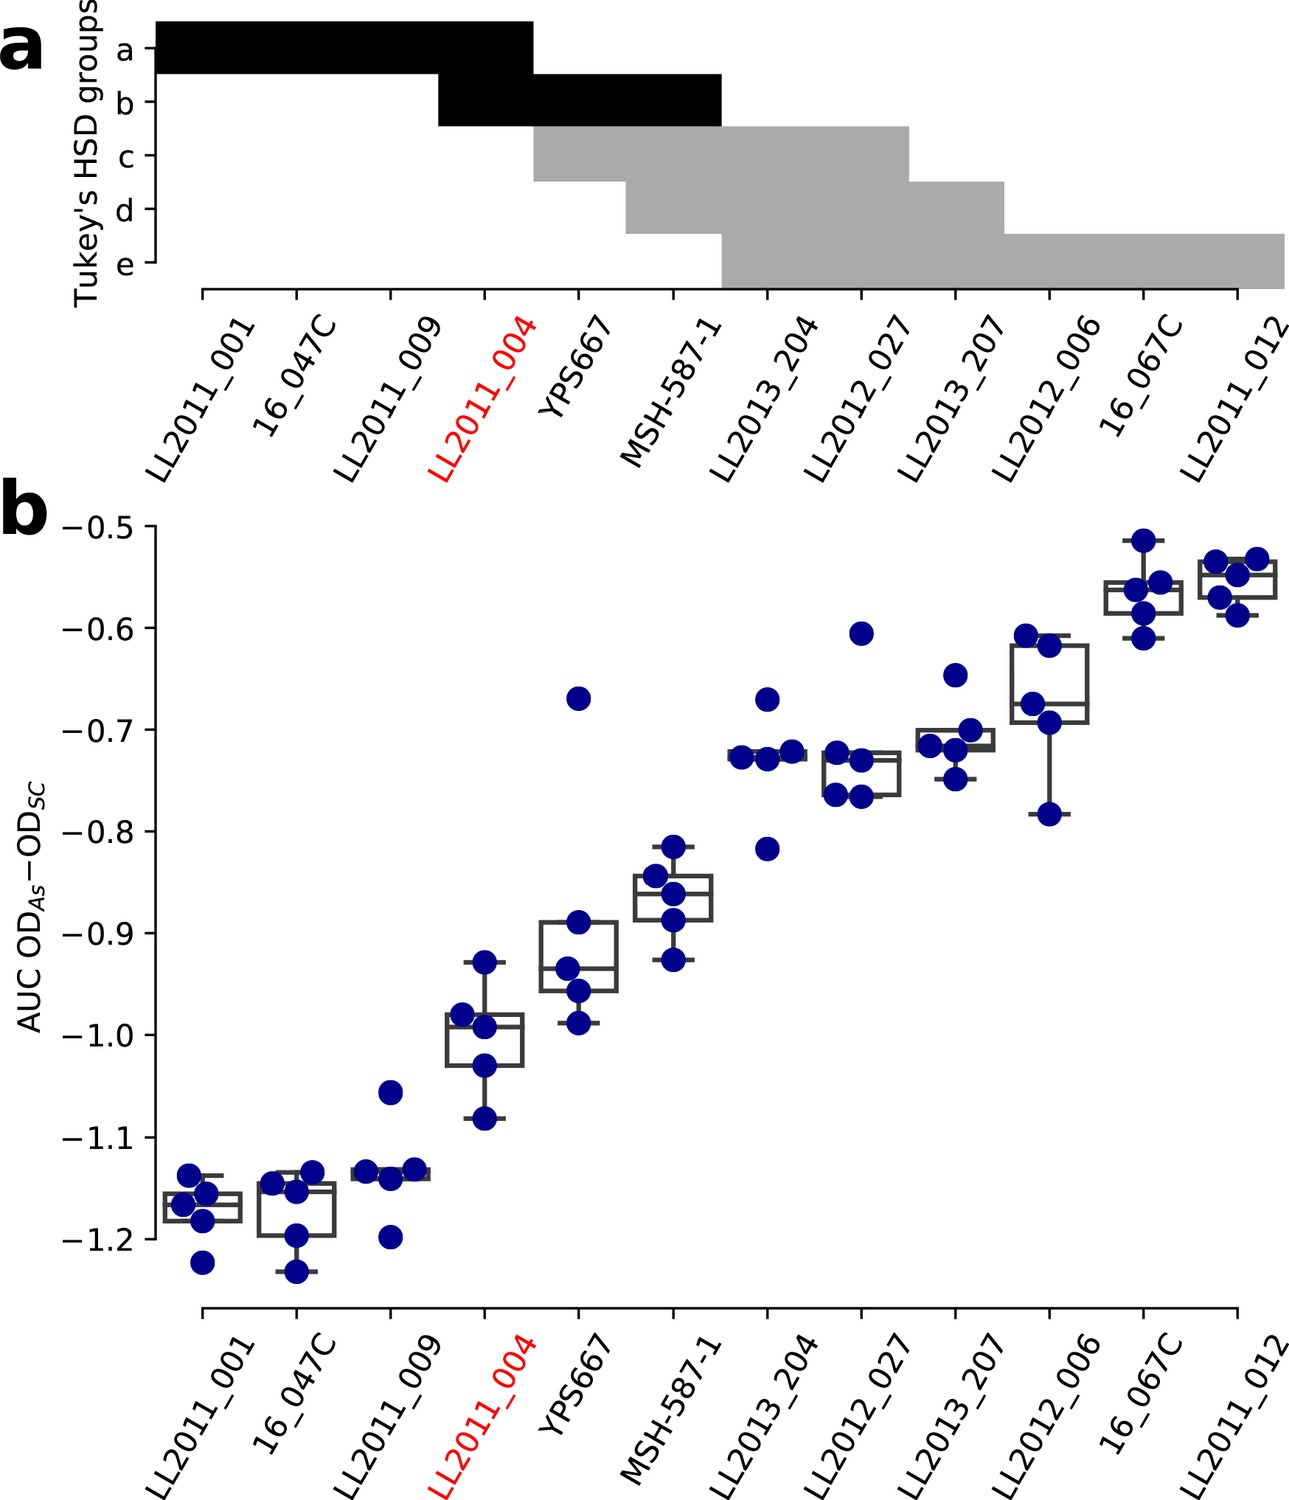
Growth variation in NaAsO2 within the SpC lineage.
(a) Groups of strains that are not significantly different from a Tukey’s HSD test on the area under the curve (AUC) of the difference between growth in 0.8 mM NaAsO2 (As) and control medium (synthetic complete, SC) for the SpC lineage. Groups comprising the strain LL2011_004 are shown in black. (b) The AUC of the difference between growth curves in As and SC for the SpC lineage. One-way ANOVA p=3.72 × 10⁻²⁶.
Figure 5—figure supplement 10
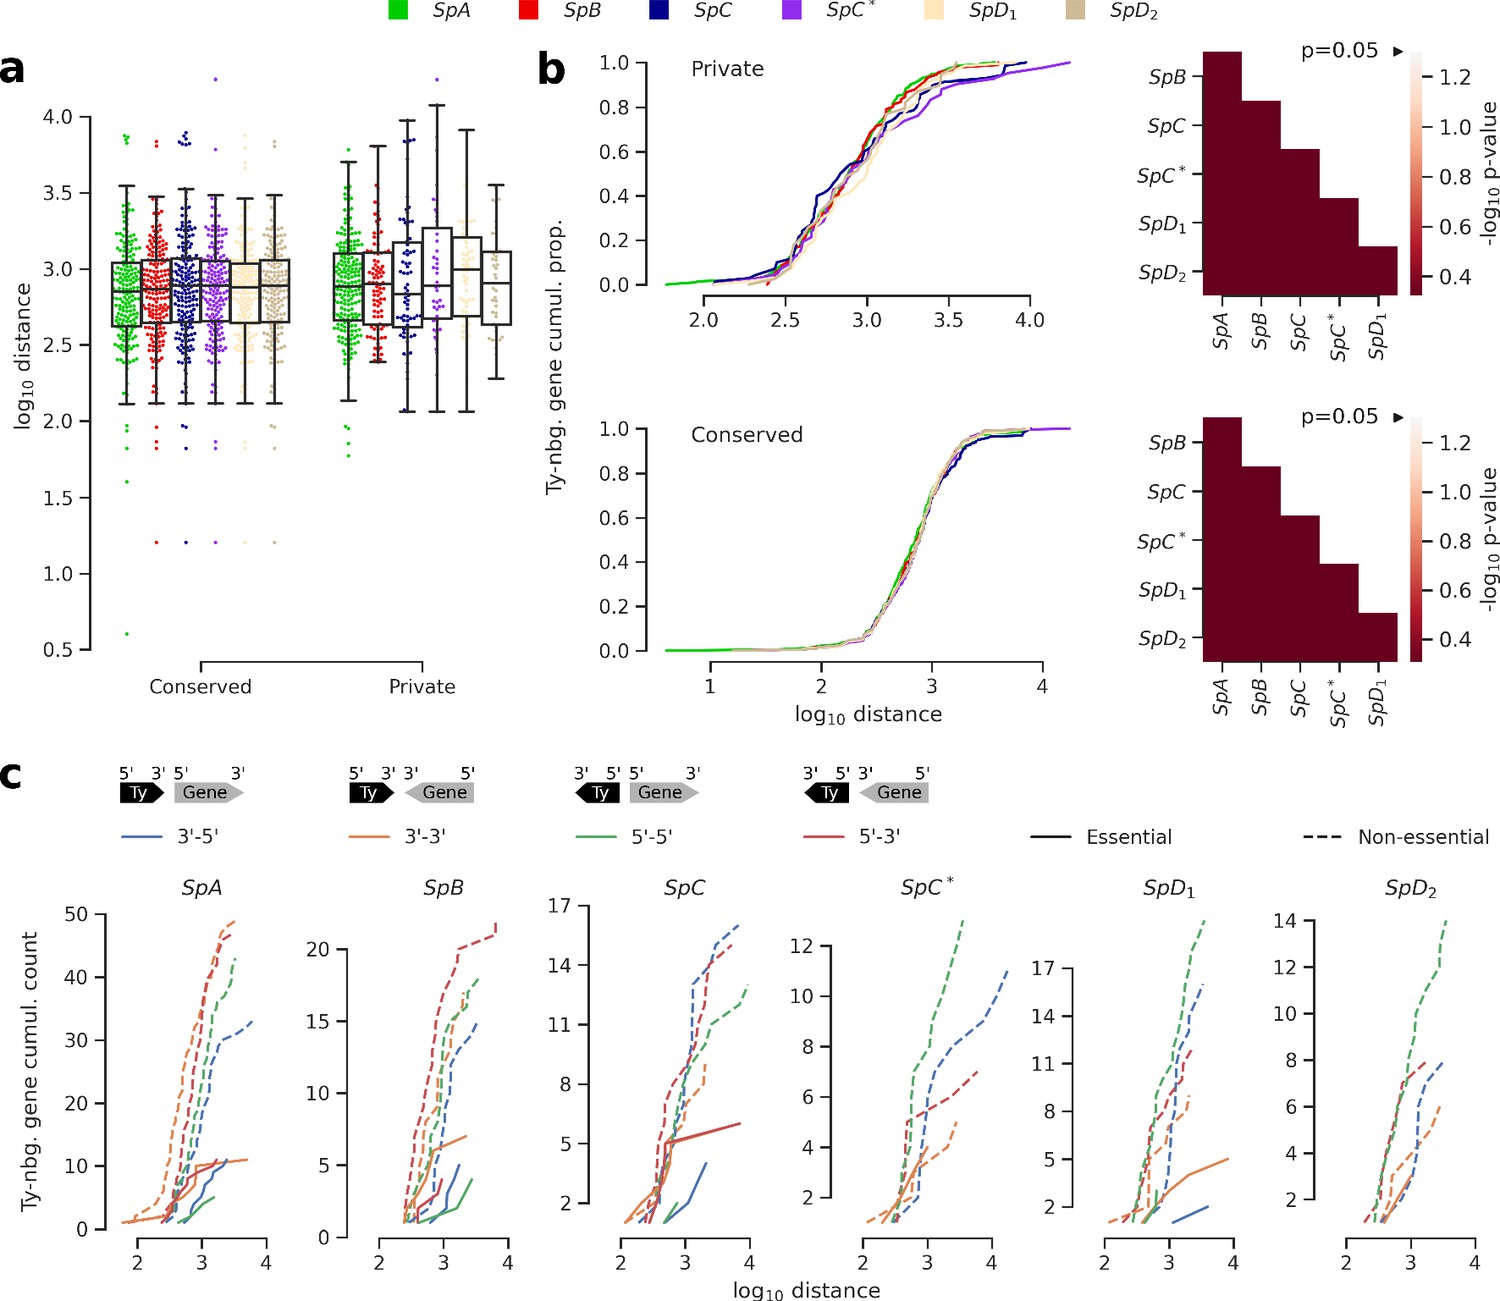
Distance and orientation of Ty insertions relative to neighboring genes.
(a) Distributions of distance to neighboring genes for Ty insertions conserved across the six genomes or private to one of them. (b) Cumulative distributions of distance to neighboring genes for private (top) or conserved (bottom) insertions. Heatmaps show FDR-corrected p-values for pairwise Mann-Whitney U tests between distributions. Color maps are centered at the significance threshold of 0.05. (c) Cumulative distributions of orientation of private Ty insertions relative to neighboring genes.
Figure 5—figure supplement 11

Neighbor joining phylogenetic trees of genes with ORF-disrupting Ty insertions.
Branch color corresponds to the k parameter fitted by RELAX.
Figure 6 with 1 supplement

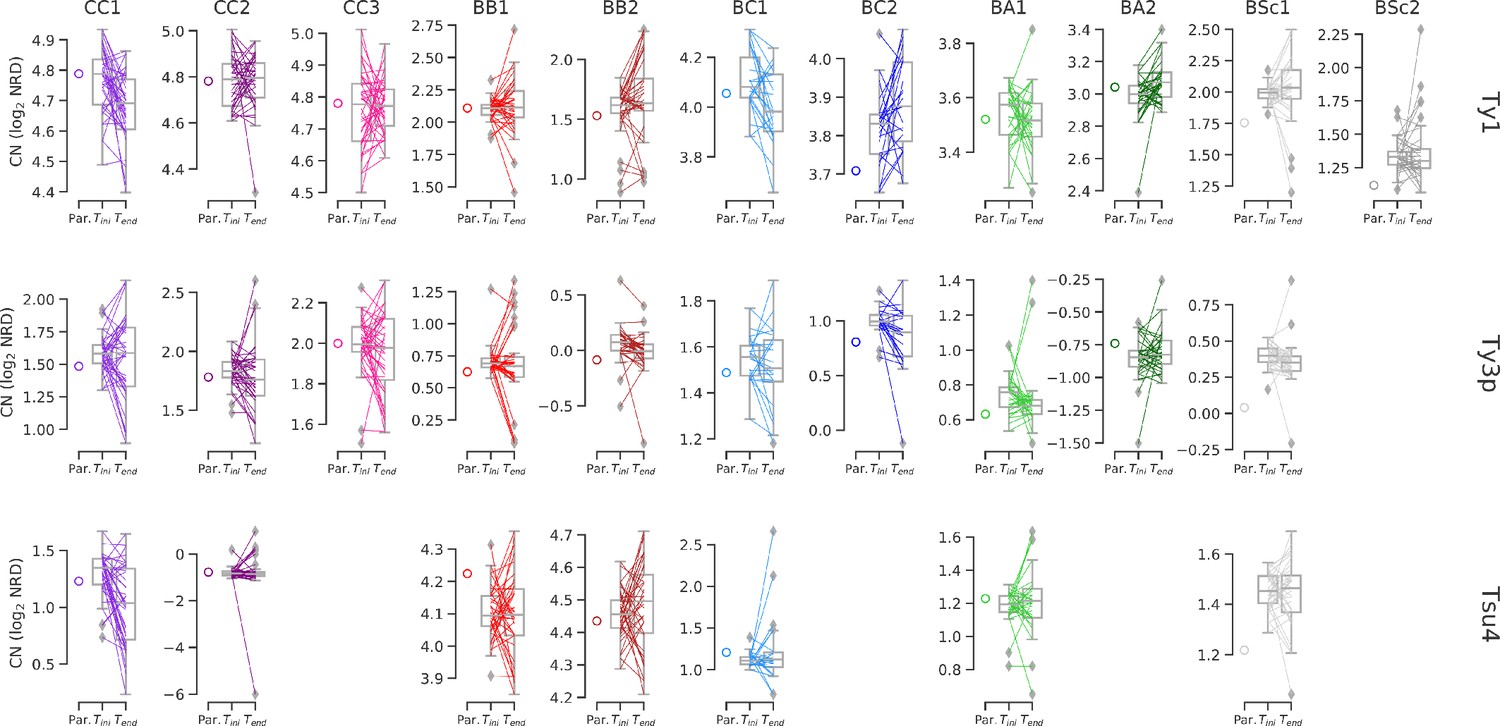
Ty copy number (CN) variation in mutation accumulation (MA) lines reveal no effect of parental divergence and major genotype-specific effects.
(a) Principle of an MA experiment on a yeast population. N corresponds to population size. (b) Bayesian phylogenetic tree of the parental haploid strains used to generate artificial hybrids. (c) Design of the crosses for the MA experiment. (d) Ty CNs in the haploid parental strains of each cross in c. (e) CN at the onset (Tini, empty boxes) and at the end (Tend, filled boxes) of the MA experiment. Whiskers span 1.5 times the interquartile range. FDR-corrected p-values of Wilcoxon signed-rank tests and Brown–Forsythe tests for the equality of variances are shown in black and blue, respectively. ns: p≥0.05, *: p<0.05, **: p<0.01, ***: p<0.001. (f) Linear models explaining the mean variation in CN (ΔCN = CNTend−CNTini) for a given cross as a function of the joint CN and genetic divergence of its parental strains. The p-value for each term in the models is shown. Scatter plots (CCPR plots) show the partial residuals for each independent variable, along with the fitted regression.
-
Figure 6—source data 1
Ty CNs for the haploid parental strains of the MA crosses.
- https://cdn.elifesciences.org/articles/60474/elife-60474-fig6-data1-v2.csv.zip
-
Figure 6—source data 2
Evolutionary divergence between haploid parental strains of the MA crosses.
- https://cdn.elifesciences.org/articles/60474/elife-60474-fig6-data2-v2.csv.zip
Figure 6—figure supplement 1
Ty CNs in MA lines with predicted values for the combination of parental CNs.
CN values are the same as shown in Figure 6e, excepted that they are not normalized for median Tini CN. Whiskers span 1.5 times the interquartile range. Colored lines denote individual strains.
Tables
Key resources table
| Reagent type (species) or resource | Designation | Source or reference | Identifiers | Additional information |
|---|---|---|---|---|
| Sequence-based reagent | Forward primer to construct the deletion cassette for the ADE2 gene in SpC | Charron et al., 2019 | CLOP97-F5 | acaattaaggaatcaagaaaccgt gataaaaaattcaagt CAGCTGAAGCTTCGTACGC |
| Sequence-based reagent | Reverse primer to construct the deletion cassette for the ADE2 gene in SpC | Charron et al., 2019 | CLOP97-F6 | gtaattgttcgctggccaagtata ttaatacatttatata GCATAGGCCACTAGTGGATC |
| Strain, strain background (Saccharomyces paradoxus) | Haploid parent for MA lines | Charron et al., 2014 | LL2011_001 MATa hoΔ::kanMX4 | |
| Strain, strain background (Saccharomyces paradoxus) | Haploid parent for MA lines | This study | LL2011_001 MATa hoΔ::kanMX4 ade2Δ::hphNT1 | Haploid yeast strain with ho and ade2 deletions. See Materials and methods section Mutation accumulation |
| Strain, strain background (Saccharomyces paradoxus) | Haploid parent for MA lines | Leducq et al., 2016 | LL2011_012 MATa hoΔ::kanMX4 | |
| Strain, strain background (Saccharomyces paradoxus) | Haploid parent for MA lines | This study | LL2011_012 MATa hoΔ::kanMX4 ade2Δ::hphNT1 | Haploid yeast strain with ho and ade2 deletions. See Materials and methods section Mutation accumulation |
| Strain, strain background (Saccharomyces paradoxus) | Haploid parent for MA lines | Charron et al., 2014 | MSH-587–1 MATa hoΔ::natMX4 | |
| Strain, strain background (Saccharomyces paradoxus) | Haploid parent for MA lines | This study | MSH-587–1 MATa hoΔ::natMX4 ade2Δ::hphNT1 | Haploid yeast strain with ho and ade2 deletions. See Materials and methods section Mutation accumulation |
| Strain, strain background (Saccharomyces paradoxus) | Haploid parent for MA lines | Charron et al., 2019 | LL2011_004 MATα hoΔ::kanMX4 ade2Δ::hphNT1 | |
| Strain, strain background (Saccharomyces paradoxus) | Haploid parent for MA lines | Charron et al., 2019 | LL2011_009 MATα hoΔ::natMX4 ade2Δ::hphNT1 |
Additional files
-
Supplementary file 1
Supplementary tables.
(a) Description of the wild strains used in this study. CNs of full-length Ty1, Ty3p and Tsu4 (expressed as log2 NRD) are indicated for individual strains. (b) AIC values for linear models testing the association between population structure and environmental variation. (c) Nucleotide diversity at four-fold degenerate sites in protein-coding genes (πS). (d) Primers used for ADE2 deletion in the parental SpC strains generated in this study. Primers were described in Charron et al., 2019. (e) Parental strains used in the MA experiment made in this study. (f) Description of the MA lines used in this study. CNs of full-length Ty1, Ty3p and Tsu4 (expressed as log2 NRD) are indicated for individual strains.
- https://cdn.elifesciences.org/articles/60474/elife-60474-supp1-v2.xlsx
-
Supplementary file 2
Custom scripts used for data analyses.
- https://cdn.elifesciences.org/articles/60474/elife-60474-supp2-v2.zip
-
Transparent reporting form
- https://cdn.elifesciences.org/articles/60474/elife-60474-transrepform-v2.docx
Download links
A two-part list of links to download the article, or parts of the article, in various formats.
Downloads (link to download the article as PDF)
Open citations (links to open the citations from this article in various online reference manager services)
Cite this article (links to download the citations from this article in formats compatible with various reference manager tools)
The effect of hybridization on transposable element accumulation in an undomesticated fungal species
eLife 9:e60474.
https://doi.org/10.7554/eLife.60474


