Structural insights into the Ca2+-dependent gating of the human mitochondrial calcium uniporter
- Department of Physiology, University of Texas Southwestern Medical Center, United States
- Department of Biophysics, University of Texas Southwestern Medical Center, United States
- Howard Hughes Medical Institute, University of Texas Southwestern Medical Center, United States
- Howard Hughes Medical Institute and Department of Molecular Biology, Massachusetts General Hospital, Harvard Medical School, Broad Institute, United States
- Department of Cell Biology, University of Texas Southwestern Medical Center, United States
Figures
Figure 1 with 6 supplements
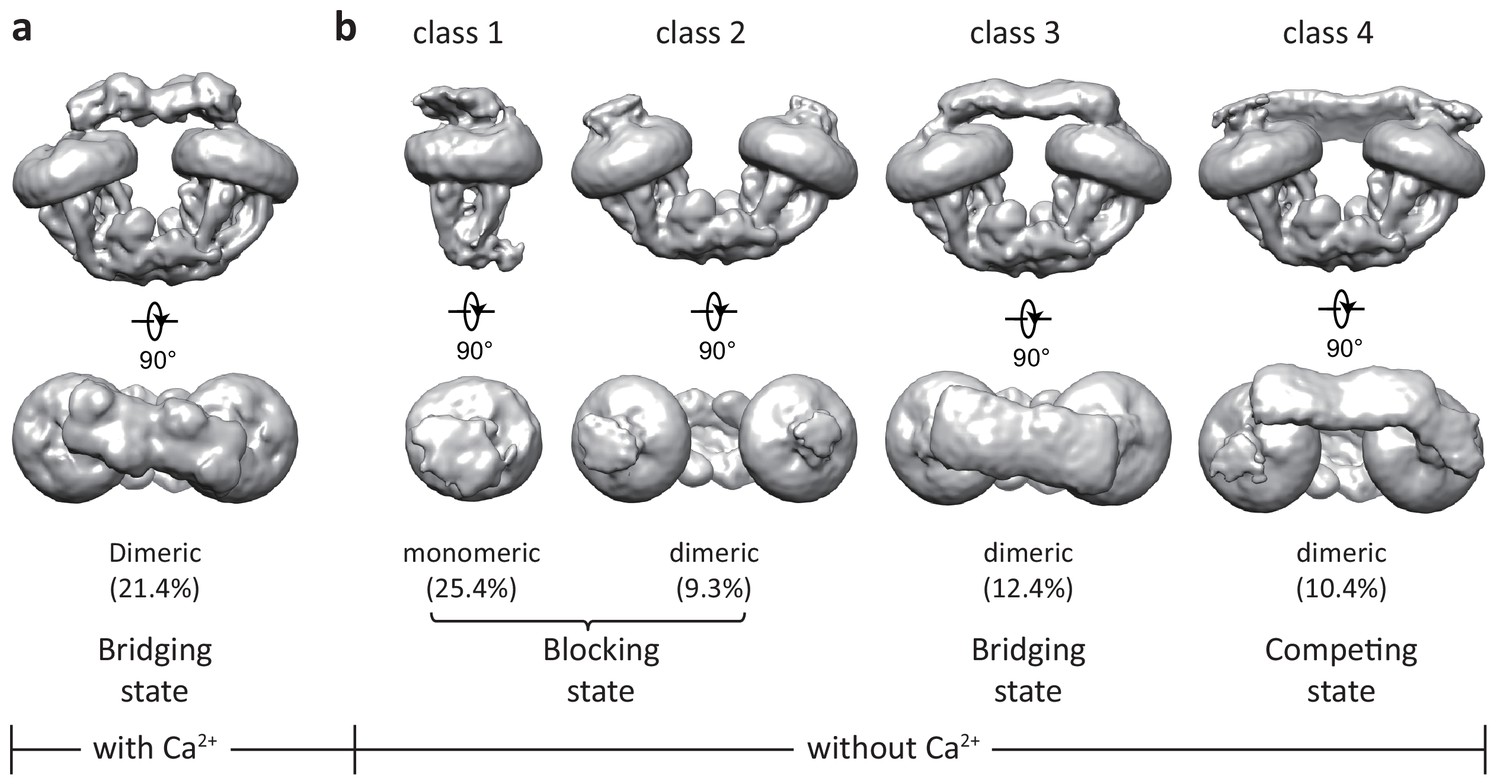
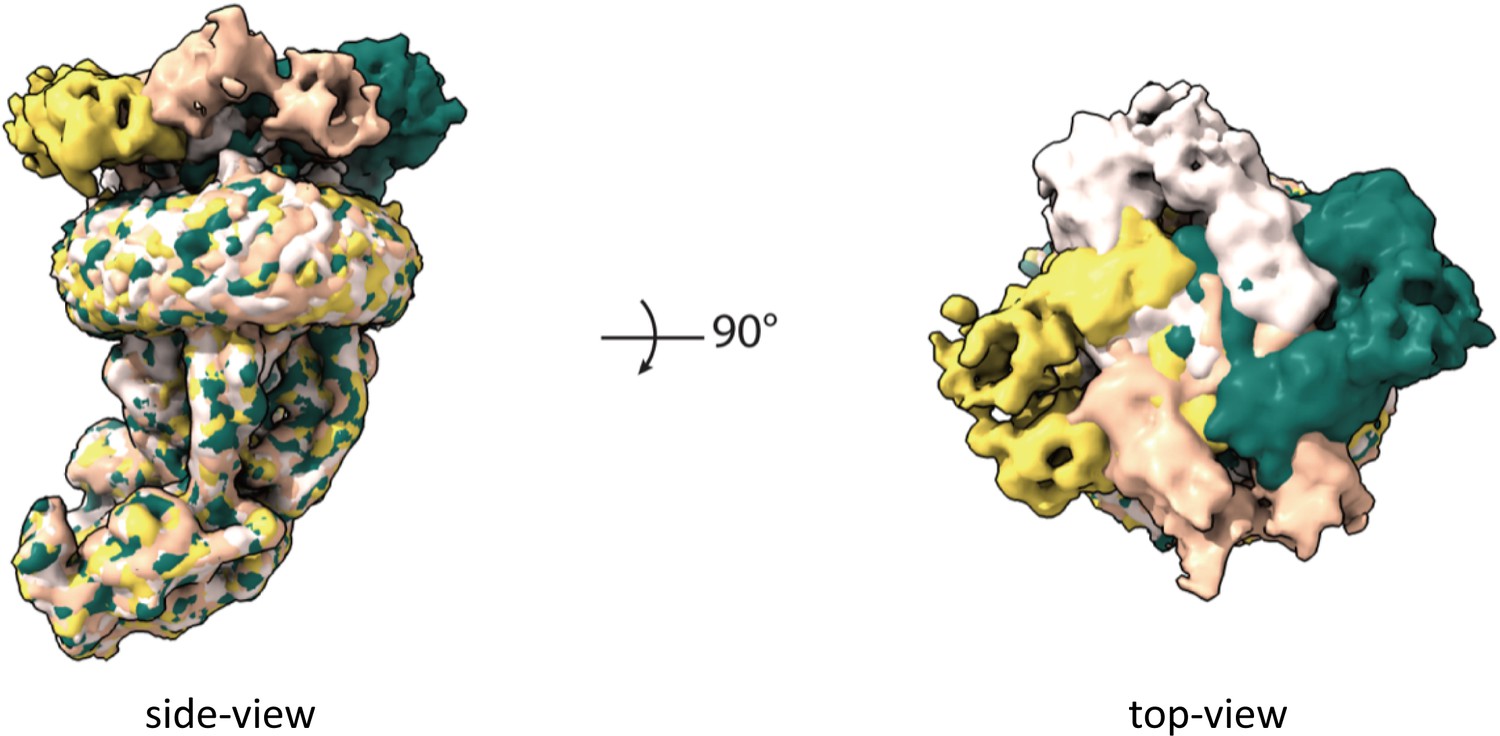
Initial 3D classifications of the human MCU-EMRE-MICU1-MICU2 holocomplex (uniplex) in the presence and absence of Ca2+.
Numbers in parentheses denote the percentage of particles for each class. (a) The major class of particles from the uniplex sample prepared in the presence of 2 mM Ca2+. (b) Four classes of particles from the uniplex sample prepared in the absence of Ca2+ (with 2 mM EGTA).
-
Figure 1—source data 1
Cryo-EM data collection, refinement and validation statistics.
- https://cdn.elifesciences.org/articles/60513/elife-60513-fig1-data1-v3.doc
Figure 1—figure supplement 1
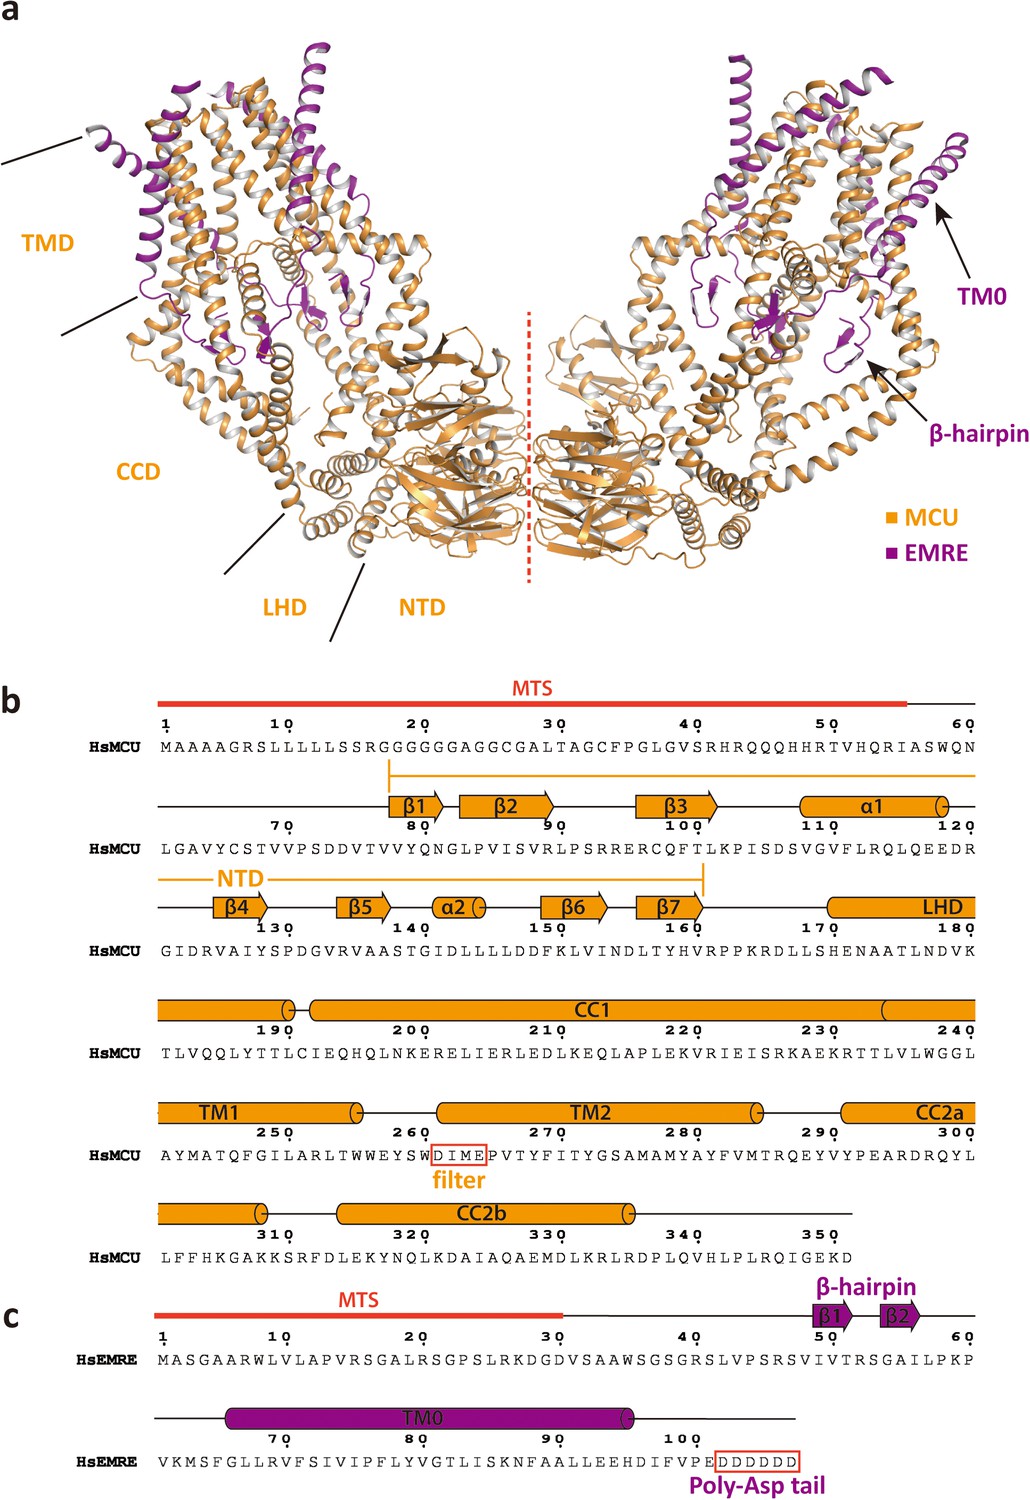
Structure of the MCU-EMRE subcomplex.
(a) Structure of a dimeric MCU-EMRE subcomplex. Red line marks the dimerization interface. (b) Sequence and secondary structure assignment of an HsMCU subunit. (c) Sequence and secondary structure assignment of an HsEMRE subunit.
Figure 1—figure supplement 2
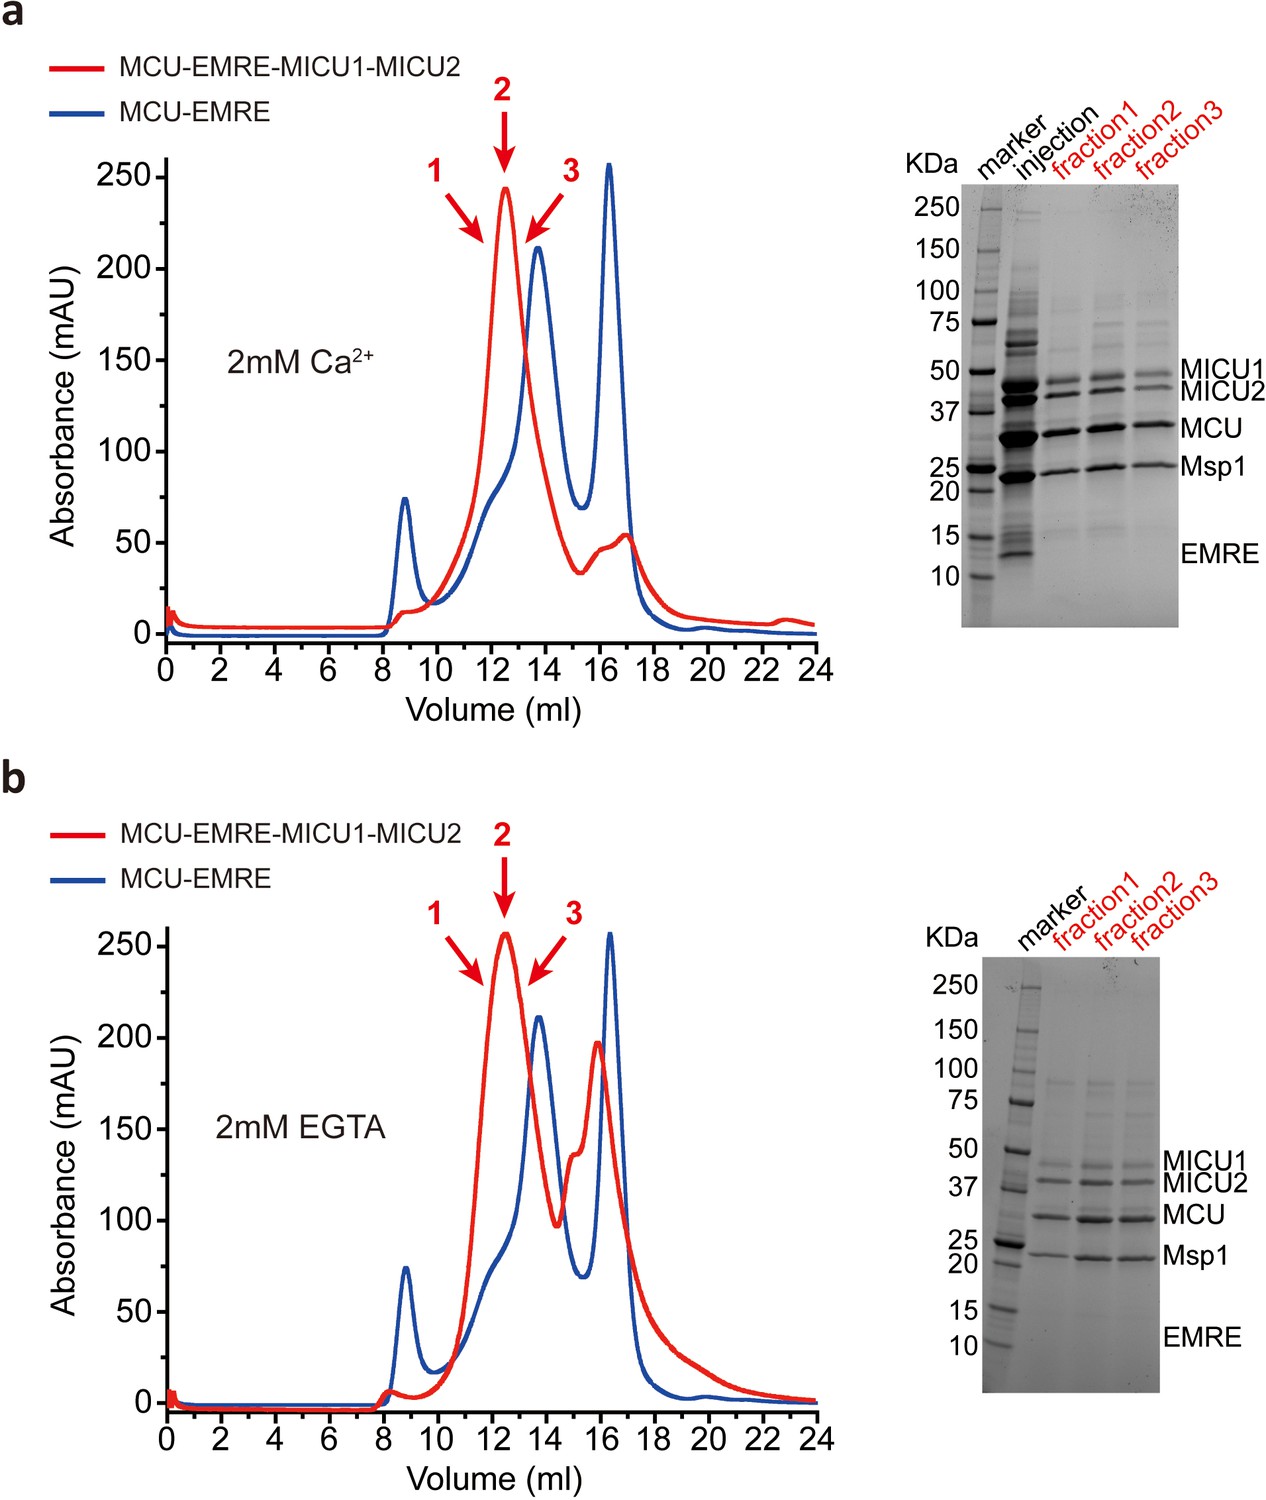
Purification of the human MCU-EMRE-MICU1-MICU2 holocomplex reconstituted into nanodisc.
(a) SEC profile (left) of MCU-EMRE-MICU1-MICU2 holocomplex (red) reconstituted in nanodisc and purified in the presence of 2 mM Ca2+. The profile of the MCU-EMRE subcomplex in nanodisc (blue) is shown for comparison. Arrows indicate the three sample fractions shown on SDS PAGE (right). (b) SEC profile (left) and SDS PAGE (right) of the MCU-EMRE-MICU1-MICU2 holocomplex (red) reconstituted in nanodisc and purified in the absence of Ca2+ (with 2 mM EGTA).
Figure 1—figure supplement 3
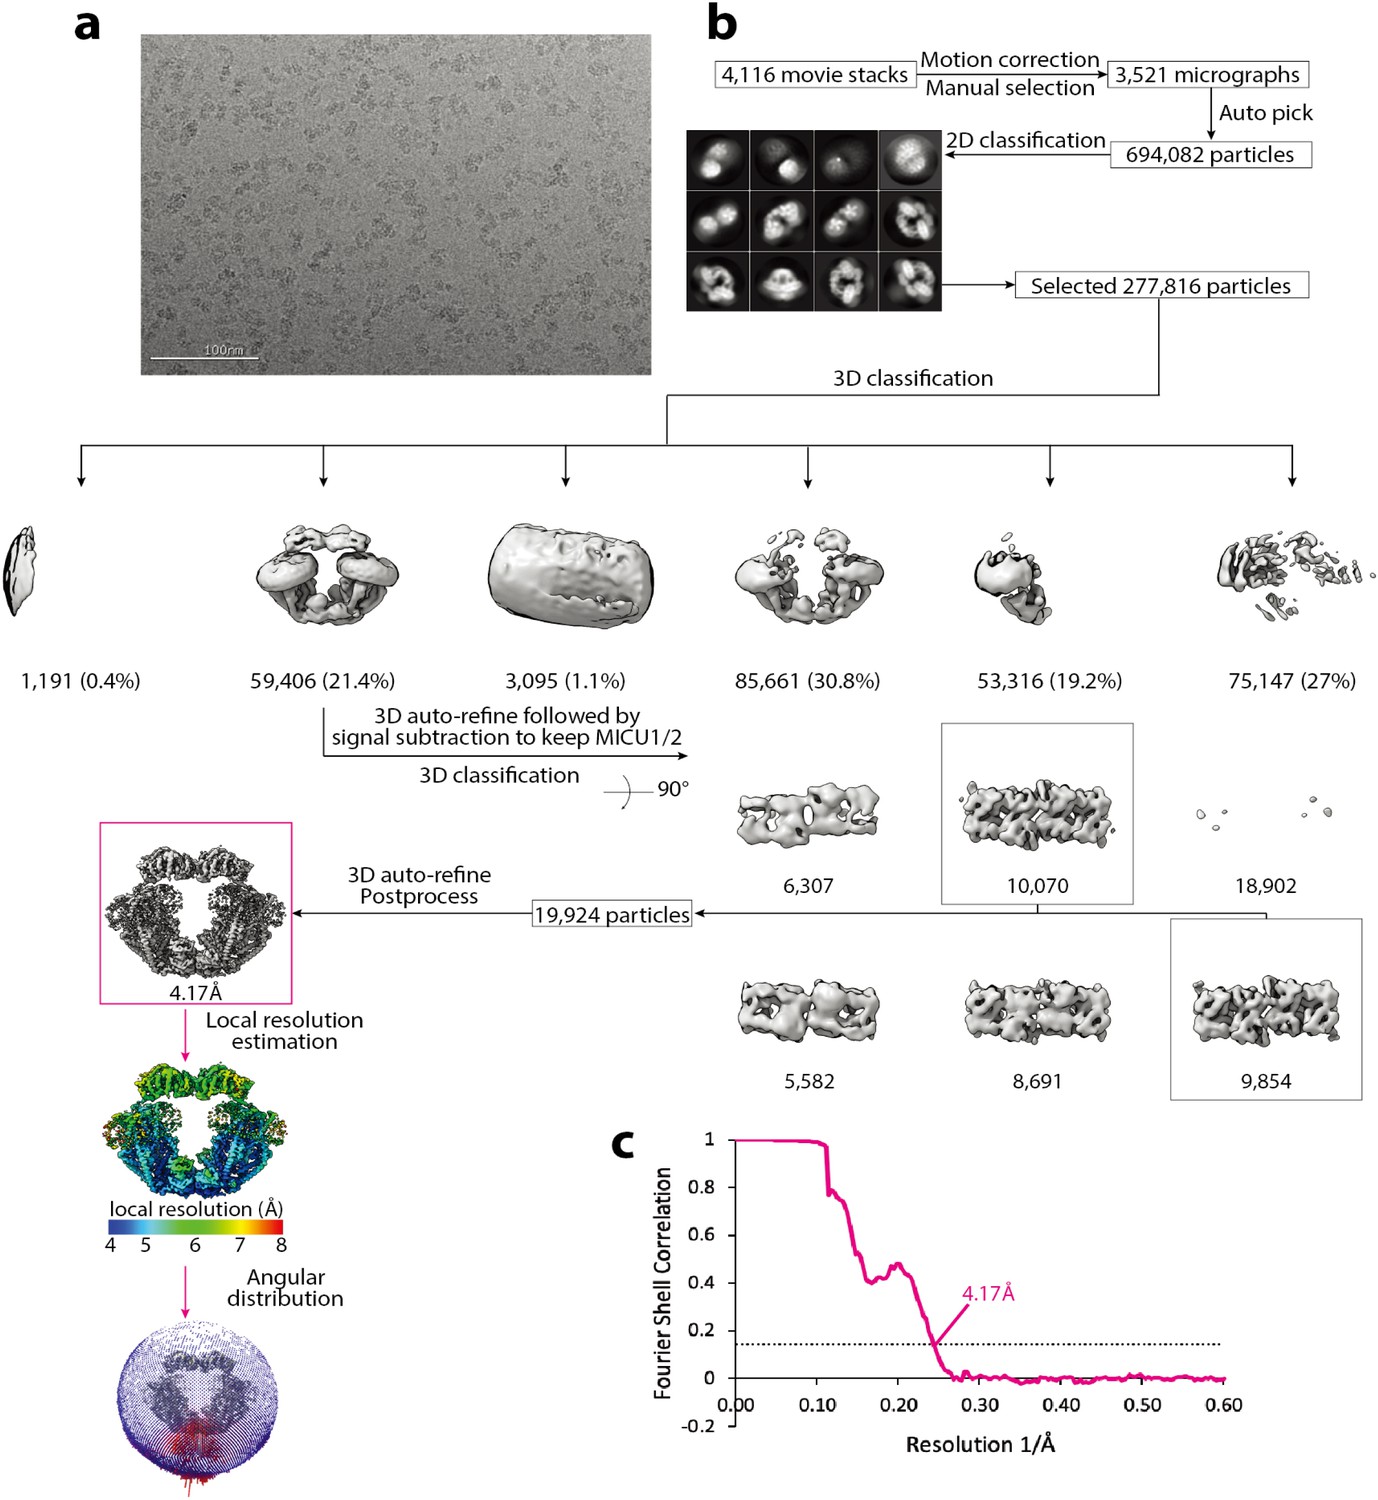
Cryo-EM data processing scheme of the uniplex assembly in the presence of Ca2+.
(a) A representative micrograph. Scale bar is at 100 nm. (b) Flow chart of the cryo-EM data processing procedure. Selected 2D class averages are shown. The number of particles are indicated under the corresponding 3D classes with the percentage of the selected particles after 2D classification in parentheses for the first round of 3D classification. (c) Fourier Shell Correlation curves showing the overall resolution of 4.17 Å (FSC = 0.143) for the dimeric (magenta) form of the uniplex.
Figure 1—figure supplement 4

Cryo-EM data processing scheme of the uniplex assemblies in the absence of Ca2+.
(a) A representative micrograph. Scale bar is at 100 nm. (b) Flow chart of the cryo-EM data processing procedure. Selected 2D class averages are shown. The number of particles are indicated under the corresponding 3D classes with the percentage of the selected particles after 2D classification in parentheses for the first round of 3D classification. Selected classes are indicated in colored boxes. (c) Fourier Shell Correlation curves showing the overall resolution at FSC = 0.143 for the corresponding uniplex assemblies.
Figure 1—figure supplement 5
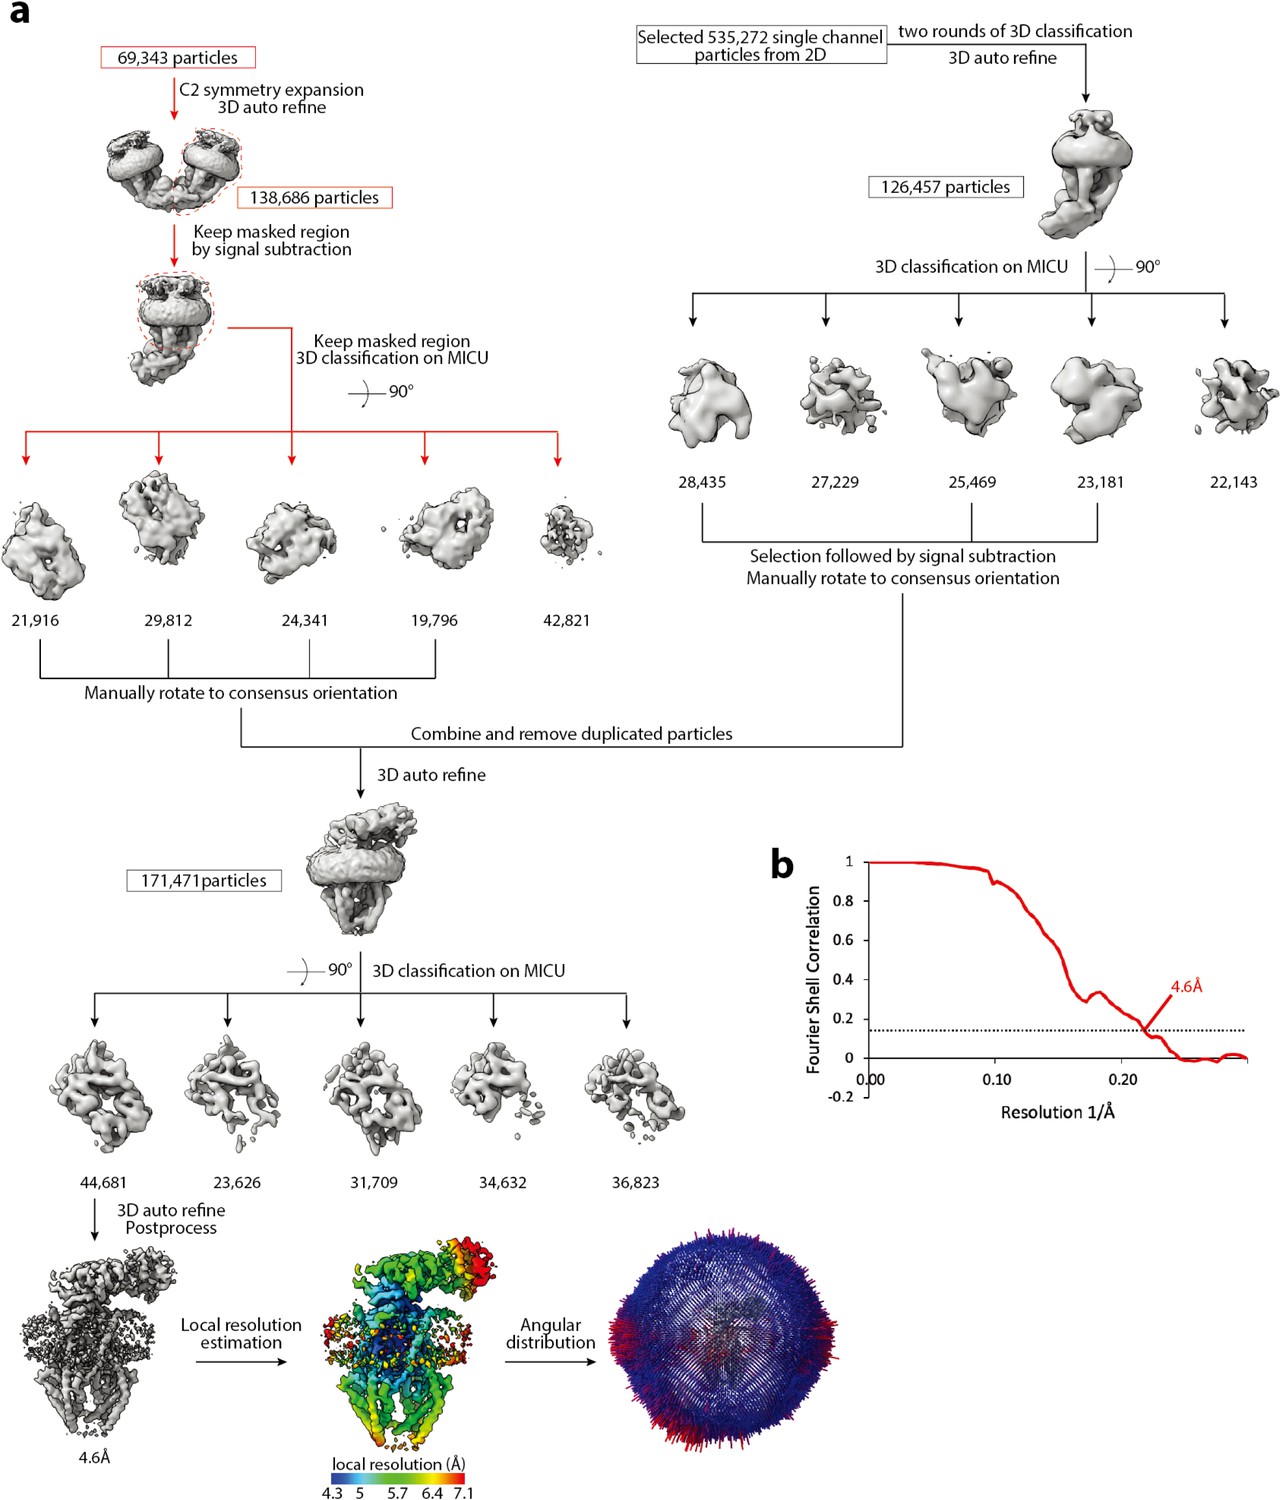
Cryo-EM data processing scheme of the apo blocked uniplex.
(a) Flow chart of the cryo-EM data processing procedure. The particles of the dimeric uniplex were taken from Figure 1—figure supplement 4, and the particles of monomeric uniplex were re-selected from 2D class averages. Both were further classified based on the density of MICU1-MICU2 and combined. Duplicated particles were removed from the star file. The number of particles are indicated under the corresponding 3D classes. (b) Fourier Shell Correlation curve showing the overall resolution of 4.6 Å (FSC = 0.143) for the apo blocked uniplex.
Figure 1—figure supplement 6

Sequence and secondary structure assignment of human MICU1 (upper) and MICU2 (lower).
Figure 2 with 1 supplement
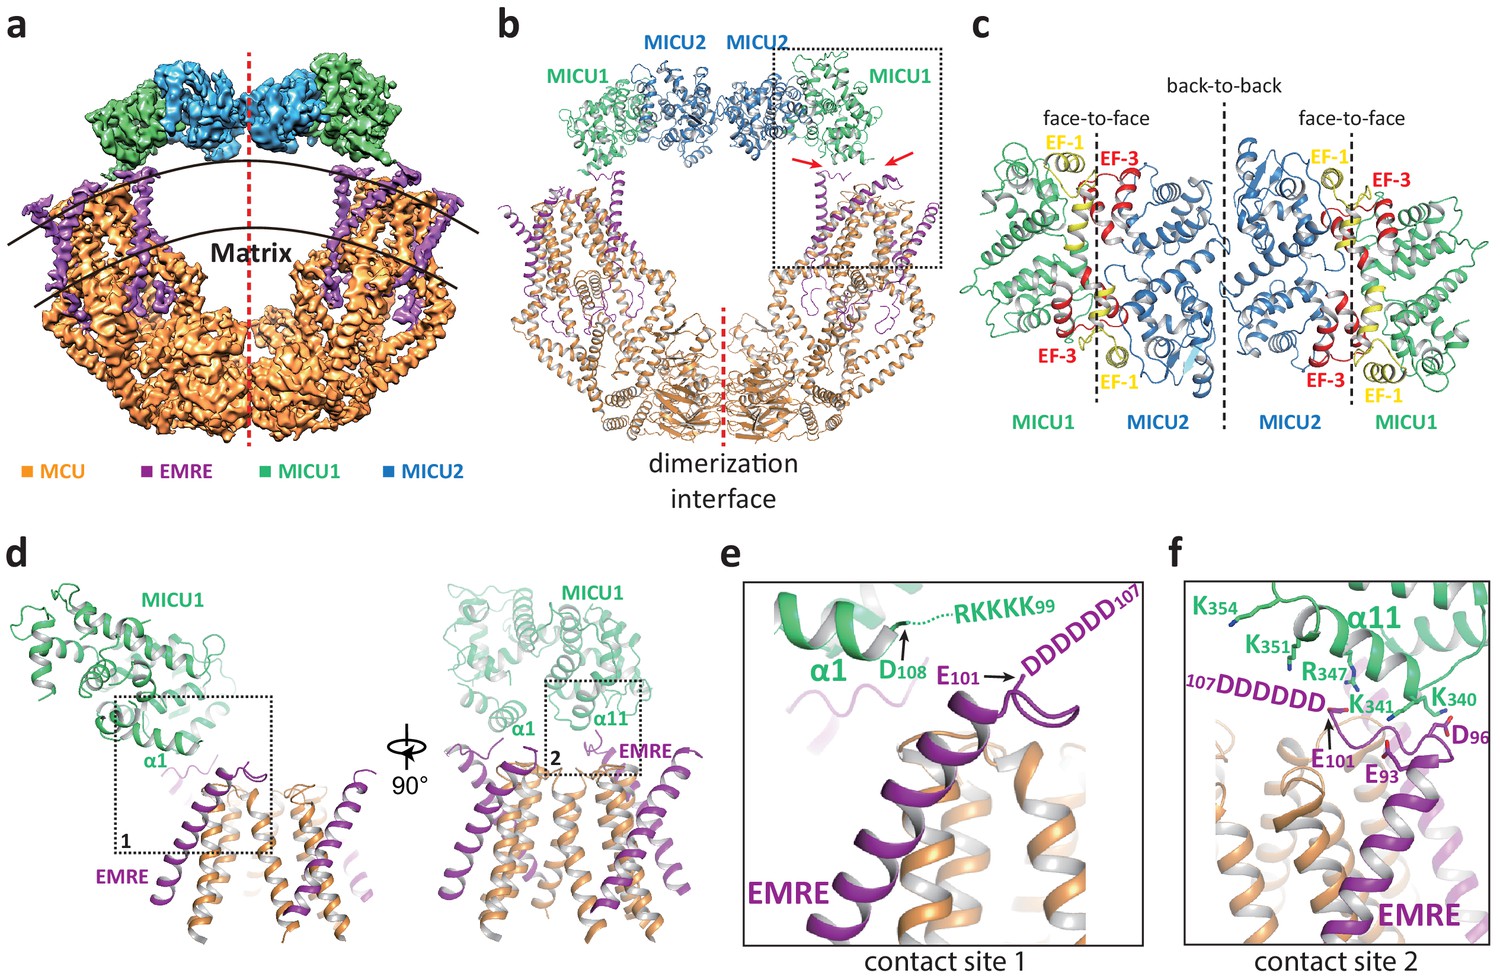
Structure of the MCU-EMRE-MICU1-MICU2 uniplex assembly in the presence Ca2+.
(a) Side view of the 3D reconstruction of the Ca2+-bound uniplex with each protein component individually colored. Red line marks the two-fold axis of the complex. (b) Cartoon representation of the Ca2+-bound uniplex structure. Red arrows mark the two contact sites between MICU1 and MCU/EMRE. Red line marks the dimerization interface between two MCU/EMRE subcomplexes. (c) Down view of the MICU1-MICU2 heterotetramer in cartoon representation along the two-fold axis. EF-1 and EF-3 motifs are colored in yellow and red, respectively. Dotted lines mark the interfaces between neighboring MICU subunits. (d) Protein-protein interface between the MICU1 and MCU/EMRE subcomplex (boxed area in (b)) with the two contact sites numbered and boxed. (e) Zoomed-in view of the contact site 1. In the Ca2+-bound uniplex, the structure model for MICU1 starts at D108 and the model for EMRE ends at E101. (f) Zoomed-in view of the contact site 2.
Figure 2—figure supplement 1
Structural comparison between the MCU-EMRE subcomplexes with and without bound MICU1-MICU2.
The MCU-EMRE subcomplexes without bound MICU1-MICU2 are shown in grey and the MCU-EMRE-MICU1-MICU2 holocomplexes are shown in color. (a) Comparison between the monomeric MCU-EMRE subcomplex and half of the Ca2+-bound, bridged uniplex (RMSD ~0.97 Å). (b) Comparison between the dimeric MCU-EMRE subcomplex and the Ca2+-bound, bridged uniplex (RMSD ~3.02 Å). Red arrows indicate the inward rigid-body movements of the two MCU-EMRE subcomplexes from the Ca2+-bound uniplex. (c) Comparison between the dimeric MCU-EMRE subcomplex and the apo, bridged uniplex (RMSD ~0.73 Å).
Figure 3 with 1 supplement
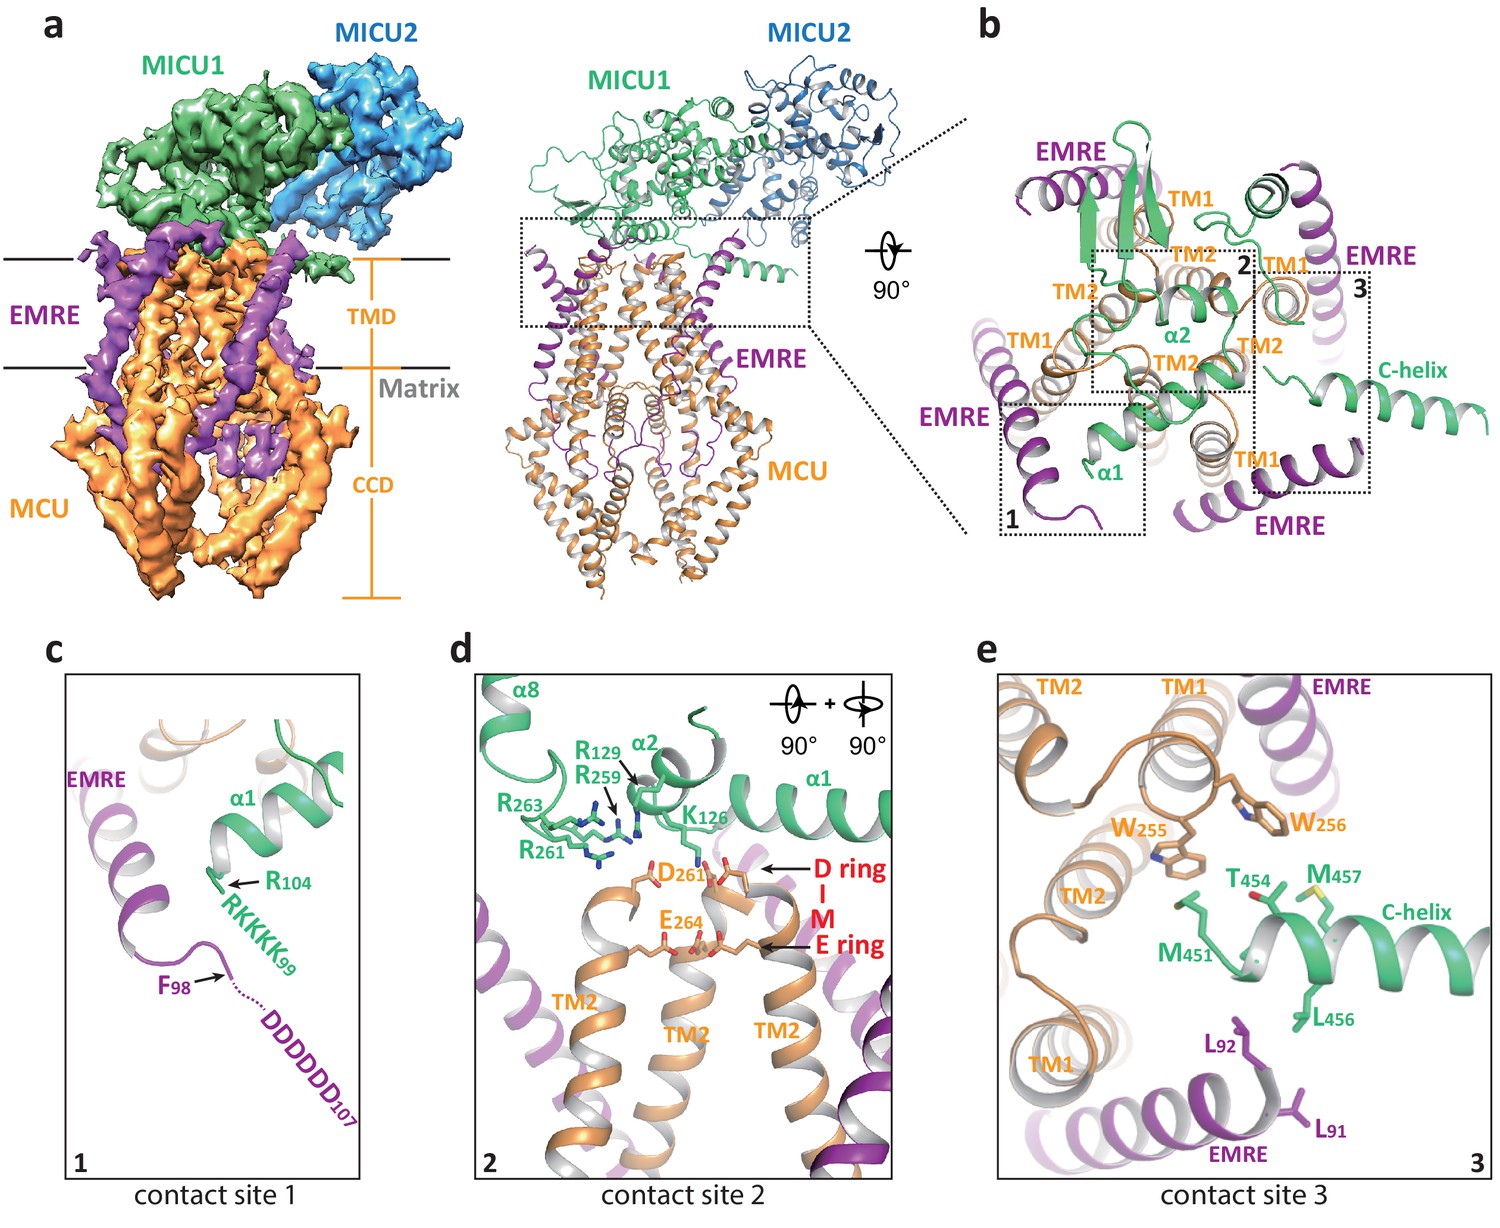
Structure of the apo, blocked MCU-EMRE-MICU1-MICU2 uniplex assembly.
(a) Side views of the 3D reconstruction (left) and cartoon representation (right) of the apo, blocked uniplex with each protein component individually colored. The map and model contain only the transmembrane domain (TMD) and the coiled coil domain (CCD) of MCU. The interface between MICU1 and MCU-EMRE subcomplex is boxed. (b) Zoomed-in view of the interface between MICU1 and the MCU/EMRE subcomplex with the three contact sites numbered and boxed. (c) Interactions between MICU1’s poly-basic sequence (KKKKR) and EMRE’s C-terminal poly-Asp tail. In the apo, blocked uniplex, the structure model for MICU1 starts at R104 and the model for EMRE ends at F98. (d) Interactions between MICU1 and MCU’s D-ring at the selectivity filter. MCU’s front subunit is removed for clarity. (e) Interactions between MICU1’s C-helix and MCU/EMRE.
Figure 3—figure supplement 1
MICU1-MICU2 blocking of the MCU-EMRE pore with four possible orientations.
Shown are maps from particles of the blocked MCU-EMRE subcomplex dimer after C2 symmetry expansion and focused 3D classification on the MICU1-MICU2 part. The map of the blocked MCU-EMRE subcomplex with bound MICU1-MICU2 in each orientation is individually colored.
Figure 4
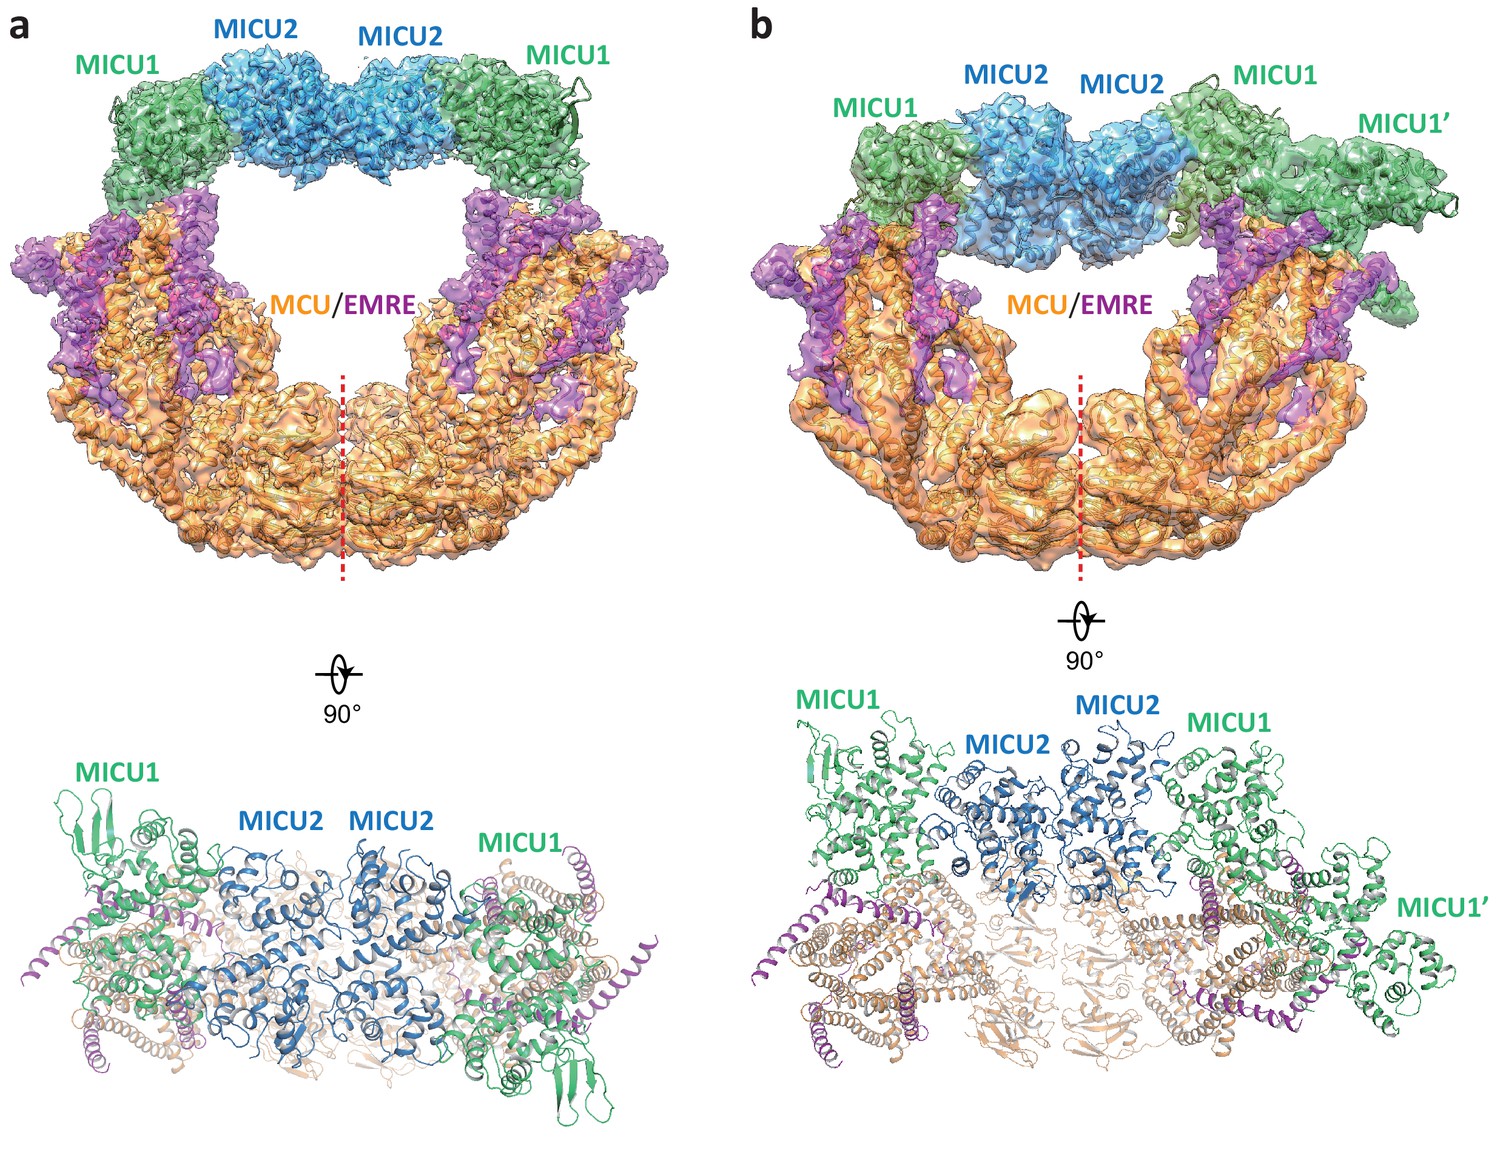
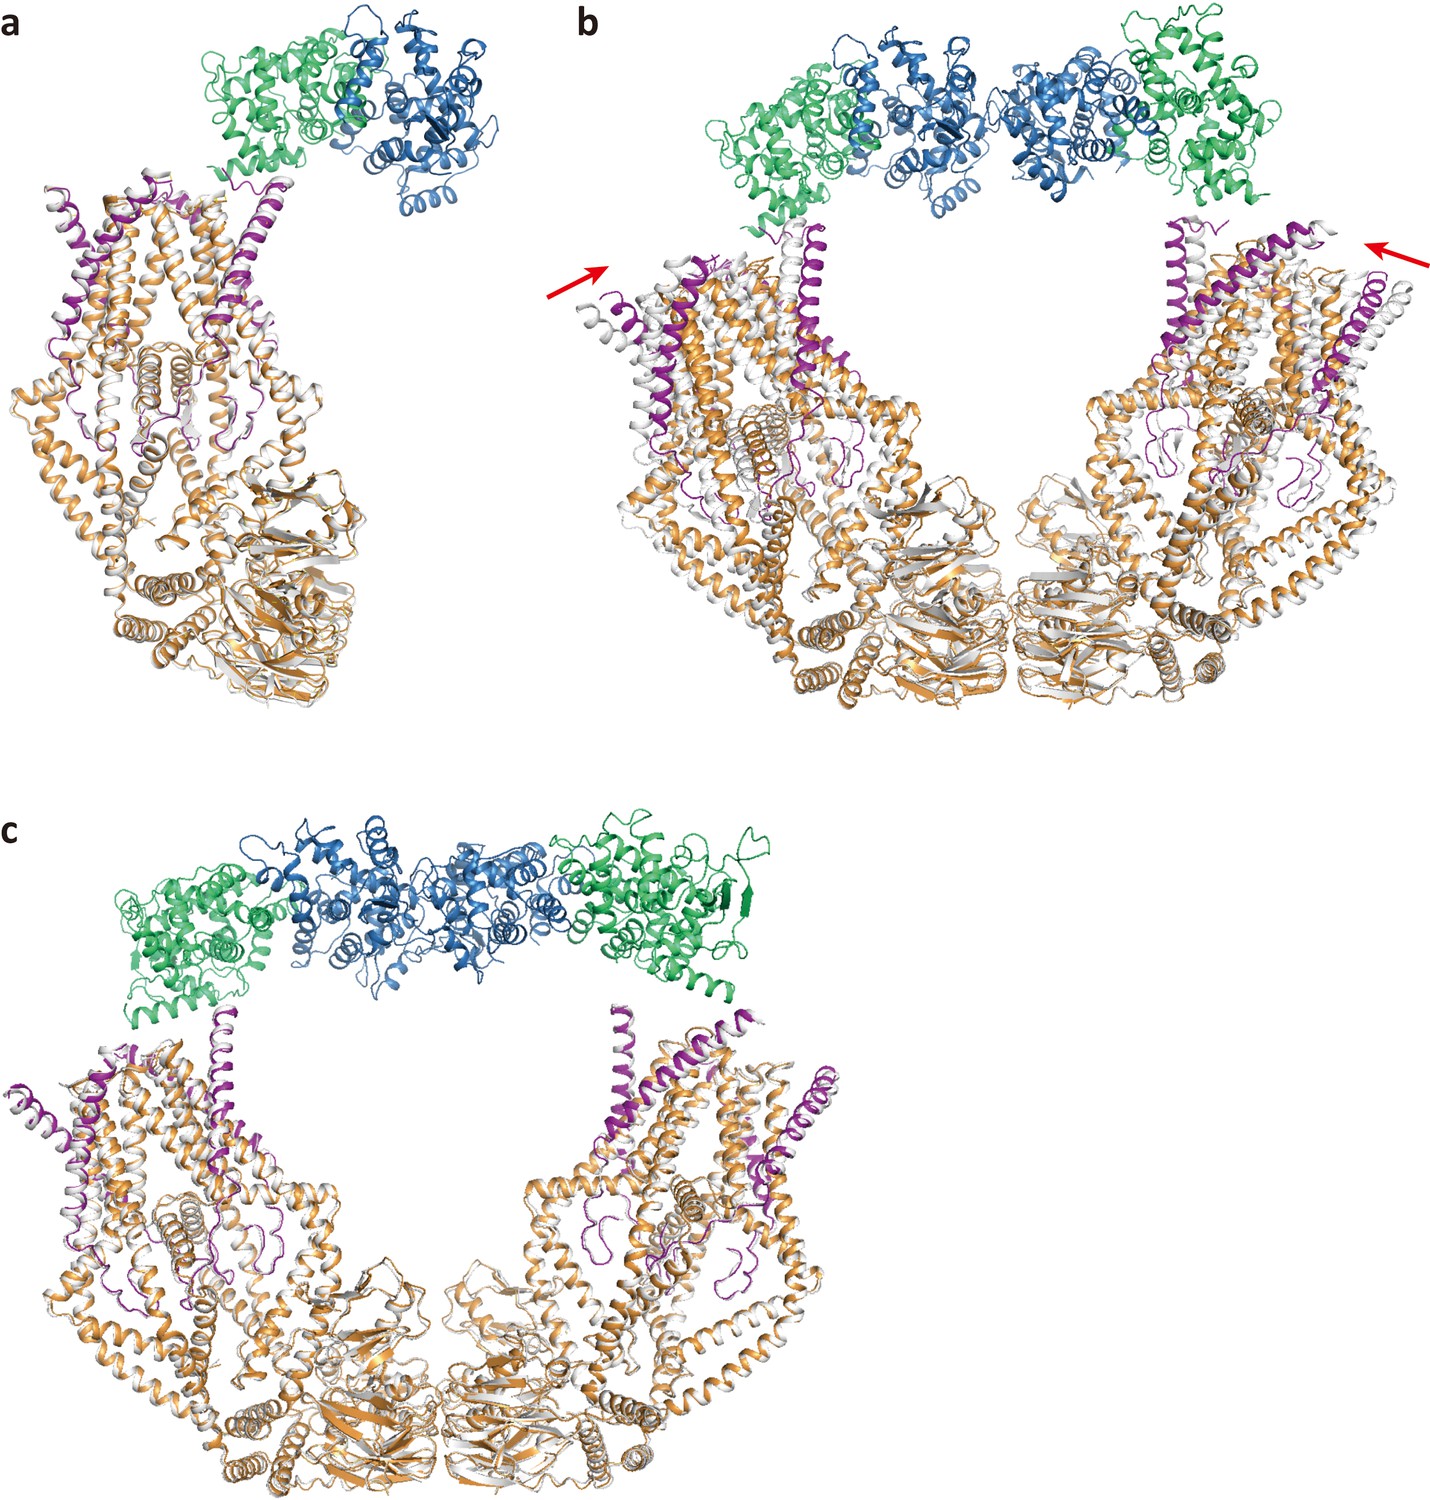
Structures of the apo, bridged MCU-EMRE-MICU1-MICU2 uniplex assembly.
(a) 3D reconstruction (upper, side view) and cartoon representation (lower, top view) of the apo, bridged uniplex with each protein component individually colored. Red line marks the dimerization interface between two MCU/EMRE subcomplexes. (b) 3D reconstruction (upper, side view) and cartoon representation (lower, top view) of the apo, bridged uniplex with competing binding of MICU1-MICU2 that blocks the pore. We were only able to model the MICU1 subunit (labeled as MICU1’) of the MICU1-MICU2 dimer that blocks the MCU-EMRE subcomplex on the right side. Note that the bridging MICU1-MICU2 tetramer is tilted to the side of the MCU-EMRE subcomplexes.
Figure 5
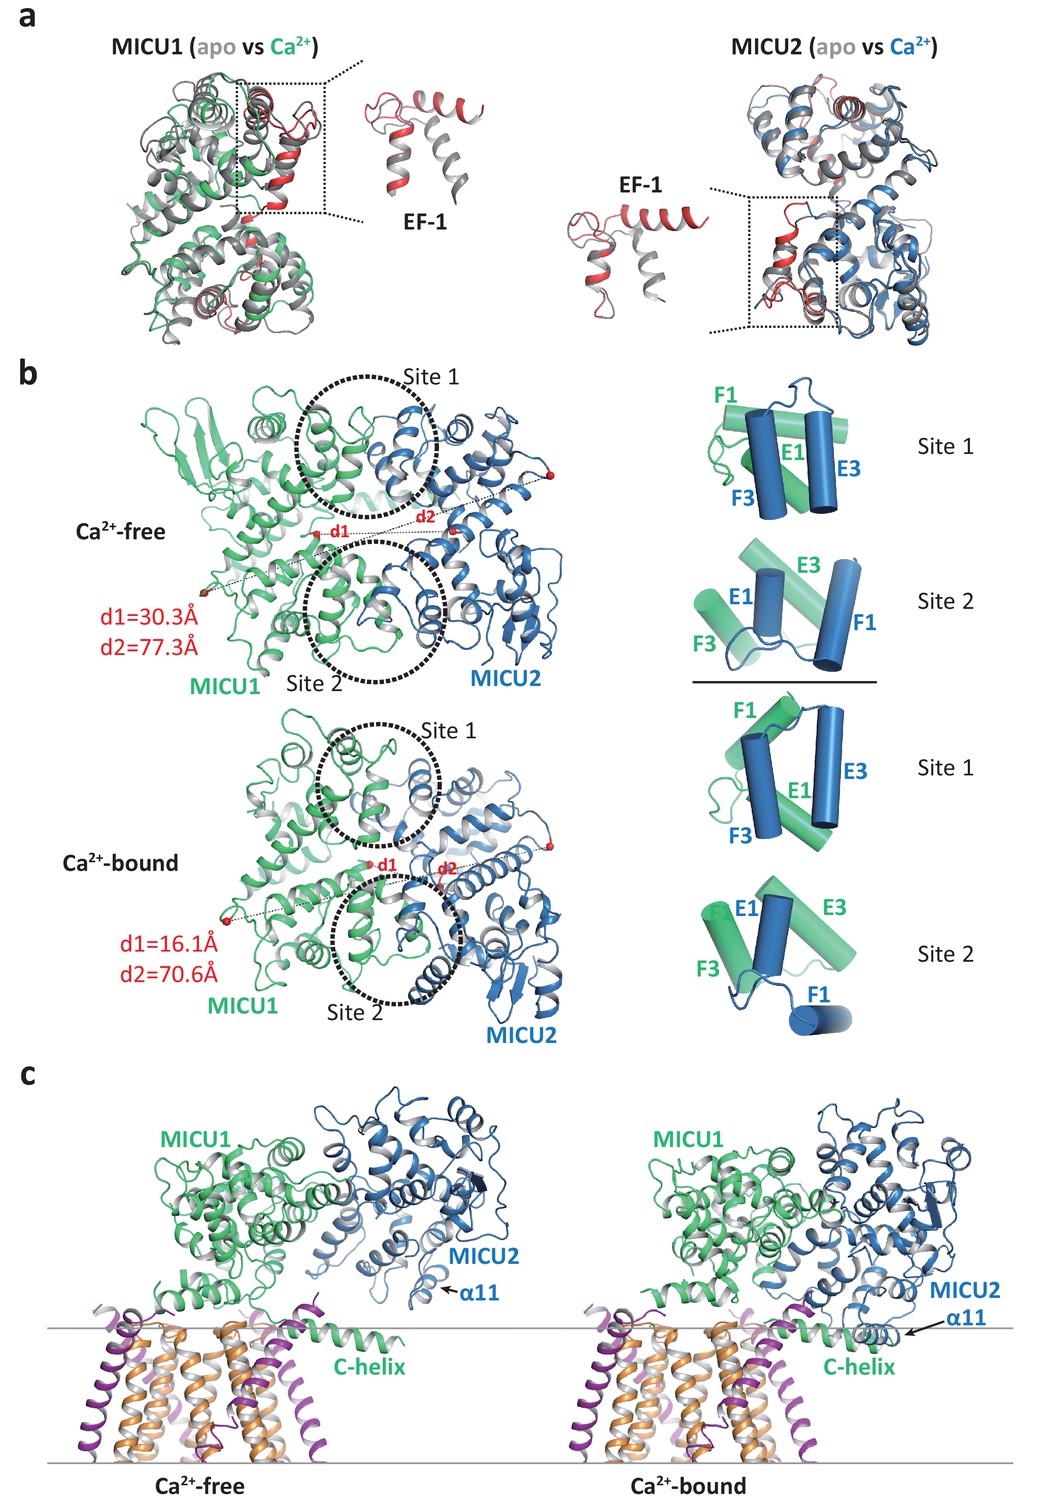
Structural comparison of the MICU1-MICU2 dimers in the apo and Ca2+-bound states.
(a) Superimposition of individual MICU1 (left) or MICU2 (right) subunit structures between the apo (grey) and the Ca2+-bound (MICU1 in green and MICU2 in blue) states. EF-1 and EF-3 motifs of MICU1 and MICU2 in Ca2+-bound states are colored red. (b) Structural comparison of the MICU1-MICU2 heterodimer in the apo (upper) and Ca2+-bound (lower) states with the inter-subunit contact sites circled. Grey dashed lines mark the inter-subunit distances between the Ca atoms (red spheres) of MICU1’s Met442 and MICU2’s His396 (d1) and between the Ca atoms of MICU1’s Val318 and MICU2’s Gly274 (d2). Right panels show the inter-subunit packing between EF-1 and EF-3 at each contact site in the absence (upper two) and presence (lower two) of Ca2+. (c) Left, structure of the blocked MCU-EMRE channel pore by a MICU1-MICU2 dimer in the apo state. Right, hypothetical model of the channel pore being blocked by the Ca2+-bound MICU1-MICU2 dimer. The model is generated by superimposing the MICU1 subunit of the Ca2+-bound MICU1-MICU2 dimer onto the MICU1 of the apo, blocked uniplex.
Figure 6

Working model for the gate-keeping mechanism of the mitochondrial calcium uniporter.
The apo MICU1-MICU2 dimer binds and blocks the MCU pore when cytosolic Ca2+ is low. Upon an elevation in cytosolic Ca2+, Ca2+ induced conformational changes within MICU1-MICU2 prevents the dimer from maintaining its blocking interactions with the channel pore and causes the Ca2+-bound MICU1-MICU2 to dissociate from MCU. The detached MICU1-MICU2 dimerizes and re-attaches to the MCU-EMRE subcomplex to form a bridged uniplex with the unblocked channel pore.
Tables
Key resources table
| Reagent type (species) or resource | Designation | Source or reference | Identifiers | Additional information |
|---|---|---|---|---|
| Gene (Homo sapiens) | HsMCU | doi:10.1038/nature10234; doi:10.1038/nature10230 | NCBI:NM_001270679.1 | |
| Gene (Homo sapiens) | HsEMRE | doi:10.1126/science.1242993 | NCBI:NM_033318.5 | |
| Gene (Homo sapiens) | HsMICU1 | doi:10.1038/nature09358 | NCBI:NM_001195518.2 | |
| Gene (Homo sapiens) | HsMICU2 | doi:10.1371/journal.pone.0055785 | NCBI:NM_152726.3 | |
| Recombinant DNA Reagent | pEZT-BM (plasmid) | doi:10.1016/j.str.2016.03.004 | Addgene 74099 | |
| Recombinant DNA Reagent | pET-28a (plasmid) | doi:10.1016/0022-2836(91)90856-2 | Novagen 69864–3 | |
| Strain, strain Background (Escherichia coli) | TOP10 | Thermo Fisher Scientific | Cat# 18258012 | Competent cells |
| Strain, strain Background (Escherichia coli) | BL21(DE3) | Thermo Fisher Scientific | Cat# EC0114 | Competent cells |
| Strain, strain Background (Escherichia coli) | DH10bac | Thermo Fisher Scientific | Cat# 10361012 | Competent cells |
| Cell line (Spodoptera frugiperda) | SF9 | Thermo Fisher Scientific | Cat# 11496015; RRID:CVCL_0549 | |
| Cell line (Homo sapiens) | HEK293F | Thermo Fisher Scientific | Cat# R79007; RRID:CVCL_D603 | |
| Software, algorithm | MotionCor2 | Zheng et al., 2017 | http://msg.ucsf.edu/em/software/motioncor2.html | |
| Software, algorithm | GCTF | Zhang, 2016 | https://www.mrclmb.cam.ac.uk/kzhang/Gctf | |
| Software, algorithm | RELION | Scheres, 2020 | http://www2.mrclmb.cam.ac.uk/relion | |
| Software, algorithm | Chimera | Pettersen et al., 2004 | https://www.cgl.ucsf.edu/chimera; RRID:SCR_004097 | |
| Software, algorithm | Pymol | Schrödinger | https://pymol.org/2; RRID:SCR_000305 | |
| Software, algorithm | COOT | Emsley et al., 2010 | https://www2.mrclmb.cam.ac.uk/personal/pemsley/coot; RRID:SCR_014222 | |
| Software, algorithm | PHENIX | Adams et al., 2010 | https://www.phenixonline.org | |
| Software, algorithm | OriginPro8 | OriginLab Corp. | https://www.originlab.com | |
| Others | QUANTIFOIL R1.2/1.3 | Quantifoil |
Additional files
Download links
A two-part list of links to download the article, or parts of the article, in various formats.
Downloads (link to download the article as PDF)
Open citations (links to open the citations from this article in various online reference manager services)
Cite this article (links to download the citations from this article in formats compatible with various reference manager tools)
Structural insights into the Ca2+-dependent gating of the human mitochondrial calcium uniporter
eLife 9:e60513.
https://doi.org/10.7554/eLife.60513


