A calcineurin-mediated scaling mechanism that controls a K+-leak channel to regulate morphogen and growth factor transcription
- School of Life Sciences and Technology, ShanghaiTech University, China
- CAS Center for Excellence in Molecular Cell Science, Shanghai Institute of Biochemistry and Cell Biology, Chinese Academy of Sciences, University of Chinese Academy of Sciences, China
- Institut für Pharmakologie und Toxikologie, Technische Universität Dresden, Germany
- Klinik für Innere Medizin und Kardiologie, Herzzentrum Dresden, Technische Universität Dresden, Germany
Figures
Figure 1 with 2 supplements
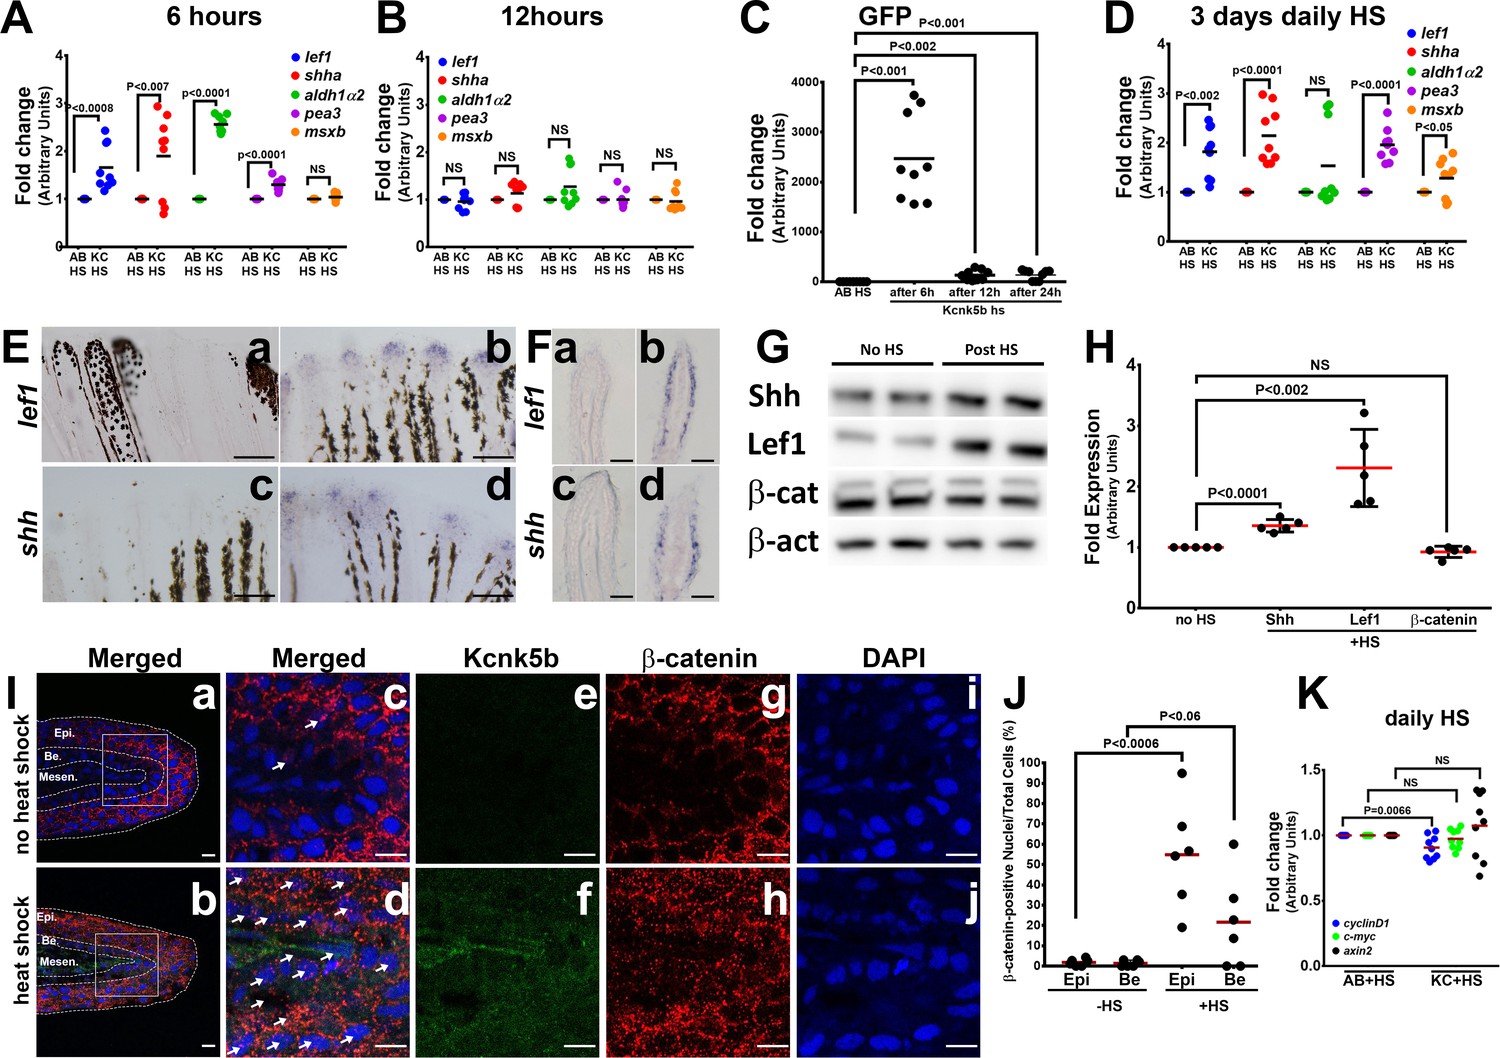
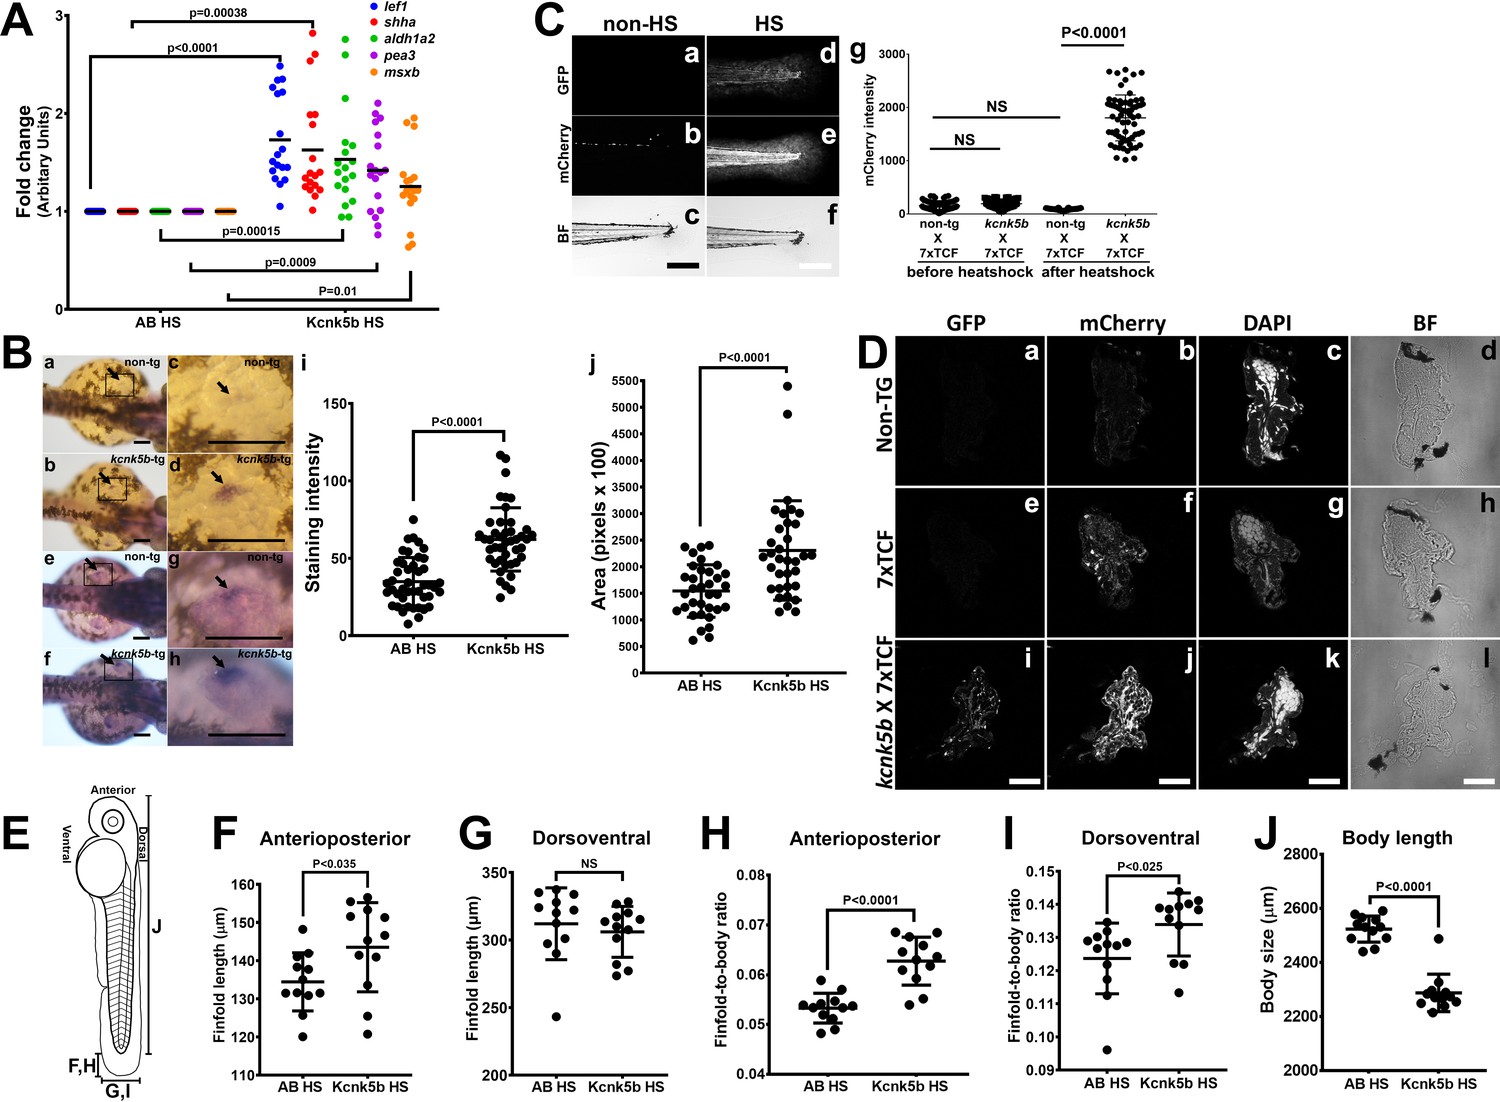
Kcnk5b induces a partial developmental gene response in uninjured adult fins.
(A) qRT-PCR results of shh and lef1, aldh1α2, pea3, and msxb expression from caudal fins of 6-month-old wild-type (AB) and Tg[hsp70:kcnk5b-GFP] zebrafish 6 hr after heat shock (HS)of the caudal fins. (B) qRT-PCR results of shh and lef1, aldh1α2, pea3 and msxb expression from caudal fins of 6-month-old wild-type (AB) and Tg[hsp70:kcnk5b-GFP] zebrafish 12 hr after heat-shock induction of the the caudal fins. (C) qRT-PCR results for GFP from the transgenic fish line Tg[hsp70:kcnk5b-GFP] at the indicated time points relative to the single heat-shock pulse of AB wild-type and transgenic fish. AB HS for each time point were always set at onefold, so they are represented as only one group in the graph. (D) qRT-PCR results for several genes in the caudal fin from daily heat-shock pulse of AB wild-type and Tg[hsp70:knck5b-GFP] over 3 days. (E) In situ hybridization experiments on fins show expression of shh (a,b) and lef1 (c,d) in heat-shocked non-transgenic control fish (a,c) and heat-shocked Tg[hsp70:kcnk5b-GFP](b,d). (F) Cross-sections through fin rays show expression of lef1(a,b) and shh (c,d) before (a,c) and after (b,d) heat-shock induction of Tg[hsp70:kcnk5b-GFP]. (G) Representative images of Western blots show expression of Shh, Lef1 and β-catenin before and 3 days after 10 min daily heat-shock induction of kcnk5b-GFP in the fin. (H) Graphed measurements results of Western blots. (I) Confocal planes (0.45 μm) of immunohistochemistry stained 10 μm sections of control (no heat shock) or transgene-induced (heat shock) uninjured fins for merged GFP from Tg[hsp70:kcnk5b-GFP] and β-catenin (red) (a–d: Merged), GFP from Tg[hsp70:kcnk5b-GFP] (e,f: green) β-catenin (g,h: red) and DAPI (i,j: blue)of fin cross-sections of transgenic Tg[hsp70:kcnk5b-GFP] animals without heat shock (a,c,e,g,i) or after heat shock (b,d,f,h,j). White boxes in (a and b) show location of magnified panels of c,e,g and d,f,j, respectively. Overlapping DAPI and β-catenin staining indicated by white arrows. Epi.’ refers to the outer multilayered epidermis, ‘Be.’ as the underlying basal epithelial layer, and ‘Mesen.’ refers to the underlying mesenchymal tissues. (J) Graphed measurements of DAPI stained nuclei containing staining of β-catenin. (K) qRT-PCR results for the indicated genes in the caudal fin from AB non-transgenic and Tg[hsp70:knck5b-GFP] fish after daily heat-shock pulses over 3 days. Scale bars are 50 µm (D), 1 mm (E), 10 µm (H). The data for each experiment represent three or more separate experiments. The data points show all technical replicates. Student’s T-test used for the tests of significance between indicated experimental groups.
Figure 1—figure supplement 1
Induction of developmental genes after induction of kcnk5b expression.
(A) qRT-PCR results of shh and lef1 expression from caudal fins of 6-month-old zebrafish comparing before (-HS) and 6 hr after (+HS) heat shock induction of the Tg[hsp70:kcnk5b-GFP] transgene in the caudal fins. (B) Confocal image of immunohistochemistry staining for GFP expression in a cross-section of the distal tip of the adult fin after heat shock induction of kcnk5b-GFP in a fish harboring the Tg[hsp70:kcnk5b-GFP] transgene. The lower left inset is an enlarged view of the expression of the transgene in the fin. (C) Confocal image of DAPI-stained nuclei of the same confocal section in panel A. (D) Overlay of the confocal GFP and DAPI images. (E) qRT-PCR results for the indicated genes in the caudal fin from AB non-transgenic and Tg[hsp70:knck5b-GFP] fish after daily heat-shock pulses over 3 days. (F) qRT-PCR for GFP expression in AB wild-type strain fish and kcnk5b-GFP fish after daily heat-shock pulses over 3 days. The data for each panel represents three or more experiments. The graphed data points show all technical replicates.
Figure 1—figure supplement 2
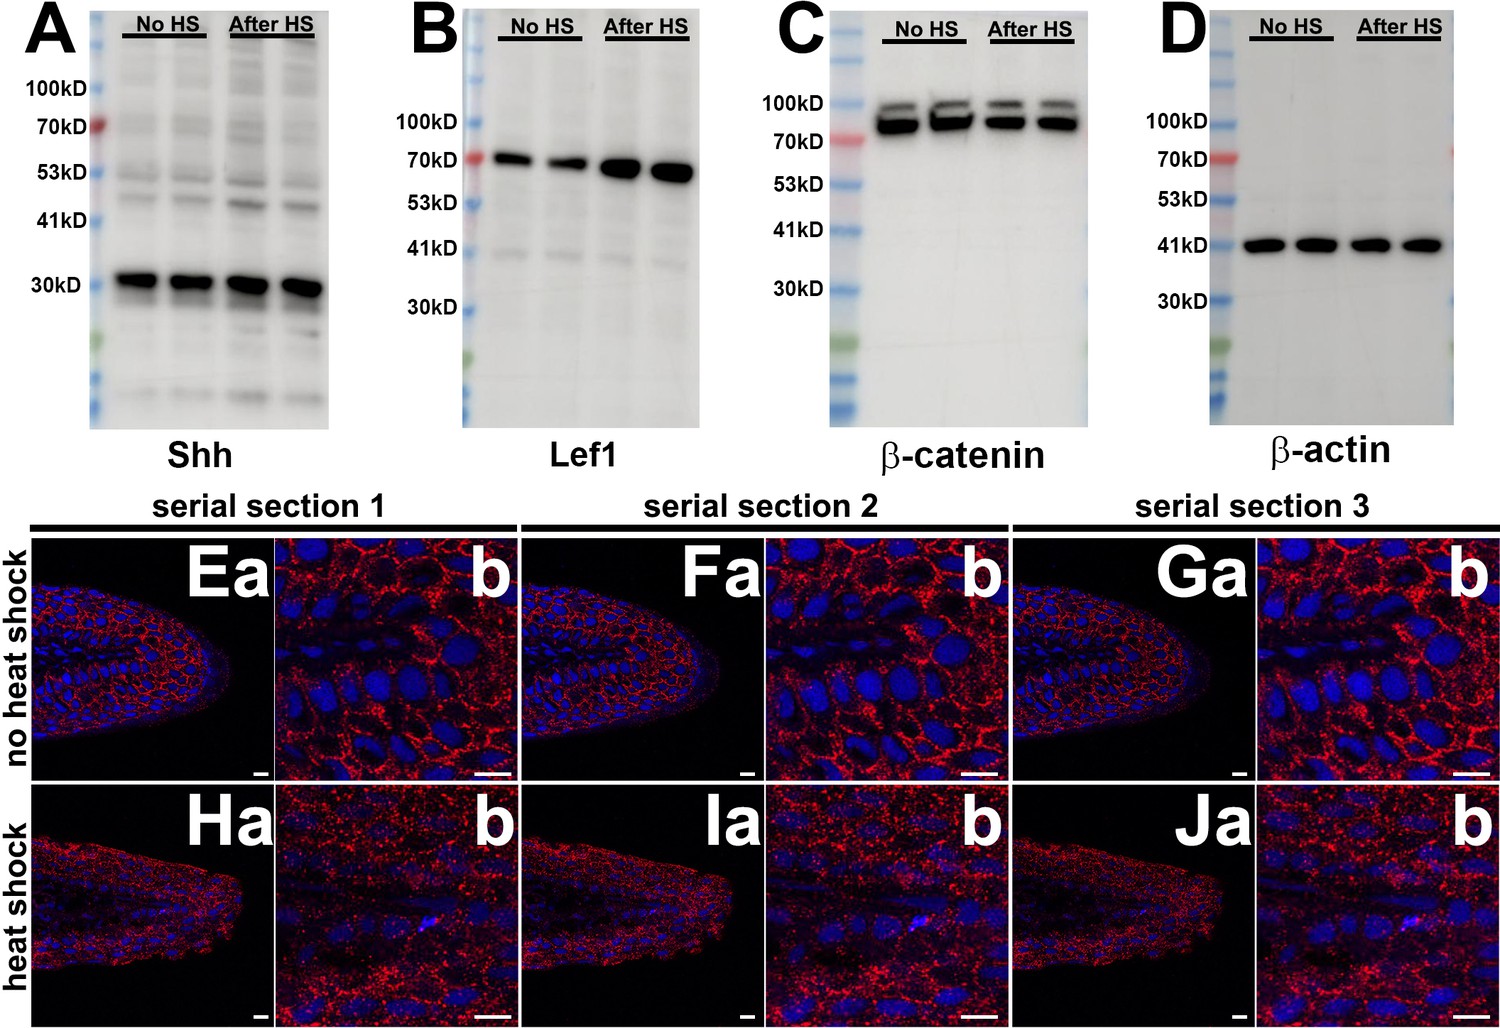
Protein expression of selected developmental genes and β-catenin subcellular distribution.
(A) Example blot for Shh expression in adult fins with or without heat-shock induction of the Tg[hsp70:kcnk5b-GFP] transgene. (B) Example blot for Lef1 expression in adult fins with or without heat-shock induction of the Tg[hsp70:kcnk5b-GFP] transgene. (C) Example blot for β-catenin expression in adult fins with or without heat-shock induction of the Tg[hsp70:kcnk5b-GFP] transgene. (D) Example blot for β-actin expression in adult fins with or without heat-shock induction of the Tg[hsp70:kcnk5b-GFP] transgene. (E–G) Three adjacent serial confocal sections through the fin of a control non-heat-shocked Tg[hsp70:kcnk5b-GFP] fish. Dapi stains the nuclei (blue) and immunohistochemistry for β-catenin (red). (a) Lower magnifications. (b) Corresponding higher magnifications for each preceding (a) panel. (H–J) Three adjacent serial confocal sections through the fin of a heat-shocked Tg[hsp70:kcnk5b-GFP] fish. Dapi stains the nuclei (blue) and immunohistochemistry for β-catenin (red). (a) Lower magnifications. (b) Corresponding higher magnifications for each preceding (a) panel. (K) Graphed measurements of β-catenin fluorescence intensity of stained sections. All scale bars are equal to 10 μm. The data for each panel represent three or more experiments. The graphed data points show all technical replicates.
Figure 2 with 1 supplement
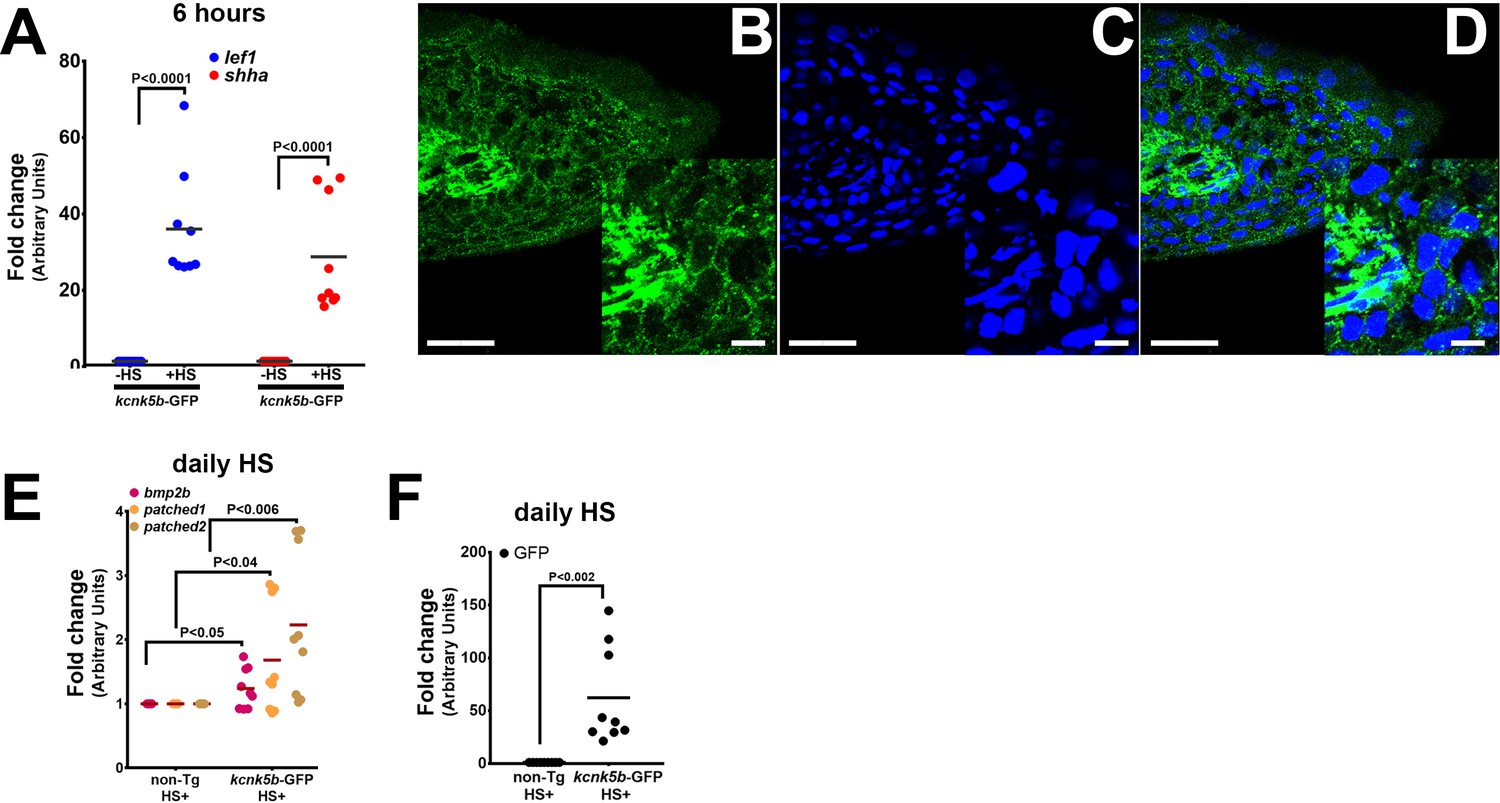
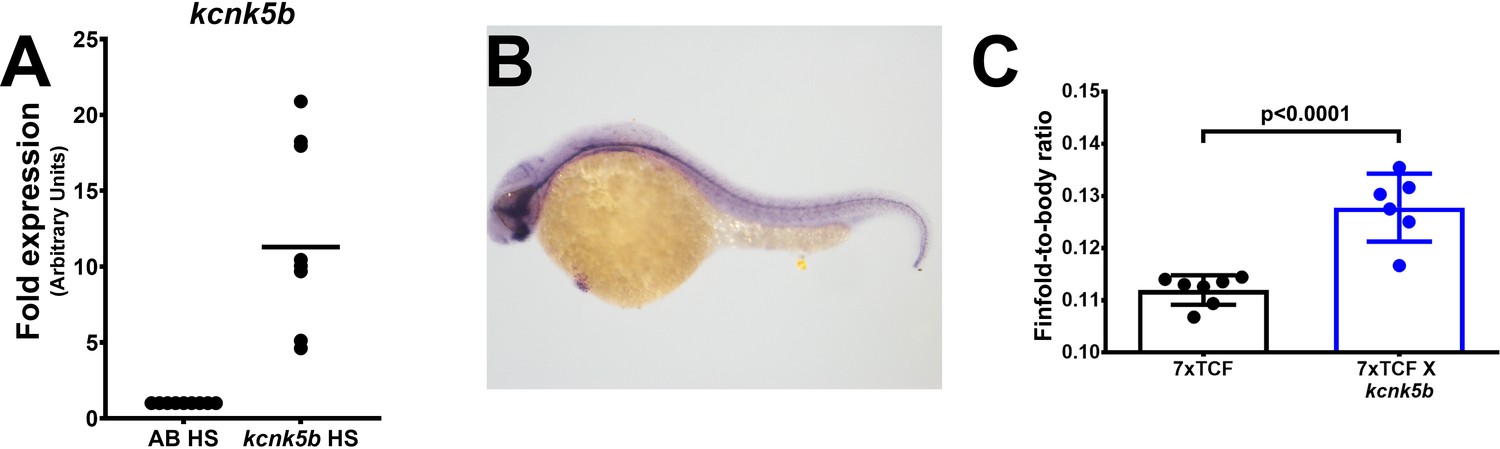
Kcnk5b induces shh and lef1 in zebrafish larva.
(Aa,b) Comparison of gene expression from mRNA isolated from complete three dpf zebrafish larva harboring Tg[hsp70:knck5b-GFP] 6 hr after heat-shock (HS) induction. (B) In situ hybridization experiments on 2 dpf embyros for shh start to detect expression in the cells of the zone of polarity in the early pectoral fin bud by 60 min of incubation of the final staining reaction (a–d) or after overnight staining (e–h). Measurements of shh expression levels by computer-program-based detection of pixel level intensities (i) or by the stained area (j) in the early pectoral fin bud. Panels c,d,g,h are enlarged regions (open black boxes) in panels a,b,e,f. Arrows indicate shh expression in the developing fin buds. (C) Double transgenic 3dpf larva harboring Tg[hsp70:kcn5b-GFP] and hemizygous Tg[7XTCF-Xla.sam:mCherry] either before heat shock (a–c) or 12 hr after heat shock (d–f). (Cg) Measurements of mCherry intensity levels of non-transgenic (non-tg), kcnk5b-transgenic (kcnk5b) fish and transgenic fish harboring the Lef-1-dependent Tg[7XTCF-Xla.sam:mCherry] reporter (7xTCF) before and 12 hr after heat shock. (D) Cross sections through the trunks of non-transgenic (a–d) and Tg[7XTCF-Xla.sam:mCherry] (e–h) and Tg[hsp70:kcn5b-GFP]; Tg[7XTCF-Xla.sam:mCherry] double-transgenic (i–l) fish lines after heat shock. (D) Measurements from dorsal to ventral of the caudal finfold of Tg[7XTCF-Xla.sam:mCherry] and Tg[7XTCF-Xla.sam:mCherry] X Tg[hsp70:kcnk5b-GFP] sibling larva after heat shock. (E) Diagram of the measurement axes of the larva. (F) Length measurements from anterior-most point of the caudal finfold to its distal-most tip of 5 dpf larva. (G) Length measurements of the caudal finfold from the dorsal-most point to the ventral-most tip of 5 dpf larva. (H) Finfold anterioposterior length-to-body ratios of the caudal finfold of 5 dpf larva. (I) Finfold dorsoventral length-to-body ratios of the body ratios. (J) Body length measurements of 5 dpf larva as diagramed in (E). Scale bars are 100 µm (B,C) and 20 µm (D). The data for each panel represent three or more experiments. The data points show all technical replicates. Student’s T-test used for all test of significance between the indicated experimental groups.
Figure 2—figure supplement 1
Controls for shh expression and transgenic expression of Kcnk5b in embryos.
(A) Transgenic expression of Kcnk5b after single heat shock pulse induces transgene expression. (B) In situ probe for shh shows expected expression pattern. (C) Ratios of finfold and body length measurements of caudal finfold along the anterioposterior axes of 3 dpf single transgenic Tg[7XTCF-Xla.sam:mCherry] and double transgenic Tg[7XTCF-Xla.sam:mCherry] X Tg[hsp70:kcnk5b-GFP] after 3x once-a-day heat-shock pulse, 30 min each. Each panel represents three or more experiments. The graphed data show all technical replicates.
Figure 3 with 1 supplement

Kcnk5b induces Lef-1-dependent transcription in several tissues in a cell autonomous manner.
(A) Diagram of transplantation procedure and possible cell-autonomous and non-cell-autonomous outcomes on the expression of the Tg[7XTCF-Xla.sam:mCherry] Lef1 reporter after heat-shock induction of the Tg[hsp70:kcnk5b-GFP] transgene. (B) Transplantation experiments of donor cells from double transgenic fish harboring Tg[hsp70:kcnk5b-GFP] and Tg[7XTCF-Xla.sam:mCherry] into homozygous host embryos harboring only the Tg[7XTCF-Xla.sam:mCherry]. The head (a) eye (e) trunk (i) and finfold (m) of mosaic larva before heat shock induction of kcnk5b-GFP expression. Head (b–d), eye (f–h), trunk (j–l), and finfold (n–p) of 72 dpf larva at 24 hr after heat shock. (C) Bright field images of the head (a,d), jaw area (g) border tissue of otic vesicle (j) and trunk (o,r) of 72 hpf larva; GFP expression from Tg[hsp70:kcnk5b-GFP](b,e,h,k,p,s) and mCherry expression from Tg[7XTCF-Xla.sam:mCherry] (c,f,i,l,q,t). (D) Higher magnification of merged (a) and separate GFP (b) and mCherry (c) channels of cells in the neural tube of 48 hpf embryos. Z-stack composite three-dimensional images before rotation (d), rotated 90° (e) and 180° (f). (E) Total number of positive cells counted in the tissues of all mosaic larva for all mCherry-positive cells from recipient Tg[7XTCF-Xla.sam:mCherry] larva, all GFP-positive cells from Tg[hsp70:kcnk5b-GFP](open green triangle) and all double positive cells (open blue squares). The data for each experiment represent three or more experiments with two or more biological replicates. Scale bars are equal to 200 μm (Ba-l), 50 μm (Bm-p), 20 μm (C), and 25 μm (D).
-
Figure 3—source data 1
Counting Results of cells expressing the mCherry Lef-1 reporter and GFP-labelled Kcnk5b transgene.
- https://cdn.elifesciences.org/articles/60691/elife-60691-fig3-data1-v2.xlsx
Figure 3—figure supplement 1
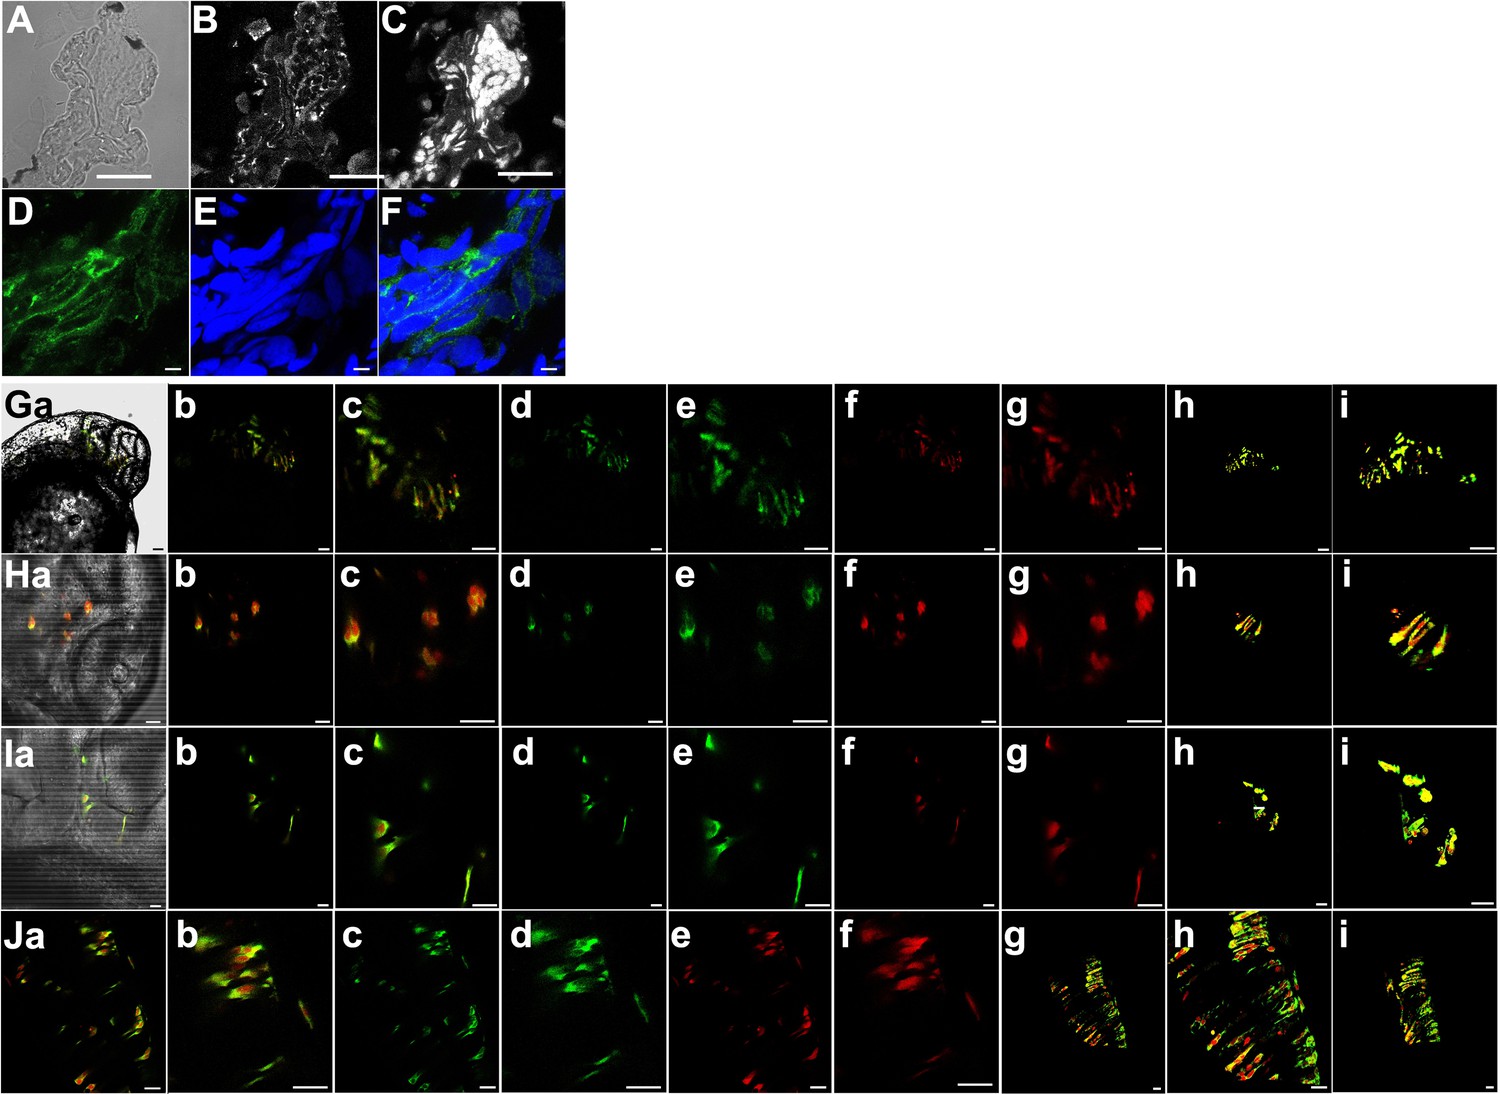
Expression of Kcnk5b-GFP from Tg[hsp70:kcnk5b-GFP] after single heat shock and consequent activation of 7XTCF-Xla.sam:mCherry.
(A) Representative bright field cross-section through the mid-section of heat-shocked transgenic zebrafish 72 hpf larva. (B) Immunohistochemical staining for GFP of the same cross section in panel A. (C) DAPI staining of the same cross-section in panel A. (D) Representative confocal image of immunohistochemical staining for GFP in heat-shocked transgenic zebrafish larva showing membranous staining of Kcnk5b-GFP. (E) DAPI staining of the same confocal section in panel D. (F) Merged image of panels D and E. (Ga–i) Images of cells in the head 48 hpf embryos expressing kcnk5b-GFP transgene and mCherry from the 7XTCF-Xla.sam:mCherry transgene. (a) Bright fish image, (b) Merge of GFP and mCherry, (c) enlargement of (b), (d) GFP image, (e) enlargement of (d), (f) mCherry image, (g) enlargement of (f), (h) 3D composite of z-stacked images, (i) enlargement of (h). (Ha–i) Images of cells in the brain of 48 hpf embryos expressing kcnk5b-GFP transgene and mCherry from the 7XTCF-Xla.sam:mCherry transgene. (a) Bright fish image, (b) Merge of GFP and mCherry, (c) enlargement of (b), (d) GFP image, (e) enlargement of (d), (f) mCherry image, (g) enlargement of (f), (h) 3D composite of z-stacked images, (i) enlargement of (h). (Ia–i) Images of cells in the developing otic vesical of 48 hpf embryos expressing kcnk5b-GFP transgene and mCherry from the 7XTCF-Xla.sam:mCherry transgene. (a) Bright fish image, (b) Merge of GFP and mCherry, (c) enlargement of (b), (d) GFP image, (e) enlargement of (d), (f) mCherry image, (g) enlargement of (f), (h) 3D composite of z-stacked images, (i) enlargement of (h). (Ja–i) Images of cells in the developing neural tube of 48 hpf embryos expressing kcnk5b-GFP transgene and mCherry from the 7XTCF-Xla.sam:mCherry transgene. (a) Merge of GFP and mCherry, (b) enlargement of (a), (c) eGFP image, (d) enlargement of GFP image (c), (e) mCherry image, (f) enlargement of mCherry image (e), (g) 3D composite of z-stacked images, (h) enlargement of 3D composite (g), (i) 90° rotation of 3D composite of z-stacked images (g). Scale bars equal 40 µm (A–C), 5 µm (D–F), 20 μm (G–J). The data for each panel represents three or more experiments.
Figure 4 with 2 supplements
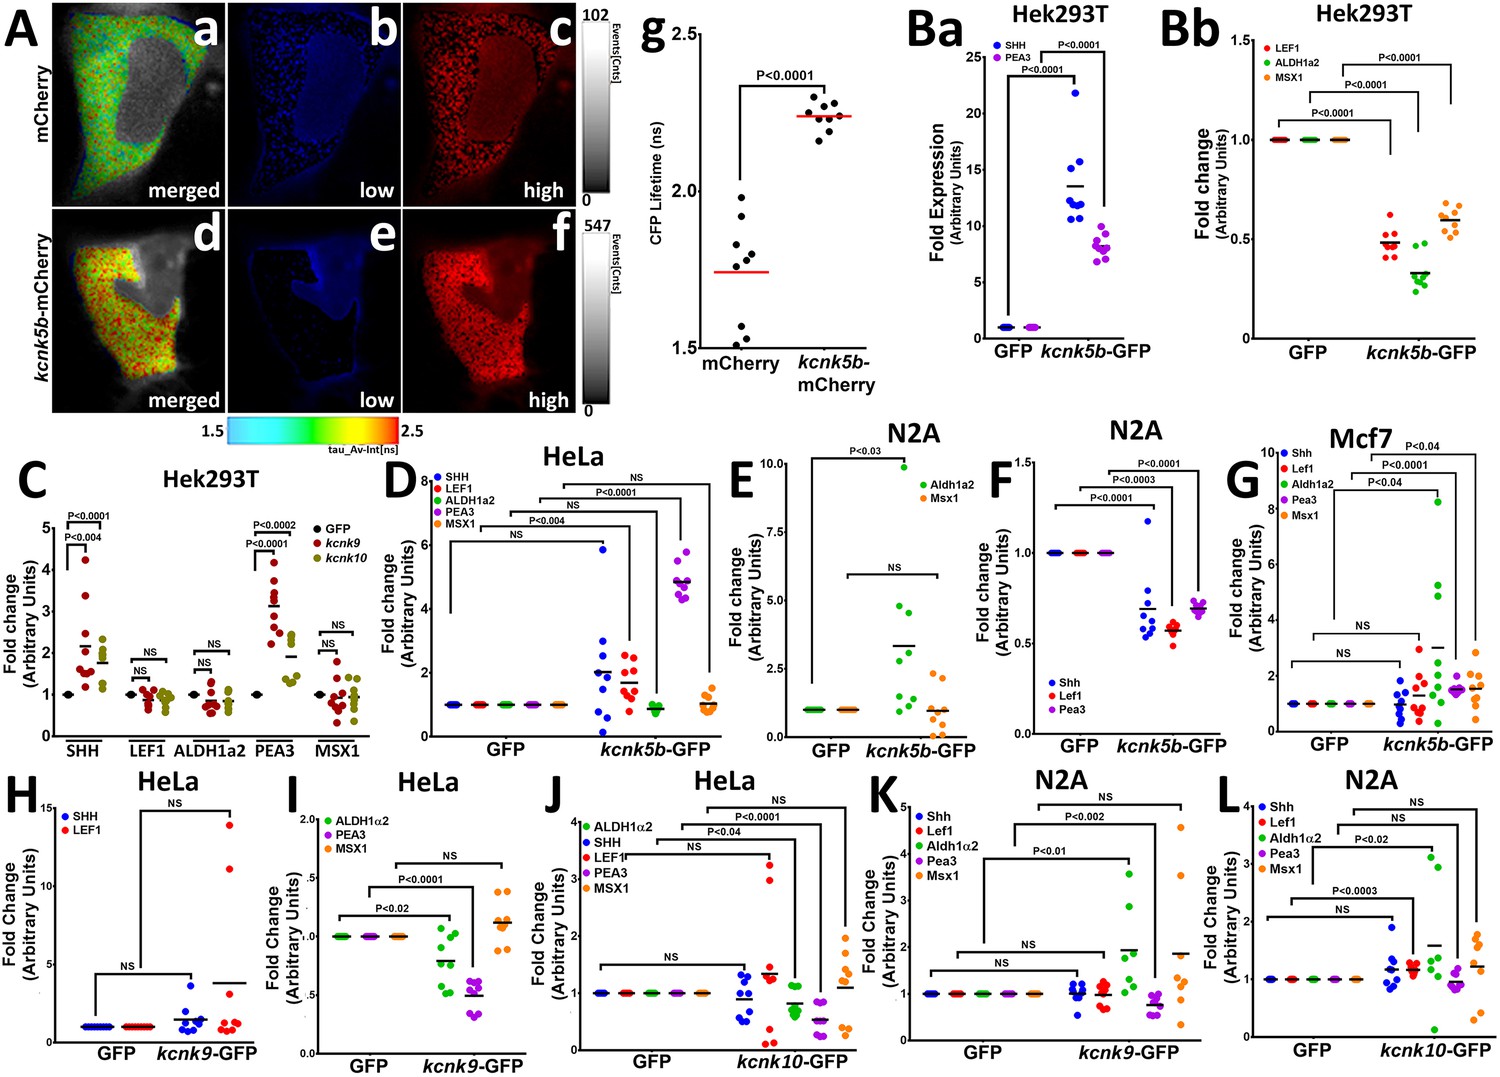
Kcnk5b channel activity regulates developmental gene transcription in mammalian cells.
(A) FRET-FLIM images after measuring the life time of CFP of the K+ FRET reporter KIRIN (Shen et al., 2019). The color images indicate the differences in CFP fluorescence lifetime of the K+ FRET reporter KIRIN in HEK293T (HEK) cells. Assigned rainbow of colors in the delineated cytoplasm depict the range of numeric values of nanoseconds (ns) of the detected fluorescent lifetime for CFP. Red represents longer lifetime values. Blue represents shorter lifetime values, and the other colors represent intermediary lifetime values. (a) Composite image of all lifetime values of the KIRIN K+ reporter in control cells transfected with mCherry. (b) Image of low lifetime values in a control cell. (c) Image of high lifetime values in a control cell. (d) Composite image of all lifetime values of the KIRIN K+ reporter in cells expressing kcnk5b-mCherry. (e) Image of low lifetime values in cells expressing kcnk5b-mCherry. (f) Image of high lifetime values in cells expressing kcnk5b-mCherry. (g) Compared to GFP-transfected HEK cells, cells transfected with kcnk5b-mCherry show an increase in CFP lifetime due to reduction in intracellular K+. (Ba) qRT-PCR for SHH and LEF1 in HEK cells. (Bb) qRT-PCR for ALDH1a2, PEA3 and MSX1 in HEK cells. (C) qRT-PCR for indicated genes in HEK cells expressing GFP, kcnk9-GFP or kcnk10-GFP 24 hr after transfection. (D) qRT-PCR results in HeLa cells expressing either GFP or kcnk5b-GFP 24 hr after transfection. (E,F) qRT-PCR results in N2A cells expressing either GFP or kcnk5b-GFP 24 hr after transfection. (G) qRT-PCR results in Mcf7 cells expressing either GFP or kcnk5b-GFP 24 hr after transfection. (H,I) qRT-PCR measurement of indicated gene after 24 hr transfection of Kcnk9 in Hela cells. (J) qRT-PCR measurement of indicated gene after 24 hr transfection of Kcnk10 in HeLa cells. (K) qRT-PCR measurement of indicated gene after 24 hr transfection of Kcnk9 in N2A cells. (L) qRT-PCR measurement of indicated gene after 24 hr transfection of Kcnk10 in N2A cells. The data represent three or more experiments, The data points show all technical replicates. Student’s T-test was used for tests of significance and the levels of significance are indicated between the experimental groups.
Figure 4—figure supplement 1
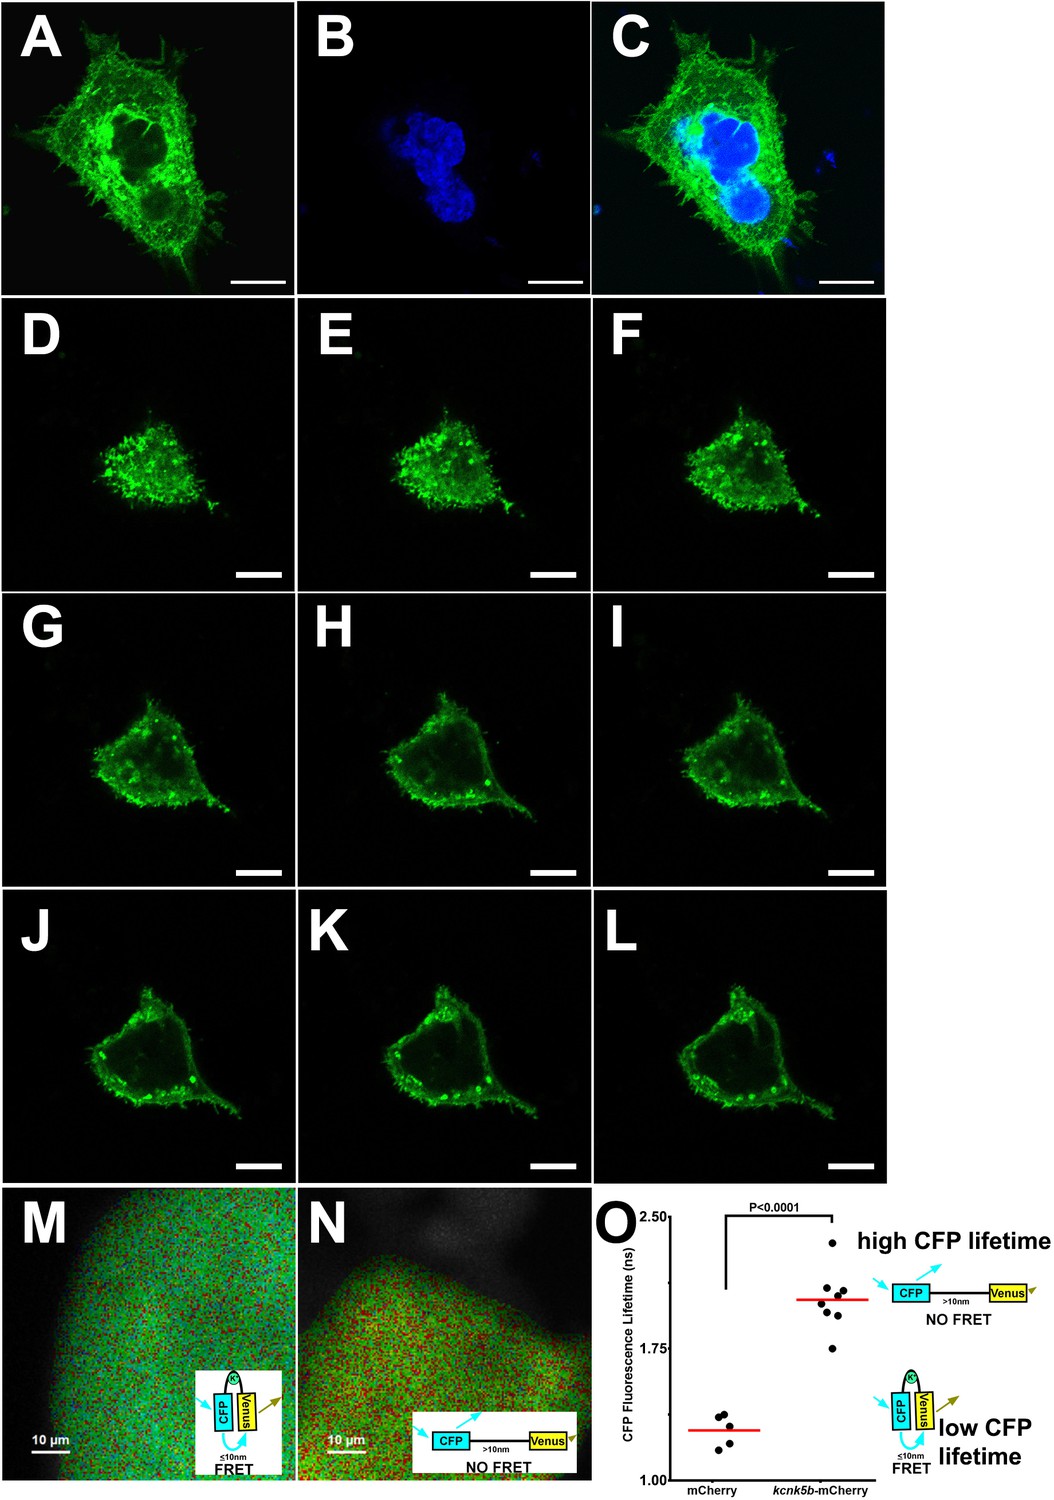
Expression and activity of Kcnk5b-GFP in transfected HEK293T cells.
(A) Confocal image of through an immunocytochemical staining of a HEK293T cell transfected with zebrafish kcnk5b-GFP transgene (B) DAPI staining of the same cell in panel A. (C) Merged panels A and B. (D–L) Serial confocal cross sections for GFP in a live HEK293T cell from its surface (D) through to a mid-section of the cell (L) after transfection with the zebrafish kcnk5b-GFP transgene. (M) FRET-FLIM image after measuring the life time of CFP of the K+ FRET reporter KIRIN in a cell transfected with a control plasmid only expressing mCherry. The inset image of the confirmation of the FRET reporter depicting how FRET occurs. (N) FRET-FLIM image after measuring the life time of CFP of the K+ FRET reporter KIRIN in a cell transfected with a plasmid expressing kcnk5b-mCherry. The inset image of the confirmation of the FRET reporter depicting how FRET do not occur. (O) The graphed assessments of the changes in CFP lifetime in the control mCherry-expressing cells and the cells expressing kcnk5b-mCherry. The diagrams to the right of the graph depict the conformational changes that result in the values of the lifetimes of CFP. The data for each experiment represents three or more experiments. The graphed data points show all technical replicates.
Figure 4—figure supplement 2
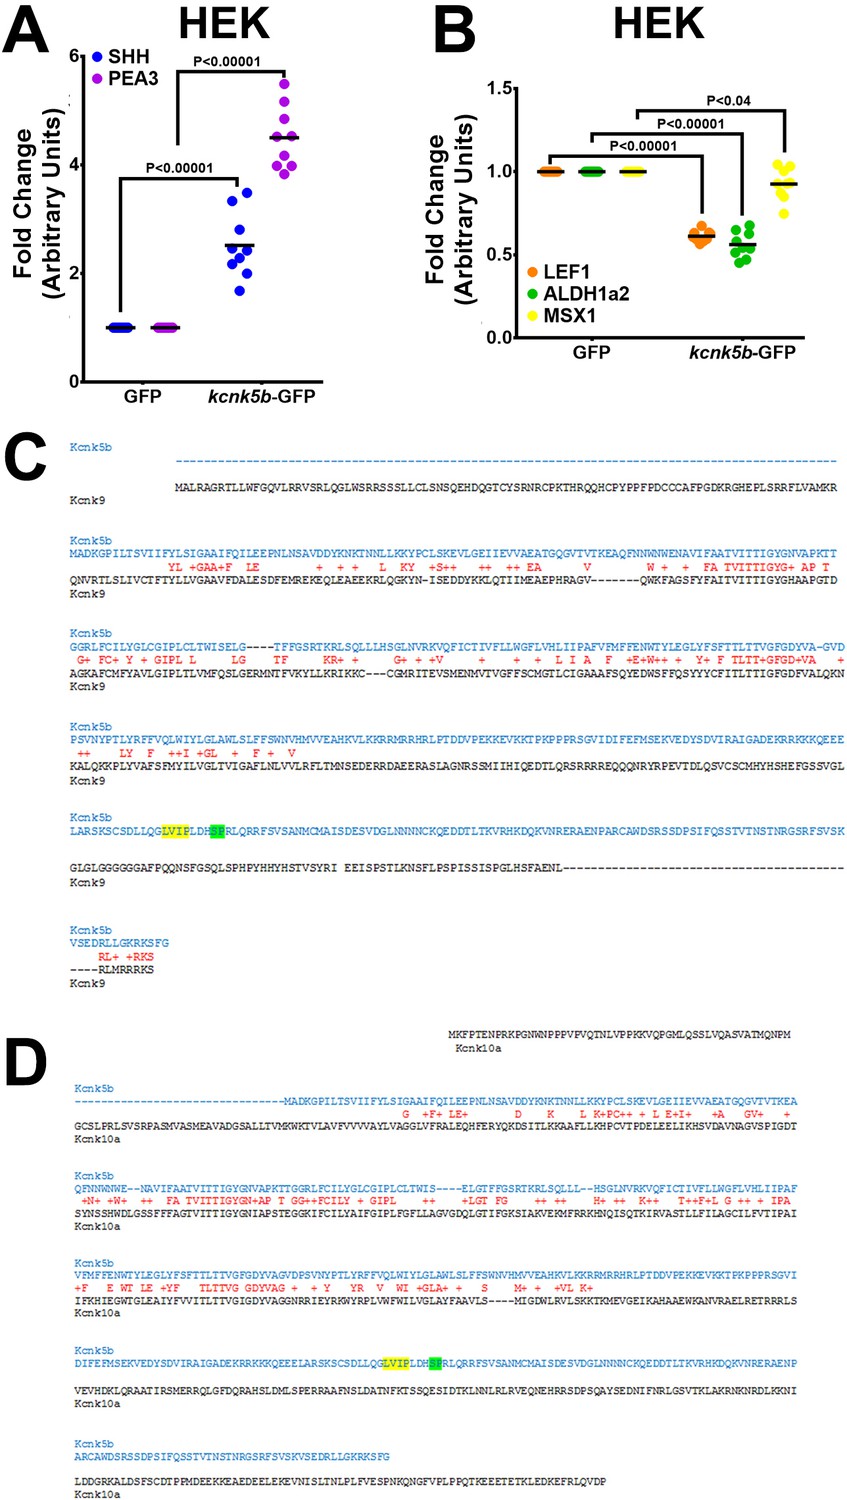
Comparison of Kcnk5b with Knck9 or with Kcnk10.
(A,B) qRT-PCR measurement of the indicated gene after 24 hr transfection of Kcnk5b in HEK293T cells. (C,D) Comparison between zebrafish amino acid sequences from Kcnk5b (blue) and Kcnk9 (C, black) and Kcnk10b (D, black) show conserved (red letter) and similar properties (red plus sign) amino acids. Yellow-highlighted letters indicate calcineurin binding site, and green-highlighted letters indicate the site of post-translational modification by calcineurin. The data for each experiment represent three or more experiments. The graphed data points show all technical replicates.
Figure 5
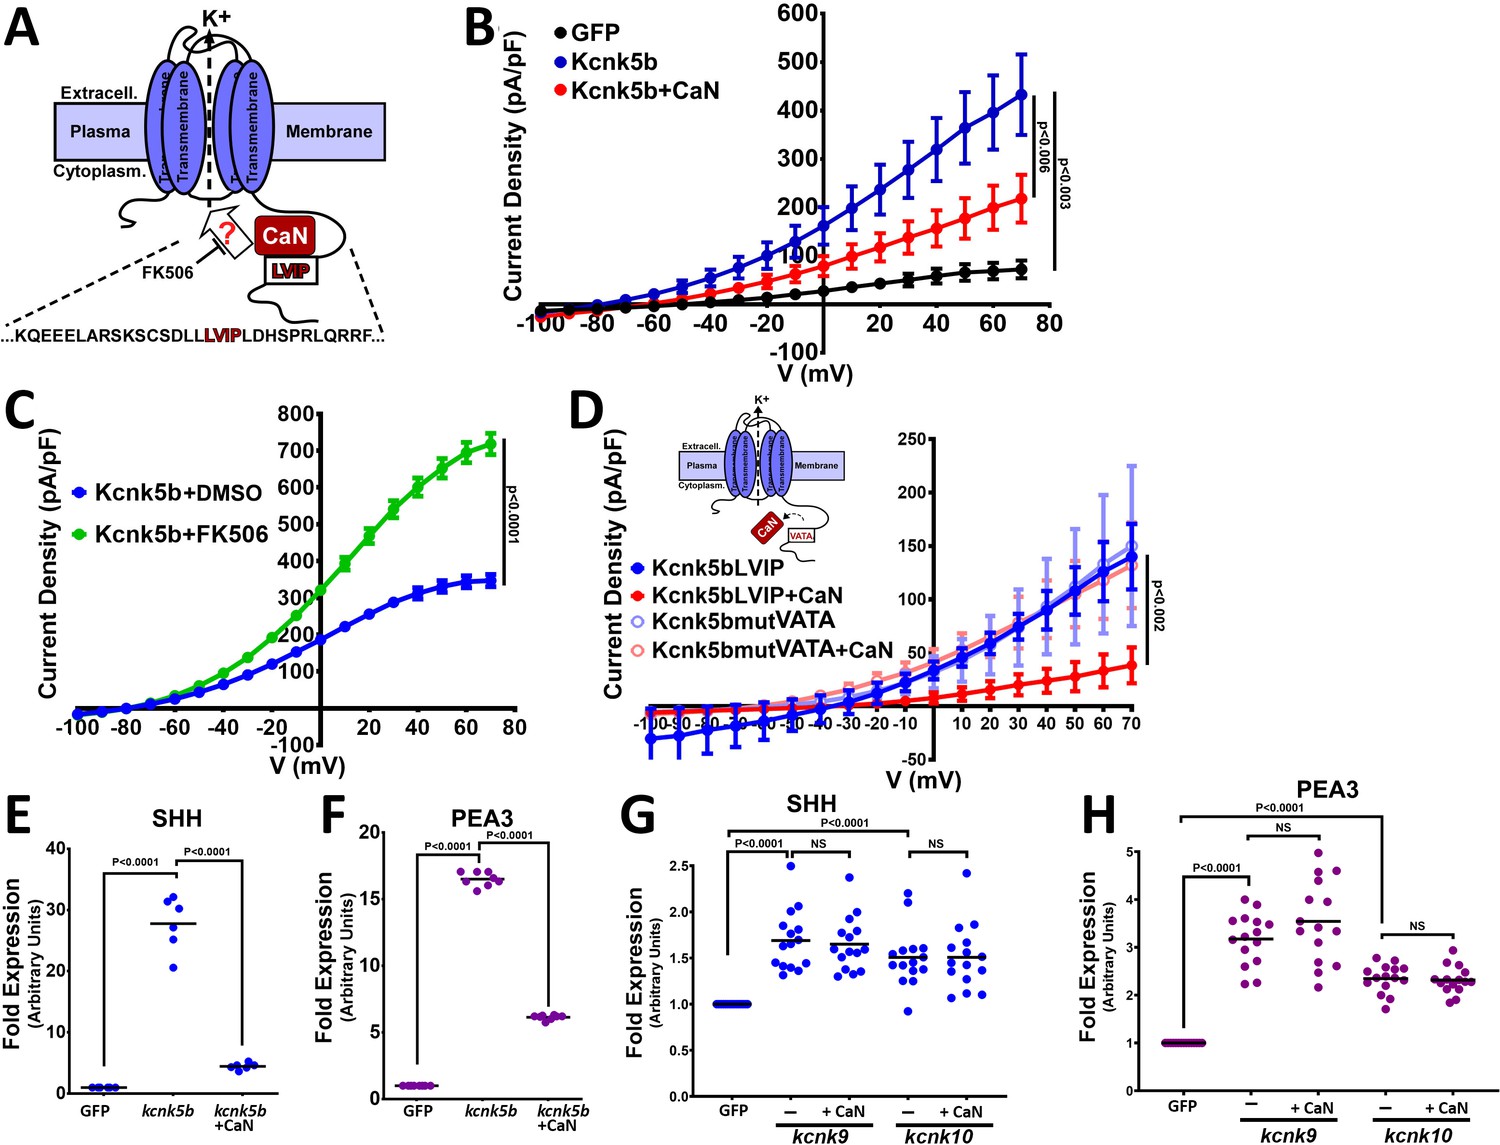
Calcineurin functionally interacts and regulates channel activity of Kcnk5b.
(A) Diagram of hypothetical interaction between Calcineurin (CaN) and Kcnk5b at a consensus calcineurin binding site (LVIP) in Kcnk5b. (B) Whole-cell patch clamp of HEK293T (HEK) cells expressing the indicated zebrafish proteins: Calcineurin-mCherry and Kcnk5b-GFP. (C) Whole-cell patch-clamp results of cells expressing zebrafish Kcnk5b-GFP and treated either with DMSO or the calcineurin inhibitor FK506. (D) Diagram shows mutant Kcnk5b with altered amino acids at putative calcineurin binding site and graph of the Patch-clamp results of the wild-type zebrafish Kcnk5b channel (Kcnk5bLVIP) or mutant Kcnk5b (Kcnk5bmutVATA) lacking the putative calcineurin binding site. Each construct is expressed either with or without calcineurin (CaN). (E) qRT-PCR for SHH in HEK cell lines stably expressing either GFP or Kcnk5b-GFP and transfection with calcineurin-mCherry (CaN). (F) qRT-PCR for PEA3 in HEK cell lines stably expressing either GFP or Kcnk5b-GFP and transfection with calcineurin-mCherry (CaN). (G) qRT-PCR of SHH expression HEK cells after transfection either with GFP, kcnk9-GFP or kcnk10-GFP with or without calcineurin (CaN). (H) qRT-PCR of PEA3 expression HEK cells after transfection either with GFP, kcnk9-GFP, or kcnk10-GFP with or without calcineurin (CaN). The electrophysiology measurements (B–D) are averages with SEM. (E–G) Graph panels show averages. The data represent three or more experiments. The averaged data points graphed in D-B have two or more technical replicates per experiment. The data points graphed in E-H show all technical replicates. Student’s T test was used to determine the indicated significance (p) values.
-
Figure 5—source data 1
Electrophysiological measurement data.
- https://cdn.elifesciences.org/articles/60691/elife-60691-fig5-data1-v2.xlsx
Figure 6 with 1 supplement
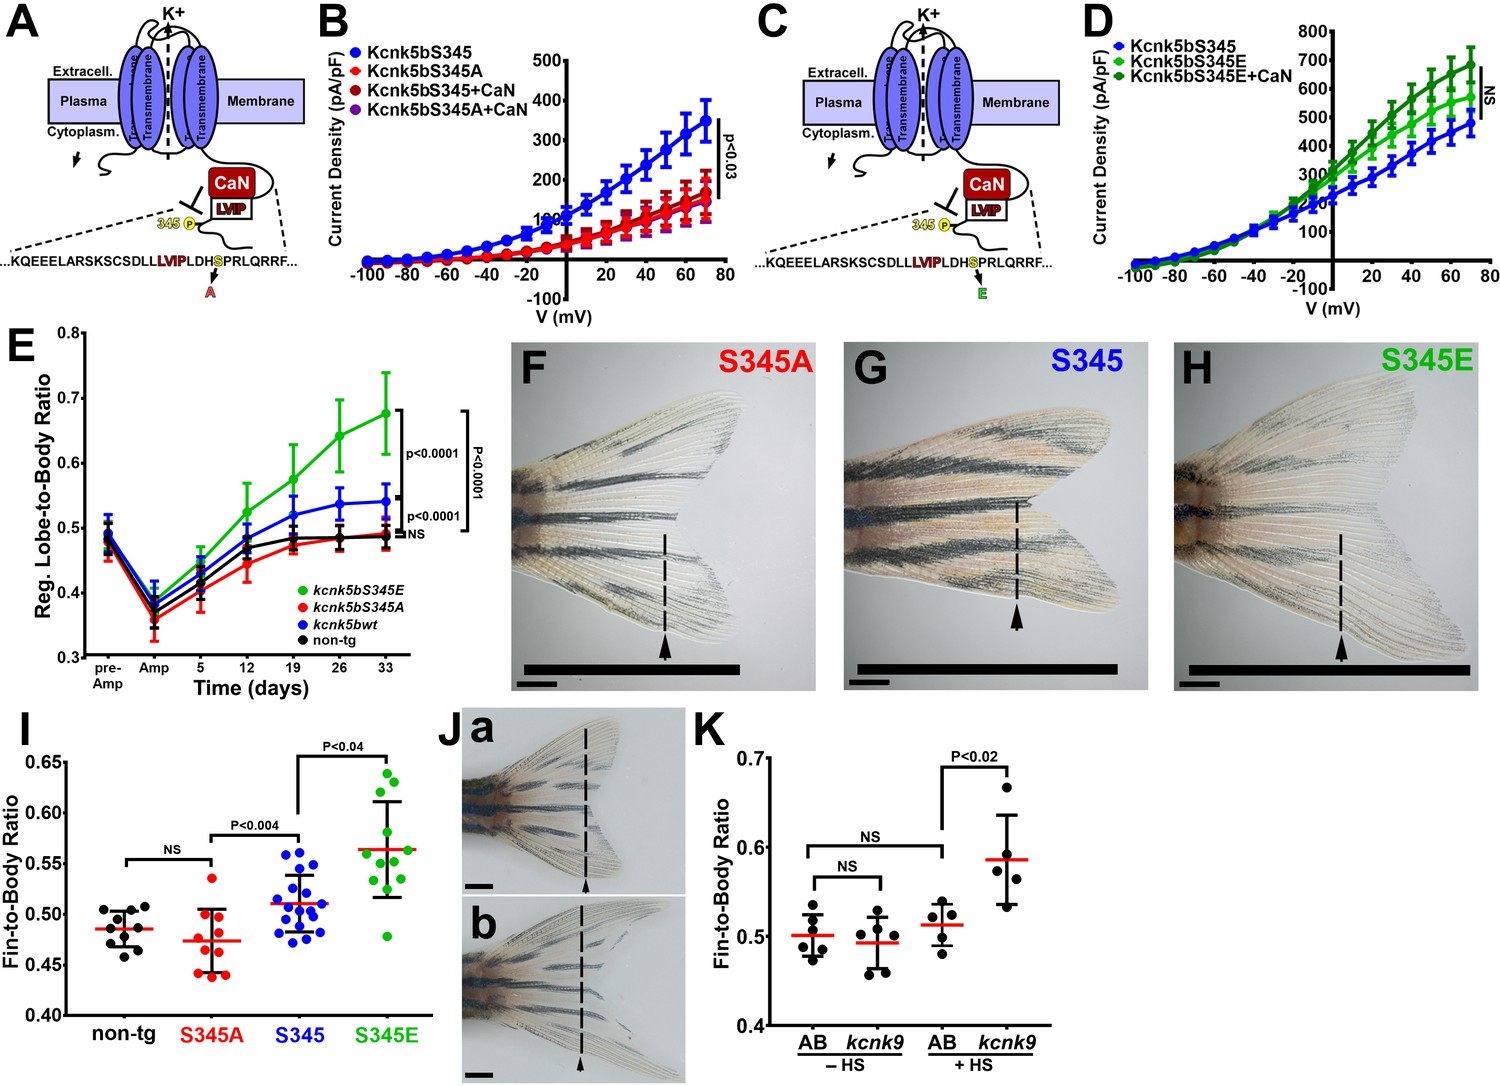
Regulation of Kcnk5b controls scaling of the fin.
(A) Diagram of Kcnk5b channel showing proposed Serine345Proline346 calcineurin dephosphorylation site adjacent the calcineurin-interaction site (LVIP). Mutation of S345 to alanine (A) mimics dephosphorylation. (B) Whole-cell patch-clamp results of HEK239T (HEK) cells transfected with zebrafish wild-type channel (Kcnk5bS345) or the dephospho-mimic mutant (KcnkS345A) either with or without calcineurin (CaN). (C) Diagram of serine (S) to glutamic acid (E) substitution to mimic phosphorylation of Kcnk5b. (D) Whole-cell patch-clamp measurements for wild-type Kcnk5b and mutant Kcnk5b harboring a Serine345 to glutamic acid either with or without calcineurin (CaN). (E) Graph displays different growth rates of the regenerating caudal fin lobes of the indicated transgenic fish lines. Body length of each fish was used to standardize the fin length measurements (fin-to-body ratio). (F) Caudal fin of Tg[hsp70:kcnkbS345A] transgenic fish after regeneration of ventral lobe. (G) Caudal fin of Tg[hsp70:kcnk5bS345] transgenic fish after regeneration of ventral lobe. (H) Caudal fin of Tg[hsp70:kcnk5bS345E] transgenic fish after regeneration of ventral lobe. (I) Graph of fin-to-body ratios of the unamputated lobes of the indicated transgenic fish lines at 33 days of the same fish as in (F). (J) Representative caudal fins of the Tg[hsp70:kcnk9-GFP] fish that was allowed to regenerate without any heat-shock induction of the transgene (a) or underwent a daily 10 min heat-shock induction of the Tg[hsp70:kcnk9-GFP] transgene (b). (K) Assessment of regenerative fin growth at 33 dpa of the indicated fish lines and heat-shock treatment. The data for each experiment represent three or more experiments. The averaged data points in B,D,E represent two or more technical replicates per experiment. The graphed data in I,K show all technical replicates. The electrophysiology measurements (panels B,D) are represented as averages with SEM. Significance values shown in the graphs were measured by students t-tests (E, I, K) are represented as averages and SD. The scale bars equal 2 mm (F–H,Ja,b). Arrows and dashed lines in F-H,Ja,b indicate amputation planes through fins.
-
Figure 6—source data 1
Electrophysiological data and fin/body measurements.
- https://cdn.elifesciences.org/articles/60691/elife-60691-fig6-data1-v2.xlsx
Figure 6—figure supplement 1
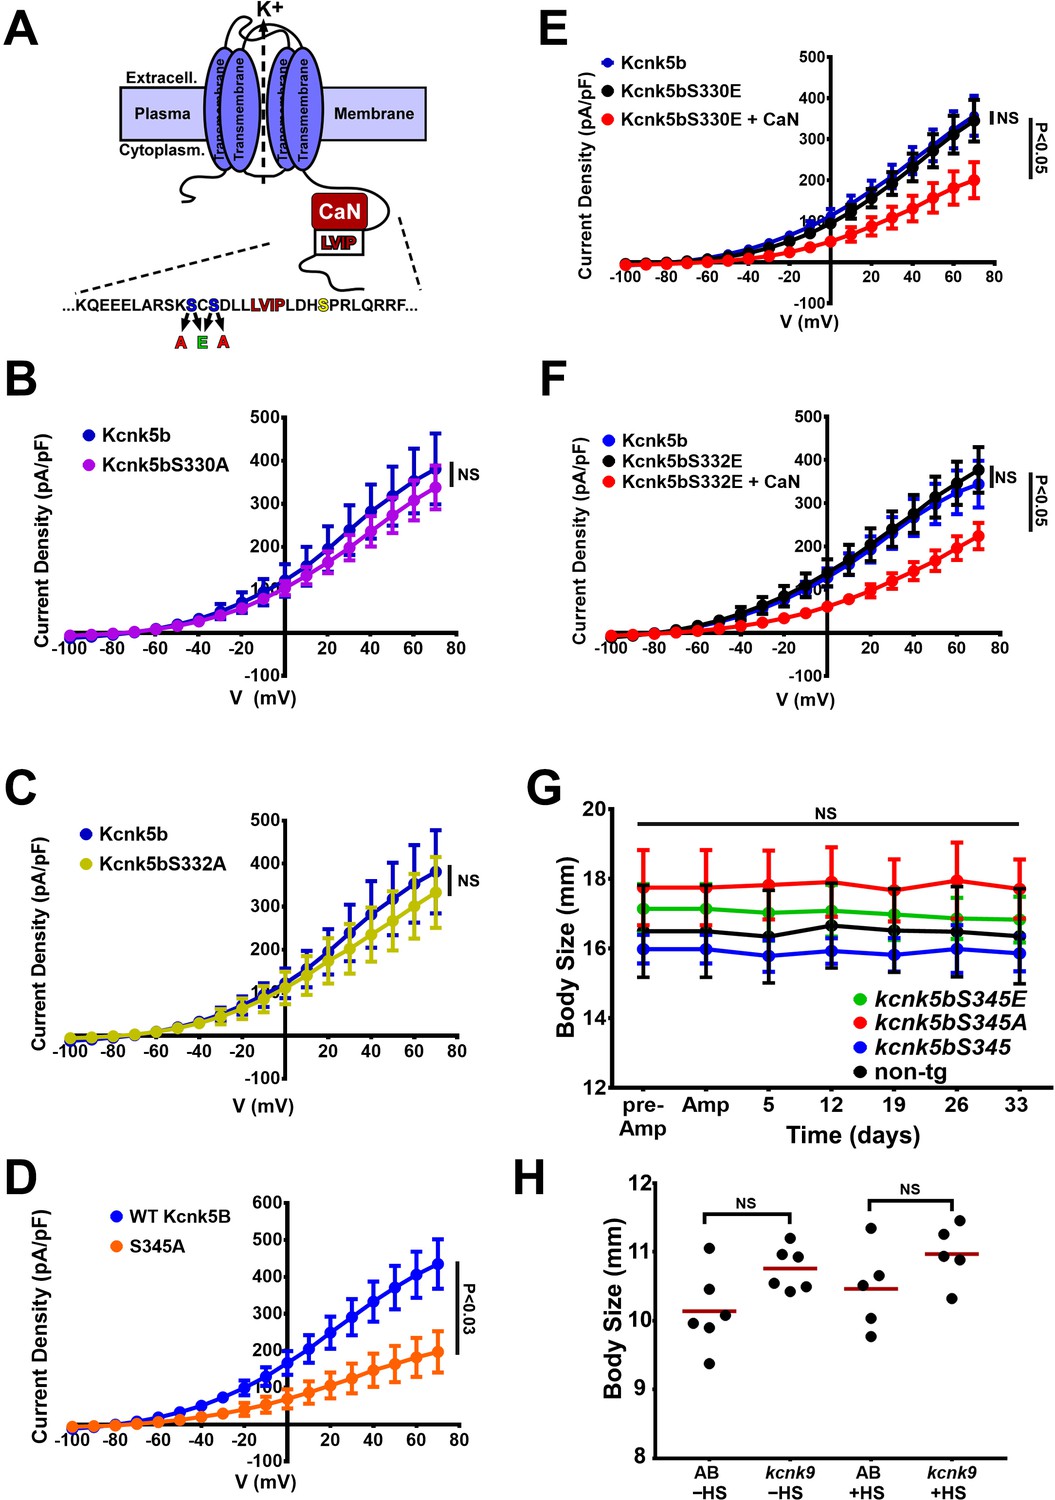
Activity measurements of Kcnk5b Serine mutant channels.
(A) Diagram of Kcnk5b channel showing proposed Serine345 calcineurin dephosphorylation site (yellow) adjacent the calcineurin-interaction site (LVIP). Two other serines (blue) were substituted with alanines or glutamic acids to mimic dephosphorylation or phosphorylation. (B) Electrophysiology measurements of wild-type Kcnk5b (blue) and serine-to-alanine mutant Kcnk5bS330A (purple). (C) Electrophysiology measurements of wild-type Kcnk5b (blue) and serine-to-alanine mutant Kcnk5bS332A (yellow). (D) Electrophysiology measurements of wild-type Kcnk5b (blue) and serine-to-alanine mutant Kcnk5bS345A (orange). (E) Electrophysiology measurements of wild-type Kcnk5b (blue), serine-to-glutamic acid mutant Kcnk5bS330E (black), and Kcnk5bS330E plus calcineurin (CaN) (red). (F) Electrophysiology measurements of wild-type Kcnk5b (blue), serine-to-glutamic acid mutant Kcnk5bS332E (black), and Kcnk5bS332E plus calcineurin (CaN) (red). (G) Body length measurements from tip of the head to the base of the fin for each transgenic fish are represented as averages and standard deviation. (H) Body length measurements from tip of the head to the base of the fin for each fish of either wild-type (AB) or Tg[hsp70:kcnk9-GFP] (kcnk9) either without (–HS) or with (+HS) heat shock. The data for each experiment represent three or more experiments. The averaged data points in B-G represent two or more technical replicates per experiment. The data in H show all technical replicates.
-
Figure 6—figure supplement 1—source data 1
Electrophysiological data and fin/body measurements.
- https://cdn.elifesciences.org/articles/60691/elife-60691-fig6-figsupp1-data1-v2.xlsx
Figure 7
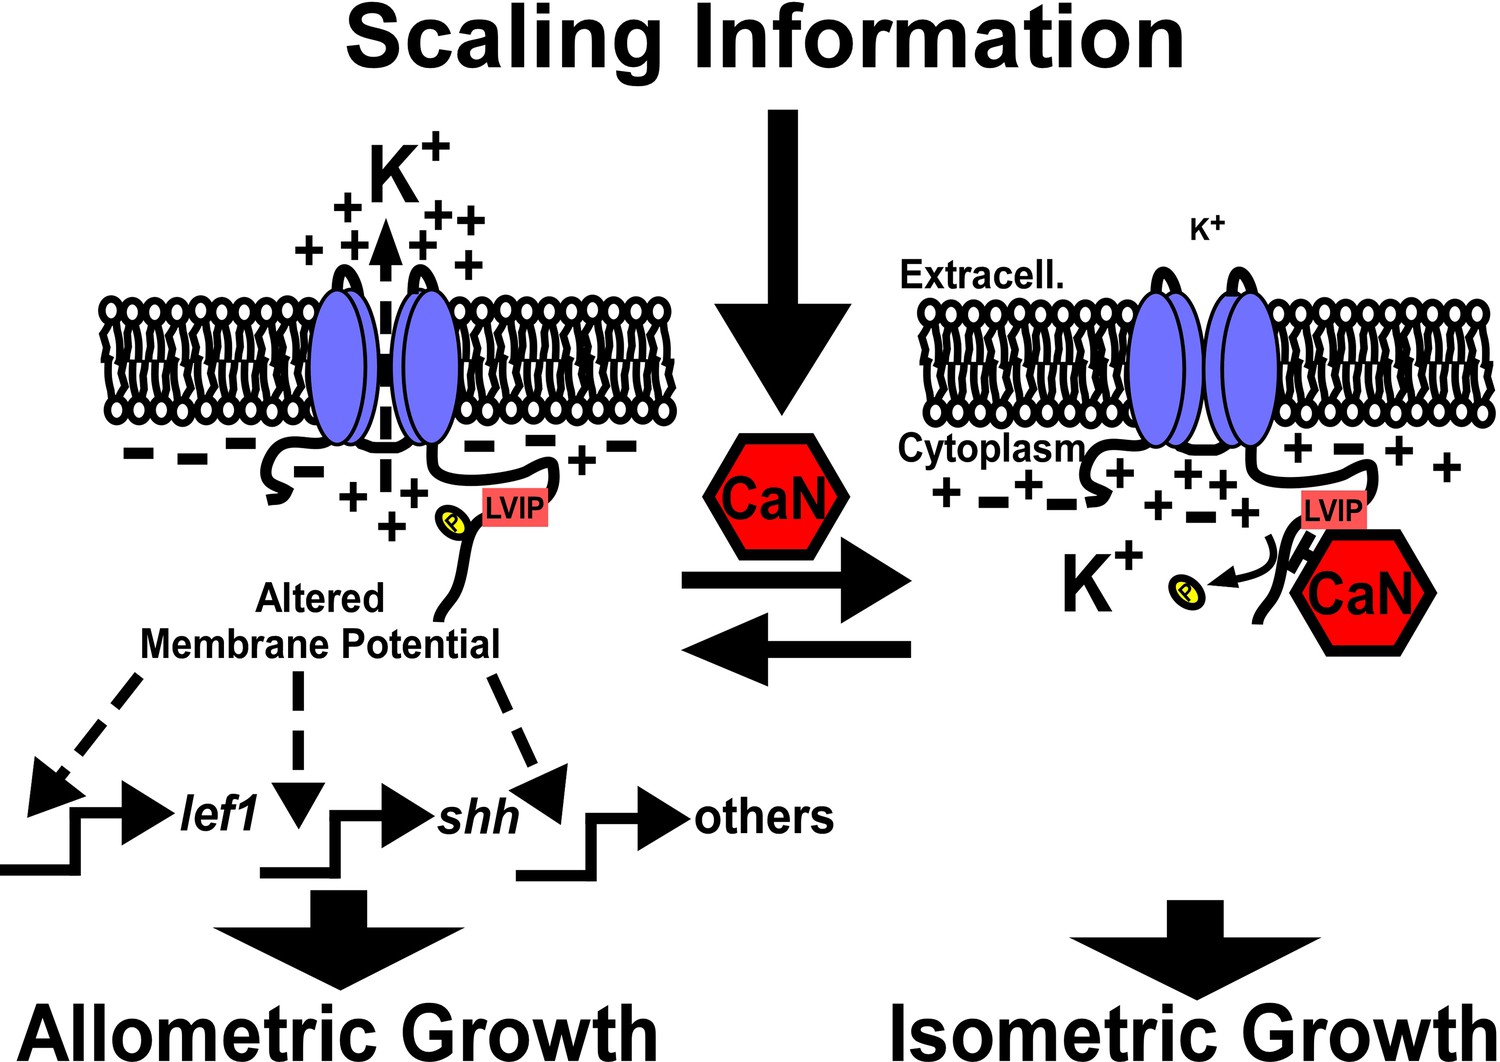
Model of calcineurin regulation of Kcnk5b-mediated activation of developmental gene transcription.
Kcnk5b activation results in reduced cytoplasmic K+, which is sufficient to induce the transcription of the shh ligand and lef1 transcription factor as well as components of other developmental pathways to induce coordinated allometric growth of the tissues of the fish fin appendage. Scaling information from the body or local tissues in the fin activate calcineurin so that it dephosphorylates Kcnk5b on S345 to reduce its K+-channel activity, which results in isometric growth of the fin.
Tables
Key resources table
| Reagent type (species) or resource | Designation | Source or reference | Identifiers | Additional information |
|---|---|---|---|---|
| Gene (Danio rerio) | Kcnk5b | genebank | ZFIN:ZDB-GENE-040426–1297 | |
| Gene (Danio rerio) | Kcnk9 | genebank | ZFIN:ZDB-GENE-070705–260 | |
| Gene (Danio rerio) | Kcnk10a | genebank | ZFIN:ZDB-GENE-041210–291 | |
| Gene (Homo sapiens) | CaN | genebank | HGNC:HGNC:9314 | |
| Gene (Danio rerio) | lef1 | genebank | ZFIN:ZDB-GENE-990714–26 | |
| Gene (Danio rerio) | shha | genebank | ZFIN:ZDB-GENE-980526–166 | |
| Gene (Danio rerio) | aldh1a2 | genebank | ZFIN:ZDB-GENE-011010–3 | |
| Gene (Danio rerio) | pea3 | genebank | ZFIN:ZDB-GENE-990415–71 | |
| Gene (Danio rerio) | msxb | genebank | ZFIN:ZDB-GENE-980526–312 | |
| Gene (Danio rerio) | ptch1 | genebank | ZFIN:ZDB-GENE-980526–196 | |
| Gene (Danio rerio) | ptch2 | genebank | ZFIN:ZDB-GENE-980526–44 | |
| Gene (Danio rerio) | bmp2b | genebank | ZFIN:ZDB-GENE-980526–474 | |
| Gene (Danio rerio) | axin2 | genebank | ZFIN:ZDB-GENE-000403–2 | |
| Gene (Danio rerio) | bactin2 | genebank | ZFIN:ZDB-GENE-000329–3 | |
| Gene (Homo sapiens) | lef1 | genebank | HGNC:HGNC:6551 | |
| Gene (Homo sapiens) | shh | genebank | HGNC:HGNC:10848 | |
| Gene (Homo sapiens) | aldh1a12 | genebank | HGNC:HGNC:15472 | |
| Gene (Homo sapiens) | pea3 | genebank | HGNC:HGNC:3493 | |
| Gene (Homo sapiens) | msxb | genebank | HGNC:HGNC:7391 | |
| Gene (Homo sapiens) | GAPDH | genebank | HGNC:HGNC:4141 | |
| Strain, strain background (AB as background, both male and female) | Tg[hsp70:Kcnk5b-GFP] | AB fish from CZRC | AB fish Catlog ID: CZ1 | Based on tol2 transposable element |
| Strain, strain background (AB as background,both male and female) | Tg[hsp70:Kcnk5bS345A-GFP] | AB fish from CZRC | AB fish Catlog ID: CZ1 | Based on tol2 transposable element |
| Strain, strain background (AB as background,both male and female) | Tg[hsp70:Kcnk5bS345E-GFP] | AB fish from CZRC | AB fish Catlog ID: CZ1 | Based on tol2 transposable element |
| Strain, strain background (AB as background,both male and female) | Tg[hsp70:Kcnk9-GFP] | AB fish from CZRC | AB fish Catlog ID: CZ1 | Based on tol2 transposable element |
| Strain, strain background (AB as background,both male and female) | Tg[7XTCF-Xla.sam:mCherry] | European Zebrafish Resource Center | Cat.#:15200 | |
| Genetic reagent (Oryzias latipes) | Transposase RNA | This paper | This paper | In vitro transcripted by sp6 kit |
| Genetic reagent | DIG RNA Labeling Mix | Roche | Cat.#:1277073 | |
| Genetic reagent (E. coli) | T7 RNA-polymerase | Promega | Cat. #:P207B | |
| Cell line (human) | pLenti-CMV-Kcnk5b-EGFP | OBiO | Contract number:HYKY-181108018-DLV | Titer:1.67E*08 TU/ml |
| Cell line (human) | pLenti-CMV- EGFP | OBiO | Contract number:HYKY-181108018-DLV | Titer:1.55E*09 TU/ml |
| Transfected construct (human) | CMV-Kcnk5b-GFP | This paper | Primers from https://www.genewiz.com.cn | Kcnk5b is cloned from adult zebrafish fin cDNA library |
| Transfected construct (human) | CMV-Kcnk9-GFP | This paper | Primers from https://www.genewiz.com.cn | Kcnk9 is cloned from zebrafish 3dpf larva cDNA library |
| Transfected construct (human) | CMV-Kcnk10-GFP | This paper | Primers from https://www.genewiz.com.cn | Kcnk10 is cloned from zebrafish 3dpf larva cDNA library |
| Transfected construct (human) | CMV-CaN-Mcherry | This paper | Primers from https://www.genewiz.com.cn | CaN is cloned from adult zebrafish fin cDNA library |
| Transfected construct (human) | CMV-Kirin | Shen et al., 2019 | ||
| Biological sample (zebrafish) | Adult zebrafish fin tissue | This paper | This paper | Freshly isolated after heatshock at indicated time points |
| Antibody | Anti-GFP (mouse monoclonal) | Invitrogen | Cat. #: MA5-15349 RRID:AB_987186 | IF(1: 400) |
| Antibody | Anti-β-catenin (rabbit polyclonal) | Cell Signaling | Cat. #: 9562L RRID: B_331149 | WB(1:1000) IF(1:400) |
| Antibody | Anti-Lef1(rabbit monoclonal) | Cell Signaling | Cat. #:2230T RRID:AB_823558 | WB (1:1000) |
| Antibody | Anti-Shh(rabbit polyclonal) | Novus | Cat. #: NBP2-22139 | WB (1:1000) |
| Antibody | Anti-mCherry antibody(rabbit polyclonal) | Invitrogen | Cat.#:PA534974 RRID: AB_2552323 | IF(1:1000) |
| Antibody | Anti-mouse-GFP (goat polyclonal) | Abcam | Cat.#:ab150113 RRID:AB_2576208 | IF(1:1000) |
| Antibody | Goat-anti-rabbit-mCherry secondary antibody(Goat polyclonal) | Abcam | Cat.#:ab150078 RRID:AB_2722519 | IF(1:2000) |
| Antibody | Anti-Mouse IgG (goat Polyclonal) | Sigma | Cat. #:A3682-1ML RRID:AB_258100 | WB(1:80000) |
| Antibody | Anti-Rabbit IgG (H+L) (donkey Polyclonal) | Jackson | Cat. #:711-036-152 RRID:AB_2340590 | WB(1:20000) |
| Antibody | Anti-β-Actin pAb-HRP-DirecT (rabbit Polyclonal) | MBL | Cat. #:PM053-7 RRID:AB_10697035 | WB(1:2000) |
| Antibody | Anti-Digoxigenin-AP, Fab fragments(sheep polyclonal) | Roche | Cat.#:11093274910 | Insitu(1:5000) |
| Recombinant DNA reagent | NovoRec plus One step PCR Cloning Kit | novoprotein | Cat. #:NR005-01B | |
| Sequence-based reagent | F-kcnk9 | This paper | Pcr primers | ATGAAGAGGCAGAACGTGCGGACGC |
| Sequence-based reagent | R-kcnk9 | This paper | Pcr primers | GATGGACTTGCGTCGTCTCATAAGCCGG |
| Sequence-based reagent | F-kcnk10 | This paper | Pcr primers | ATGAAATTTCCAACGGAAAACCCGAGGAAG |
| Sequence-based reagent | R-kcnk10 | This paper | Pcr primers | CTATGGATCCACCTGCAAACGGAACTC |
| Commercial assay or kit | Protein Quantitative Kit (BCA) | MDBio | Cat. #:KT054-200rxn | |
| Chemical compound, drug | FK506 | Sigma | Cat. #:F4679-5MG | |
| Chemical compound, drug | DL-Dithiothreitol | Promega | Cat. #:P117B | |
| Chemical compound, drug | Adenosine 5’-triphosphate disodium salt hydrate | sigma | Cat. #:A2383 | |
| Chemical compound, drug | Nitro Blue Tetrazolium | Sigma | Cat. #:N6639 | |
| Chemical compound, drug | BCIP | Sigma | Cat. #:B-8503 | |
| Chemical compound, drug | DAPI | Roche | Cat.#:10236276001 | |
| Software, algorithm | ImageJ | Open source | RRID:SCR_003070 | https://imagej.nih.gov/ij/ |
| Software, algorithm | SymPhoTime 64 | PicoQuant | RRID:SCR_016263 | Used to analysis flim data |
| Software, algorithm | Zen Blue | Zeiss | RRID:SCR_013672 | |
| Software, algorithm | Patchmaster | Heka | RRID:SCR_000034 | |
| Software, algorithm | Graphpad prism | Graphpad Software | RRID:SCR_002798 | |
| Software, algorithm | Clampfit10.5 | Axon | RRID:SCR_011323 | |
| Other | ExpressPlus PAGE Gel, 8–16%, 15 wells | Genscript | Cat.#:M81615C | For western blotting |
| Other | Western Lightning Plus ECL 680 | PerkinElmer(PE) | Cat.#:NEL105001EA | For western blotting |
| Other | MMESSAGE MMACHINE SP6 KIT | Invitrogen | Cat.#:AM1340 |
Table 1
Primer sequences for qPCR genotyping.
| F-mCherry | GGCCATCATCAAGGAGTTCATGC |
|---|---|
| R-mCherry | GAGGGGAAGTTGGTGCCGC |
| F-β-actin | GAGCTGCAGTCTAAGCTTTGACC |
| R-β-actin | CATTGCCGTCACCTTCACCGTTC |
Table 2
qRT-PCR primer sequences for zebrafish genes.
| F-lef1 | AATGATCCCGTTCAAAGACG |
|---|---|
| R-lef1 | CGCTAAGTCTCCCTCCTCCT |
| F-shha | CCACTACGAGGGAAGAGCTG |
| R-shha | GAGCAATGAATGTGGGCTTT |
| F-aldh1a2 | AACCACTGAACACGGACCTC |
| R-aldh1a2 | CTCCAGTTTGGCTCCTTCAG |
| F-pea3 | AGAAGAACCGTCCAGCCATGA |
| R-pea3 | AACATAACGCTCACCAGCCAC |
| F-msxb | ACACTTTGTCGAGCGTTTCGG |
| R-msxb | TCTTGTGCTTGCGTAAGGTGC |
| F-ptch1 | GGGCAGCTAATCTGGAGACGG |
| R-ptch1 | GCGCCTCTACGGTCAAAATG |
| F-ptch2 | TGCCACGCCGCTTTTGCTTT |
| R-ptch2 | GTTTCAATGGCAGCGACCCG |
| F-bmp2a | GCAGAGCCAACACTATCAGGAG |
| R-bmp2a | CCACTTTAATACAGCAGGAGTTACG |
| F-axin2 | GGACACTTCAAGGAACAACTAC |
| R-axin2 | CCTCATACATTGGCAGAACTG |
| F-cmyc | TAACAGCTCCAGCAGCAGTG |
| R-cmyc | GCTTCAAAACTAGGGGACTG |
| F-cyclinD1 | GCCAAACTGCCTATACATCAG |
| R-cyclinD1 | TGTCGGTGCTTTTCAGGTAC |
| F-β-actin2 | GCAGAAGGAGATCACATCCCTGGC |
| R-β-actin2 | CATTGCCGTCACCTTCACCGTTC |
| F-kcnk5b | ATCACTCTCCTCGTCTGCAACG |
| R-kcnk5b | GAGTCCCATGCACAACGTGCAG |
| F-GFP | AAGGGCATCGACTTCAAGG |
| R-GFP | TGCTTGTCGGCCATGATATAG |
Table 3
qRT-PCR primers for human genes.
| F-lef1 | CTACCCATCCTCACTGTCAGTC |
|---|---|
| R-lef1 | GGATGTTCCTGTTTGACCTGAGG |
| F-shh | CCGAGCGATTTAAGGAACTCACC |
| R-shh | AGCGTTCAACTTGTCCTTACACC |
| F-aldh1a2 | GAGTAACTCTGGAACTTGGAGGC |
| R-aldh1a2 | ATGGACTCCTCCACGAAGATGC |
| F-pea3 | AGGAACAGACGGACTTCGCCTA |
| R-pea3 | CTGGGAATGGTCGCAGAGGTTT |
| F-msx1 | GACTCCTCAAGCTGCCAGAAGA |
| R-msx1 | ACGGTTCGTCTTGTGTTTGCGG |
| F-GAPDH | GTCTCCTCTGACTTCAACAGCG |
| R-GAPDH | ACCACCCTGTTGCTGTAGCCAA |
Table 4
Primer sequences for mouse qPCR.
| F-lef1 | ACTGTCAGGCGACACTTCCATG |
|---|---|
| R-lef1 | GTGCTCCTGTTTGACCTGAGGT |
| F-shh | GGATGAGGAAAACACGGGAGCA |
| R-shh | TCATCCCAGCCCTCGGTCACT |
| F-aldh1a2 | CACAAGACACGAGCCCATTGGA |
| R-aldh1a2 | GGTTTGATGACCACGGTGTTACC |
| F-pea3 | CACAGACTTCGCCTACGACTCA |
| R-pea3 | GCAGACATCATCTGGGAATGGTC |
| F-msx1 | AGGACTCCTCAAGCTGCCAGAA |
| R-msx1 | CGGTTGGTCTTGTGCTTGCGTA |
| F-GAPDH | CATCACTGCCACCCAGAAGACTG |
| R-GAPDH | ATGCCAGTGAGCTTCCCGTTCAG |
Additional files
Download links
A two-part list of links to download the article, or parts of the article, in various formats.
Downloads (link to download the article as PDF)
Open citations (links to open the citations from this article in various online reference manager services)
Cite this article (links to download the citations from this article in formats compatible with various reference manager tools)
A calcineurin-mediated scaling mechanism that controls a K+-leak channel to regulate morphogen and growth factor transcription
eLife 10:e60691.
https://doi.org/10.7554/eLife.60691


