Ubiquitin-interacting motifs of ataxin-3 regulate its polyglutamine toxicity through Hsc70-4-dependent aggregation
- Department of Pharmacology, Wayne State University, United States
- Department of Neurology, Wayne State University, United States
Figures
Figure 1 with 1 supplement
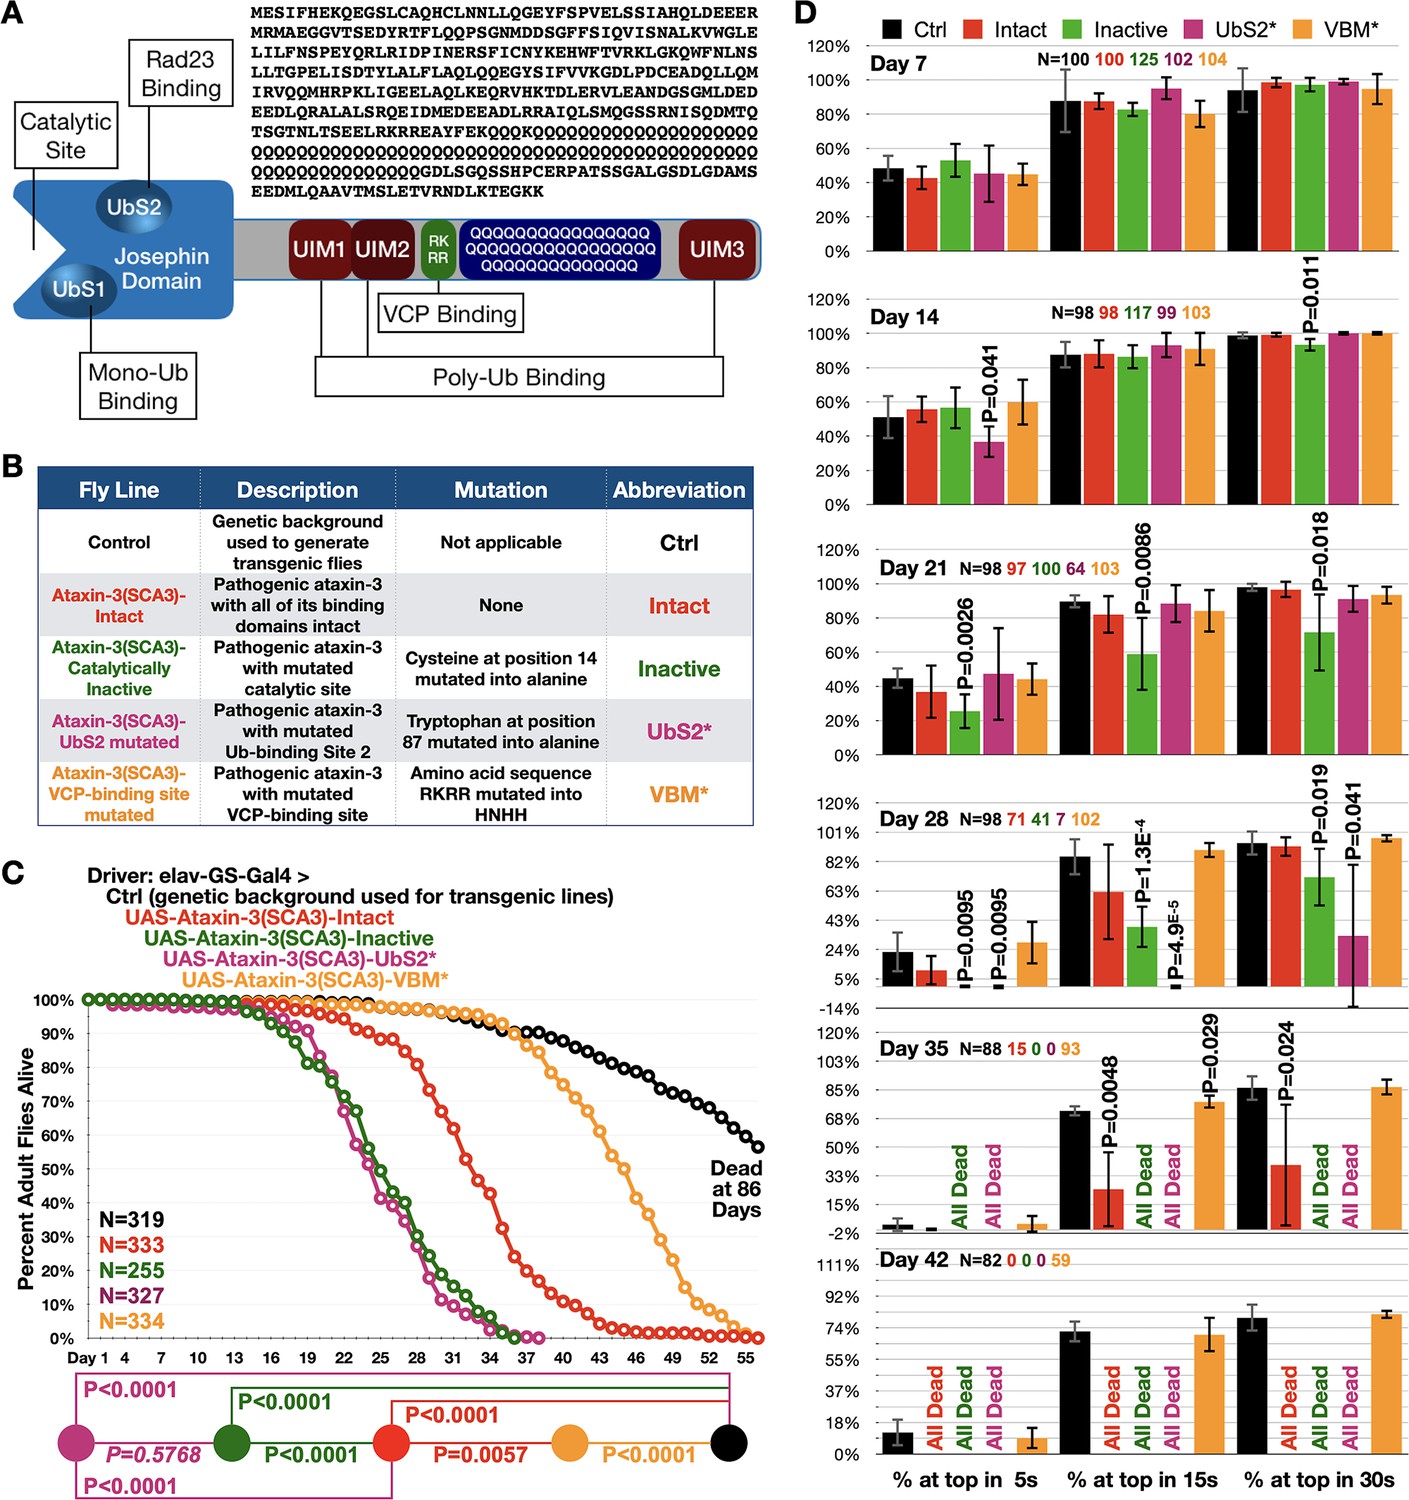
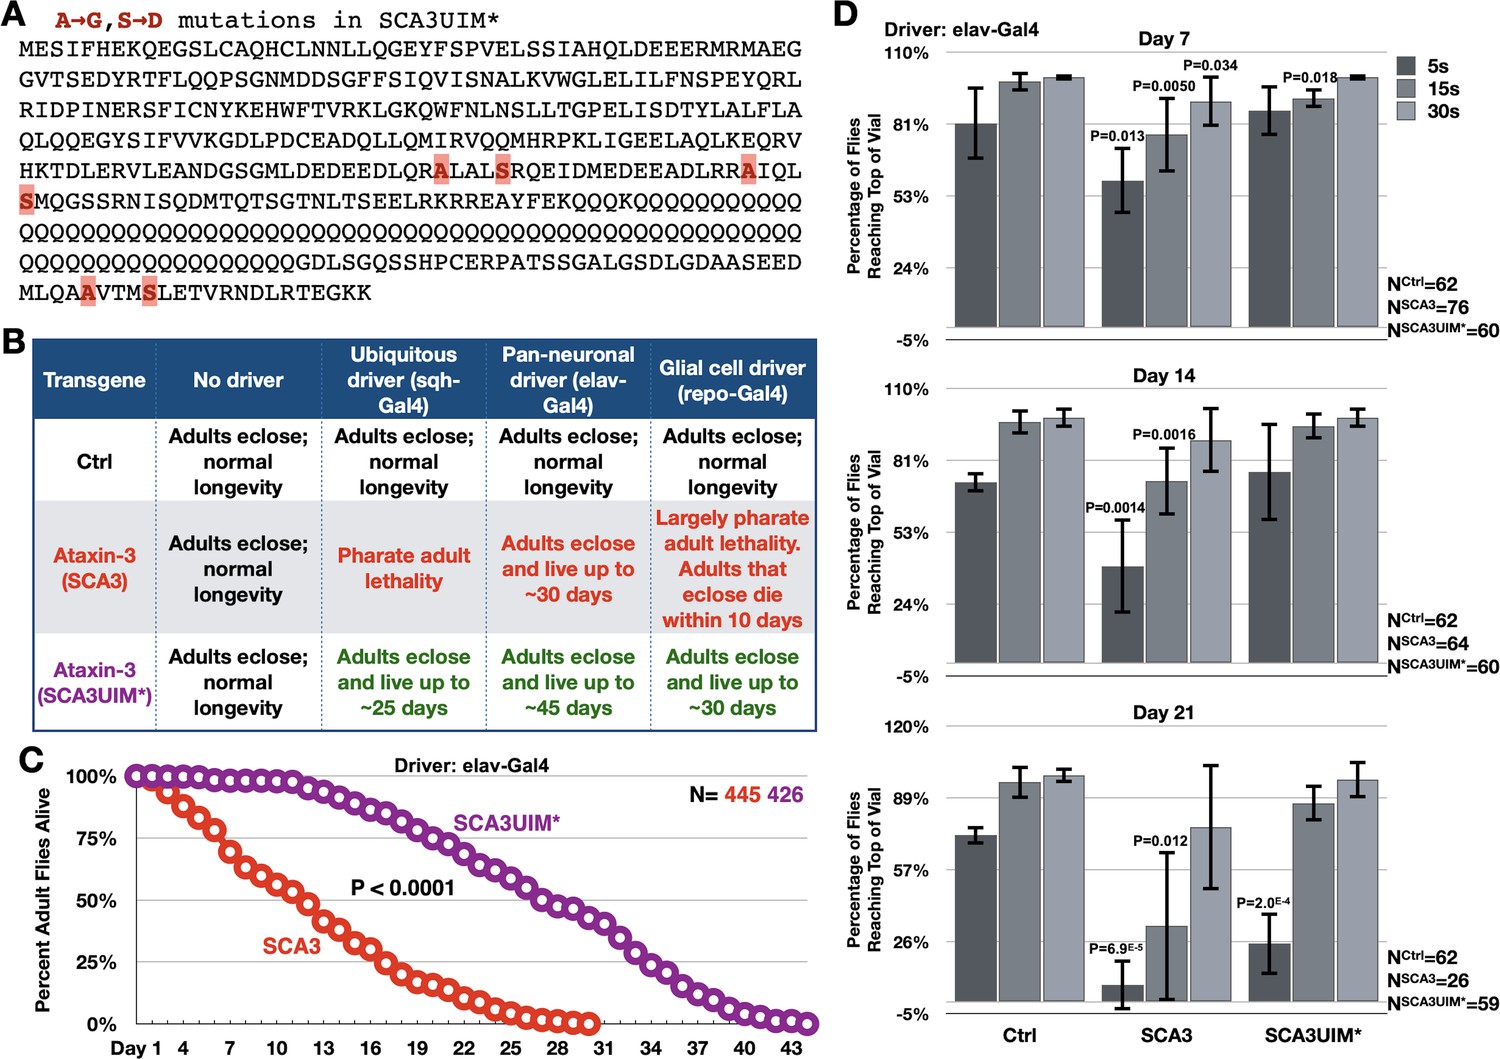
Ataxin-3 domains impact its polyQ toxicity.
(A) Diagram of ataxin-3. Josephin: deubiquitinase domain necessary for ataxin-3's ability to cleave ubiquitin bonds (Winborn et al., 2008). UbS: ubiquitin-binding site (Nicastro et al., 2010; Nicastro et al., 2009); UIM: ubiquitin-interacting motif (Winborn et al., 2008); RKRR: amino acid sequence necessary for ataxin-3 to bind directly to VCP, known as VCP-binding motif, VBM (Boeddrich et al., 2006). QQQ: polyQ that is expanded in SCA3 (Costa and Paulson, 2012). Also shown is the amino acid sequence of human ataxin-3 used. (B) Summary of transgenic fly lines, mutations, and abbreviations. (C) Longevity results when pathogenic ataxin-3 versions are expressed pan-neuronally in adults. P values: log-rank tests with Holm-Bonferroni adjustment. Italicized P value: not statistically significant. (D) Means -/+ SD from negative geotaxis tests. Groups are the same as in (C). P values: one-tailed, Student’s t-tests comparing lines to control flies of the same day and time point. ‘One-tailed’ tests were chosen based on the outcomes from longevity data in panel (C), which indicated specific directionality in expectations. If no P value is noted, it was equal to or greater than 0.05. Exact P values are given in other cases. The total number of flies in each group is shown in panels. For panel (D), the number of independent groups of flies per genotype was: Ctrl: 5, Intact: 5, Inactive: 6, UbS2*: 5, VBM*: 5. Repeats were biological replicates.
-
Figure 1—source data 1
Data related to Figure 1 - Longevity and motility results.
- https://cdn.elifesciences.org/articles/60742/elife-60742-fig1-data1-v2.xlsx
Figure 1—figure supplement 1
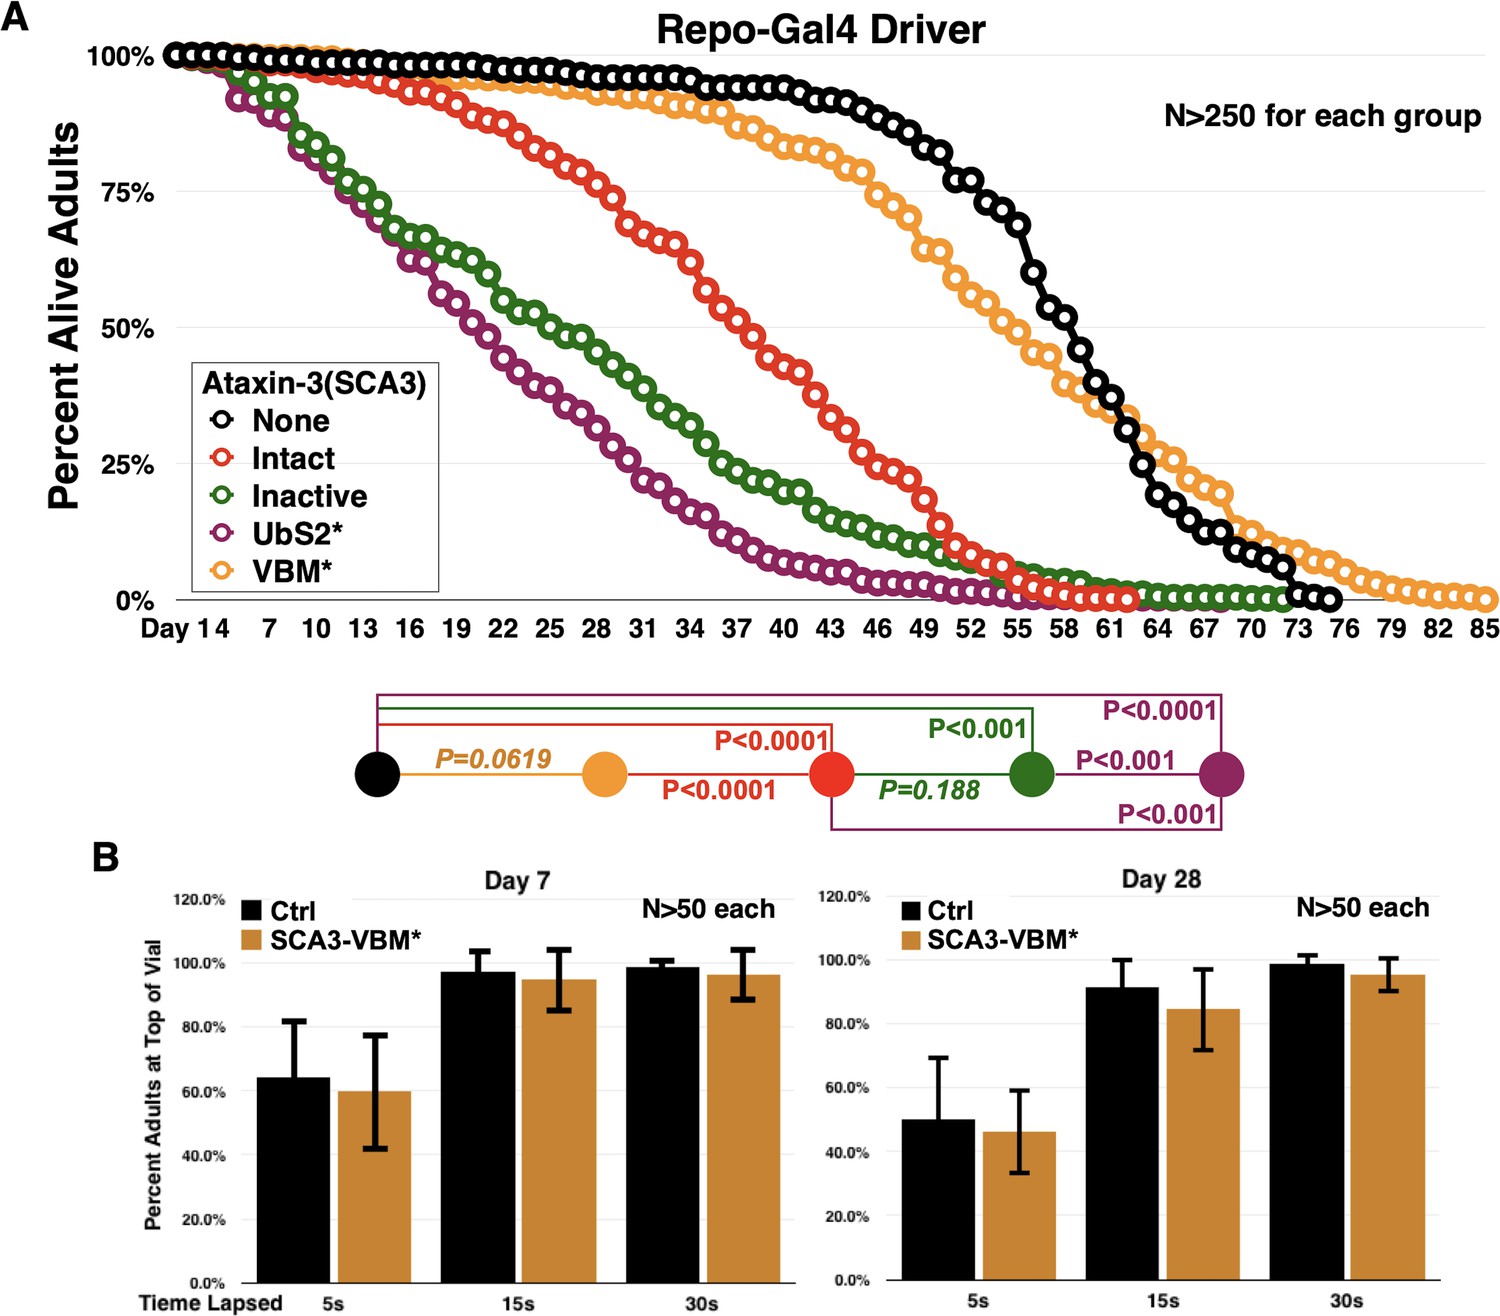
Ataxin-3 domains impact the toxicity of its polyQ-expanded variant in glia.
(A) Longevity curves from adults expressing the noted versions of ataxin-3 in all fly glia, throughout development and in adults. These are the same lines as in Figure 1. P values are from log-rank tests with Holm-Bonferroni adjustment. P values in italics are not statistically significant. There is no statistical difference for 100% death between flies expressing ‘Intact’ versus ‘Inactive’, even though 50% lethality is different. This is because each vial with flies is treated as one individual and for statistical purposes the day when all flies are dead is considered, not the rate of death over the course of time for each vial. (B) Negative geotaxis assay comparing motility of flies not expressing any pathogenic ataxin-3 versus flies expressing pathogenic ataxin-3 with mutated VBM in all glial cells. Driver, as in panel (A), was repo-Gal4. No statistical differences are observed at any time point between the groups based on two-tailed Student’s t-tests. We selected to conduct this assay for the VCP-binding mutations since in longevity curves we noticed no significant differences in the longevity of flies not expressing pathogenic ataxin-3 compared to ones expressing the SCA3 protein with the VCP-binding mutation. Note: The ‘Intact’ line shown here is a different transgenic line than the one we generated for the polyQ studies concerning the UIMs that are shown in Figure 2 and beyond. Those lines (Figure 2 and on) have a ‘CAGCAA’ repeat for reasons summarized in main text, compared to a pure 'CAG' repeat for all lines shown in Figure 1 and in this figure, which were generated for prior work. The lines generated for Figure 2 also have an optimized Kozak sequence. As we showed earlier (Johnson et al., 2019), the ‘CAGCAA’ repeat-harboring ‘Intact’ line is at higher protein levels and is more toxic than the pure 'CAG' repeat shown here. For all the work in this study, isogenic sets are compared only to one another, that is, none of the lines shown here and in Figure 1 is directly compared to lines in Figure 2 and beyond, since these lines were conceptualized as isogenic sets from the beginning. However, we remind the reader that all ataxin-3 lines are inserted into the same chromosomal site of Drosophila, attP2, in the same orientation and as a single copy number.
Figure 2 with 1 supplement
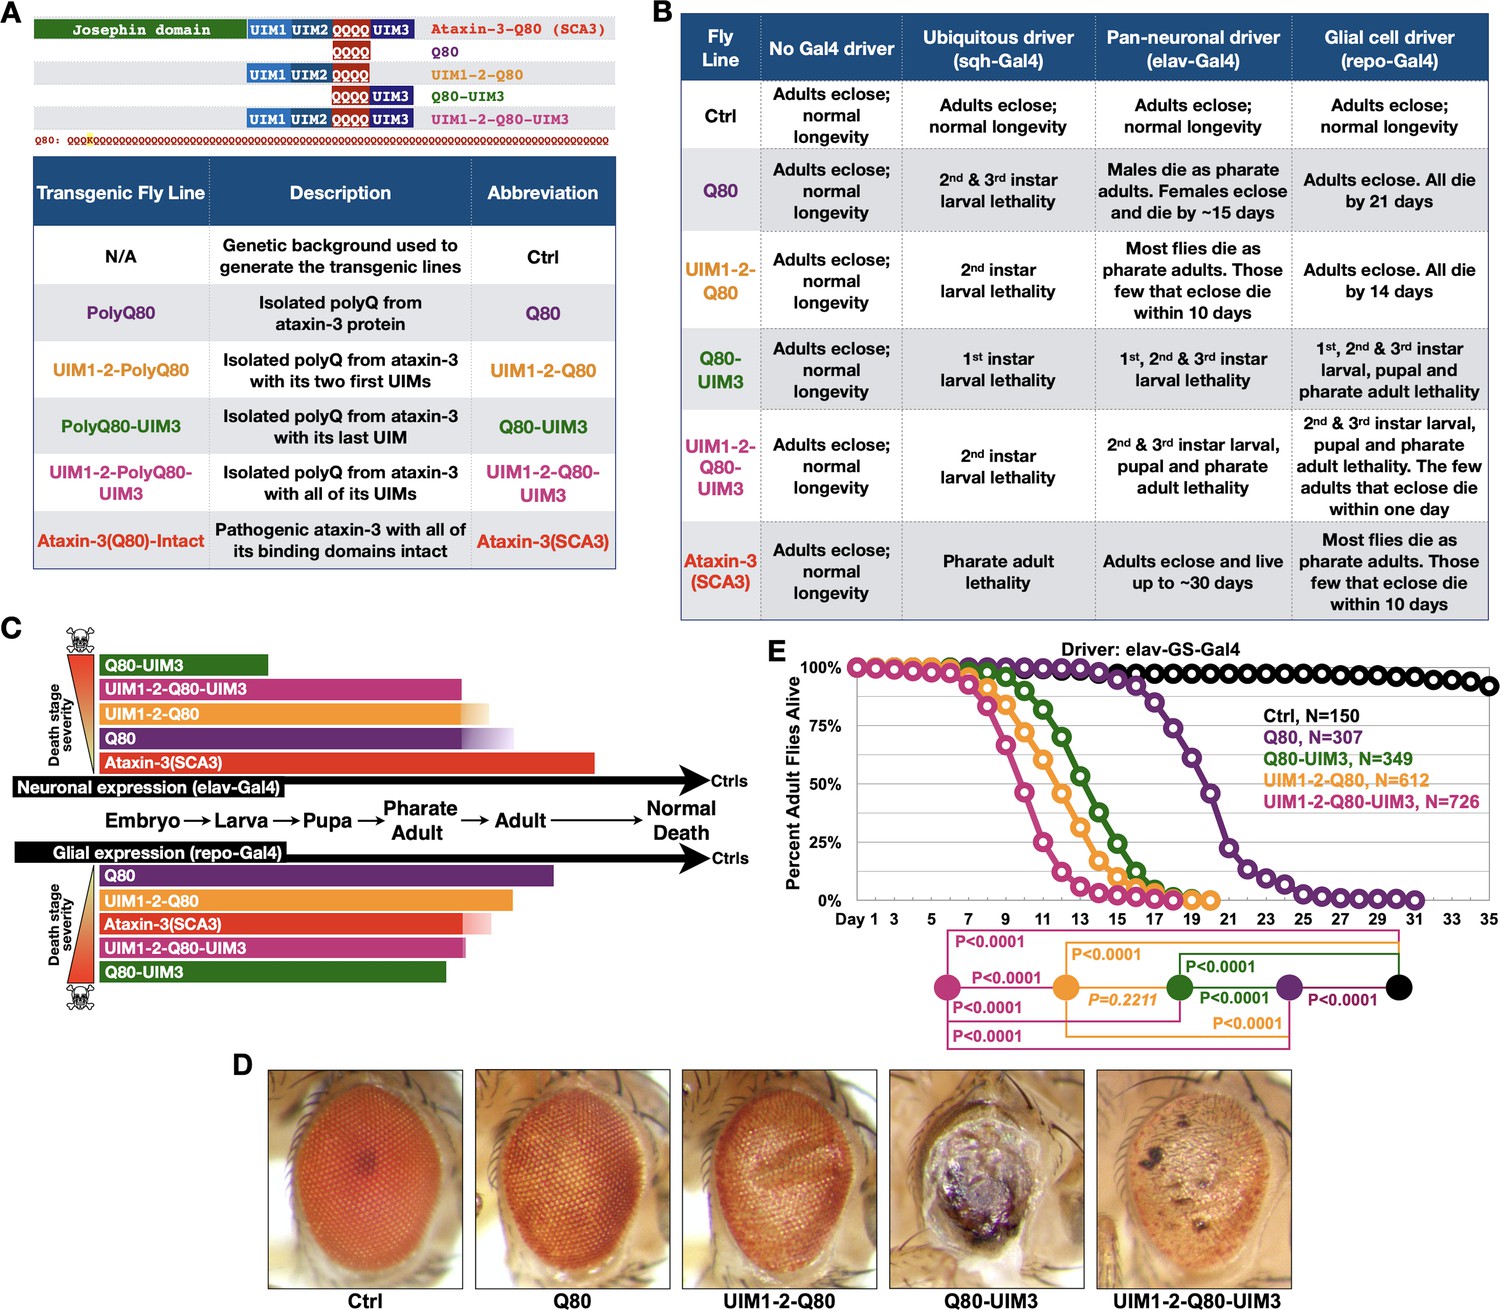
UIMs modulate toxicity of the isolated polyQ of ataxin-3.
(A) Diagram (top) and abbreviations (bottom) for transgenes used. The polyQ of ataxin-3 has a lysine interruption after the first three glutamines (QQQKQQQQ…), highlighted in yellow. (B) Summary of results when the noted transgenes are expressed in fly tissues. 1st, 2nd, and 3rd instars are progressive larval stages as flies develop from embryos to pupae. Results in table are representative of independent crosses conducted at least five times each. (C) Graphical summary of results from (B). Solid color denotes primary observations. (D) Photos of adult eyes expressing transgenes through GMR-Gal4. Photos are representative of independent crosses conducted at least five times. Protein levels are shown in Figure 2—figure supplement 1. (E) Longevity of flies expressing transgenes pan-neuronally in adults. P values: log-rank tests with Holm-Bonferroni adjustment. Italicized P value: not statistically significant.
-
Figure 2—source data 1
Data related to Figure 2 - Longevity results.
- https://cdn.elifesciences.org/articles/60742/elife-60742-fig2-data1-v2.xlsx
-
Figure 2—source data 2
Data related to Figure 2 - Uncropped images.
- https://cdn.elifesciences.org/articles/60742/elife-60742-fig2-data2-v2.pdf.zip
Figure 2—figure supplement 1
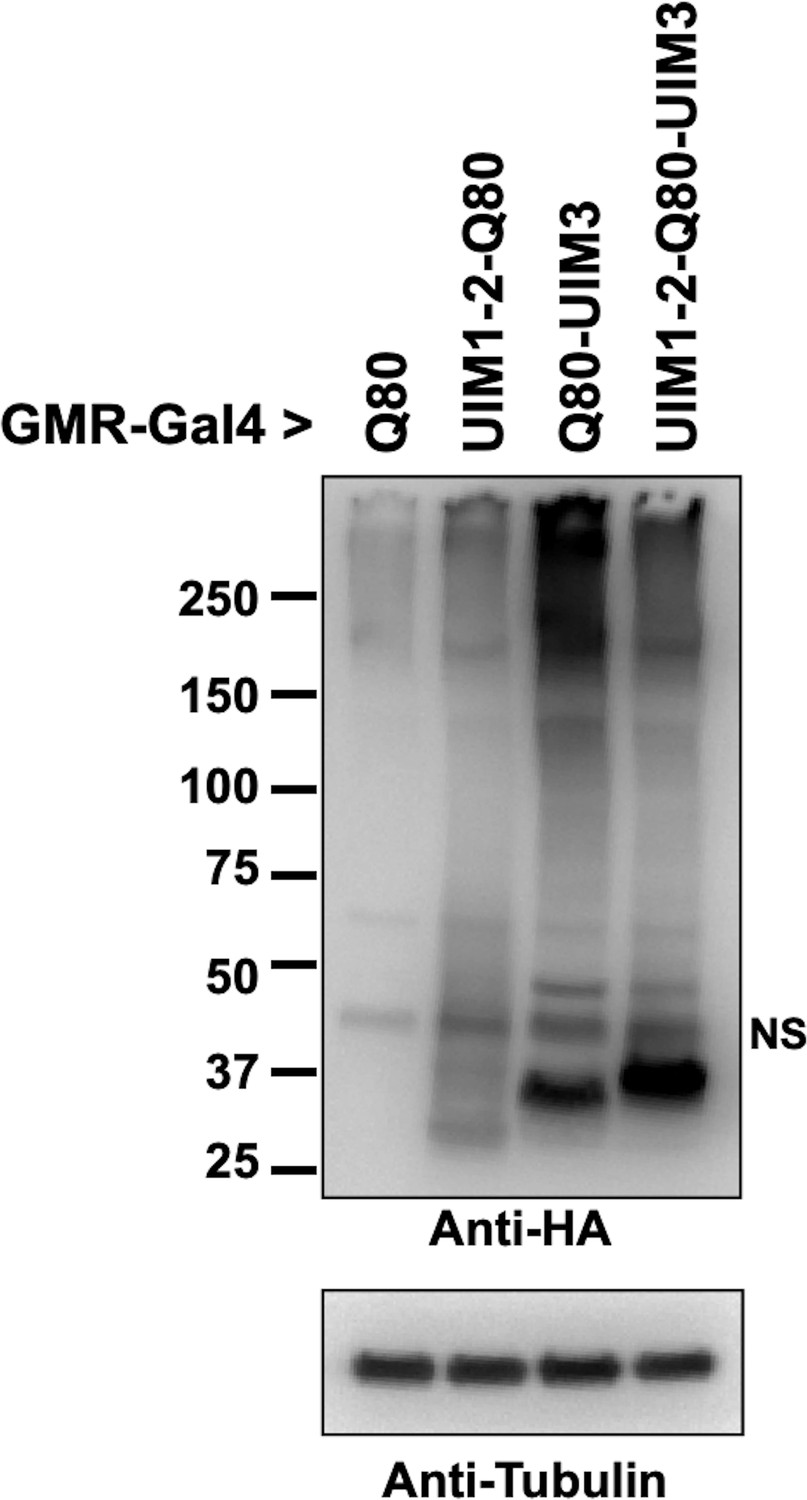
Levels of polyQ proteins, related to Figure 2D.
Western blots from lysates of whole, dissected fly heads; 25 heads per group. We caution here that the comparison of overall polyQ proteins is not precise, especially concerning polyQ80-UIM3, which leads to markedly severe eye degeneration. The reason for generating these truncated lines was to conduct an initial exploration of the role of UIMs on the isolated polyQ of ataxin-3. The main focus of this work is full-length ataxin-3 and the role of UIMs in its pathogenicity, explored in subsequent figures. Future work will dissect how individual UIMs impact various properties of the isolated polyQ80 in a tissue- and age-dependent manner.
Figure 3
Mutating the UIMs of full-length, pathogenic ataxin-3 decreases its toxicity.
(A) Amino acid sequence of full-length, pathogenic ataxin-3 and UIM mutations. (B) Summary of results when ataxin-3 flies, or non-expressing controls, are monitored during development and in adulthood. Results are representative of independent crosses conducted at least five times each. (C) Longevity of flies expressing transgenes pan-neuronally, throughout development and in adults. P value: log-rank test. (D) Negative geotaxis assays of adults expressing pathogenic ataxin-3 and their non-expressing controls. Shown are means -/+ SD. P values: two-tailed, Student’s t-tests comparing flies at each time point to their corresponding, non-expressing controls. We selected ‘two-tailed’ tests since we did not know how ‘UIM*’ would perform compared to ‘Ctrl’. If no P value is noted, it was equal to or greater than 0.05. Exact P values are given in other cases. The number of groups of flies tested per genotype was: Ctrl: 6, SCA3: 8, SCA3UIM*: 6. Repeats were biological replicates.
-
Figure 3—source data 1
Data related to Figure 3 - Longevity and motility results.
- https://cdn.elifesciences.org/articles/60742/elife-60742-fig3-data1-v2.xlsx
Figure 4

Mutating the UIMs of pathogenic ataxin-3 decreases its aggregation.
(A) Western blots from simple lysates of adults expressing transgenes pan-neuronally. Red arrows: likely proteolytic products of ataxin-3 that we observe sometimes. (B) Cytoplasmic/nuclear fractionation of lysates from adults expressing transgenes pan-neuronally. Histograms: quantification of images from the left and other, independent biological replicates. Means -/+ SD. P value: two-tailed Student’s t-test. Italicized P value denotes lack of statistical significance. The entire ataxin-3 signal in each lane was used for calculations, from the main band to the top. (C) Soluble/pellet centrifugation of lysates from adults expressing the noted transgenes. Histograms are from the left and other, independent biological repeats. Shown are means -/+ SD. P value: two-tailed, Student’s t-test. The entire ataxin-3 signal in each lane was used for calculations, from the main band to the top. (D) Filter-trap assay of lysates from adult flies expressing transgenes pan-neuronally. Each image is from an independent biological repeat. Histograms: quantification of images from left. Means -/+ SD. P value: two-tailed, Student’s t-test. Black arrows in panels: main ataxin-3 band. Blue arrows in panels: ubiquitinated ataxin-3. SDS-soluble and -resistant labels are based on prior work with ataxin-3 (Sutton et al., 2017; Tsou et al., 2015a; Johnson et al., 2019; Todi et al., 2009; Todi et al., 2010; Tsou et al., 2013).
-
Figure 4—source data 1
Data related to Figure 4 - Numerical data.
- https://cdn.elifesciences.org/articles/60742/elife-60742-fig4-data1-v2.xlsx
-
Figure 4—source data 2
Data related to Figure 4 - Uncropped images.
- https://cdn.elifesciences.org/articles/60742/elife-60742-fig4-data2-v2.pdf.zip
Figure 5
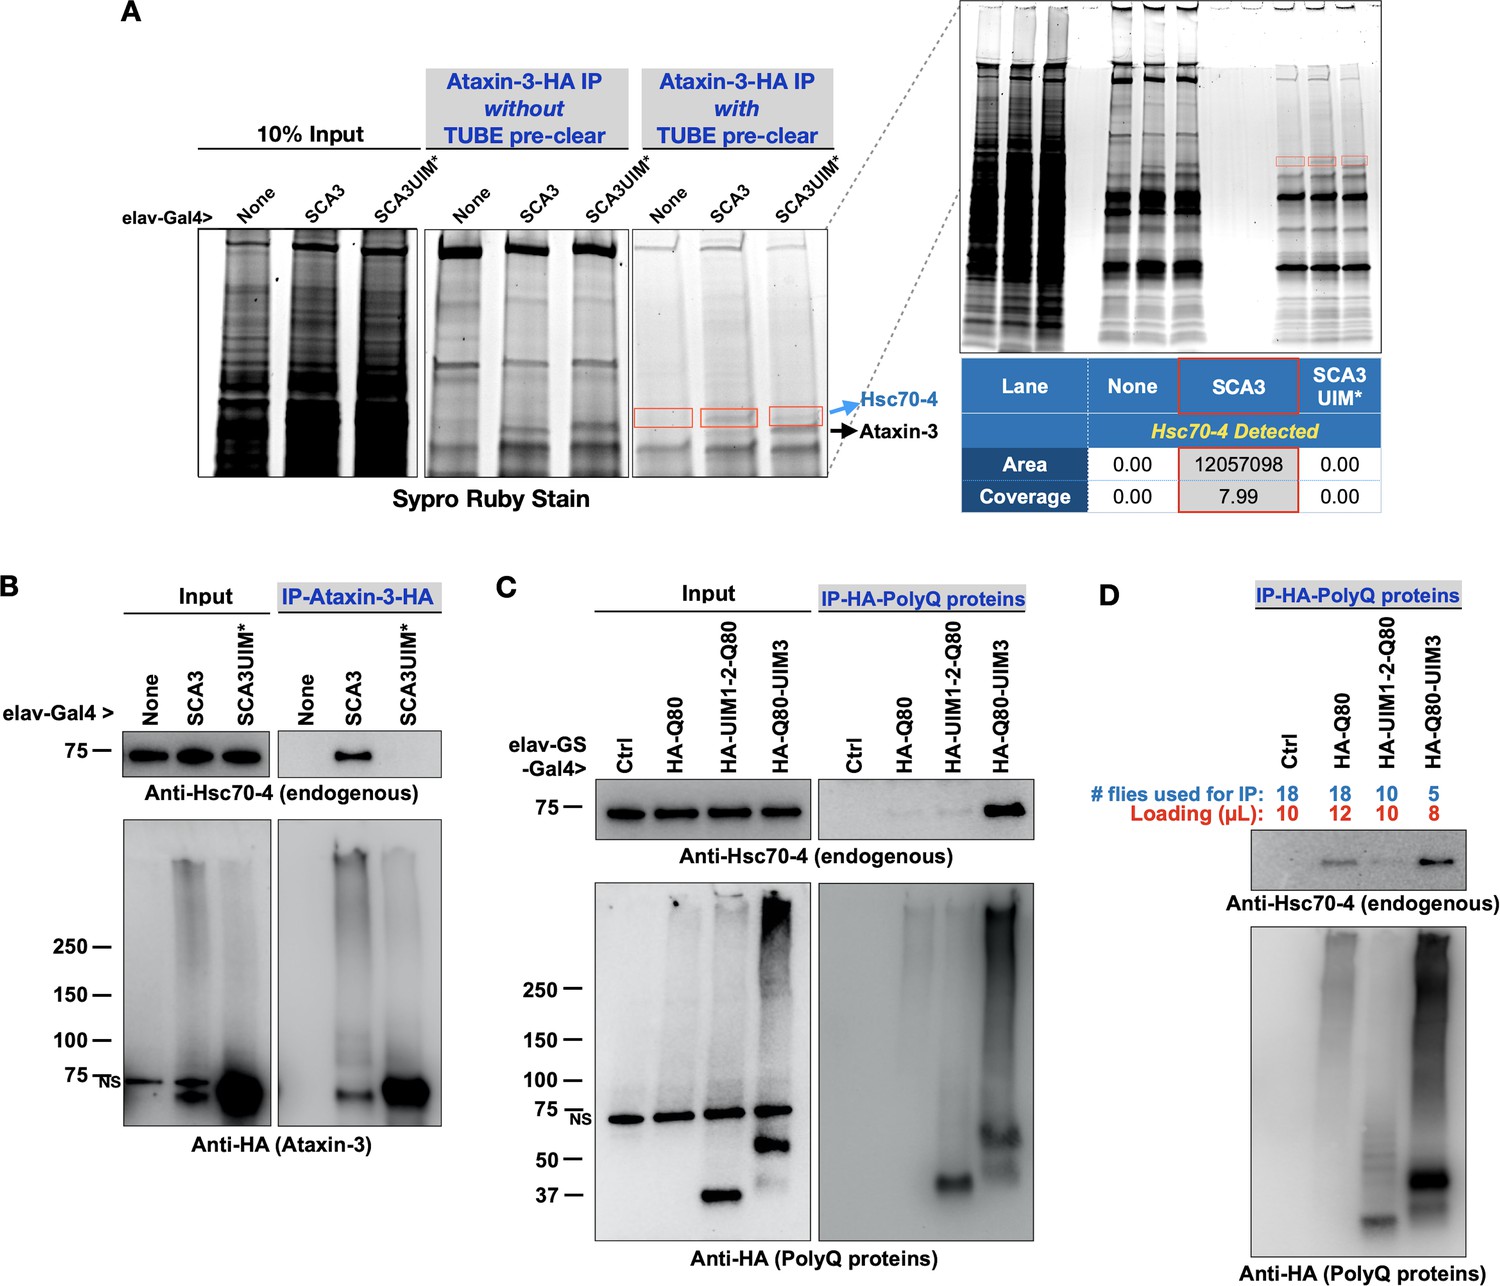
Pathogenic ataxin-3 interacts with Hsc70-4 in a UIM-dependent manner.
(A) SDS-PAGE gel stained for all proteins with Sypro Ruby. Boxed areas were excised and proteins were identified with LC/MS/MS. Two versions of immunopurifications (IPs) were conducted. Middle panel shows results from IP-ed ataxin-3 from whole fly lysates. Right panel shows results from IP-ed ataxin-3 after lysates were first incubated with tandem ubiquitin binding entities (TUBEs; see the main text and Materials and methods). (B–D) Western blots from anti-HA IPs from flies. Results are representative of independent biological replicates conducted three times. NS: non-specific.
-
Figure 5—source data 1
Data related to Figure 5 - Uncropped images.
- https://cdn.elifesciences.org/articles/60742/elife-60742-fig5-data1-v2.pdf.zip
Figure 6 with 1 supplement
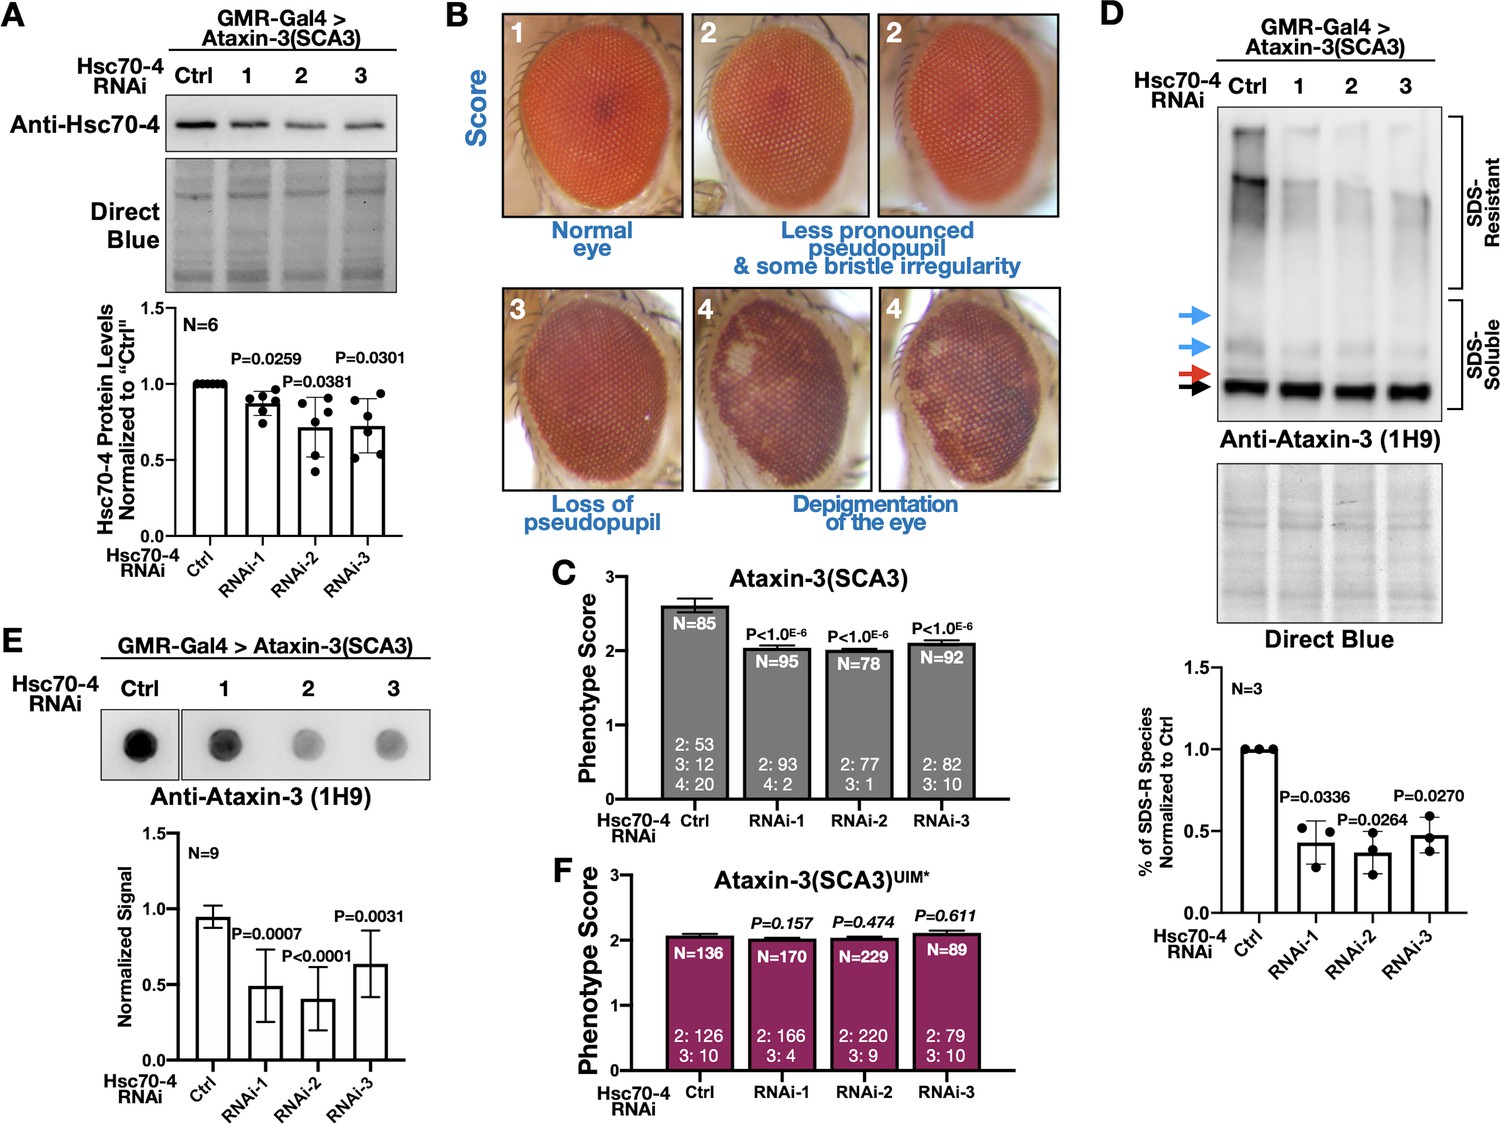
Hsc70-4 knockdown improves ataxin-3 toxicity in fly eyes.
(A) Western blots from dissected fly heads. Histograms are from blots on top and other, independent biological repeats. Shown are means -/+ SD. Statistics: one-way ANOVA with Dunnett's correction. Lysates were from crosses used for studies in panels (B), (C) and other, similar experimental setups. (B) Representative images and summary of the scoring system designed to evaluate the effect of Hsc70-4 knockdown on the phenotype caused by pathogenic ataxin-3 in fly eyes. 1: normal-looking eyes that have a clearly defined pseudopupil and good overall appearance; 2: eyes where the pseudopupil is not as clearly pronounced compared with normal eyes and with some minor unevenness/irregularity in peripheral bristle arrangement; 3: eyes where the pseudopupil is not visible; 4: eyes with depigmentation. Quantitative outcomes are shown in panels (C) intact, pathogenic ataxin-3 and (F) UIM-mutated, pathogenic ataxin-3. (C) Statistics: Kruskal-Wallis tests comparing Hsc70-4 RNAi to Ctrl from independent biological replicates when pathogenic ataxin-3 is expressed in fly eyes. Shown are means -/+ SEM. (D) Western blots from dissected fly heads. Quantifications are from panels above and independent biological repeats. Shown are means -/+ SD. P values: one-way ANOVA with Dunnett's correction. Black arrow: unmodified ataxin-3. Red arrow: potentially phosphorylated species that we observe infrequently. Blue arrows: ubiquitinated ataxin-3. (E) Filter-trap assays. P values: one-way ANOVA with Dunnett's correction. Shown are means -/+ SD. Images are from the same membrane, cropped and reorganized for clarity. Full lane is in Figure 6—figure supplement 1. (F) Quantification of eye scores as in panels (B) and (C). Shown are means -/+ SEM. ‘N's signify biological replicates. Italicized P values are not statistically significant. For panels (C) and (F), the numbers at the bottom of each histogram show the number of flies in each scoring category for that group.
-
Figure 6—source data 1
Data related to Figure 6 - Numerical data.
- https://cdn.elifesciences.org/articles/60742/elife-60742-fig6-data1-v2.xlsx
-
Figure 6—source data 2
Data related to Figure 6 - Uncropped images.
- https://cdn.elifesciences.org/articles/60742/elife-60742-fig6-data2-v2.pdf.zip
Figure 6—figure supplement 1
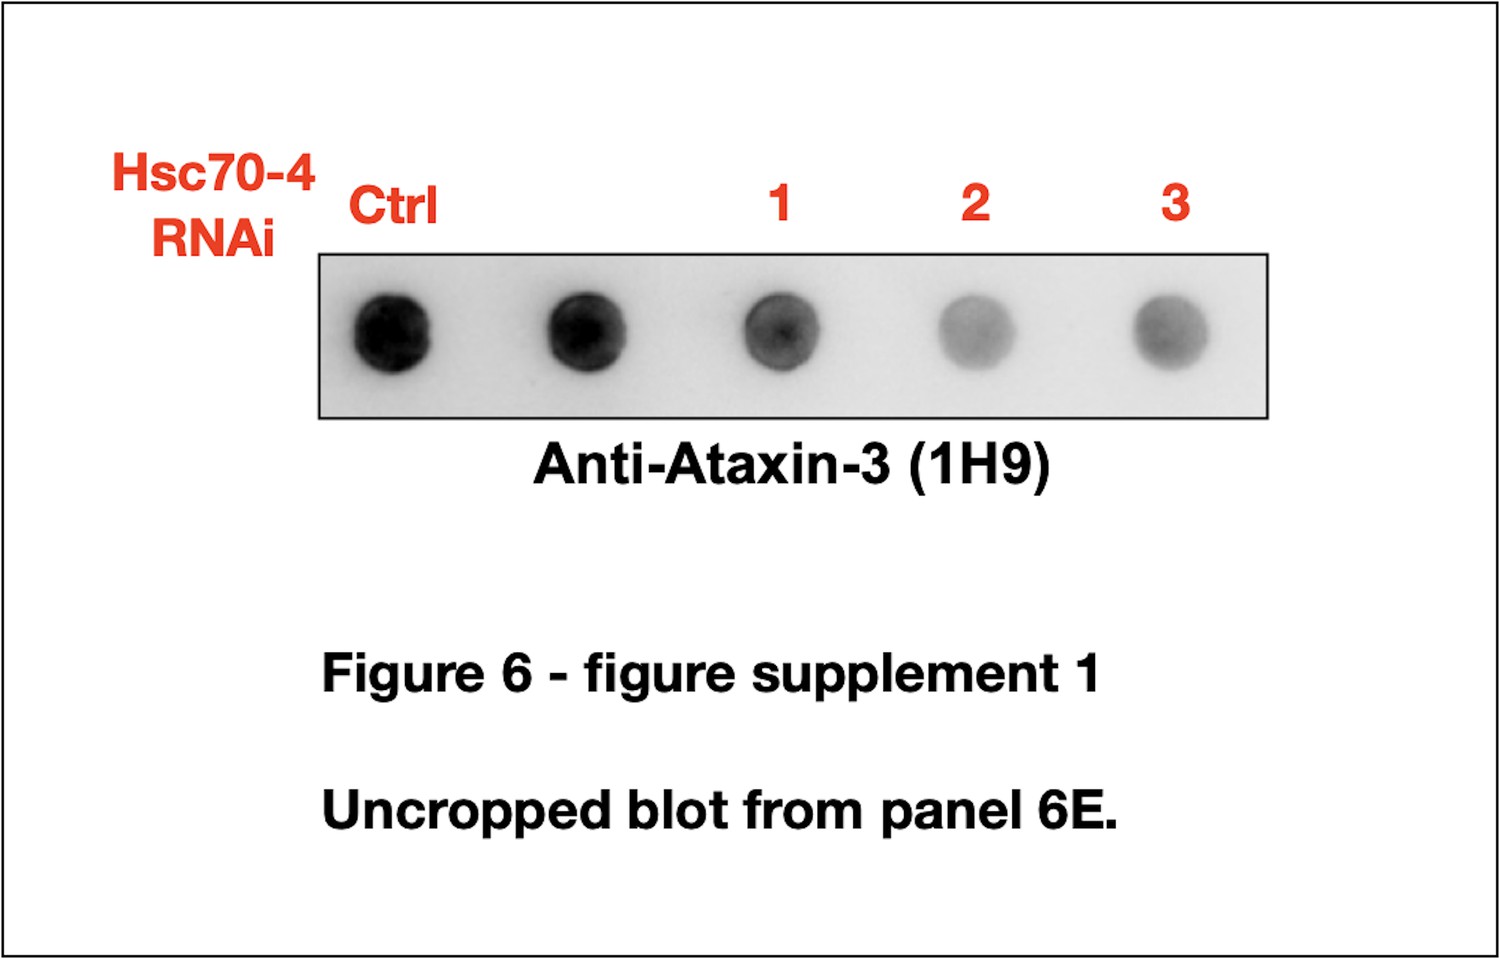
Uncropped blot from panel 6E.
Figure 7
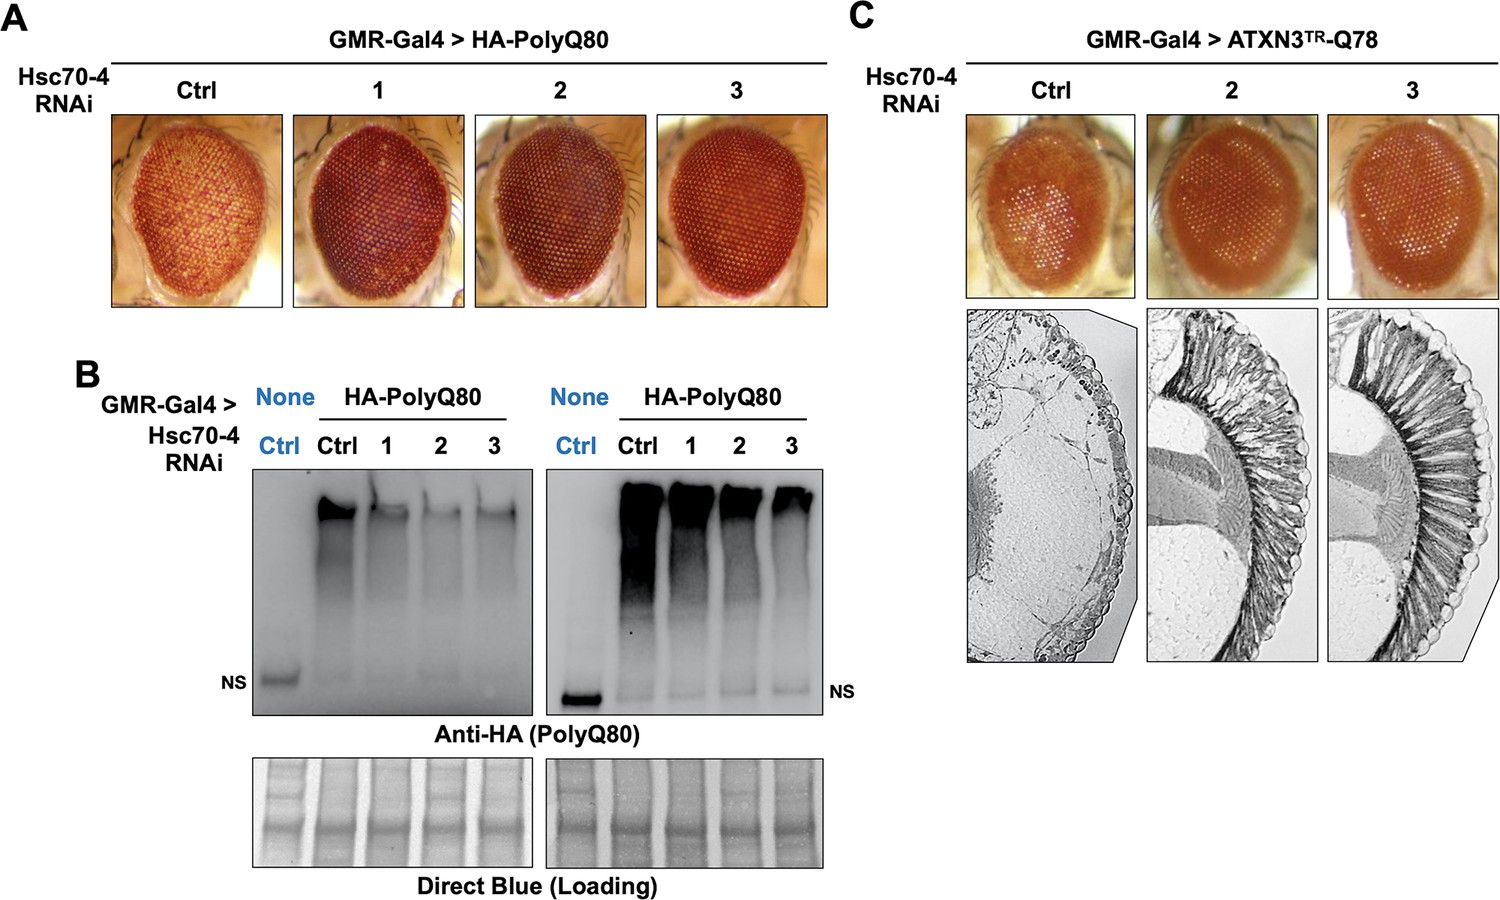
Hsc70-4 knockdown improves toxicity from independent, truncated polyQ models.
Representative images of fly eyes (A, C) and fly eye sections (C) with the noted genotypes. Photos are representative of results from three independent sets of crosses. (B) Western blots from dissected heads. Results from two independent biological repeats are shown. ‘Ctrl’ in blue font did not express polyQ80. NS: non-specific.
-
Figure 7—source data 1
Data related to Figure 7 - Uncropped images.
- https://cdn.elifesciences.org/articles/60742/elife-60742-fig7-data1-v2.pdf.zip
Figure 8
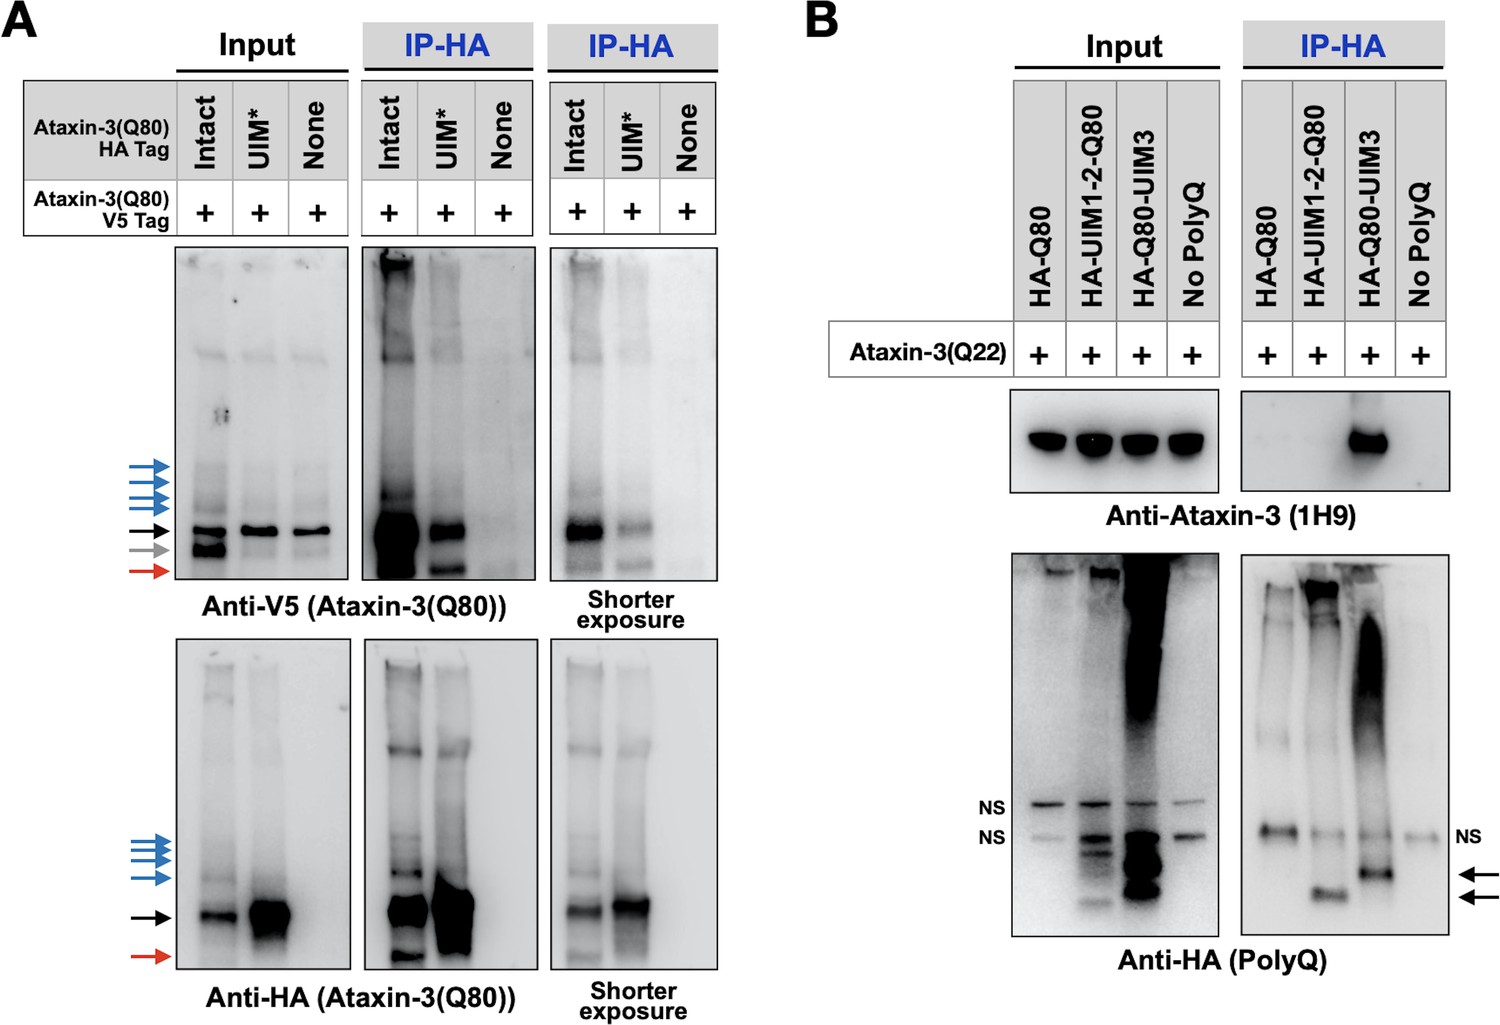
UIMs are important for inter-ataxin-3 interactions.
(A, B) Western blots from IPs of ataxin-3 with expanded (A) or wild-type (B) polyQ repeats expressed in fly eyes. All transgenes (HA- or V5-tagged) were expressed at the same time and in the same tissues. Gray arrow: V5-positive signal absent in IP lanes. Red arrows: likely proteolytic fragments. Black arrows: unmodified proteins. Blue arrows: ubiquitinated ataxin-3. NS: non-specific. Images are representative of independent biological experiments conducted thrice.
-
Figure 8—source data 1
Data related to Figure 8 - Uncropped images.
- https://cdn.elifesciences.org/articles/60742/elife-60742-fig8-data1-v2.pdf.zip
Figure 9 with 1 supplement
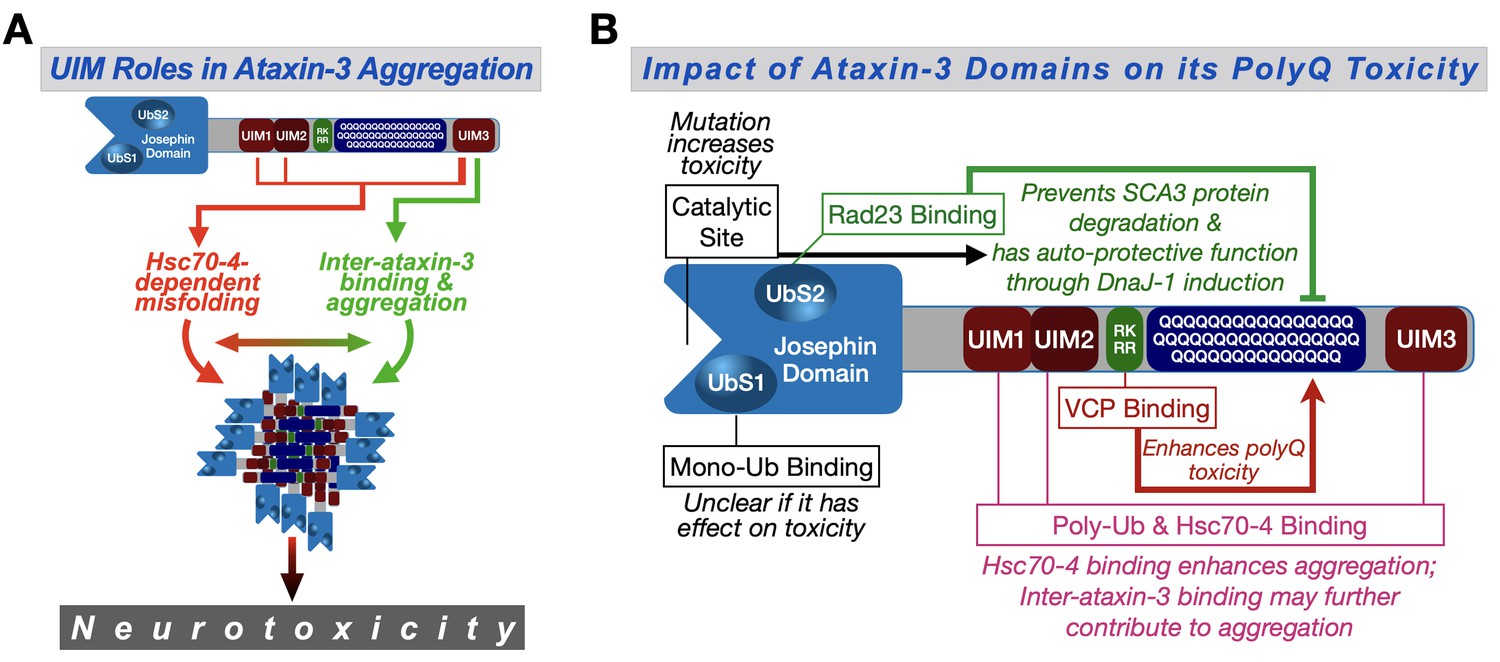
Proposed model.
(A) Ataxin-3 UIMs enable its interaction with Hsc70-4 and other ataxin-3 proteins, both of which enhance aggregation and toxicity. UIM3 (thicker lines) appears to be a stronger contributor to these interactions than the other UIMs (thinner lines). (B) Summary of results from the current study and our prior publications on the effect of ataxin-3 domains on its polyQ toxicity (Blount et al., 2014; Ristic et al., 2018; Sutton et al., 2017; Tsou et al., 2015a; Johnson et al., 2019). Ub: ubiquitin.
Figure 9—figure supplement 1
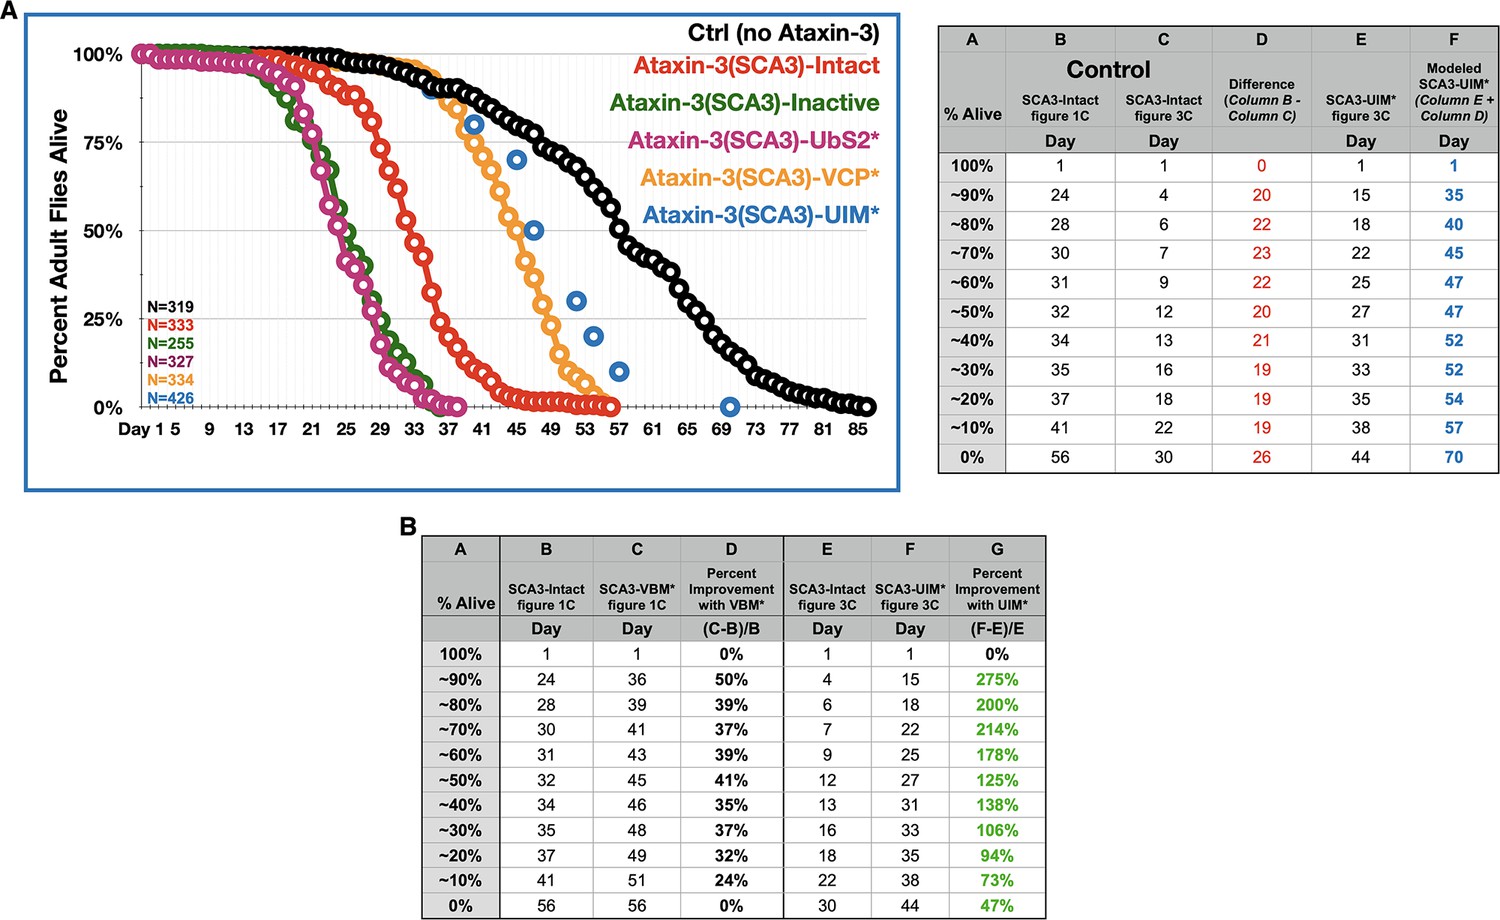
Relative importance of UIMs on fly longevity.
(A) Longevity curves of adult flies expressing the denoted transgenes pan-neuronally. Continuous curves are the same as in Figure 1C; X-axis is extended to 86 days to show the full longevity of control flies. Blue dots are ‘approximated longevity’ of flies expressing pathogenic ataxin-3 with mutated UIMs, based on data from Figure 3C. The UIM* flies are isogenic to the polyQ truncation transgenes and the full-length ataxin-3 transgene used in Figures 2–8; therefore, the UIM* flies cannot be directly compared to the lines used for Figure 1, since the Kozak sequence is different; also, the polyQ is encoded by a 'CAGCAA' repeat for flies used in Figures 2–8, compared to a pure 'CAG' for flies in Figure 1. Lines in Figure 1 are all isogenic to each-other. Calculations for the rough estimation are on the table on the right. (B) Another measure of improvement in fly longevity when the VBM or the UIMs are mutated, compared to their respective, isogenic ‘Intact’ controls. Columns D and G show percent improvement in longevity for flies expressing VBM-mutated ataxin-3 compared to their own isogenic ‘Intact’ (column D; data from Figure 1) and flies expressing UIM-mutated ataxin-3 compared to their own isogenic ‘Intact’ (column G; data from Figure 3). Green font indicates that UIM* flies showed more improvement than VBM* ones.
Additional files
Download links
A two-part list of links to download the article, or parts of the article, in various formats.
Downloads (link to download the article as PDF)
Open citations (links to open the citations from this article in various online reference manager services)
Cite this article (links to download the citations from this article in formats compatible with various reference manager tools)
Ubiquitin-interacting motifs of ataxin-3 regulate its polyglutamine toxicity through Hsc70-4-dependent aggregation
eLife 9:e60742.
https://doi.org/10.7554/eLife.60742


