Non-canonical role for Lpar1-EGFP subplate neurons in early postnatal mouse somatosensory cortex
- Department of Physiology, Anatomy and Genetics, Sherrington Building, University of Oxford, United Kingdom
- Department of Neuroscience, University of Minnesota, United States
Figures
Figure 1

Intrinsic electrophysiological properties of Lpar1-EGFP SPNs.
(a) Streptavidin (568 nm) labelling of record Lpar1-EGFP SPNs in mouse S1BF at P2. (b) Superimposed electrophysiology traces recorded from one of the cells shown in (a) in response to hyperpolarising and depolarising threshold current injection. (c) Maximum firing frequency for the same cell; scale bar is the same for (b) and (c). (d–i) Summary data for 103 cells grouped according to age: P1–2 (n = 22); P3–4 (n = 27); P5–6 (n = 24); P7–8 (n = 30). The range of passive membrane properties recorded included (d) resting membrane potential (RMP) (mV); (e) Input resistance (RIN) (GΩ); (f) membrane time constant (tau) (ms). Active properties included (g) current injection required for threshold spike (rheobase) (mV); (h) spike amplitude (mV); (i) maximum firing frequency (Hz). We observed a statistically significant difference between age groups for RIN (ANOVA, F = 21.17, p<0.001), decay time constant (Kruskal–Wallis test, KW = 37.75, p<0.001), rheobase (Kruskal–Wallis test, KW = 15.74, p<0.01), spike amplitude (ANOVA, F = 22.05, p<0.001), and maximum firing frequency (Kruskal–Wallis test, KW = 43.15, p<0.001), whereas no statistical significant difference was observed for resting membrane potential (ANOVA, F = 1.74, p>0.05). Significant multiple comparisons of note are indicted in the relevant panels: *0.01<p<0.05; **p<0.01.
Figure 2
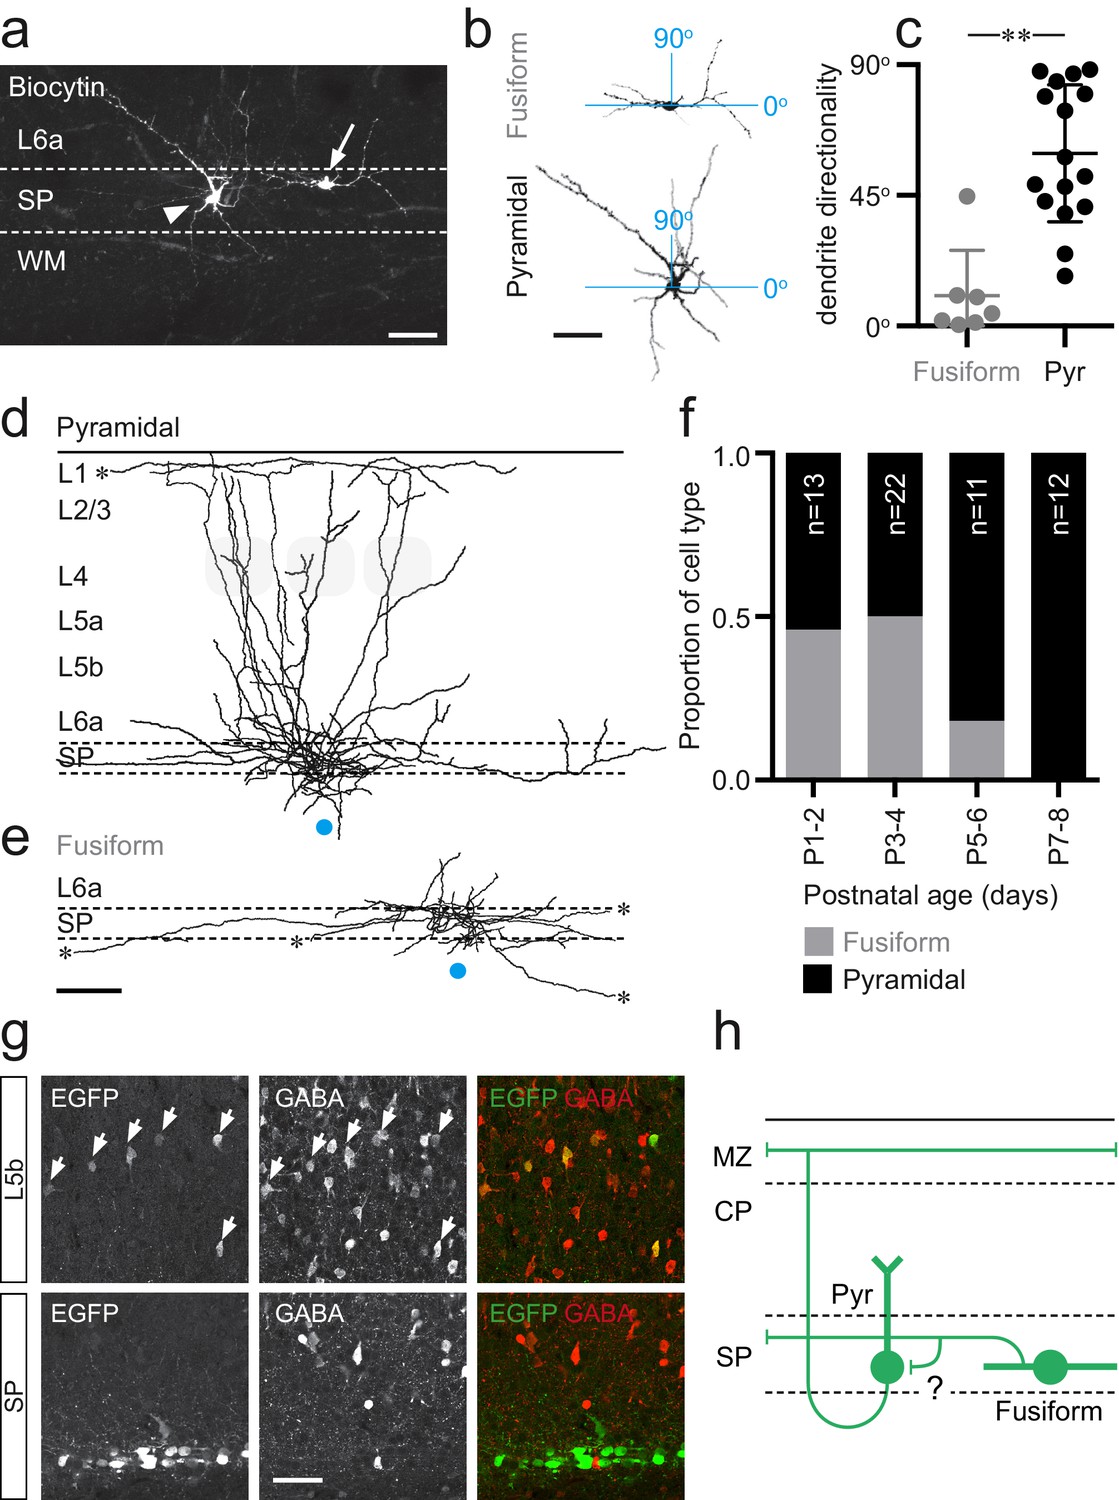
Two distinct morphologies of Lpar1-EGFP SPNs in S1BF.
(a) Streptavidin labeled morphologies of 2 EGFP+ SPNs recorded at P3; arrowhead, pyramidal subtypes with apical dendrite projecting at ~45° into L6a; arrow, fusiform morphology with horizontal, bitufted dendrites largely restricted to the SP (scale bar = 25 μm). (b) Reconstructed (ImageJ) dendritic arbors of the cells shown in (a) were used to calculate directionality with 90° indicative of vertically orientated dendrites and ~0° primarily horizontal dendrites (scale bar = 25 μm). (c) A difference was observed in the dendritic orientation of fusiform and pyramidal SPNs (Mann–Whitney U = 5, fusiform n = 7, median = 4.38; pyramidal n = 12, median = 54.89, **p<0.001 two-tailed). Overlay of axonal arbors of (d) pyramidal (recovered between P1 and P8) and (e) fusiform (recovered P1and P5) cells aligned on soma location (horizontal position indicated by the blue circle); approximate barrel location indicated by grey-shaded areas for P5+ cells; scale bar = 180 μm. (f) Proportion of fusiform (grey) and pyramidal (black) Lpar1-EGFP SPNs over the first postnatal week. (g) Immunohistochemistry for EGFP (left) and GABA (middle); EGFP+/GABA+ cells indicated by the white arrows; right panel, overlay of EGFP (green) and GABA (red). (h) Schematic of the two morphological subtypes of Lpar1-EGFP SPN: pyramidal (Pyr) and fusiform SPNs encountered prior to P5; a putative synaptic connection between the two subtypes is indicated by the question mark. MZ, marginal zone; CP, cortical plate; SP, suplate.
Figure 3

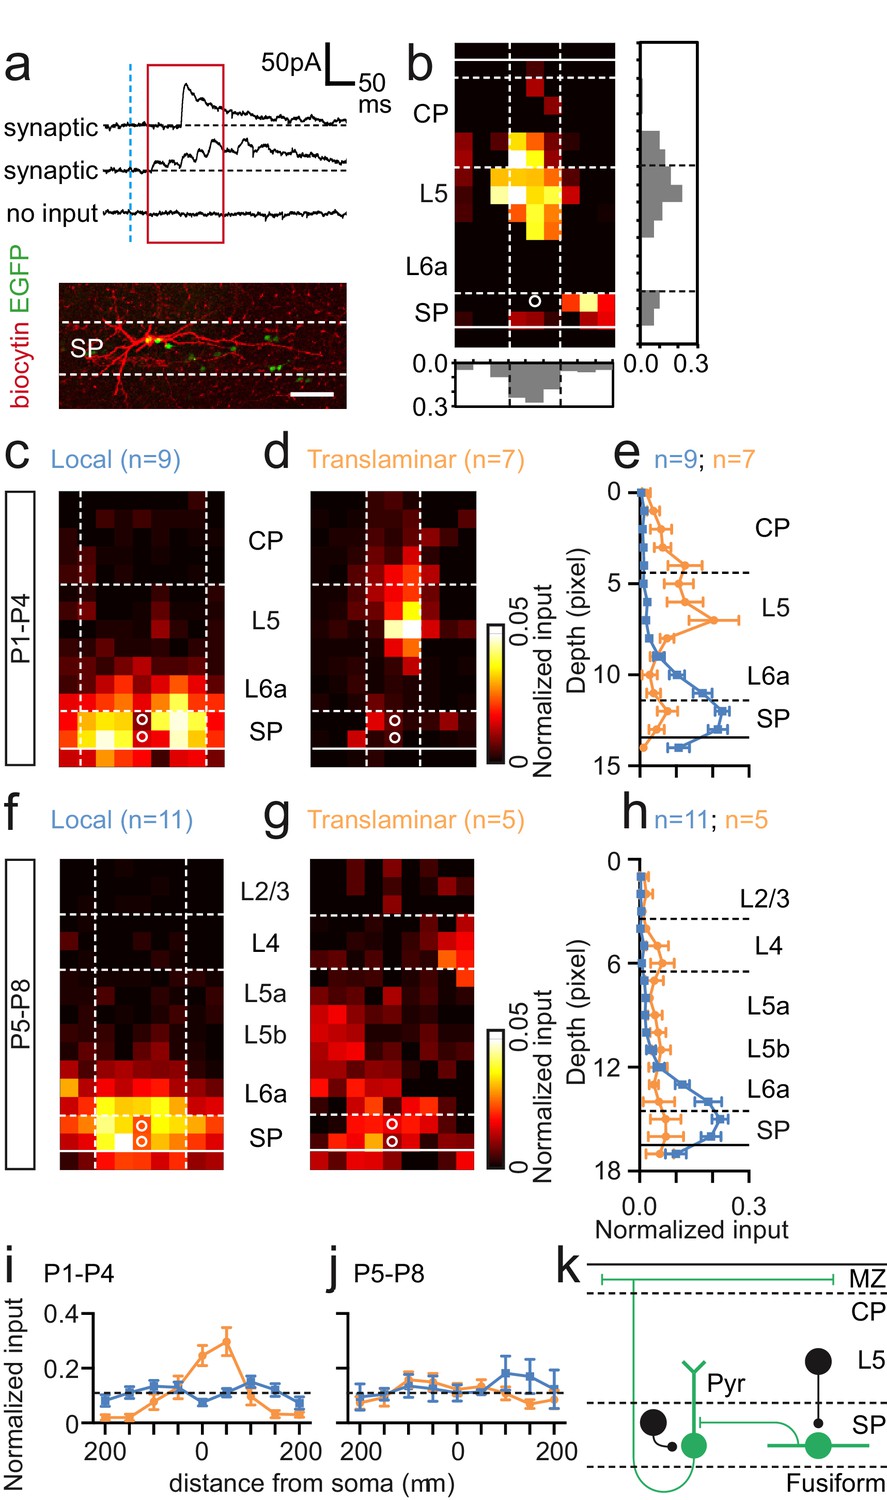
Synaptic integration of Lpar1-EGFP SPNs into the local cortical glutamatergic network.
(a) LSPS of caged glutamate resulted in three responses observed in whole cell patch-clamp recordings of SPNs: top traces, large amplitude direct responses with onset locked to laser pulse onset (dashed vertical blue line); middle traces, synaptic response of consistent excitatory postsynaptic currents (EPSCs) within the monosynaptic event window (red box); bottom traces, no consistent response with occasional spontaneous EPSCs. Scale bar for direct traces: 50 pA; for synaptic and spontaneous: 25 pA. (b) Local (left) and translaminar (right) glutamatergic input maps for SPNs recorded at P1-2. Pixel size: 50 µm. (c) Average input profile for local (blue) and translaminar (orange) SPNs; translaminar SPNs showed increased input from the cortical plate (CP) and reduced local (L6a/SP) innervation. (d) Left panel, average input map for translaminar SPNs recorded at P3–4 (n=6); right panel, average input profile for local (blue) and translaminar (orange) SPNs. (e) Corresponding input profile for P5–6. (f) Average input map and profile for SPNs recorded between P7 and P8. Horizontal profile for local and translaminar SPNs aligned on cell soma at (g) P1-P4 and (h) P5–8. Horizontal axis indicates the lateral distance from the soma. (i) Schematic showing glutamatergic circuit onto Lpar1-EGFP SPNs.
Figure 4
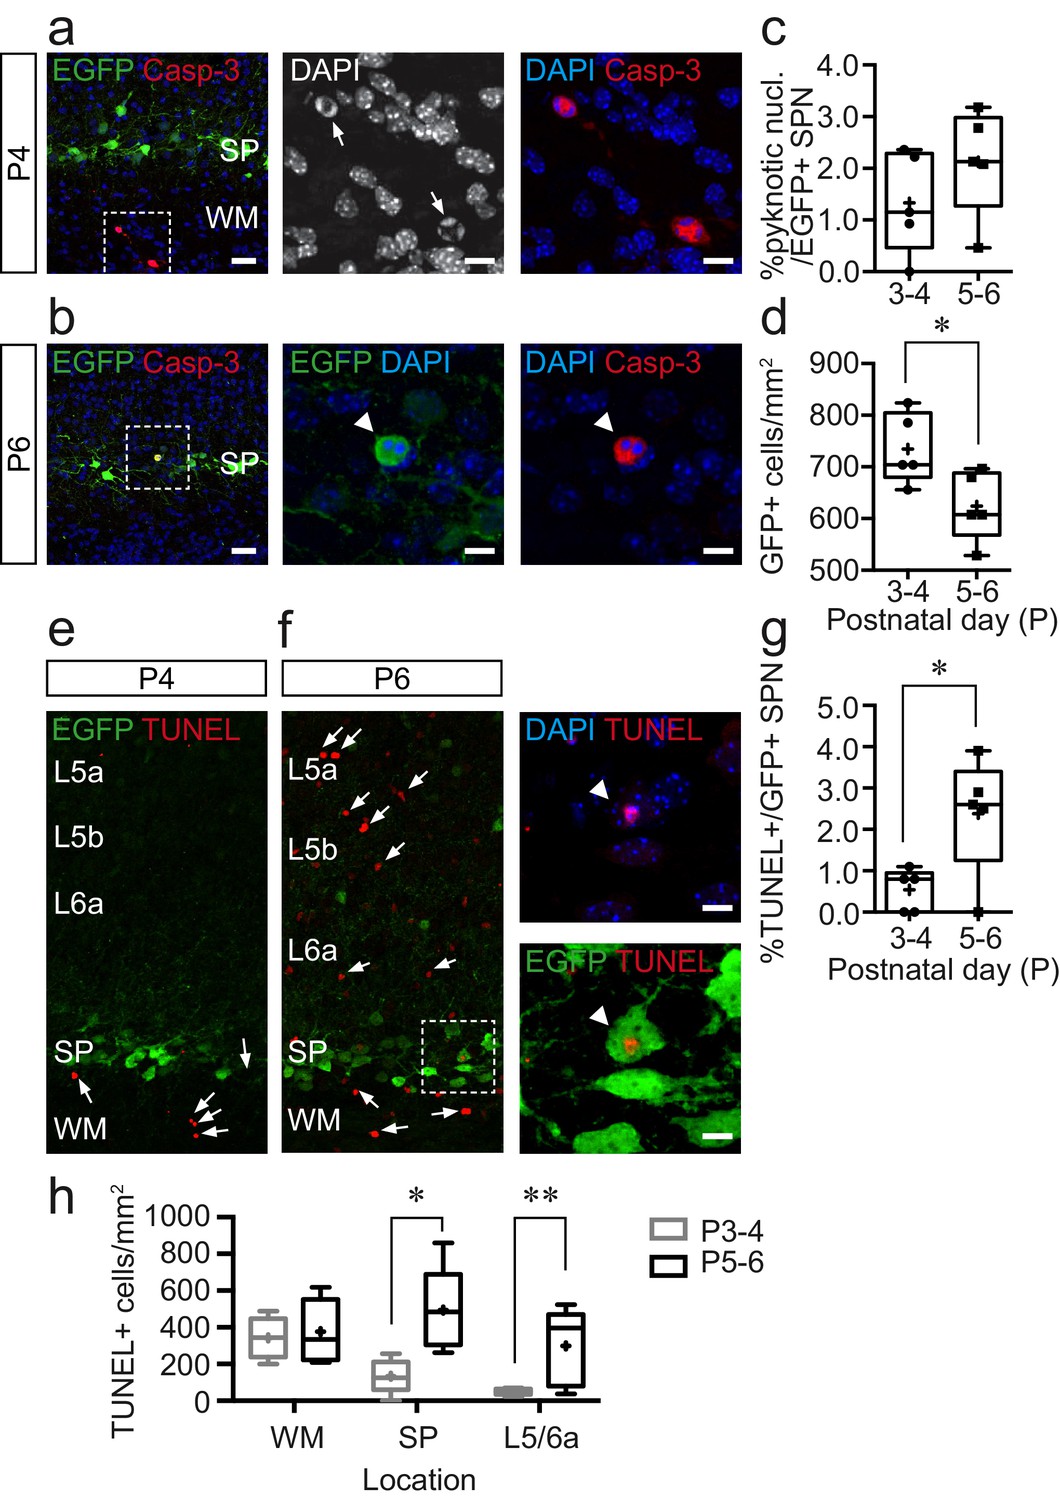
Cell death increases during the postnatal day (P)5–6 window but is not confined to the subplate.
(a) Immunohistochemistry for cleaved Caspase-3 (Casp-3) and EGFP in subplate (SP) at P4; scale bar: 25 μm. Left, Casp-3+ cells in the white matter. The area bounded by the white dashed line is shown at higher magnification in the centre and right panels with Casp-3+ cells with pyknotic nuclei identified with white arrows in the centre panel; scale bar: 9 μm. (b) Similar data obtained at P6 but with white arrowhead pointing to EGFP+, Casp-3+ Lpar1-EGFP SPN with pyknotic nucleus. (c) Summary data for percentage Lpar1-EGFP SPNs exhibiting pyknotic nuclei at postnatal day (P)3–4 (n = 5 animals) and P5–6 (n = 5). (d) Plot showing the density of EGFP+ cells in SP at P3–4 (n = 5) and P5–6 (n = 5); asterisks, p=0.0327 (two-tailed t-test; t = 2.579, df = 8). (e,f) TUNEL staining at (e) P4 and (f) P6 with TUNEL+ cells indicated with white arrows. The area identified by the white dashed box is shown expanded in (f) in the right panels; the white arrowhead identifying a TUNEL+ Lpar1-EGFP SPN; scale bar: 8 µm. (g) Plot of percentage TUNEL+ Lpar1-EGFP SPNs at P3-4 and P5-6; asterisks, p=0.0274 (two-tailed t-test; t = 2.693, df = 8). (h) Density of TUNEL+ cells in the white matter (WM), subplate (SP), and adjacent L5/L6a across both timepoints; single asterisk, p=0.028; double asterisk, p=0.011.
Figure 5
GABAergic input onto Lpar1-EGFP SPNs in the first postnatal week.
(a) Top, synaptic and no input response observed in whole-cell patch-clamp recordings of SPN voltage clamped at the approximate reversal potential for glutamate (EGlut). Bottom, recovered fusiform morphology of the SPN with translaminar GABAergic input map shown in (b). (c–e) GABAergic input onto SPNs recorded from P1–4. Average input maps for (c) local and (d) translaminar SPNs with profile shown in (e). (f–h) Corresponding data for SPNs recorded between P5 and P8. (i, j) Columnar analysis of GABAergic input on SPNs at (i) P1–4 and (j) P5–8. (k) Schematic of GABAergic input onto fusiform and pyramidal (Pyr) SPNs present from P1 to P4.
Figure 6
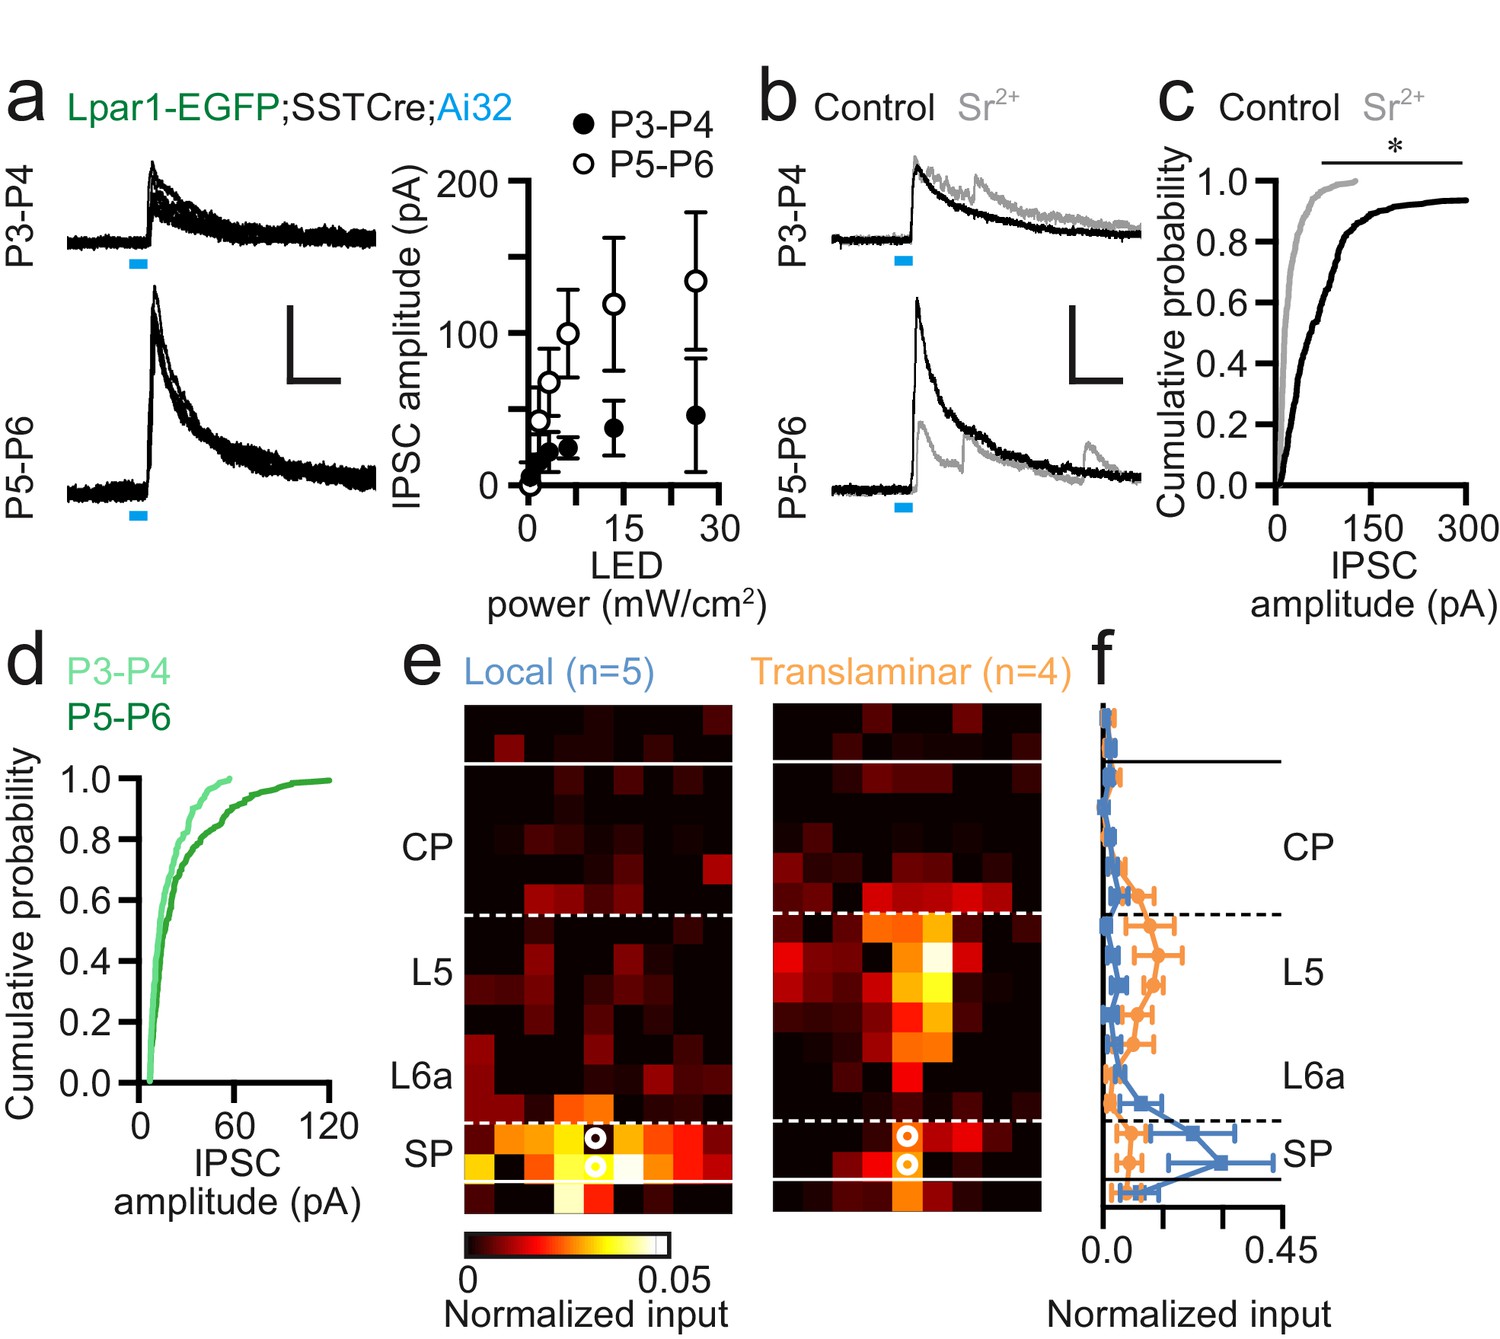
Somatostatin-positive (SST+) interneurons innervate Lpar1-EGFP SPNs during early postnatal life.
(a) Widefield 473 nm blue light stimulation evoked IPSCs in SPNs at both P3–4 (n = 7) and P5–6 (n = 6) following conditional expression of Channelrhodopsin2 (ChR2) in SST+ interneurons. LED indicated by the blue line. (b) Incubation in Sr2+-containing ACSF resulted in asynchronous neurotransmitter release. (c) Cumulative probability plot of ChR2-evoked IPSC amplitude for control (black line; n = 13) versus Sr2+-containing high-divalent cation (HDC) ACSF (grey; n = 7) across P3–6; asterisk: two-sample Kolmogorov-Smirnov test: p≤0.01. (d) Comparison of early (P3–4; n=3) versus late (P5–6; n=4) IPSC amplitude in the presence of Sr2+-containing HDC ACSF. (e) Local and translaminar SST+ interneuron input maps onto SPNs revealed through LSPS uncaging of ATP in conjunction with conditional expression of P2x2 receptor in SST+ interneurons. (f) Local (blue) and translaminar (orange) average layer profiles for SST+ input onto SPNs.
Figure 7
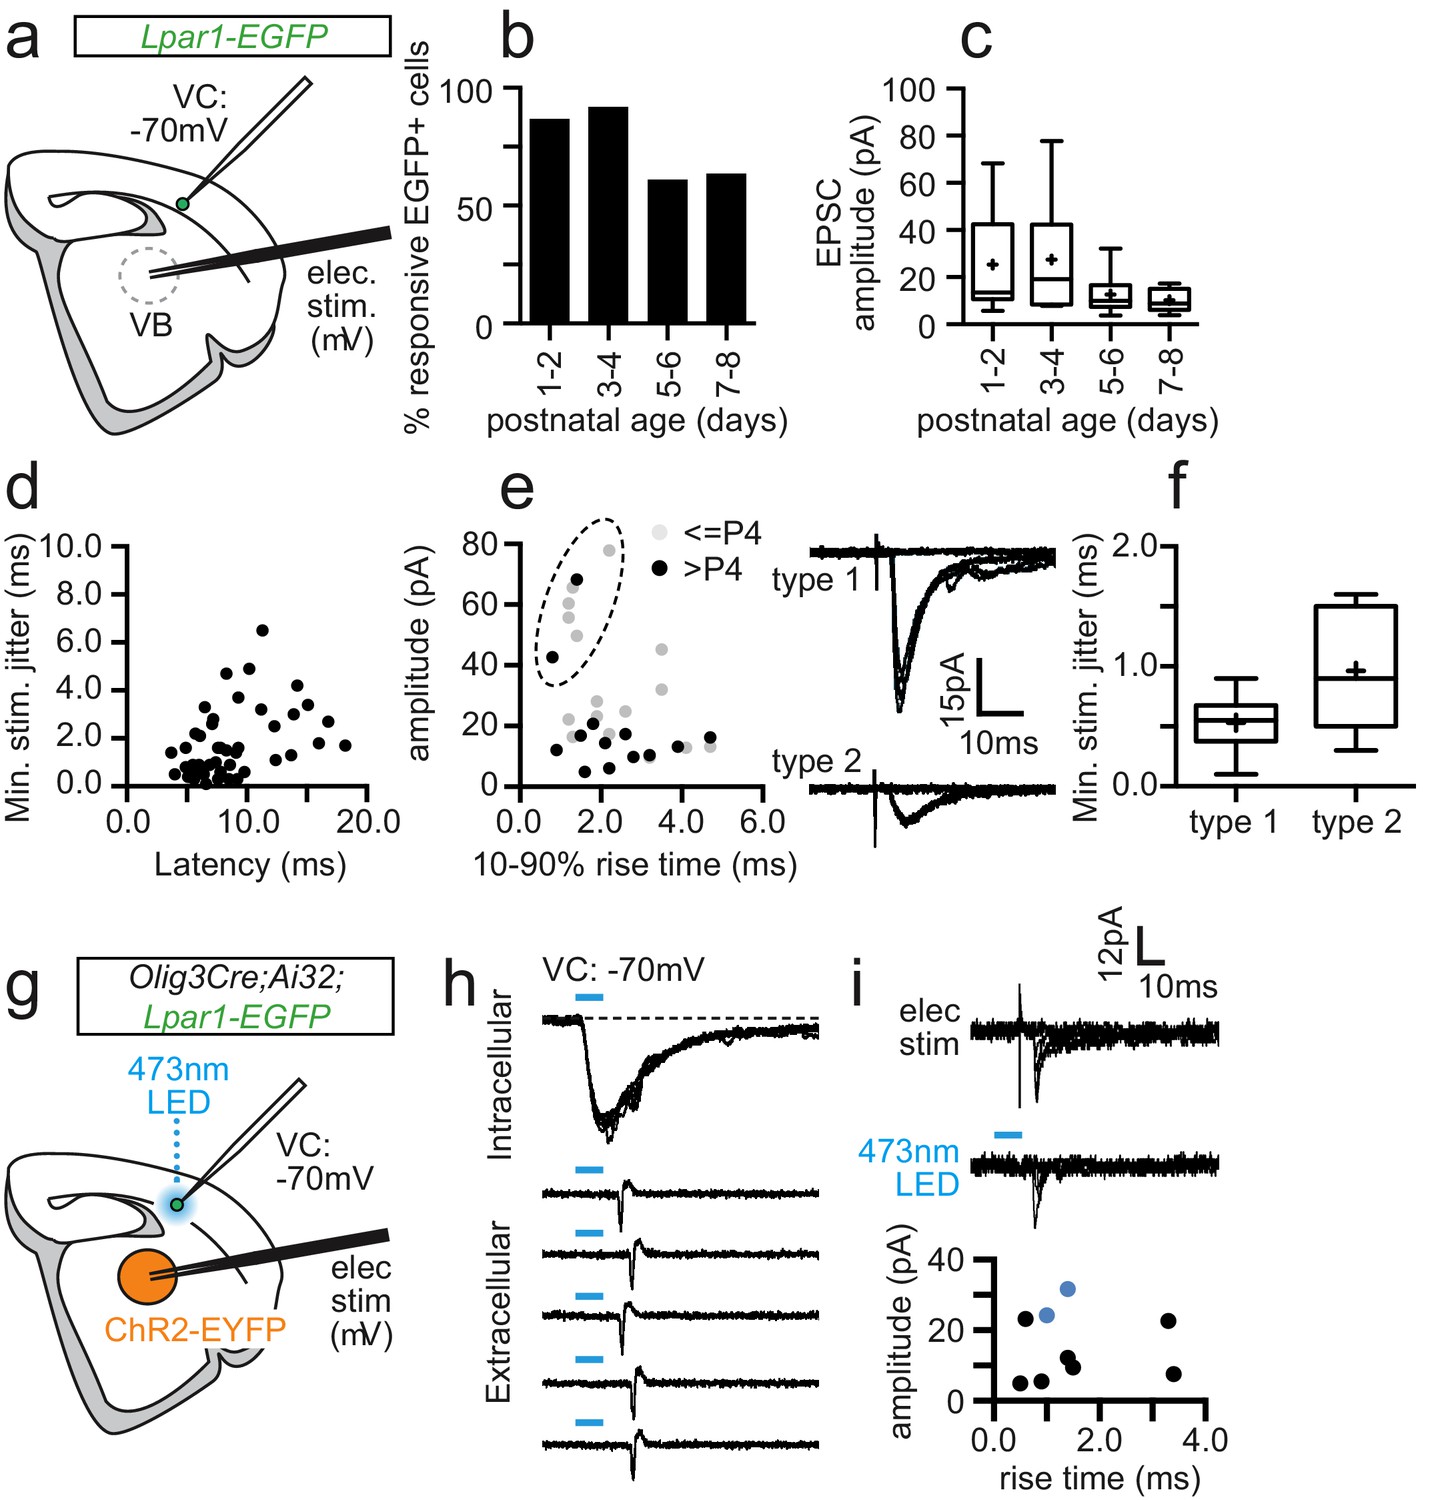
Sparse thalamic afferent input onto Lpar1-EGFP SPNs in postnatal S1BF.
(a) Schematic showing the experimental set-up for recording electrical stimulation-evoked TC-EPSCs in thalamocortical slices. (b) Percentage EGFP+ SPNs exhibiting constant latency synaptic response to minimal electrical stimulation over development. (c) Box plot showing the average amplitude for EPSCs. (d) Plot of jitter (standard deviation of onset EPSC) versus average latency for all the responses shown in (b, c). Putative TC-ESPCs had latency ≤ 10 ms and jitter ≤ 1 ms. (e) Plot of average EPSC amplitude (pA) versus 10–90% rise time for all putative TC-EPSCs. Dashed circle, cluster of type 1 TC-EPSCs (top, right trace) versus type 2 (bottom trace); K-means cluster analysis (median silhouette values): K = 2; Sil = 0.89 ± 0.00; K = 3; Sil = 0.74 ± 0.04; K = 4; Sil = 0.75 ± 0.05; K = 5; Sil = 0.71 ± 0.04. (f) Box plot of average jitter for type 1 and type 2 EPSCs. (g) Schematic showing the experimental set-up for combined electrical and optogenetic stimulation of thalamic afferents. (h) (top panel) Blue light reliably evoked inward currents in thalamic relay neurons following Olig3 Cre conditional expression of ChR2, sufficient to trigger action potentials in loose cell attached recordings (bottom panel). (i) Electrical (top trace) and optogenetic (bottom trace) stimulation evoked TC-EPSC in a single Lpar1-EGFP SPN at P2. Bottom panel, plot of electrical stimulation evoked TC-EPSCs recorded during the combined electrical and optogenetic stimulation experiments. Blue data points indicate the two cells that also exhibited optogenetic EPSCs; dashed blue line, TC-EPSCs with a type one profile.
Figure 8
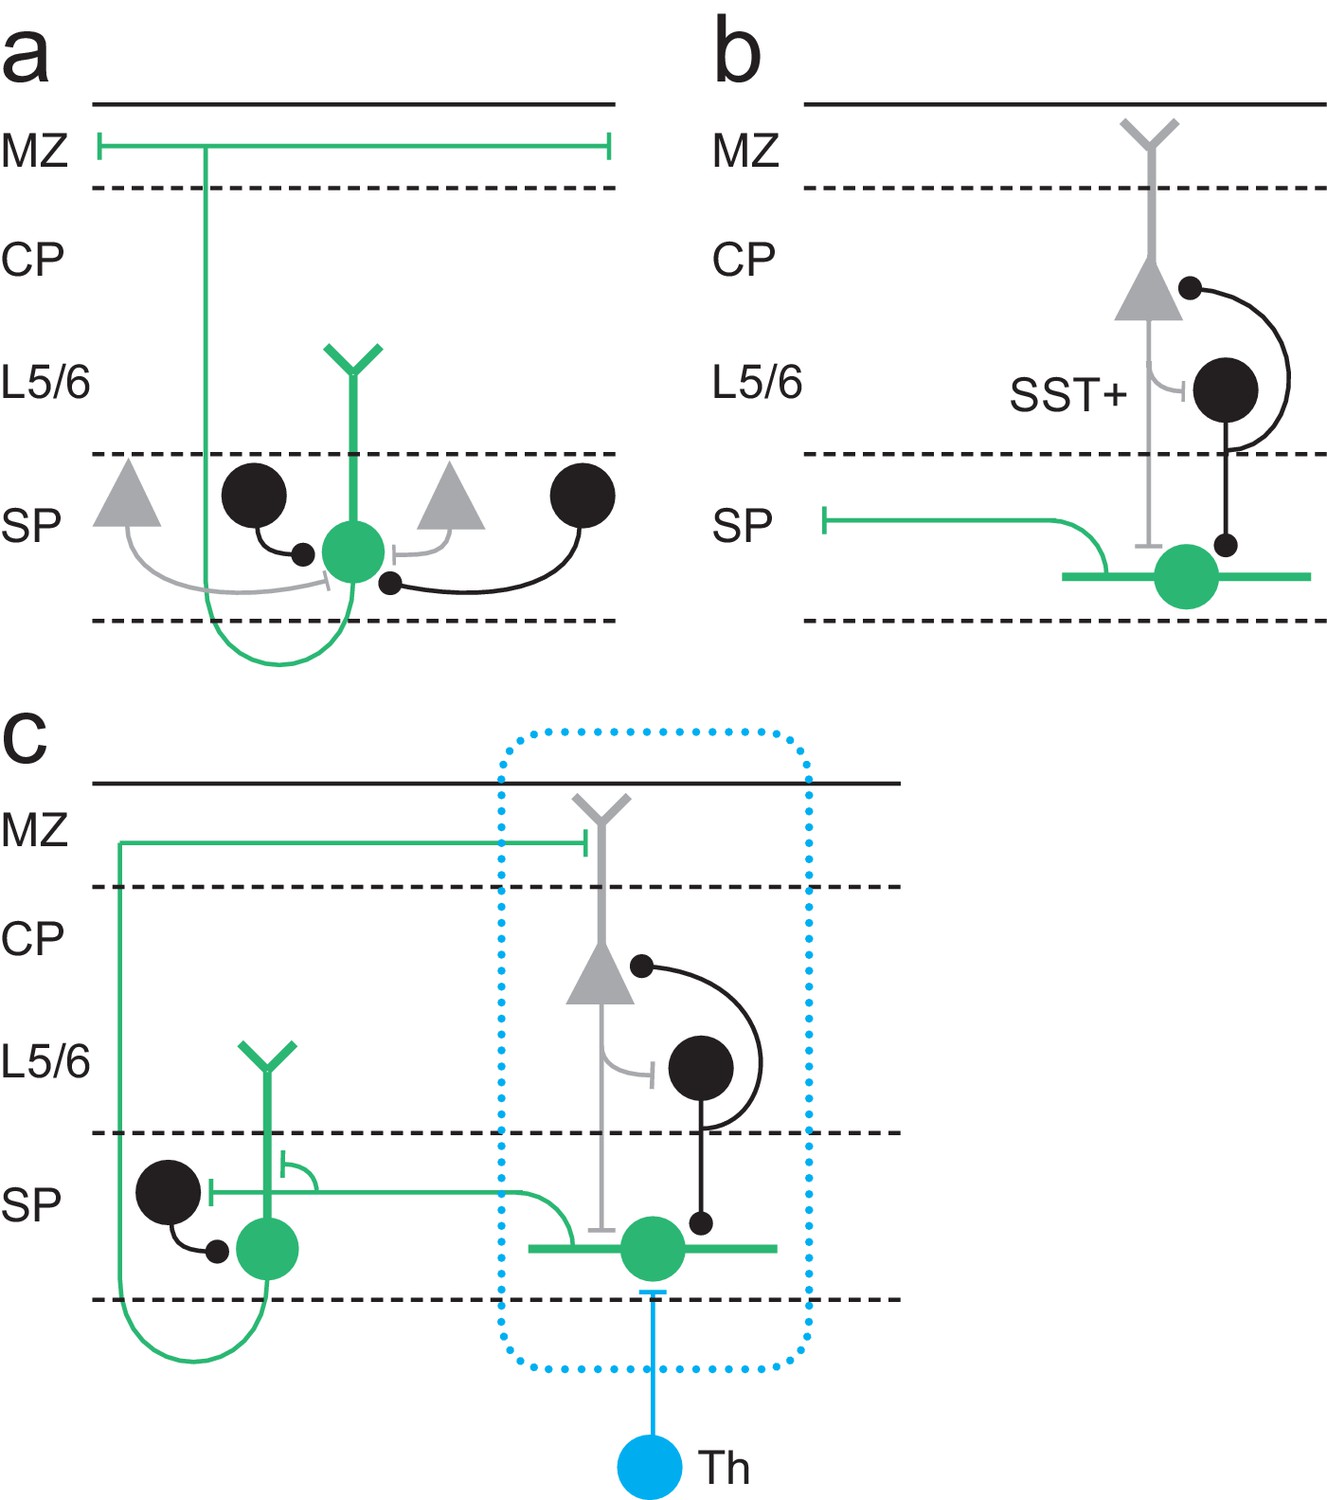
Model for Lpar1-EGFP SPN circuits in early postnatal cortex.
(a) Pyramidal Lpar1-EGFP SPNs received broad glutamatergic (grey neurons) and GABAergic (black) input from the subplate zone. (b) Transient fusiform Lpar1-EGFP SPNs in contrast receive translaminar input from glutamatergic neurons (grey) in the cortical plate and SST+ interneurons (black) in infragranular layers. (c) We propose that sparse thalamic input (Th) onto Lpar1-EGFP SPNs interacts with both fusiform and pyramidal SPN circuits to sculpt the emergent columnar cytoarchitecture (blue dashed box). .
Tables
Key resources table
| Reagent type (species) or resource | Designation | Source or reference | Identifiers | Additional information |
|---|---|---|---|---|
| Strain, strain background (Mus musculus, male) | Tg(Lpar1-EGFP)GX193Gsat | GENSAT Project at Rockefeller University | MGI:4847204; transgene insertion GX193 | Y Chromo- some linked |
| Strain, strain background (M. musculus, mixed sex) | Ssttm2.1(cre)Zjh/J | The Jackson Laboratory | Stock No: 013044; RRID:IMSR_JAX:013044 | Maintained in Butt lab on C57BL/6 background |
| Strain, strain background (M. musculus, mixed sex) | Olig3tm1(cre)Ynka | Prof. Yasushi Nakagawa University Minnesota | ||
| Strain, strain background (M. musculus, mixed sex) | Gt(ROSA)26Sortm32(CAG-COP4*H134R/EYFP)Hze /J | The Jackson Laboratory | Stock No: 012569; RRID:IMSR_JAX:012569 | Maintained in Butt lab on C57BL/6 background |
| Strain, strain background (M. musculus, mixed sex) | R26::P2x2r-EGFP (floxed-stop-rat P2x2 receptor) | Prof. Gero Miesenböck (Oxford) | Maintained in Butt lab on C57BL/6 background | |
| Antibody | Chicken anti-GFP (polyclonal) | Abcam | ab13970 RRID:AB_300798 | (1:250) |
| Antibody | Rabbit anti-GABA (polyclonal) | Sigma-Aldrich | Cat# A2052, RRID:AB_477652 | (1:1000) |
| Antibody | Guinea-pig anti-GABA (polyclonal) | Abcam | ab17413 RRID:AB_443865 | (1:1500) |
| Antibody | Rabbit anti-Caspase three antibody, active (cleaved) form (polyclonal) | Merck Millipore | AB3623 RRID:AB_91556 | (1:200) |
| Antibody | Goat anti-Chicken, Alexa Fluor 488 (polyclonal) | Abcam | ab150169 RRID:AB_2636803 | (1:1000) |
| Antibody | Goat anti-Rabbit, Alexa Fluor 546 (polyclonal) | Thermo-Fisher | A11035 RRID:AB_143051 | (1:1000) |
| Commercial assay or kit | In Situ Cell Death Detection Kit, TMR red | Roche, Sigma-Aldrich | SKU: 12156792910; Lot #: 45197500 | |
| Chemical compound, drug | NaCl; KCl; NaHCO3; NaH2PO4; MgCl2; CaCl2; K-gluconate; Li-GTP; Mg-ATP; HEPES; Gluconic acid; EGTA; SrCl2 | Sigma-Aldrich | S7653 P4504 S6014 S3139 M2670 22,350–6 G4500 G5884 A9187 H3375 G1951 E4378 204463 | |
| Chemical compound, drug | MNI-caged glutamate | Tocris Bioscience UK | Cat. No.: 1490. Lot no.: 48A/206152; 50A/255070; 50A/220558; 50A225070; 51A/240237; 51A/243753; 52A/249897; 52A/251627 | 100 µM |
| Chemical compound, drug | DMNPE-caged ATP | Life Technologies UK | A1049 | 100 µM |
| Chemical compound, drug | Biocytin | Sigma- Aldrich | B4261; Lot no. SLCB0219; SLBS5344 | |
| Chemical compound, drug | Streptavidin, Alexa Fluor 568 conjugate | Thermo-Fisher | S11226 RRID:AB_2315774 | (1:500) |
| Software, algorithm | GraphPad Prism Software | GraphPad Software | RRID:CR_002798 | |
| Software, algorithm | ImageJ/Fiji | Fiji | RRID:SCR_002285 | |
| Software, algorithm | pClamp 10 | Molecular Devices | RRID:SCR_011323 | |
| Software, algorithm | MATLAB | Mathworks | RRID:SCR_001622 | |
| Other | DAPI stain | Thermo-Fisher | D1306 RRID:AB_2629482 | (1:1000) |
Additional files
Download links
A two-part list of links to download the article, or parts of the article, in various formats.
Downloads (link to download the article as PDF)
Open citations (links to open the citations from this article in various online reference manager services)
Cite this article (links to download the citations from this article in formats compatible with various reference manager tools)
Non-canonical role for Lpar1-EGFP subplate neurons in early postnatal mouse somatosensory cortex
eLife 10:e60810.
https://doi.org/10.7554/eLife.60810


