HIV-1 Vpr antagonizes innate immune activation by targeting karyopherin-mediated NF-κB/IRF3 nuclear transport
- Division of Infection and Immunity, University College London, United Kingdom
Figures
Figure 1 with 1 supplement
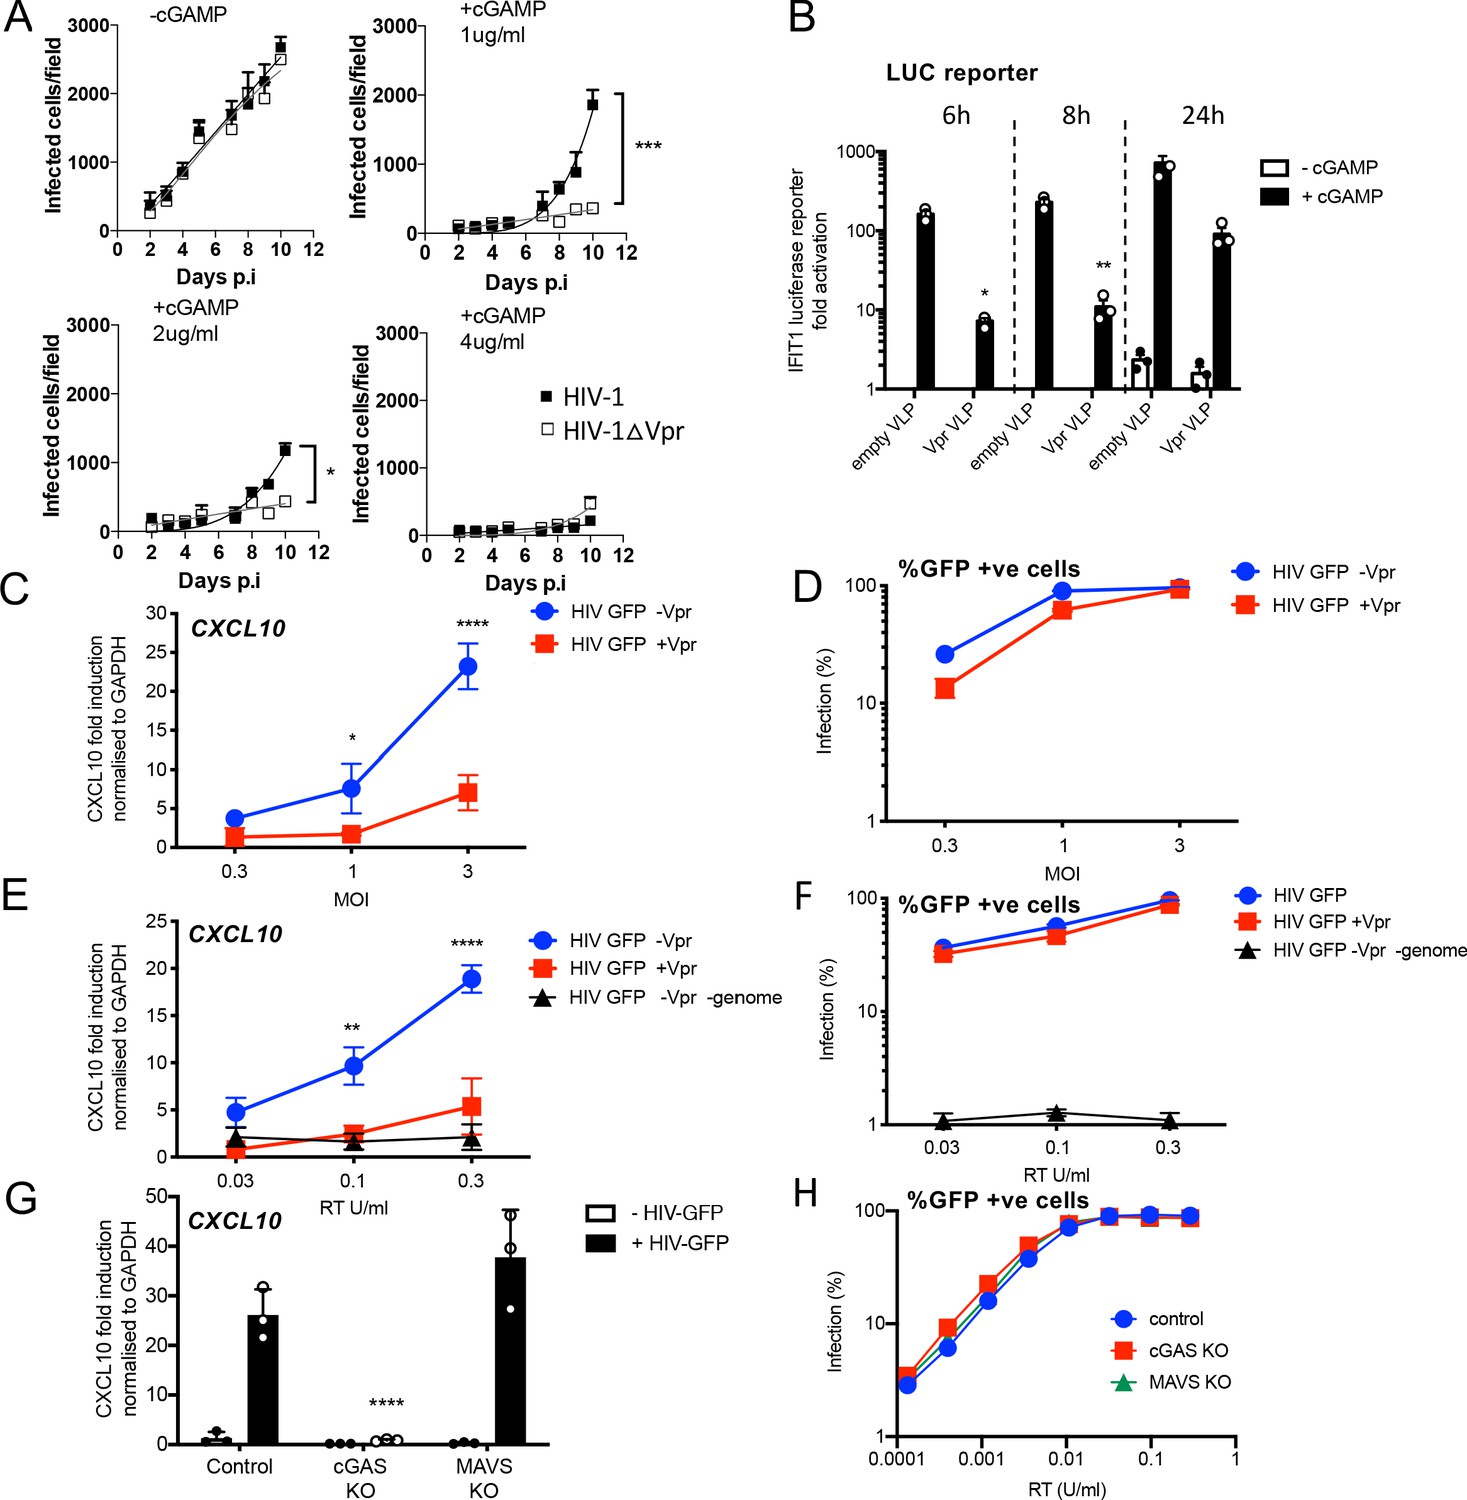
HIV-1 replication in cGAMP-stimulated MDMs requires Vpr.
(A) Replication of WT Yu2 HIV-1 or Yu2 HIV-1ΔVpr in MDMs stimulated with 1 μg/ml, 2 μg/ml or 4 μg/ml cGAMP or left unstimulated, infection measured by counting Gag-positive cells stained with anti-p24. Mean+/-SEM n = 3 1 and 2 μg/ml cGAMP; n = 2 4 μg/ml cGAMP. *** = two-way ANOVA p value < 0.001, *=p < 0.05. (B) Fold induction of IFIT1-Luc after activation of STING by cGAMP (5 μg/ml) and infection with HIV-1 virus-like particles (VLP) lacking genome and bearing Vpr (+Vpr) or lacking Vpr (-Vpr) (1 RT U/ml) in IFIT1-Luc reporter THP-1 cells. cGAMP and virus were added to cells at the same time. (C) Fold induction of CXCL10 after infection of THP-1 cells with HIV-GFP -Vpr or HIV-GFP +Vpr at the indicated MOI. (D) Percentage of THP-1 cells infected by HIV-GFP -Vpr or HIV-GFP +Vpr in (C). (E) Fold induction of CXCL10 after infection of THP-1 cells with HIV-GFP -Vpr, HIV-GFP +Vpr, or HIV-1 particles lacking Vpr and genome, at indicated doses measured by reverse transcriptase SG-PERT assay. (F) Percentage of THP-1 cells infected by HIV-GFP viruses in (E). (G) Fold induction of CXCL10 after infection of unmodified control, cGAS-/-or MAVS-/- THP-1 knock out cells with HIV-GFP lacking Vpr (0.3 RT U/ml). (H) Percentage infection of control, cGAS-/-or MAVS-/- THP-1 knock out cells infected with HIV-GFP at indicated doses of RT (SG-PERT). (B–H) Data are expressed as means ± SD (n = 3) with two-way ANOVA * (p<0.05), ** (p<0.01), *** (p<0.001), **** (p<0.0001) compared to virus without genome (B), HIV GFP+Vpr (C, E) and control (G).
Figure 1—figure supplement 1
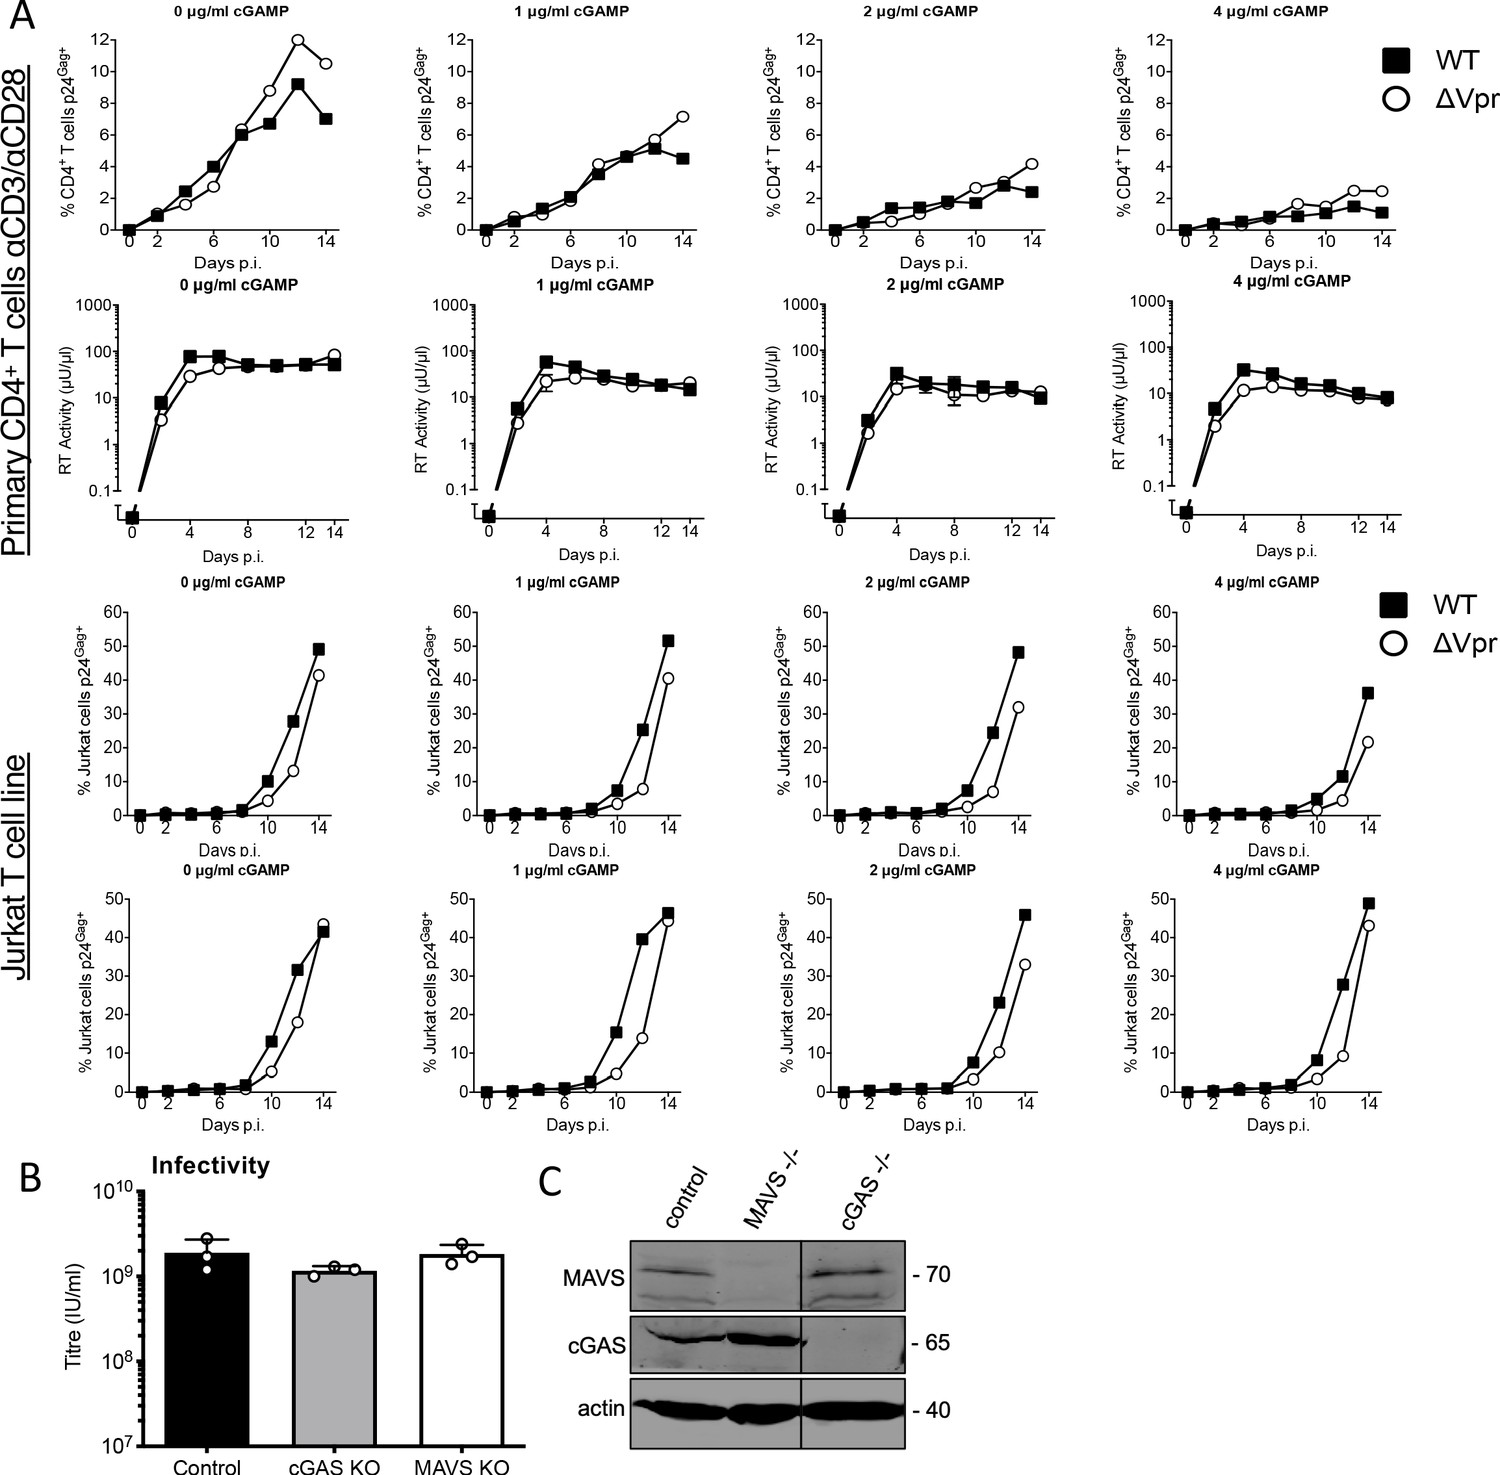
HIV-1 replication in cGAMP-stimulated MDMs requires Vpr and Vpr suppresses HIV-1 innate immune sensing by cGAS.
(A) Replication of wild-type (WT) NL4-3 HIV-1, or NL4-3 HIV-1ΔVpr, in activated primary human CD4+ T cells stimulated with 1, 2, or 4 μg/ml cGAMP or left unstimulated as a control. Two representative examples of three are shown with virus replication measured by percentage T-cell p24 positivity, measured by flow, (top panels) or supernatant RT activity (lower panels). This experiment was also performed twice in Jurkat cells with virus replication measured by percentage T-cell p24 positivity, measured by flow, giving similar results as shown.’ Replication of WT NL4-3 HIV-1 or NL4-3 HIV-1ΔVpr in activated CD4+ T cells stimulated with 1 μg/ml, 2 μg/ml, or 4 μg/ml cGAMP or left unstimulated, measured by flow cytometry staining infected cells with anti-p24 antibody. (B) HIV-GFP titre in control, cGAS-/-or MAVS-/- THP-1 cells used in Figure 1G. (C) Immunoblot detecting cGAS, MAVS, or actin as a loading control, from extracted cGAS-/-or MAVS-/- knock out THP-1 cells or their CRISPR/Cas control cells. Size marker positions are shown on the right (kDa).
Figure 2 with 1 supplement
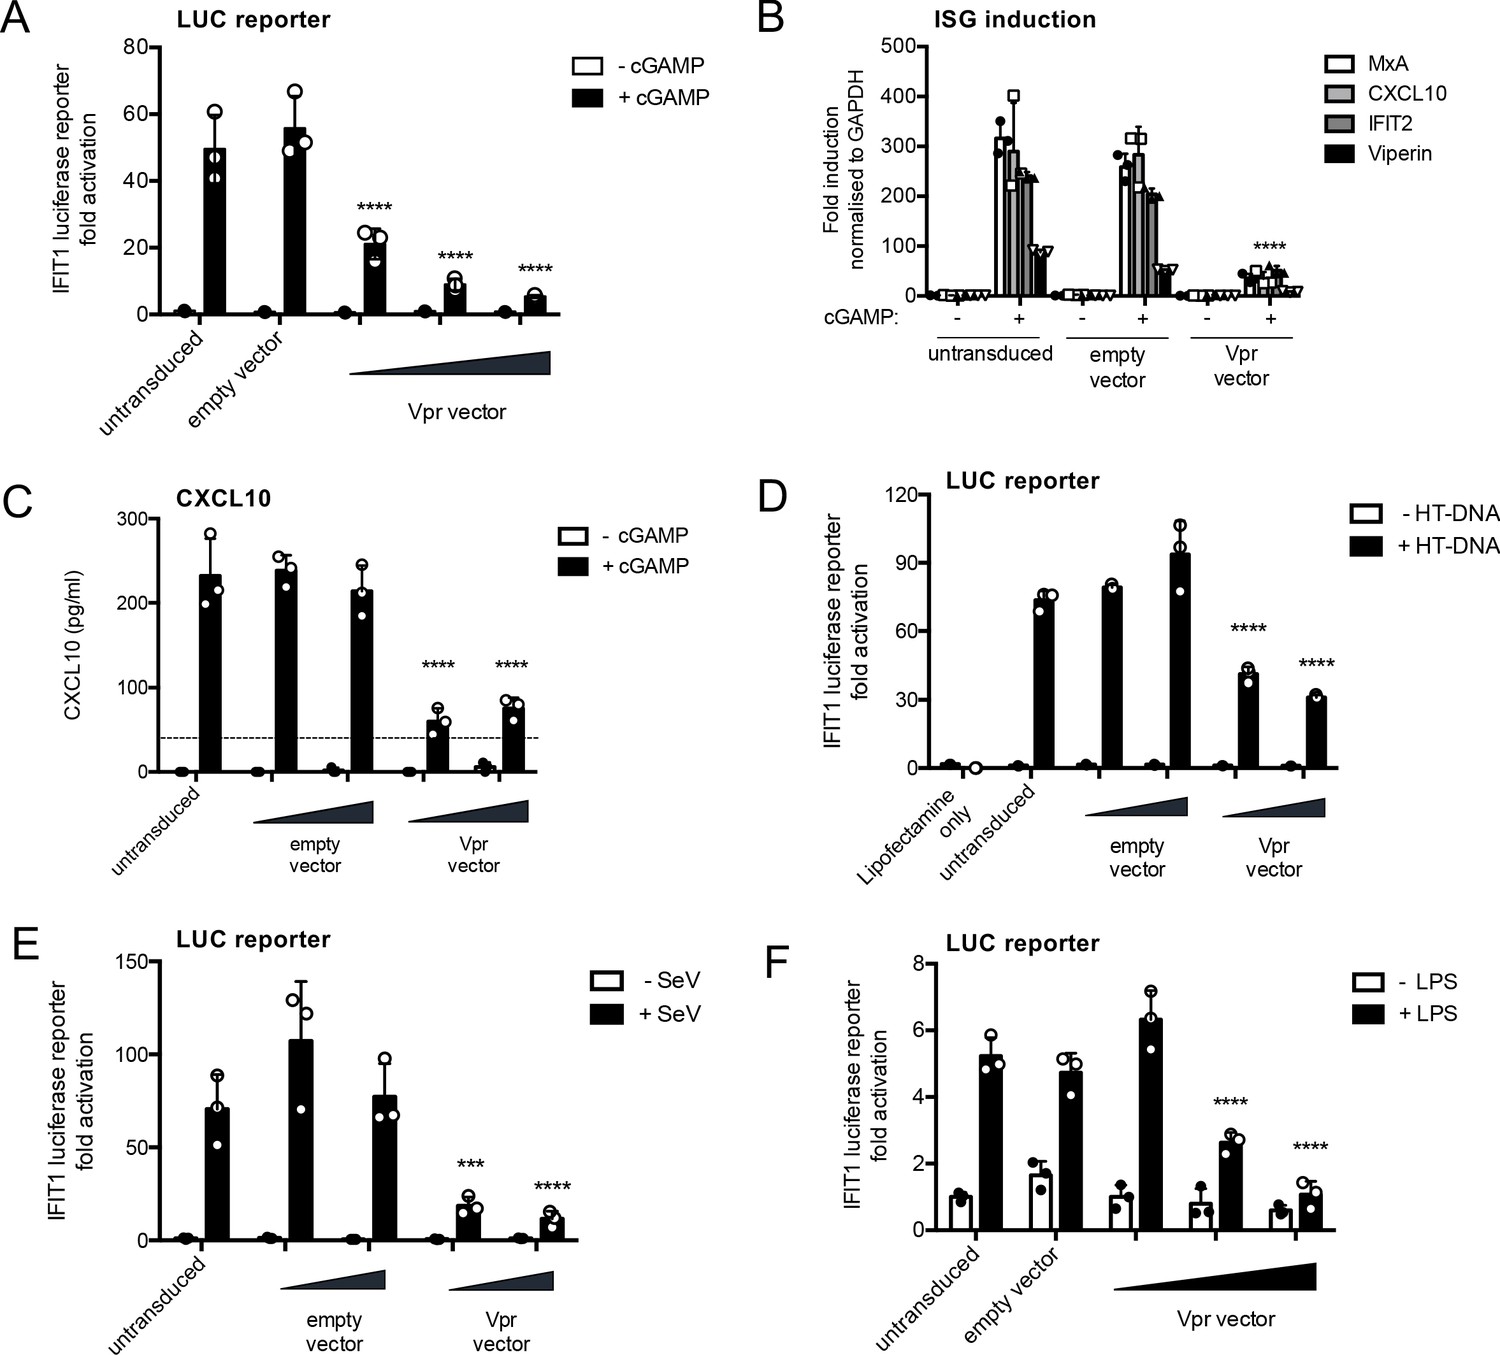
HIV-1 Vpr expression inhibits interferon-stimulated gene expression after stimulation with various innate immune stimuli.
(A) Fold induction of IFIT1-Luc, after activation of STING by cGAMP (5 μg/ml), in IFIT1-Luc reporter THP-1 cells expressing Vpr from a lentiviral vector delivered at MOIs of 0.25, 0.5, 1, or after empty vector transduction (MOI 1) or in untransduced cells. (B) Fold induction of ISGs MxA, CXCL10, IFIT2, and Viperin after activation of STING by cGAMP (5 μg/ml) in cells expressing Vpr from a lentiviral vector (MOI 1), or after empty vector transduction (MOI 1) or in untransduced THP-1 cells. (C) Secreted CXCL10 (ELISA) after activation of STING by cGAMP (5 μg/ml) in cells expressing Vpr from a lentiviral vector (MOI 0.5, 1), or after transduction with empty vector (MOI 0.5, 1) or in untransduced THP-1 cells. Dotted line shows limit of detection. (D) Fold induction of IFIT1-Luc after HT-DNA transfection (5 μg/ml) of cells expressing Vpr from a lentiviral vector (MOI 0.5, 1), or empty vector (MOI 0.5, 1) or in untransduced IFIT1-Luc reporter THP-1 cells. (E) Fold induction of IFIT1-Luc, after Sendai virus infection, of cells expressing Vpr from a lentiviral vector (MOI 0.5, 1), or after transduction by empty vector (MOI 0.5, 1) or in untransduced IFIT1-Luc reporter THP-1 cells. (F) Fold induction of IFIT1-Luc, after LPS treatment (1 μg/ml), of cells expressing Vpr from a lentiviral vector (MOI 0.25, 0.5, 1), after transduction by empty vector (MOI 1) or in untransduced IFIT1-Luc reporter THP-1 cells. Data are expressed as mean ± SD (n = 3) analyzed using two-way ANOVA * (p<0.05), ** (p<0.01), *** (p<0.001), **** (p<0.0001) compared to data for empty vector. n = 3 (A, D–F) or 2 (B–C) independent experiments.
Figure 2—figure supplement 1
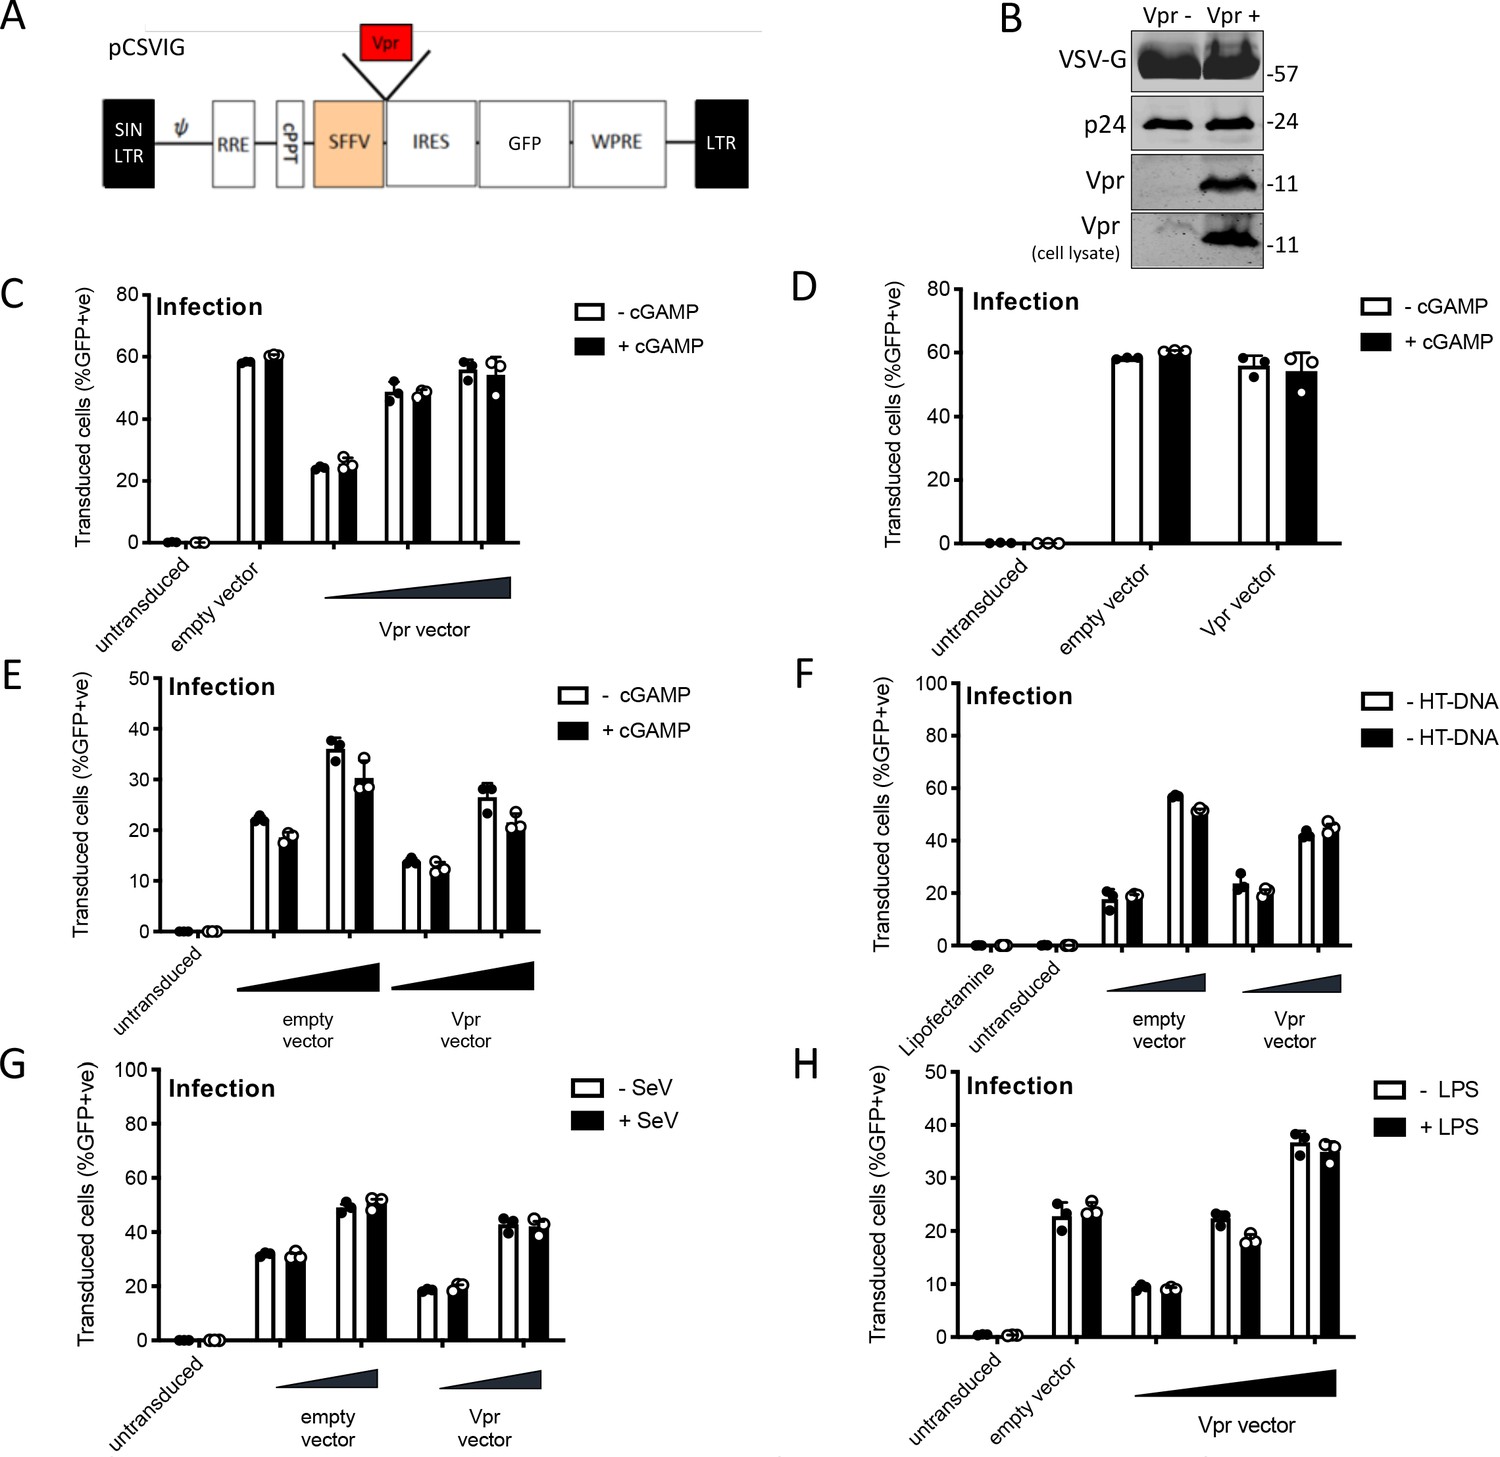
HIV-1 Vpr expression inhibits interferon-stimulated gene expression after stimulation with various innate immune stimuli.
(A) Vpr-encoding lentiviral expression construct (pCSVIG) contained self-inactivating long-terminal repeat (SIN LTR), Rev response element (RRE), central polypurine tract (cPPT), spleen focus-forming virus promoter (SFFV), internal ribosome entry site (IRES), green fluorescent protein (GFP), and Woodchuck hepatitis virus post‐transcriptional regulatory element (WPRE). (B) Immunoblot detecting VSV-G envelope, capsid (p24) and Vpr in vector supernatant and Vpr additionally in target cell lysate. Size markers in kDa are indicated on the right. (C) Percentage of THP-1 cells in Figure 2A transduced by the vector encoding Vpr and GFP (MOI 0.25, 0.5, 1) or empty vector encoding GFP alone (MOI 1) and treated with cGAMP (5 μg/ml) or left untreated as a control. (D) Percentage of THP-1 cells in Figure 2B transduced by the vector encoding Vpr and GFP (MOI 1) or empty vector encoding GFP alone (MOI 1) and treated with cGAMP (5 μg/ml) or left untreated as a control. (E) Percentage of THP-1 cells in Figure 2C transduced by the vector encoding Vpr and GFP (MOI 0.5, 1) or empty vector expressing GFP alone (MOI 0.5, 1) and treated with cGAMP (5 μg/ml) or left untreated as a control. (F) Percentage of THP-1 cells in Figure 2D transduced by the vector encoding Vpr and GFP (MOI 0.5, 1) or empty vector encoding GFP alone (MOI 0.5, 1) and stimulated with HT-DNA transfection (5 μg/ml) or left untreated as a control. (G) Percentage of THP-1 cells in Figure 2E transduced by the vector encoding Vpr and GFP (MOI 0.5, 1) or empty vector expressing GFP alone (MOI 0.5, 1) and stimulated with Sendai virus infection or left untreated as a control. (H) Percentage of THP-1 cells in Figure 2F transduced by the vector encoding Vpr and GFP (MOI 0.25, 0.5, 1) or empty vector encoding GFP alone (MOI 1) and stimulated with LPS treatment (1 μg/ml) or left untreated as a control. Data are expressed as means ± SD (n = 3). Data are representative of three (C, F–H) or two (B, D, E) independent experiments.
Figure 3 with 1 supplement
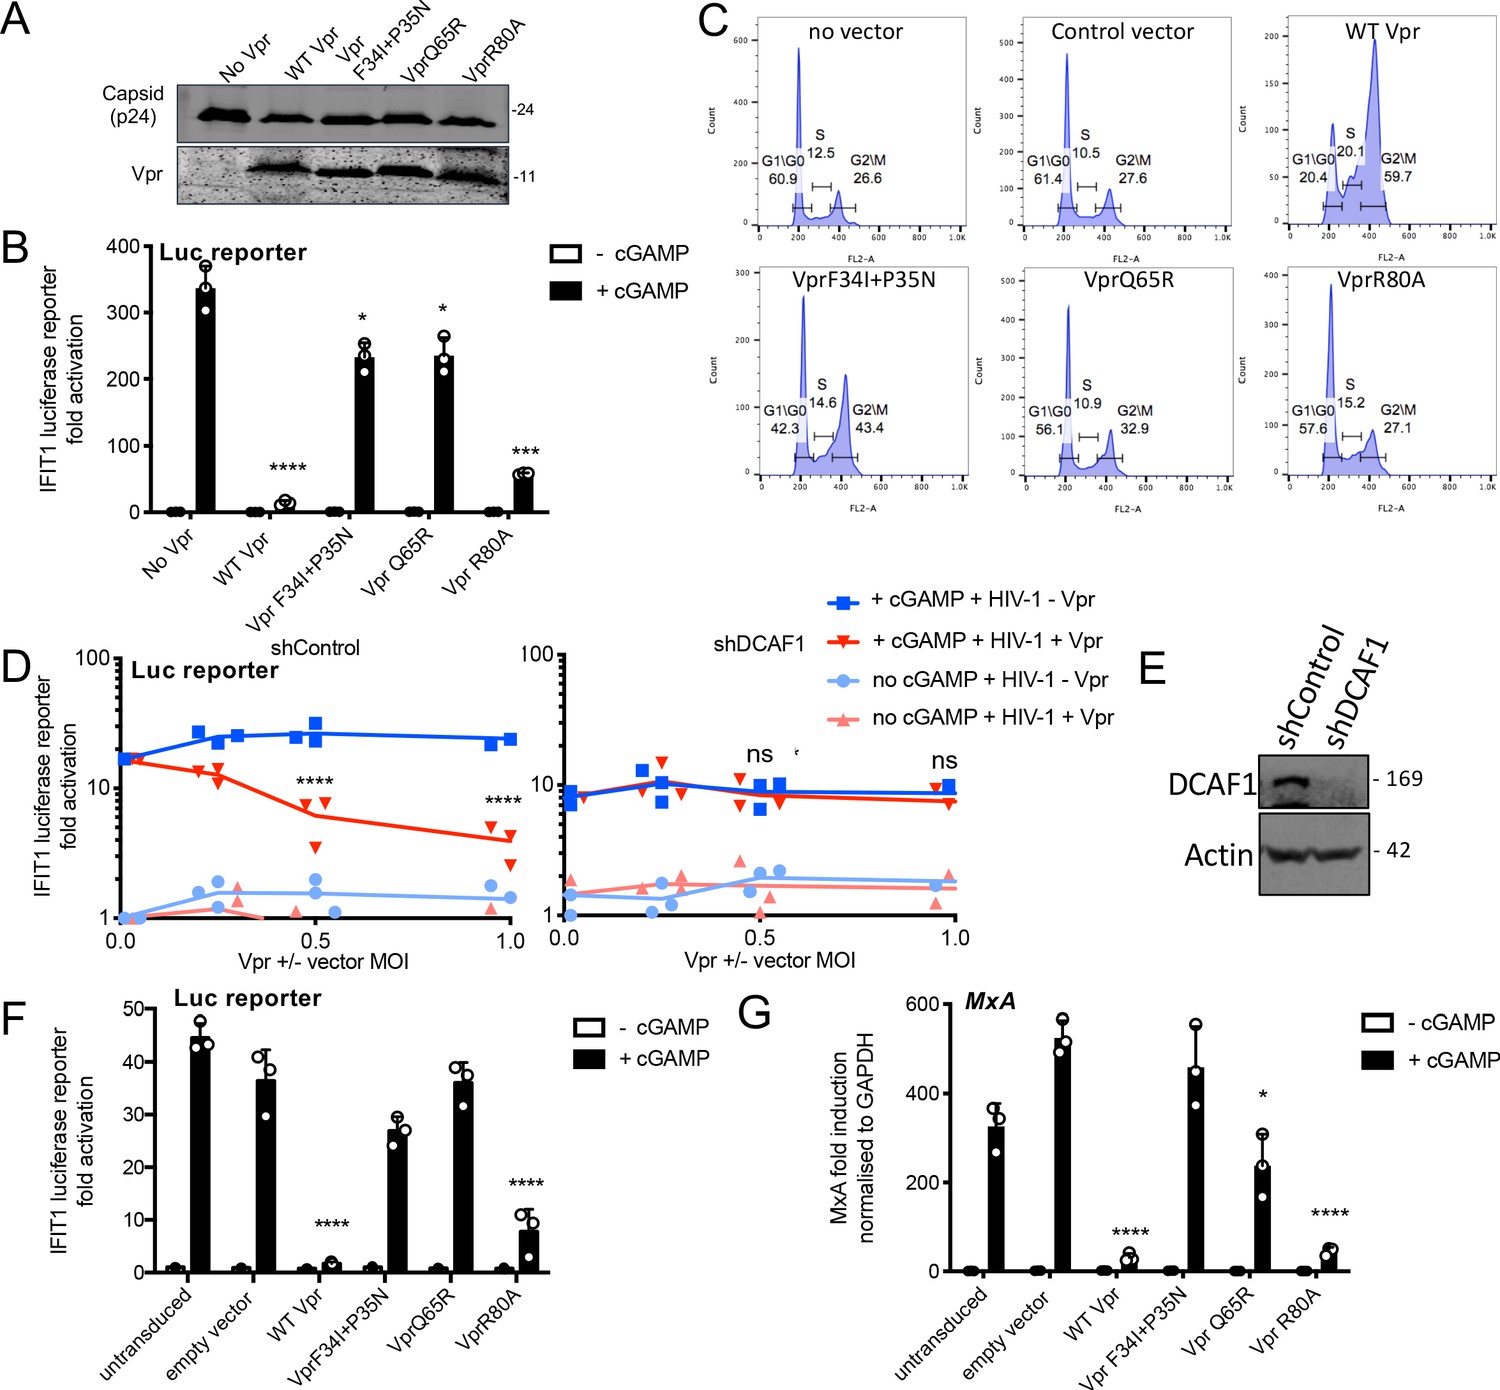
Vpr inhibition of innate immune activation is dependent on DCAF1 but independent of cell cycle arrest.
(A) Immunoblot detecting p24 (capsid) and Vpr in pelleted VSV-G pseudotyped VLP lacking genome used in (B). Size markers in kDa are indicated on the right. (B) Fold induction of IFIT1-Luc after activation of STING by cGAMP (5 μg/ml) and infection with VLP bearing WT or mutant Vpr, or lacking Vpr (1 RT U/ml) in IFIT1-Luc reporter THP-1 cells. Cells were infected at the same time as cGAMP treatment. (C) Flow cytometry plots showing cell cycle phases of THP-1 cells transduced with an empty vector, WT Vpr, or mutant Vpr, encoding vector (MOI 1) or left untransduced as a control and stained with propidium iodide to label DNA. Percentage cells in each cell cycle stage are shown. (D) Fold induction of IFIT1-Luc after activation of STING by cGAMP (5 μg/ml) in cells expressing Vpr from a lentiviral vector, or expressing empty vector, or in untransduced IFIT1-Luc reporter THP-1 cells expressing a control, or a DCAF1 targeting shRNA. Mean +/- SEM n = 3 independent experiments. (E) Immunoblot detecting DCAF1, or actin as a loading control, from extracted THP-1 cells expressing a non-targeting, or DCAF1-targeting, shRNA. Size markers are shown in kDa on the right. (F) Fold induction of IFIT1-Luc after activation of STING by cGAMP (5 μg/ml) in cells expressing WT, or mutant, Vpr from a lentiviral vector (MOI 1), or empty vector (MOI 1) or in untransduced IFIT1-Luc reporter THP-1 cells. (G) Fold induction of MxA mRNA after activation of STING by cGAMP (5 μg/ml) in cells expressing WT, or mutant, Vpr from a lentiviral vector (MOI 1), or after transduction by empty vector (MOI 1) or in untransduced THP-1 cells. Data are mean ± SD (n = 3). Two-way ANOVA test: * (p<0.05), ** (p<0.01), *** (p<0.001), **** (p<0.0001) compared to no Vpr or empty vector controls. Data are representative of three (B–D, F) or two (A, E, G) independent experiments.
Figure 3—figure supplement 1
Vpr inhibition of innate immune activation is dependent on DCAF1 but independent of cell cycle arrest.
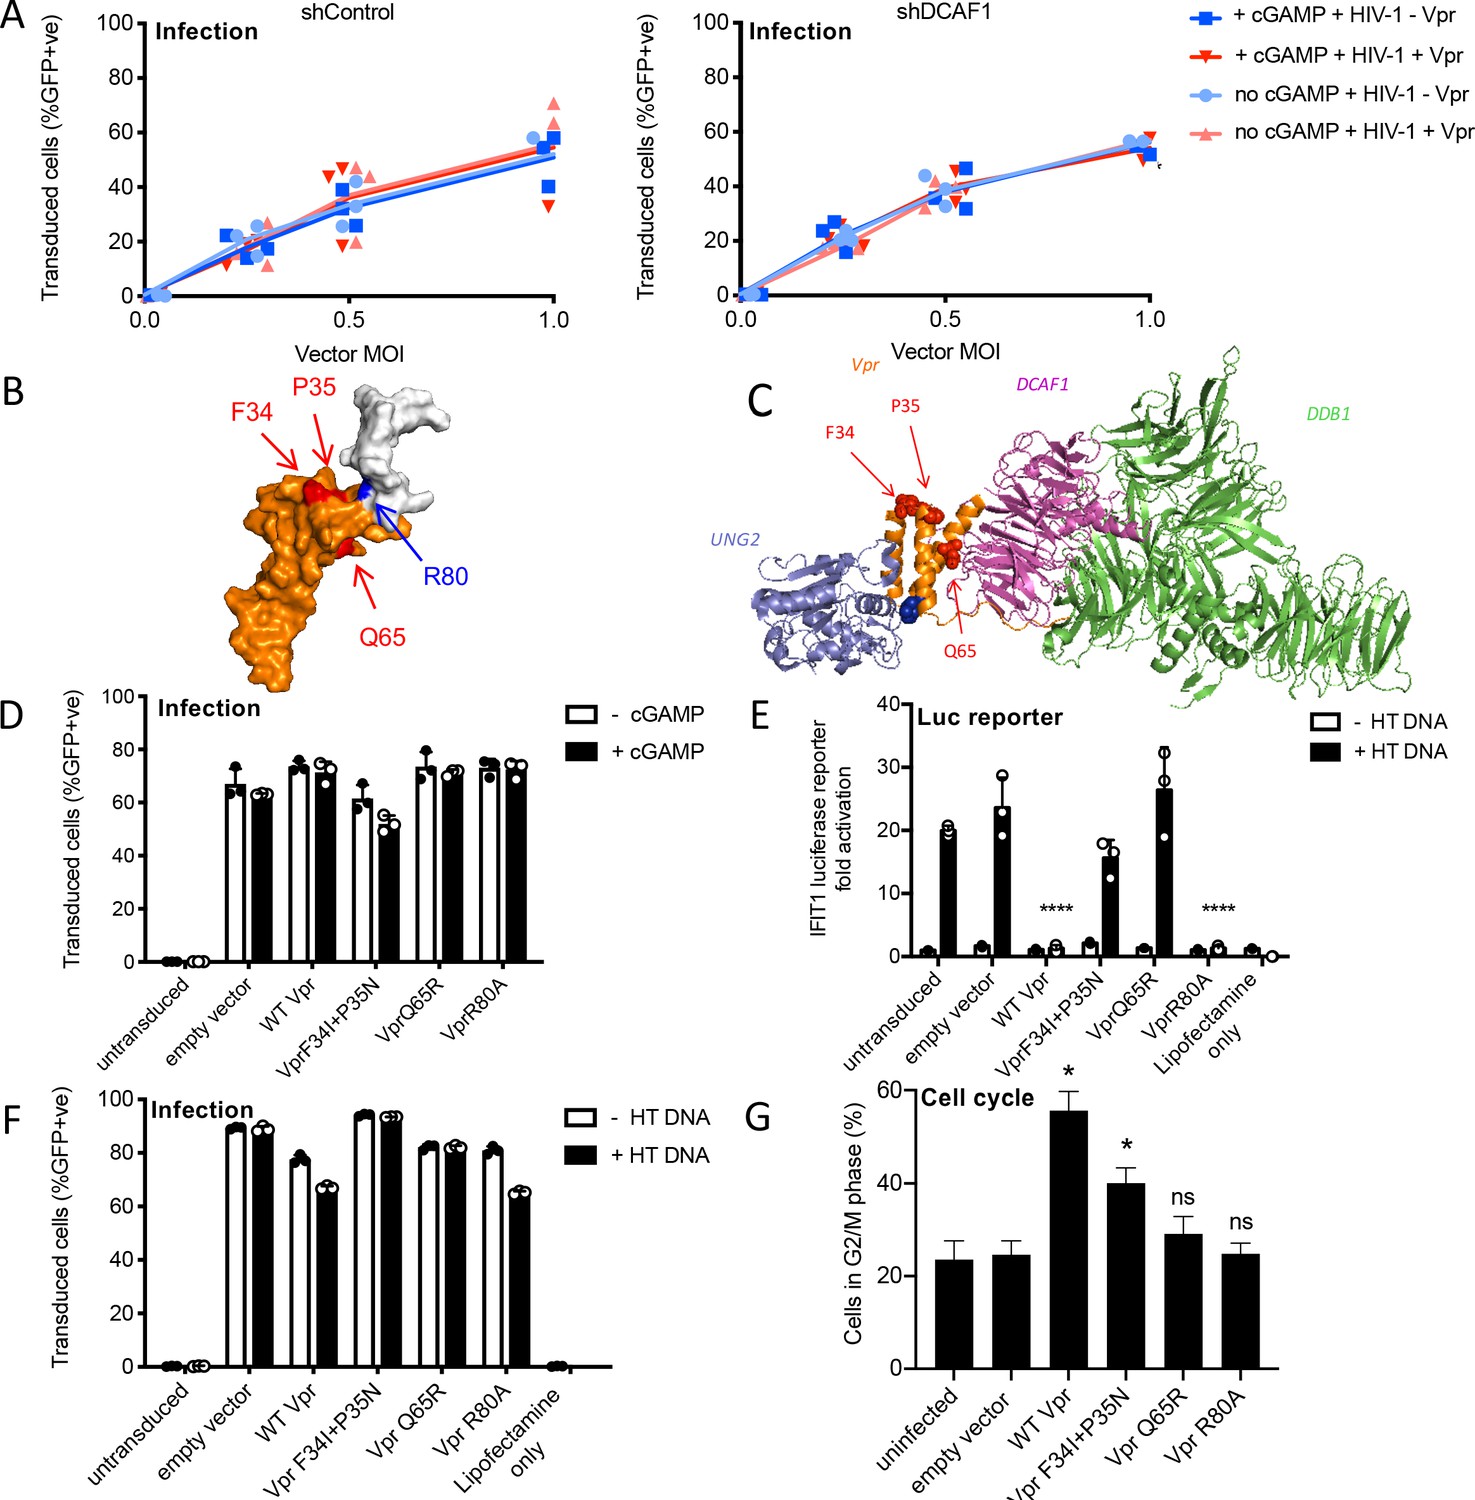
(A) Percentage of THP-1 cells in Figure 3C transduced by the vector encoding Vpr and GFP, or empty vector encoding GFP alone, at the indicated MOI and treated with cGAMP (5 μg/ml) or left untreated. (B) NMR structure of full-length Vpr showing position of Vpr mutants (PDB: 1M8L). White region (c-terminus) of Vpr shown in (B) is unresolved in the crystal structure (C). (C) Crystal structure of Vpr (orange) with its target protein UNG2 (blue) and cofactors DCAF1(pink) and DDB1 (green) showing position of Vpr mutations (PDB: 5JK7). (D) Percentage of THP-1 cells in Figure 3F transduced by the vector encoding WT, or mutant, Vpr and GFP (MOI 1), or empty vector encoding GFP alone (MOI 1), and treated with cGAMP (5 μg/ml), or left untreated as a control. (E) Fold induction of IFIT1-Luc after HT-DNA (5 μg/ml) transfection in cells expressing WT, or mutant, Vpr from a lentiviral vector (MOI 1), or empty vector (MOI 1), or in untransduced IFIT1-Luc reporter THP-1 cells. (F) Percentage of THP-1 cells in Figure 3E transduced with HIV-1 vector encoding WT, or mutant, Vpr and GFP (MOI 1), or empty vector encoding GFP alone (MOI 1), and transfected with HT-DNA (5 μg/ml) or left untransfected as a control. (G) Percentage of THP-1 cells in G2/M phase of cell cycle after transduction with an empty vector (MOI), or vector encoding WT Vpr, or mutant Vpr, (MOI 1) or left untransduced as a control. Mean+/-SEM n = 2. Unless stated data are expressed as means ± SD (n = 3). Data is analyzed using two-way ANOVA test. * (p<0.05), ** (p<0.01), *** (p<0.001), **** (p<0.0001) compared to empty vector. Data are representative of three (A), (D) or two (E–G) independent experiments.
Figure 4 with 1 supplement
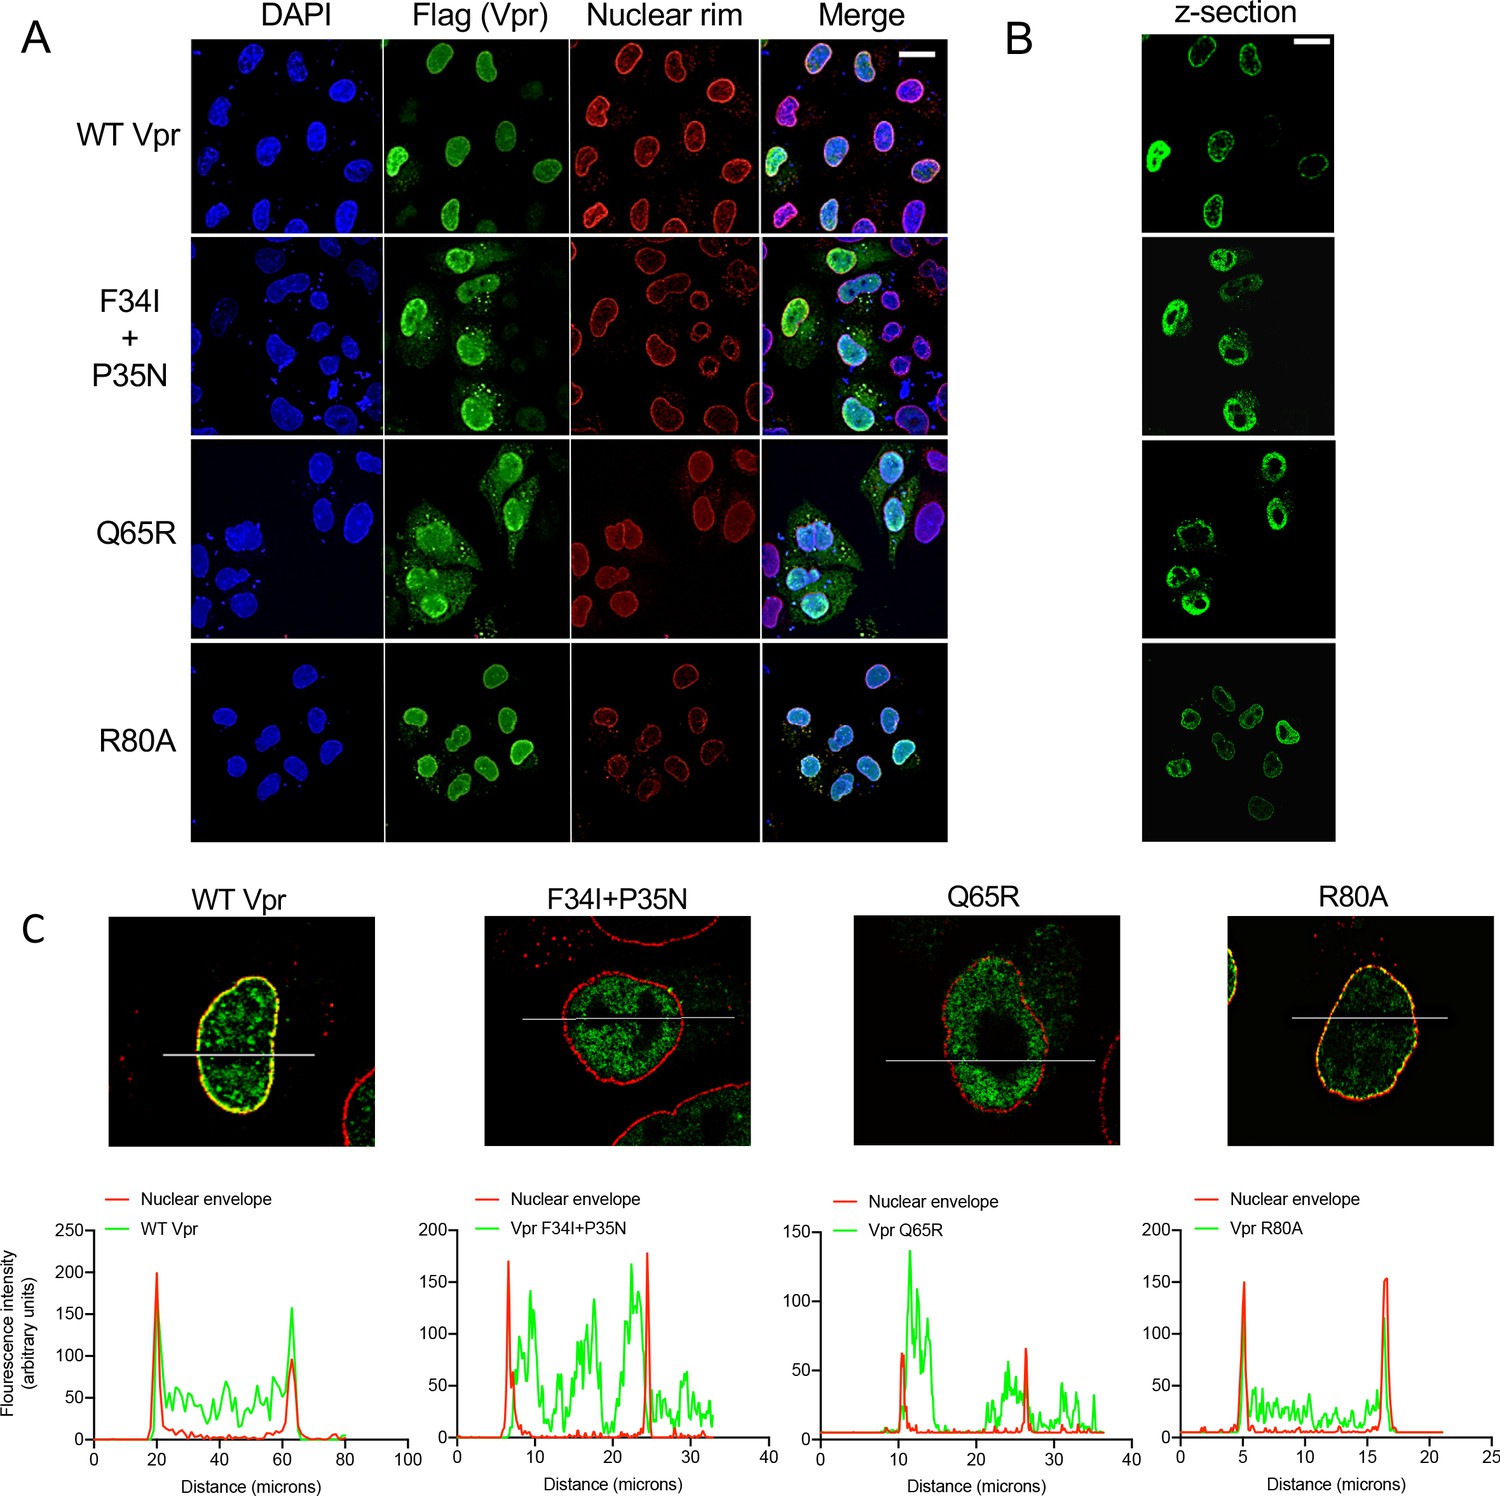
Wild-type Vpr, but not sensing antagonism inactive Vpr mutants, localize to nuclear pores.
(A) Immunofluorescence confocal projections of HeLa cells transfected with Flag-tagged WT, or mutant, Vpr encoded by pcDNA3.1 plasmid (50 ng) and stained using antibodies detecting the Flag-tag (green) or nuclear pore complex (mab414) (red). 4′,6-Diamidine-2′-phenylindole dihydrochloride (DAPI) stains nuclear DNA (Blue). (B) Selected confocal images (z-section) of cells in (A) showing effect of Vpr mutation on Vpr colocalization with mab414 nuclear pore staining. (C) Assessment of colocalization of Vpr with mab414 nuclear pore staining. Scale bars represent 10 μm.
Figure 4—figure supplement 1
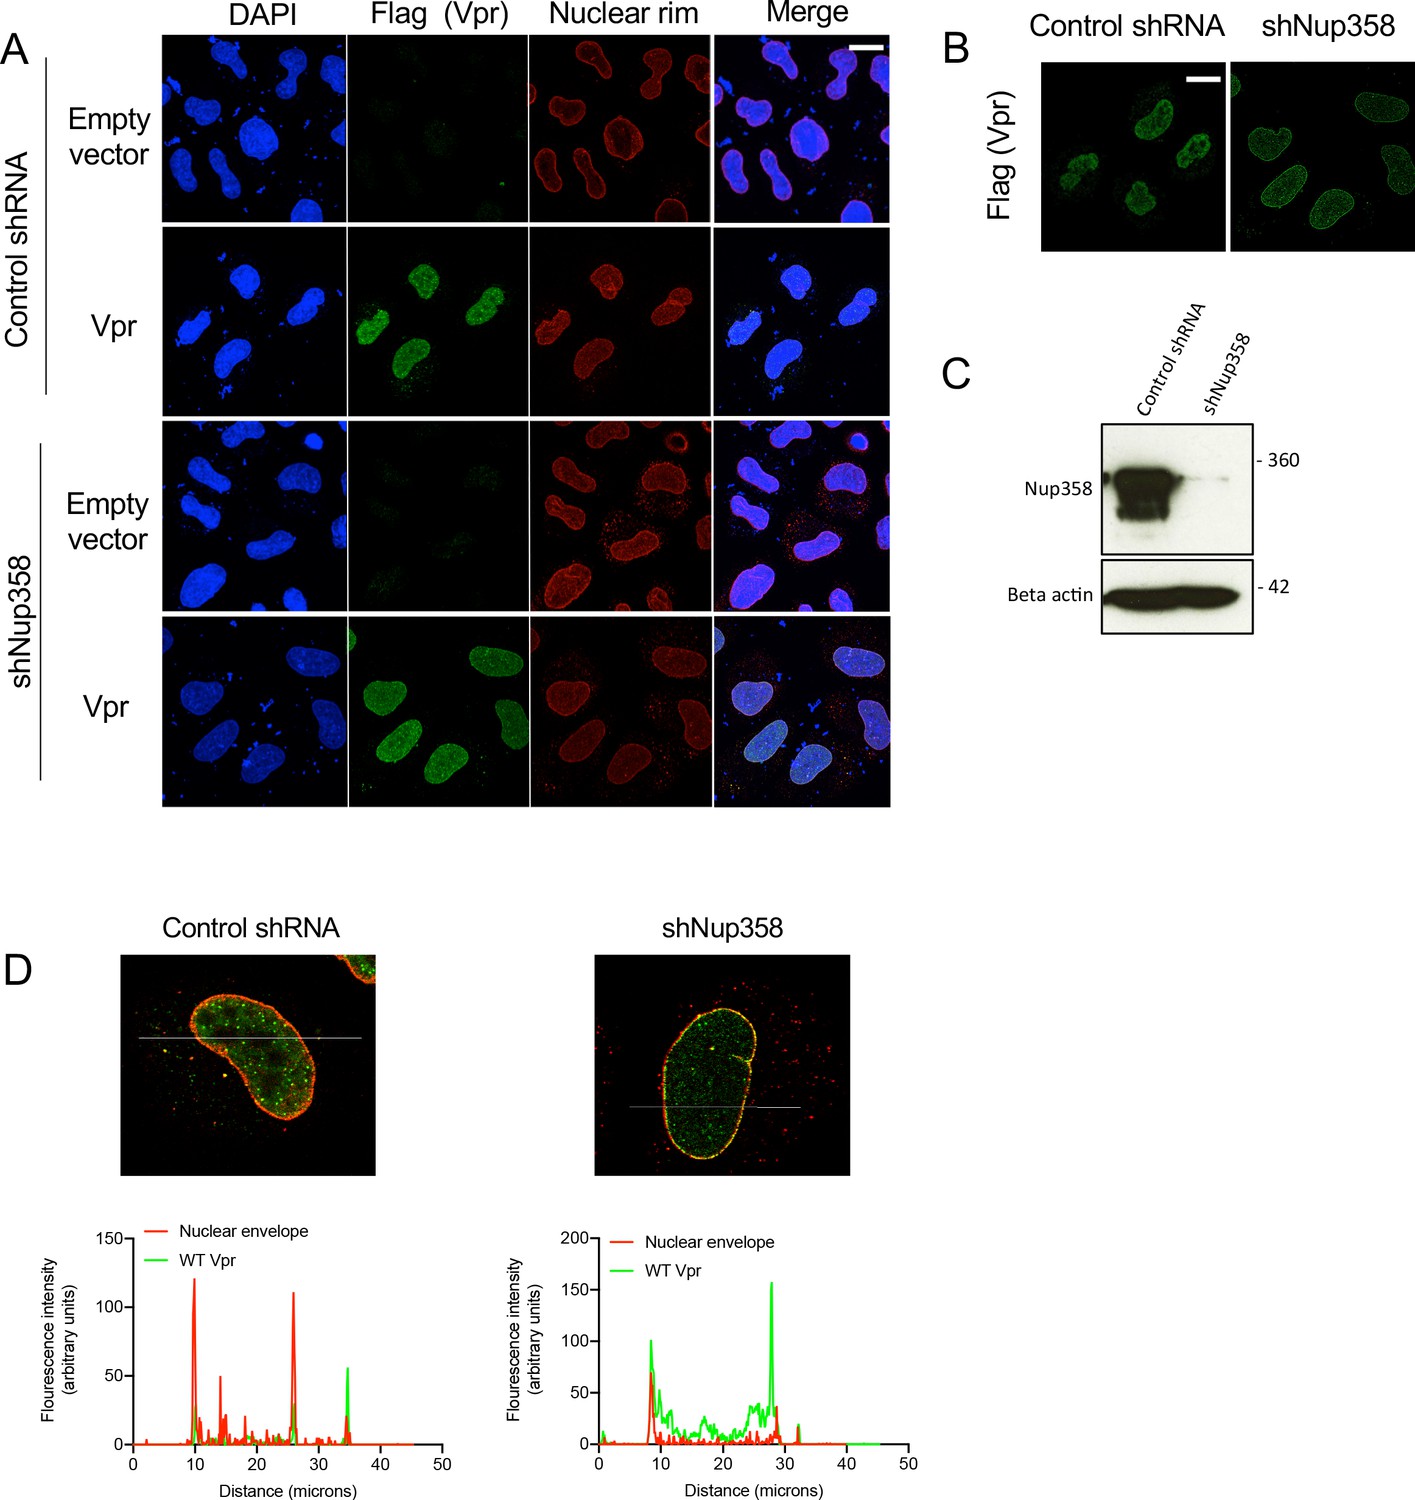
Nup358 is not required for Vpr colocalization with mab414 nuclear pore staining.
(A) Immunofluorescence images of HeLa cells expressing a control, or Nup358 targeting, shRNA transfected with empty vector or Flag-tagged Vpr encoding pcDNA3.1 plasmid (50 ng) using antibodies detecting the Flag-tag (green) or the nuclear pore complex (mab414) (red). 4′,6-Diamidine-2′-phenylindole dihydrochloride (DAPI) stains nuclear DNA (Blue). (B) Selected confocal images (z-section) of cells in (A) showing effect of Nup358 depletion on colocalization of Vpr with mab414 nuclear pore staining (C) Immunoblot detecting Nup358, or actin as a loading control, from extracted Hela cells expressing a control, or Nup358 targeting, shRNA in cells from A. Size markers are shown (kDa). (D) Assessment of colocalization of Flag-tagged Vpr and mab414-stained nuclear pores in cells expressing a control, or Nup358 targeting, shRNA. Scale bars represent 10 μm.
Figure 5 with 2 supplements
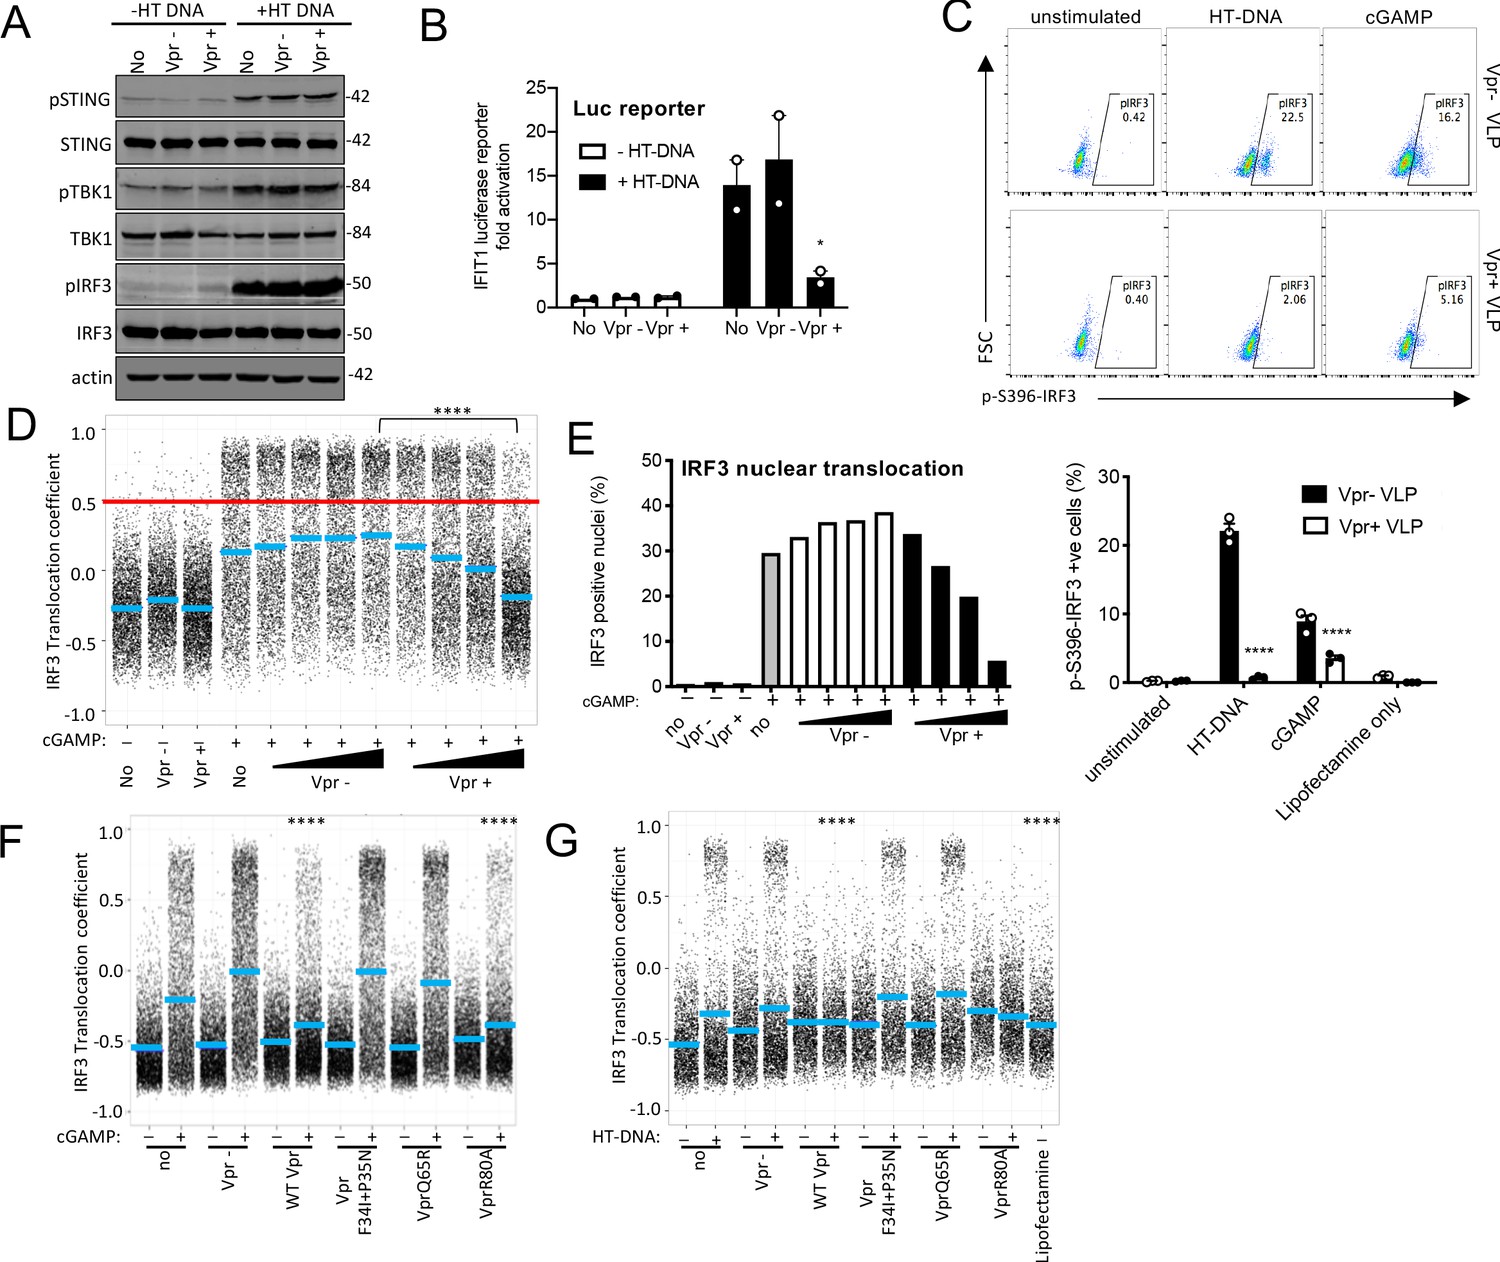
Vpr inhibits IRF3 nuclear translocation.
(A) Immunoblot detecting Phospho-STING (Ser366), total STING, phospho-TBK1 (Ser172), total TBK1, phospho-IRF3 (Ser386), total IRF3, or actin as a loading control, from extracted THP-1 cells expressing Vpr from a lentiviral vector (MOI 1), expressing empty vector, or THP-1 left untransduced as a control and transfected with HT-DNA (5 μg/ml) or left untransfected as a control. Size markers are shown in kDa. (B) Mean fold induction of IFIT1-Luc in cells from A and B (C) Flow cytometry plot (forward scatter vs pIRF3-S396 fluorescence) of THP-1 cells infected with Vpr bearing virus-like particles (VLP) lacking genome (1 RT U/ml), or Vpr free VLP, stimulated with cGAMP (5 μg/ml) or HT-DNA transfection (5 μg/ml). Lower panel shows the flow cytometry data as a bar graph, plotting pIRF3-S396-positive cells. (D) Single-cell immunofluorescence measurement of IRF3 nuclear translocation in PMA differentiated THP-1 cells treated with cGAMP, or left untreated, and infected with HIV-1 GFP bearing Vpr, lacking Vpr or left untransduced. Cells were fixed and stained 3 hrs after infection/transfection. Red line shows the translocation coefficient threshold. Blue lines represent mean translocation coefficient. (E) Percentage of cells in D with IRF3 translocation coefficient greater than 0.5 (above red line). (F) Single-cell immunofluorescence measurement of IRF3 nuclear translocation in PMA-differentiated THP-1 cells stimulated with cGAMP (5 μg/ml), or left unstimulated, and infected with HIV-1 GFP lacking Vpr or bearing WT Vpr or Vpr mutants as shown (1 RT U/ml) or left uninfected. (G) Single cell immunofluorescence measurement of IRF3 nuclear translocation in PMA differentiated THP-1 cells transfected with HT-DNA (5 μg/ml), or left untransfected, and infected with HIV-1 GFP lacking Vpr, or bearing WT or mutant Vpr (1 RT U/ml) or left uninfected. Data in B is expressed as means ± SEM (n = 2). Data is analyzed using two-way ANOVA: * (p<0.05), ** (p<0.01), *** (p<0.001), **** (p<0.0001) compared to data from infection with HIV-1 lacking Vpr. Data are representative of three (C–G) or two (A, B) independent experiments.
Figure 5—figure supplement 1
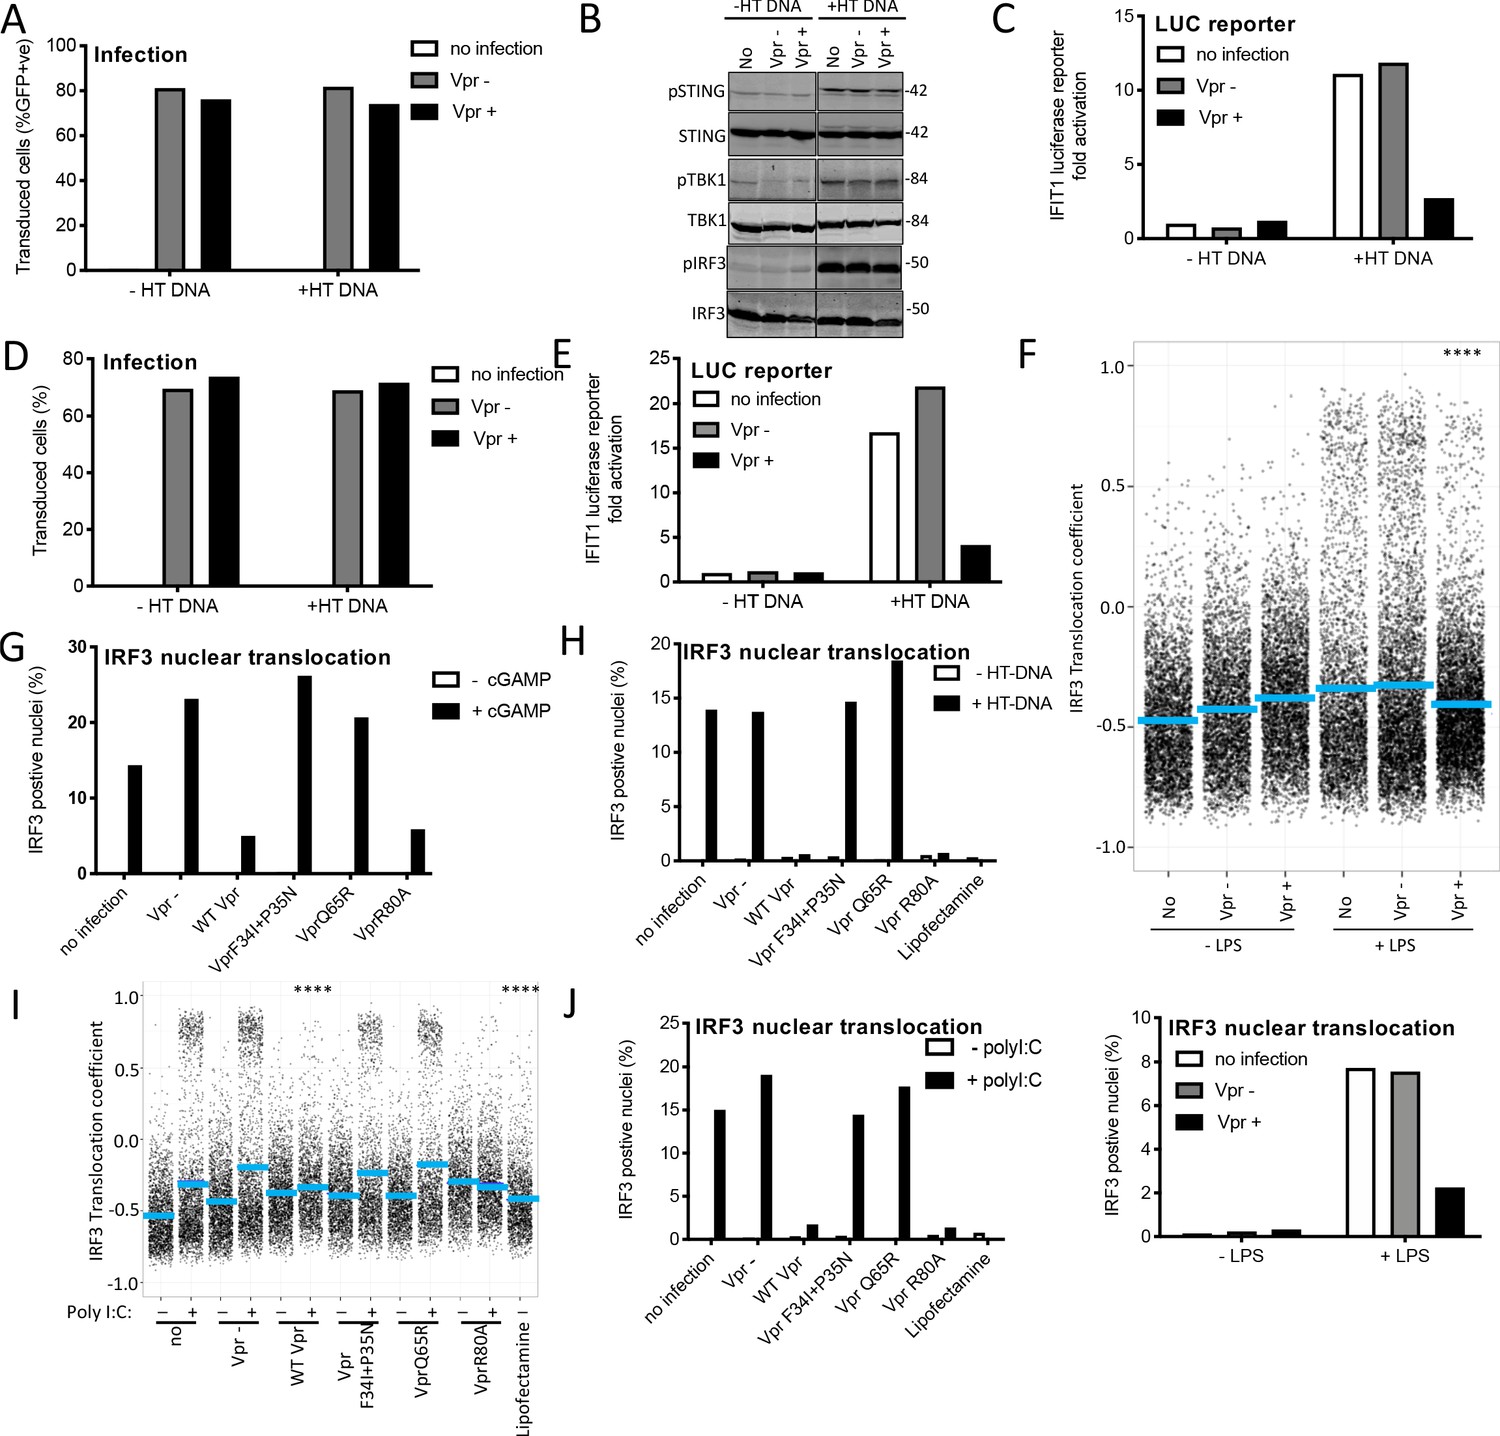
Vpr inhibits IRF3 nuclear translocation.
(A) Percentage of THP-1 cells in Figure 5A transduced by HIV-1 GFP vector bearing Vpr, or HIV-1 GFP lacking Vpr, transfected with HT-DNA (5 μg/ml) or left untransfected as a control. (B) Immunoblot detecting Phosho-STING (Ser366), total STING, phospho-TBK1 (Ser172), total TBK1, phospho-IRF3 (Ser386) or total IRF3 from extracted THP-1 cells expressing Vpr, empty vector or left untransduced as a control, and transfected with HT-DNA (5 μg/ml), or left untransfected as a control. Size markers are shown (kDa). (C) Fold induction of IFIT1-Luc in cells from gel in Figure 5A, expressing Vpr, or empty vector, and transfected with HT-DNA (5 μg/ml) or left untransfected as a control. (D) Percentage of THP-1 cells from Figure 5B transduced by HIV-1 GFP bearing Vpr, or lacking Vpr, transfected with HT-DNA (5 μg/ml) or left untransfected as a control. (E) Fold induction of IFIT1-Luc in cells from second experiment (gel presented in Figure 5B) expressing Vpr, or empty vector, and transfected with HT-DNA (5 μg/ml) or left untransfected as a control. (F) Single cell measurement of IRF3 nuclear translocation in PMA-differentiated THP-1 cells stimulated with LPS, or left unstimulated, and infected with HIV-1 GFP lacking Vpr or bearing Vpr (1 RT U/ml), or left uninfected (top panel). Percentage of cells with IRF3 translocation coefficient greater than 0.5 plotted as a percentage (bottom panel). (G) Percentage of cells with IRF3 translocation coefficient greater than 0.5 plotted as a percentage from Figure 5F. (H) Percentage of cells with IRF3 translocation coefficient greater than 0.5 plotted as a percentage from Figure 5G. (I) Single-cell measurement of IRF3 nuclear translocation in PMA differentiated THP-1 cells transfected with poly I:C, or left untransfected, and infected with HIV-1 GFP lacking Vpr or bearing WT or mutant Vpr (1 RT U/ml), or left uninfected. (J) Percentage of cells with IRF3 translocation coefficient greater than 0.5 plotted as a percentage from Figure 5I. Data is analyzed using two-way ANOVA test: * (p<0.05), ** (p<0.01), *** (p<0.001), **** (p<0.0001) compared to empty vector. Data are representative of three (F–K) or two (A–E) independent experiments.
Figure 5—figure supplement 2
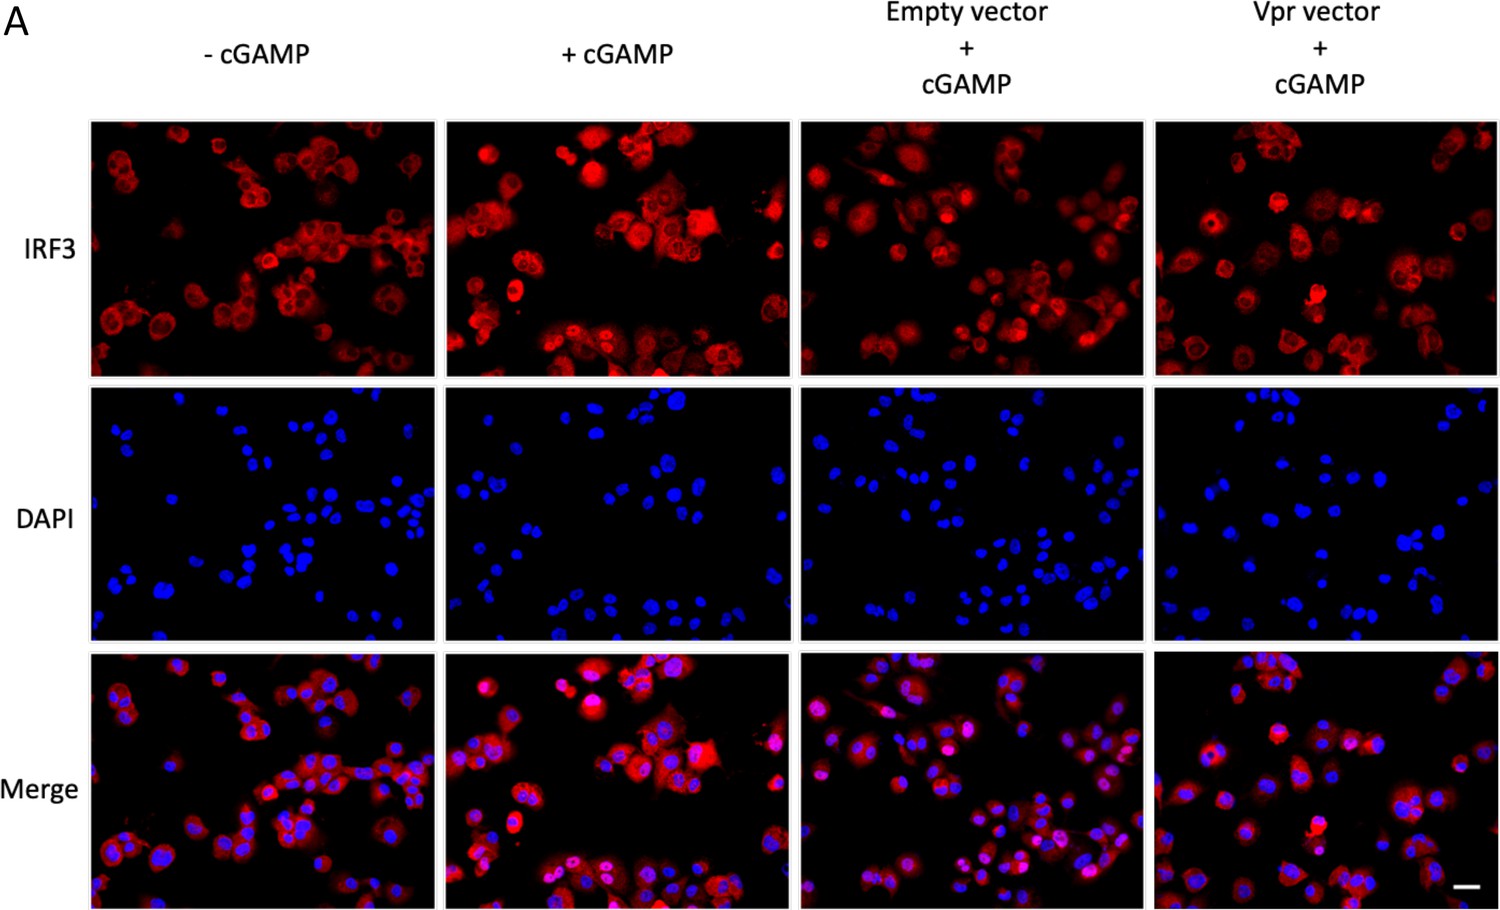
Nuclear translocation of IRF3 after cGAMP stimulation in the presence or absence of Vpr.
Figure 6 with 1 supplement
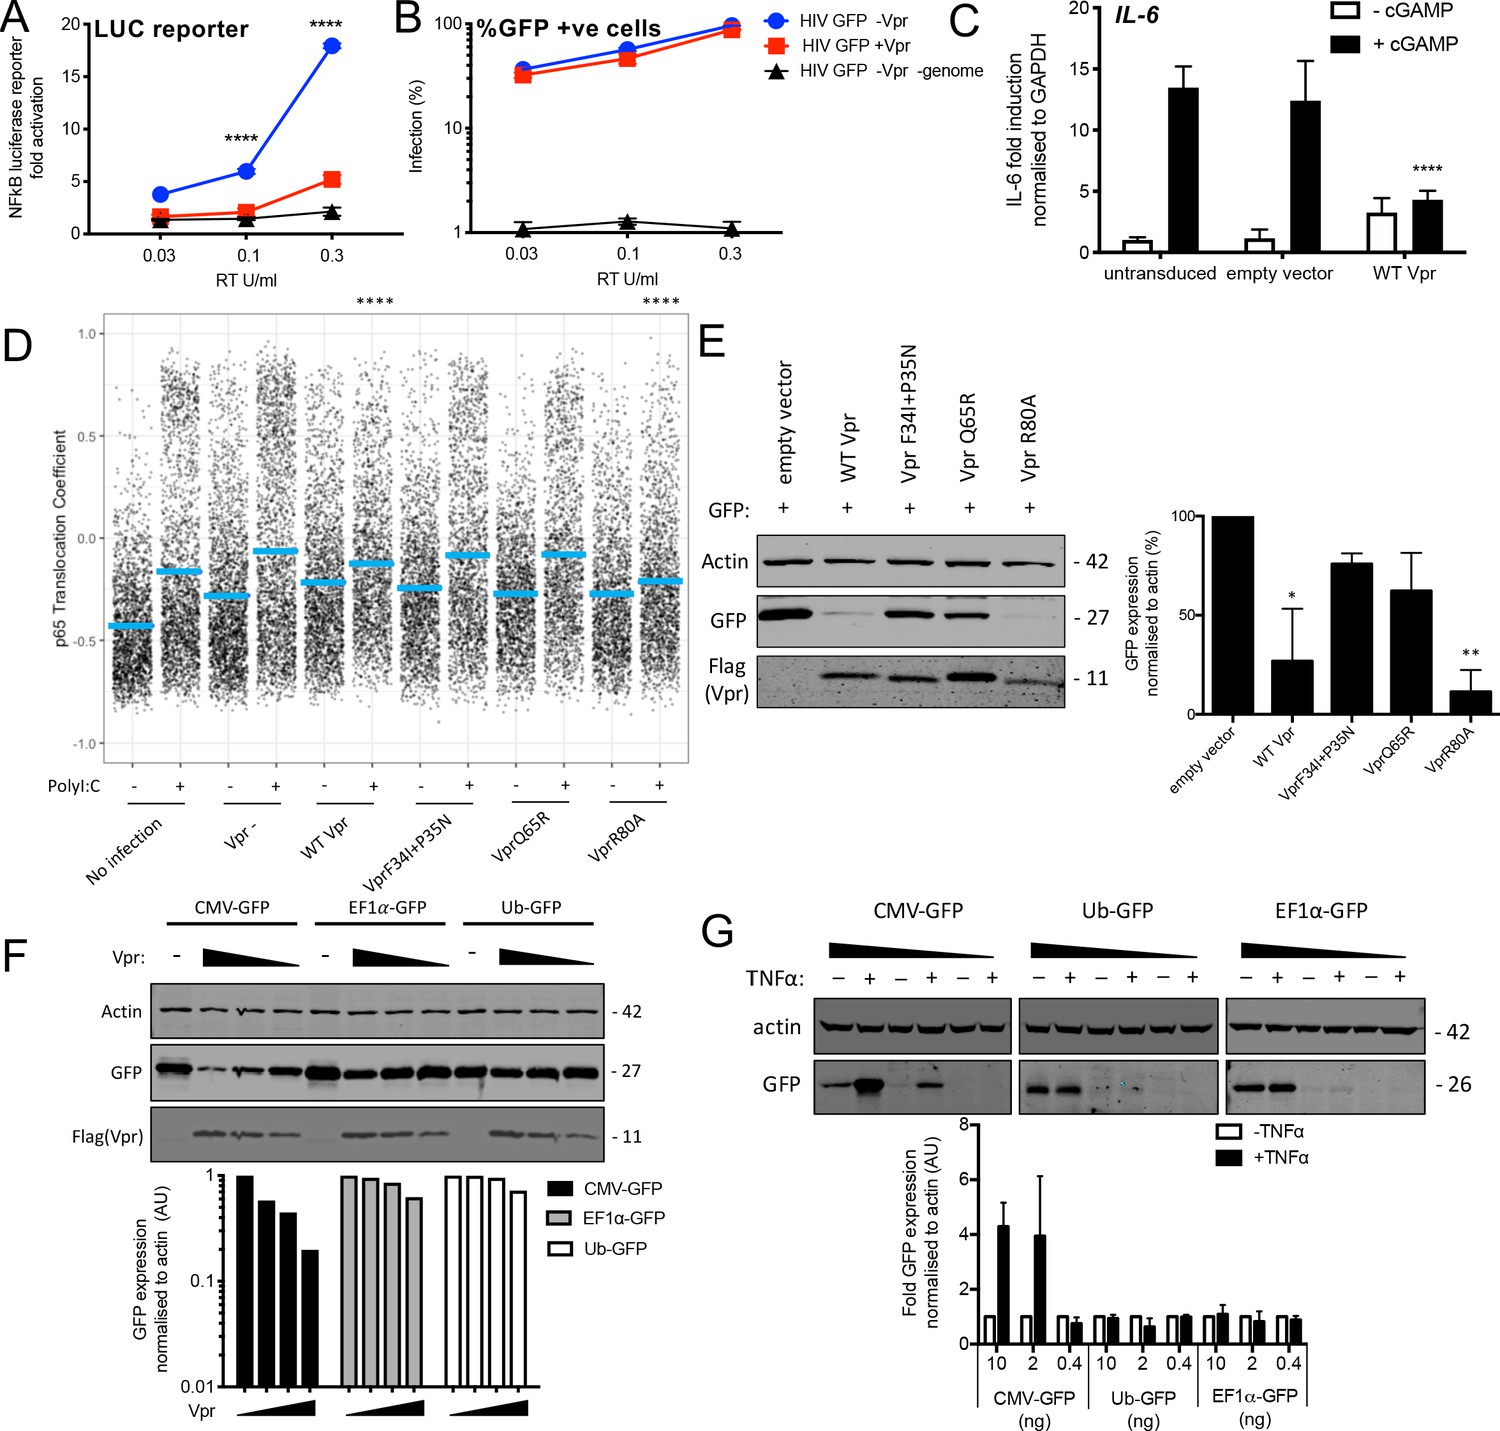
Vpr inhibits NF-κB p65 nuclear translocation and NF-κB-sensitive plasmid expression.
(A) Fold induction of NF-κB-Luc after infection of THP-1 cells with HIV-GFP lacking Vpr, HIV-GFP bearing Vpr, or HIV-GFP lacking Vpr and genome, at the indicated doses. (B) Percentage of THP-1 cells in (A). (C) Fold induction of IL-6 after activation of STING by cGAMP (5 μg/ml) in cells expressing empty vector or Vpr encoding vector (MOI 1), or in untransduced THP-1 cells. (D) Single-cell immunofluorescence measurement of NF-κB (p65) nuclear translocation in PMA differentiated THP-1 cells transfected with Poly I:C (50 ng/ml), or left untreated, and infected with HIV-1 GFP lacking Vpr, HIV-1 GFP bearing Vpr (1 RT U/ml) or left uninfected. Cells were stained 3 hr after transfection and infection. (E) Immunoblot detecting Flag-Vpr, GFP, or actin as a loading control, from HEK293T cells transfected with 50 ng of empty vector, Flag-tagged WT Vpr vector, or Flag-tagged mutant Vpr vector, and CMV-GFP vector (50 ng). Size markers are shown in kDa. GFP expression from two independent immunoblots was quantified by densitometry and is shown in the lower panel. (F) Immunoblot detecting Flag-Vpr, GFP, or actin as a loading control, from HEK293T cells transfected with empty vector (200 ng) or Vpr vector (50 ng, 100 ng, 200 ng) and CMV-GFP, EF1α-GFP or Ub-GFP plasmids (50 ng). Size markers are shown in kDa. GFP expression quantified by densitometry is shown in the lower panel. (G) Immunoblot detecting GFP, or actin as a loading control, from HEK293T cells transfected with CMV-GFP, EF1α-GFP or Ub-GFP plasmids (10 ng, 2 ng, 0.4 ng) and stimulated with TNFα (200 ng/ml) or left unstimulated. Size markers are shown in kDa. GFP expression, from two independent immunoblots, quantified by densitometry, is shown in the lower panel. Data in (A, B, C) is expressed as mean ± SD (n = 3). Data in (E, F, G) is expressed as mean ± SD (n = 2). Two-way ANOVA: * (p<0.05), ** (p<0.01), *** (p<0.001), **** (p<0.0001) compared to empty vector or HIV GFP+Vpr.
Figure 6—figure supplement 1
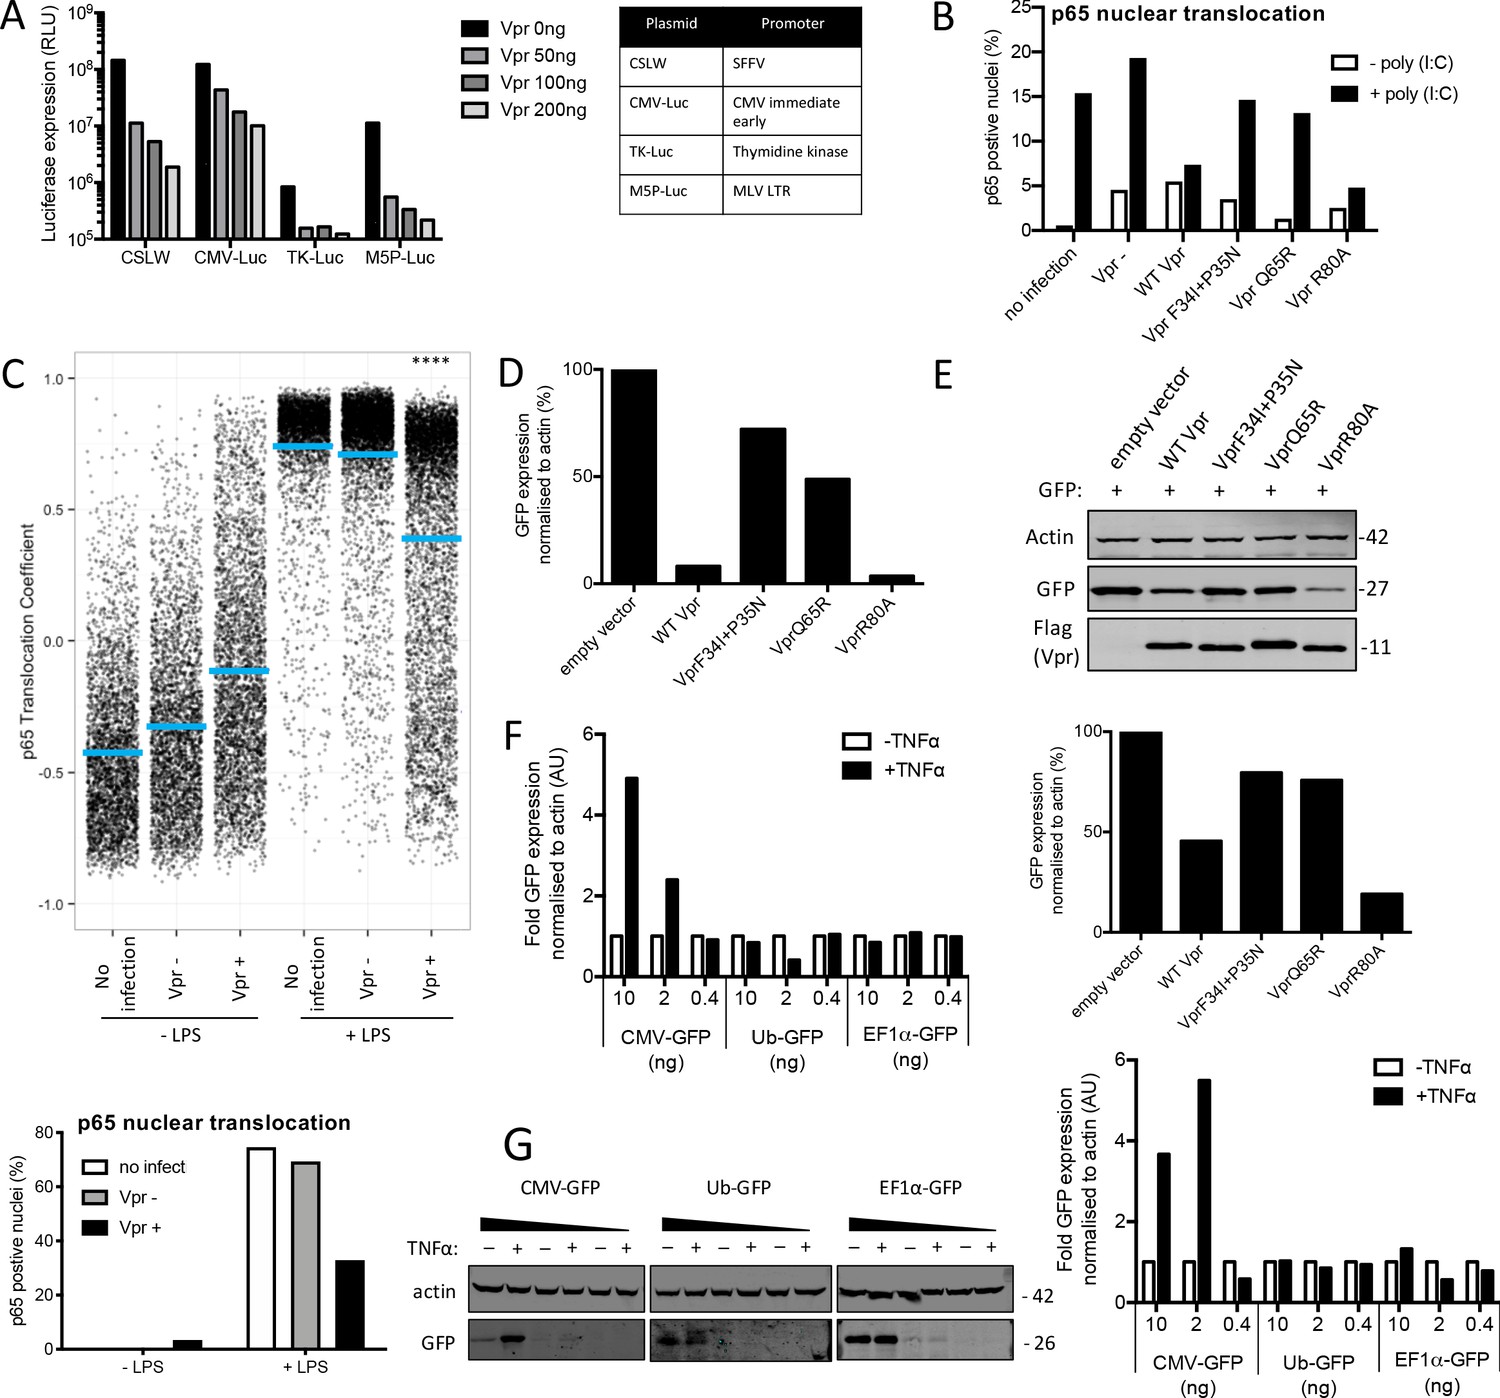
Vpr inhibits NF-κB p65 nuclear translocation and NF-κB-sensitive plasmid expression.
(A) Induction of luciferase reporter in HEK293T cells transfected with CSLW, CMV-Luc, TK-Luc, or M5P-Luc (10 ng), and empty vector, or Vpr encoding vector (50 ng, 100 ng, 200 ng). Table shows the promoters driving the luciferase reporter in each plasmid. (B) Percentage of cells in Figure 6D with translocation coefficient greater than 0.5. (C) Single-cell measurement of NF-κB nuclear translocation in PMA differentiated THP-1 cells stimulated with LPS, or left unstimulated, and infected with HIV-1 GFP lacking Vpr or bearing Vpr (1 RT U/ml), or left uninfected (top panel). Percentage of cells with NF-κB translocation coefficient greater than 0.5 plotted as a percentage (bottom panel). Data is analyzed using two-way ANOVA: * (p<0.05), ** (p<0.01), *** (p<0.001), **** (p<0.0001) compared to data from infection with HIV-1 lacking Vpr. (D) Quantification of GFP expression by densitometry for the immunoblot in Figure 6E. (E) Immunoblot detecting flag-Vpr, GFP or actin as a loading control from HEK293T cells transfected with empty vector, flag-tagged WT Vpr encoding vector or flag-tagged mutant Vpr encoding vector and CMV-GFP vector or left untransfected. Size markers are shown in kDa. Quantification of GFP expression by densitometry for the immunoblot is shown below. (F) Quantification of GFP expression by densitometry for the immunoblot in Figure 6G. (G) Immunoblot detecting GFP, or actin as a loading control, from HEK293T cells transfected with CMV-GFP, EF1α-GFP or Ub-GFP plasmids (10 ng, 2 ng, 0.4 ng) and stimulated with TNFα (200 ng/ml) or left unstimulated. Size markers are shown in kDa. Quantification of GFP expression by densitometry for the immunoblot is shown below.
Figure 7 with 1 supplement
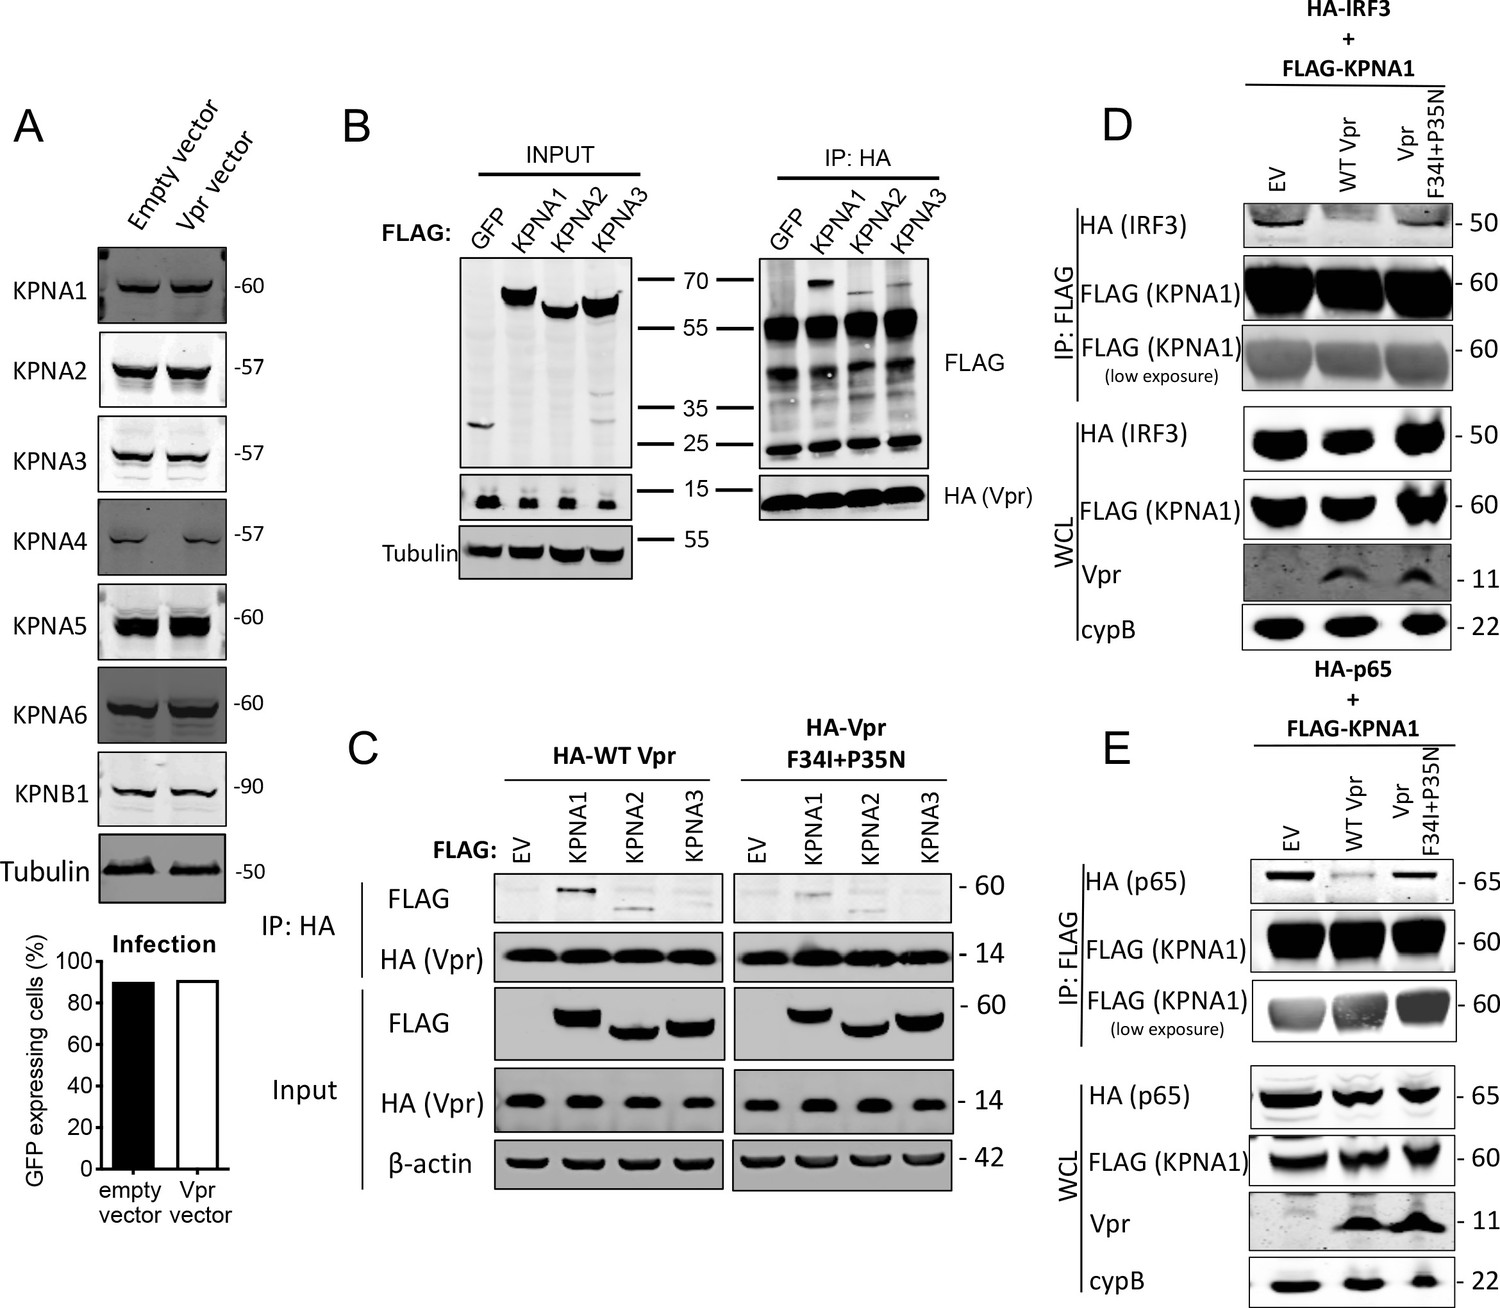
HIV-1 Vpr interacts with karyopherins and inhibits IRF3/NF-κB(p65) recruitment to KPNA1.
(A) Immunoblot detecting KPNA1-6 or KPNB1 from extracted HEK293T cells infected with empty vector, or Vpr encoding vector at a dose of 0.05 RT U/ml (MOI = 2). Size markers are shown in kDa. Percentage infection by HIV-1 GFP bearing Vpr encoding or empty vector is shown on the right. (B) Co-immunoprecipitation of Flag-KPNA1-3 and HA-Vpr. Input shows immunoblot detecting extracted HEK293T whole cell lysates expressing flag-KPNA1-3, flag-GFP and HA-Vpr before immunoprecipitation. Co-immunoprecipitation precipitates Vpr with HA-beads and detects Flag-KPNA1-3. (C) Co-immunoprecipitation of Flag-KPNA1-3 and WT HA-Vpr or HA-Vpr F34I+P35N. Input shows immunoblots detecting HA-Vpr or Flag-KPNA1-3 in extracted HEK293T whole cell lysates (WCL) before immunoprecipitation. β-Actin is detected as a loading control. Co-immunoprecipitation precipitates Vpr with HA-beads and detects Flag-KPNA1-3. (D) Co-immunoprecipitation of HA-IRF3 and Flag-KPNA1 in the presence and absence of WT Vpr or Vpr F34I+P35N to detect competition between Vpr and IRF3 for KPNA1. Input shows immunoblots detecting HA-IRF3 or Flag-KPNA1 or Vpr in extracted HEK293T whole cell lysates (WCL) before immunoprecipitation. CypB is detected as a loading control. Co-immunoprecipitation precipitates KPNA1 with Flag-beads and detects HA-IRF3 in the presence and absence of WT Vpr or inactive Vpr F34I+P35N. (E) Co-immunoprecipitation of HA-NF-κB p65 and Flag-KPNA1 in the presence and absence of WT Vpr or Vpr F34I+P35N to detect competition between Vpr and p65 for KPNA1. Input shows immunoblots detecting HA-p65 or Flag-KPNA1 or Vpr in extracted HEK293T whole cell lysates (WCL) before immunoprecipitation. CypB is detected as a loading control. Co-immunoprecipitation precipitates KPNA1 with Flag-beads and detects HA-p65 in the presence and absence of WT Vpr or Vpr F34I+P35N.
Figure 7—figure supplement 1
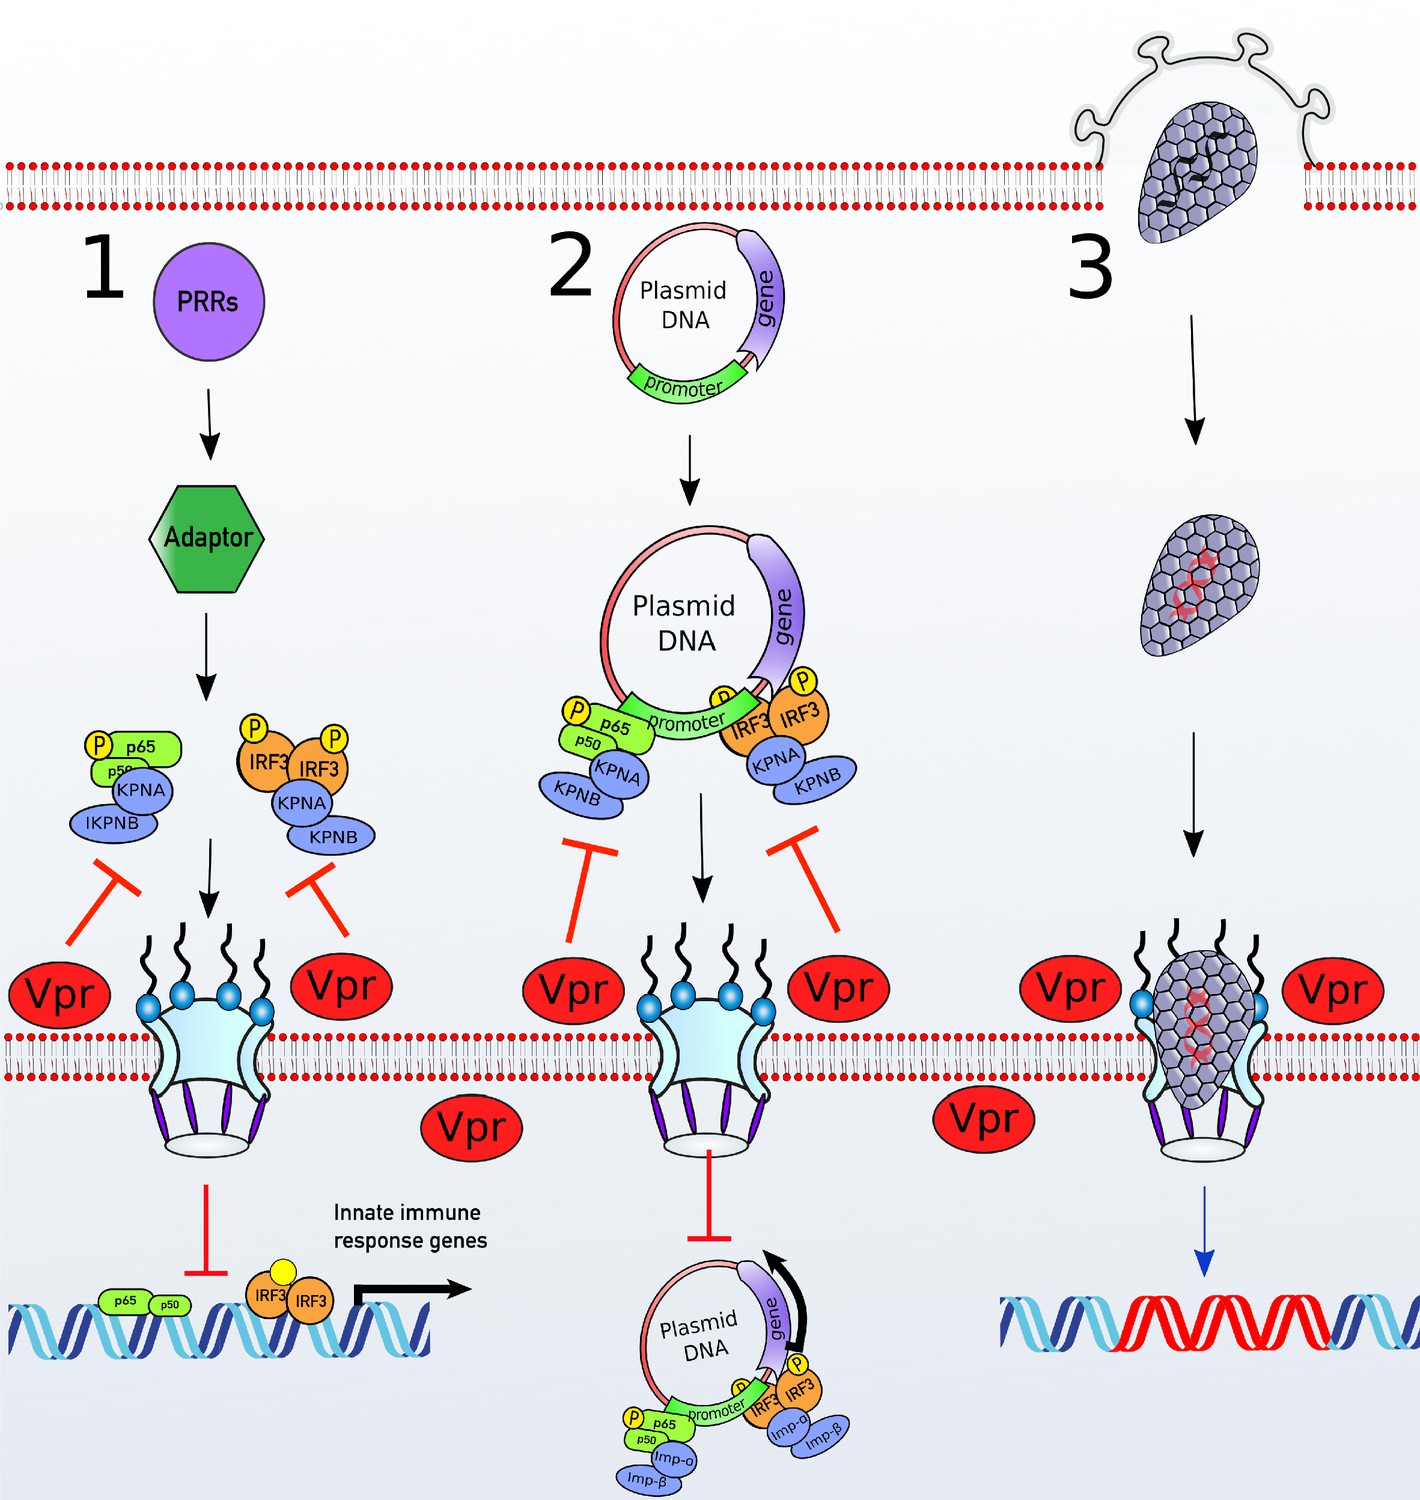
A unifying model of Vpr function.
(1) Stimulation of various PRRs results in activation of transcription factors such as IRF3 and NF-κB. To activate ISGs or proinflammatory genes expression, NF-κB and IRF3 translocate to the nucleus via the classical Karyopherin-α/β-dependent nuclear import pathway. (2) Nuclear import of a plasmid transfected into cellular cytoplasm is essential for gene expression. Transcription factors such as IRF3 and NF-κB bind to their cognate response elements present in the promoter of the plasmid and allow nuclear import via the classical karyopherin-α/β-dependent pathway (Mesika et al., 2001) as well as transcription. (3) HIV-1-based vectors deliver genes to the nucleus in a karyopherin-α/β-independent manner. Vpr localizes to the nuclear pores and targets karyopherin-α-dependent nuclear import in a DCAF1 E3 ubiquitin ligase-dependent manner. This inhibits nuclear translocation of transcription factors such as IRF3 and NF-κB and subsequent antiviral ISG expression. This also inhibits IRF3 and NF-κB-dependent plasmid expression or nuclear import but does not impact lentiviral gene delivery.
Tables
Key resources table
| Reagent type (species) or resource | Designation | Source or reference | Identifiers | Additional information |
|---|---|---|---|---|
| Antibody | anti-FXFG repeats (mouse monoclonal) | Abcam | Cat# ab24609 | IF (1:1000) |
| Antibody | Anti-FLAG tag (mouse monoclonal) | Sigma | Cat# F3165 | IF (1:1000) |
| Antibody | Anti-IRF3 (rabbit polyclonal) | Santa Cruz biotechnology | Cat# sc-9082 | IF (1:400) |
| Antibody | Anti-rabbit alexa fluor 488 IgG (goat polyclonal) | Invitrogen | Cat# A-11008 | IF (1:500) |
| Antibody | Anti-mouse Alexa Fluor 546 IgG (goat polyclonal) | Invitrogen | Cat# A-11030 | IF (1:500) |
| Antibody | Anti-VSV-G (rabbit polyclonal) | Sigma | Cat# V4888 | WB (1:20,000) |
| Antibody | Anti-HIV-1 p24 (mouse monoclonal) | NIH AIDS reagent program | Cat# 3537 | WB (1:1000) |
| Antibody | Anti-STING (Rabbit monoclonal) | Cell Signaling | Cat# 13647 | WB (1:1000) |
| Antibody | Anti-phospho STING (Rabbit monoclonal) | Cell Signaling | Cat# 19781 | WB (1:1000) |
| Antibody | Anti-TBK1 (Rabbit monoclonal) | Cell Signaling | Cat# 3504S | WB (1:1000) |
| Antibody | Anti-phospho TBK1 (Rabbit monoclonal) | Cell Signaling | Cat# 5483 | WB (1:1000) |
| Antibody | Anti-IRF3 (Rabbit monoclonal) | Cell Signaling | Cat# 4302 | WB (1:1000) |
| Antibody | Anti-phospho -IRF3 S386 (Rabbit monoclonal) | Abcam | Cat# ab76493 | WB (1:1000) |
| Antibody | Anti-phospho- IRF3 S396 (Rabbit monoclonal) | Cell signaling | Cat# D6O1M | Flow Cytometry (1:50) |
| Antibody | Anti-actin (mouse polyclonal) | Abcam | Cat# ab8227 | WB (1:20,000) |
| Antibody | Anti-cGAS (rabbit monoclonal) | Cell Signaling Technology | Cat# 15102 | WB (1:1000) |
| Antibody | Anti-MAVS (mouse polyclonal) | Cell Signaling Technology | Cat# 3993 | WB (1:1000) |
| Antibody | Anti-DCAF1(rabbit polyclonal) | Bethyl | Cat# A301-887A | WB (1:1000) |
| Antibody | Anti-Nup358 (rabbit polyclonal) | Abcam | Cat# ab64276 | WB (1:1000) |
| Antibody | Anti-FLAG (mouse monoclonal) | Sigma | Cat# F3165 | WB (1:1000) |
| Antibody | Anti-GFP (rabbit polyclonal) | Abcam | Cat# ab6556 | WB (1:20,000) |
| Antibody | Anti-KPNA1 (rabbit polyclonal) | ABclonal | Cat# A1742 | WB (1:1000) |
| Antibody | Anti-KPNA2 (rabbit polyclonal) | ABclonal | Cat# A1623 | WB (1:1000) |
| Antibody | Anti-KPNA3 (rabbit polyclonal) | ABclonal | Cat# A8347 | WB (1:1000) |
| Antibody | Anti-KPNA4 (rabbit polyclonal) | ABclonal | Cat# A2026 | WB (1:1000) |
| Antibody | Anti-KPNA5 (rabbit polyclonal) | ABclonal | Cat# A7331 | WB (1:1000) |
| Antibody | Anti-KPNA6 (rabbit polyclonal) | ABclonal | Cat# A7363 | WB (1:1000) |
| Antibody | Anti-KPNB1 (rabbit polyclonal) | ABclonal | Cat# A8610 | WB (1:1000) |
| Antibody | Anti-CypB (rabbit polyclonal) | Abcam | Cat# ab16045 | WB (1:5000) |
| Antibody | Anti-HA (rabbit polyclonal) | Sigma | Cat# H6908 | WB (1:1000) |
| Antibody | Anti-Vpr (rabbit polyclonal) | NIH AIDS reagents programme | Cat# 11836 | WB (1:1000) |
| Antibody | Anti-mouse IgG IRdye 800CW (goat poly clonal) | LI-COR Biosciences | Cat# 926–32210 | WB (1:10,000) |
| Antibody | Anti-rabbit IgG IRdye 800CW (goat poly clonal) | LI-COR Biosciences | Cat# 926–32211 | WB (1:10,000) |
| Other | Herring testes DNA | Sigma | Cat# D6898 | Amount used stated in text |
| Other | cGAMP | Invivogen | Cat code (tlrl-nacga23-1) | Amount used stated in text |
| Other | Poly I:C | Invivogen | Cat code (tlrl-pic) | Amount used stated in text |
| Other | Lipopolysaccaride | Invivogen | Cat code (tlrl-smlps) | Amount used stated in text |
Additional files
Download links
A two-part list of links to download the article, or parts of the article, in various formats.
Downloads (link to download the article as PDF)
Open citations (links to open the citations from this article in various online reference manager services)
Cite this article (links to download the citations from this article in formats compatible with various reference manager tools)
HIV-1 Vpr antagonizes innate immune activation by targeting karyopherin-mediated NF-κB/IRF3 nuclear transport
eLife 9:e60821.
https://doi.org/10.7554/eLife.60821


