Structural basis of αE-catenin–F-actin catch bond behavior
- Scintillon Institute, United States
- Departments of Structural Biology and Molecular & Cellular Physiology, Stanford University School of Medicine, United States
- Department of Structural Biology and Chemistry, Pasteur Institute, France
Figures
Figure 1
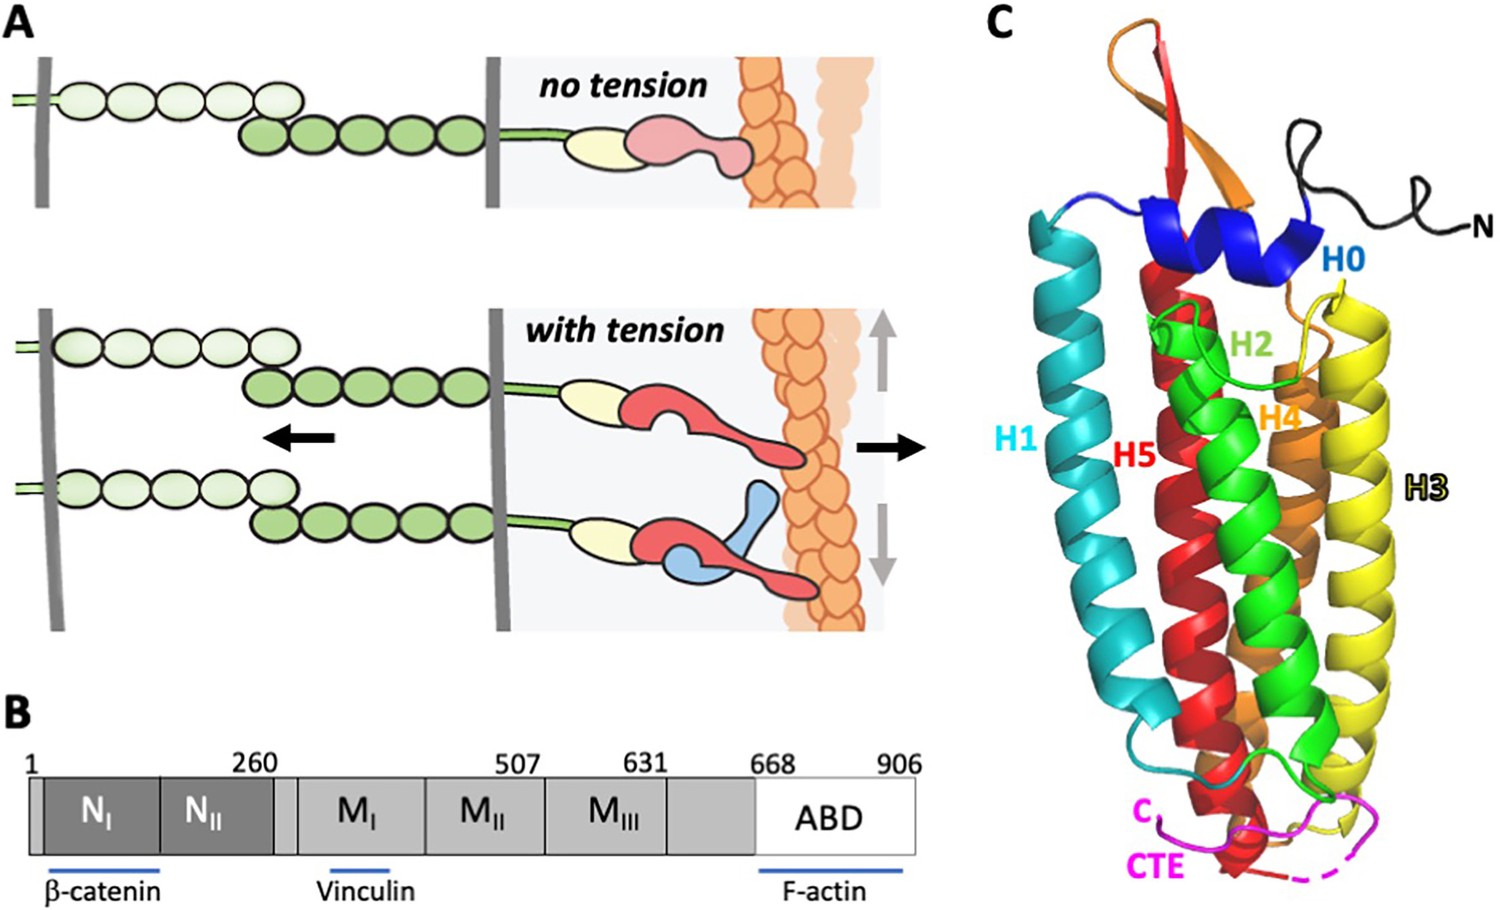
α-Catenin in adherens junctions.
(A) Schematic of AJ and the role of αE-catenin in the connection to the actin cytoskeleton. The extracellular region of cadherins (green) bind to one another between cells, and their cytoplasmic domains bind to β-catenin (yellow). β-Catenin binds to α-catenin (pink/red), which binds to F-actin (orange) weakly in the absence of force (top panel). Tension (indicated by arrows) favors the strong actin-binding state of α-catenin, and also produces conformational changes in α-catenin that lead to recruitment of vinculin (light blue). While the net direction of the force is likely perpendicular to the junction (black arrows), there will be local force components along the mixed-polarity filaments toward their pointed (-) ends through actomyosin contractility (grey arrows). (B) Primary structure of αE-catenin; binding sites for β-catenin, vinculin and F-actin are indicated. (C) Crystal structure of αE-catenin ABD (Ishiyama et al., 2018) (PDB 6dv1); the five helices H1-H5, the N-terminal capping helix H0, and the C-terminal extension (CTE) are labeled.
Figure 2 with 5 supplements
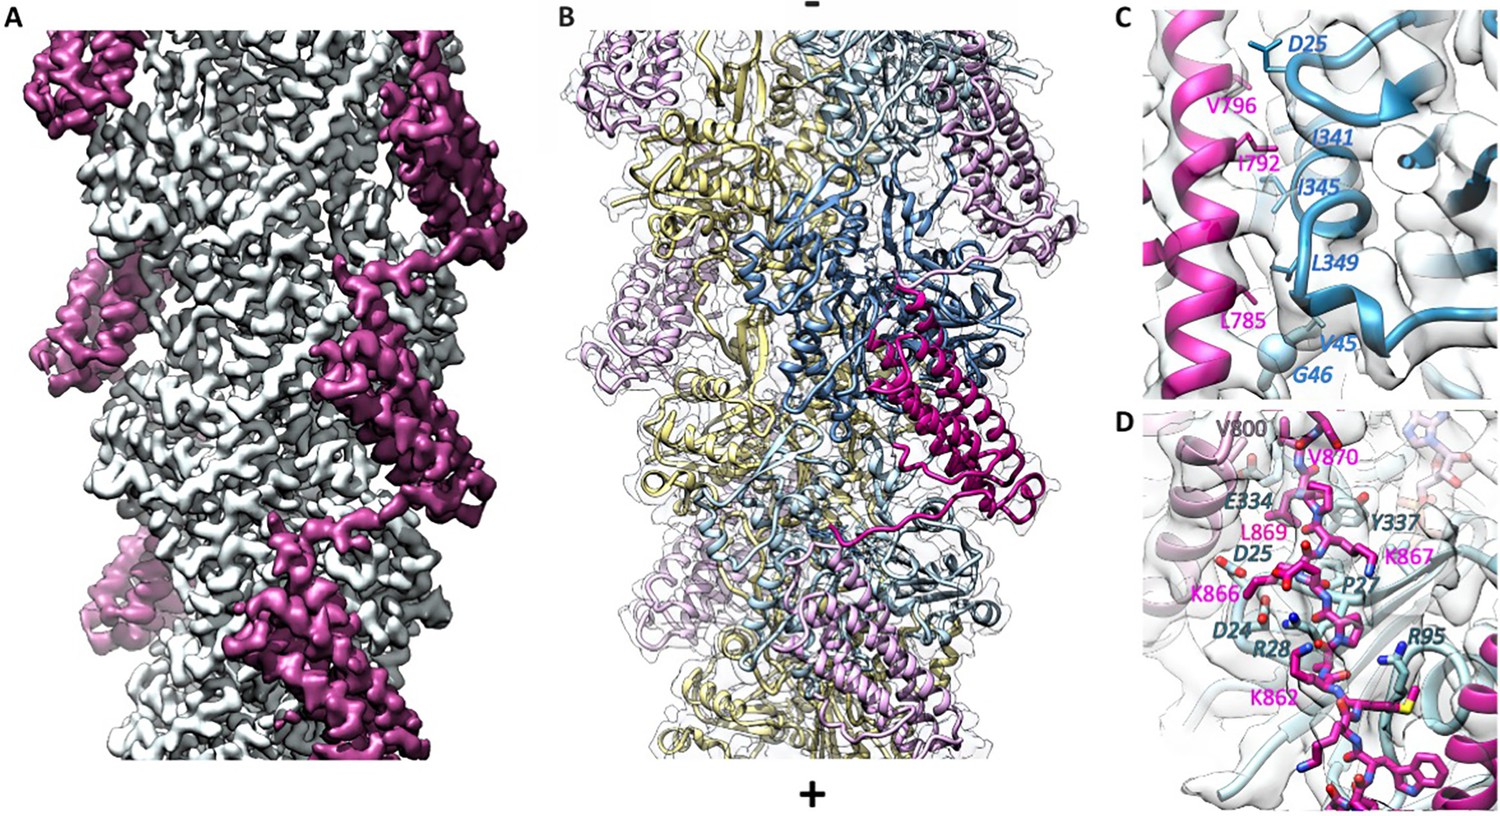
Cryo-EM analysis of the αE-catenin ABD–F-actin complex.
(A) Cryo-EM map of the actin-ABD structure. The segmented ABDs are shown in magenta. The (-) end of the filament is shown at the top, and the (+) end at the bottom. (B) Molecular model of a section of an actin filament bound to αE-catenin ABDs, same orientation as (A) and with transparent density map overlaid. Actin protomers are colored according to their long-pitch helix in blue and yellow. The bound ABDs are shown in magenta and pink. (C, D) Closeups of model and cryo-EM map showing residues on H4 (panel C) and the CTE (panel D) that have been studied by site-directed mutagenesis. The ABD is shown in red, and two monomers of actin in different shades of blue. In (D), a neighboring copy of the ABD along the filament is shown in pink. Actin residue labels are italicized.
Figure 2—figure supplement 1
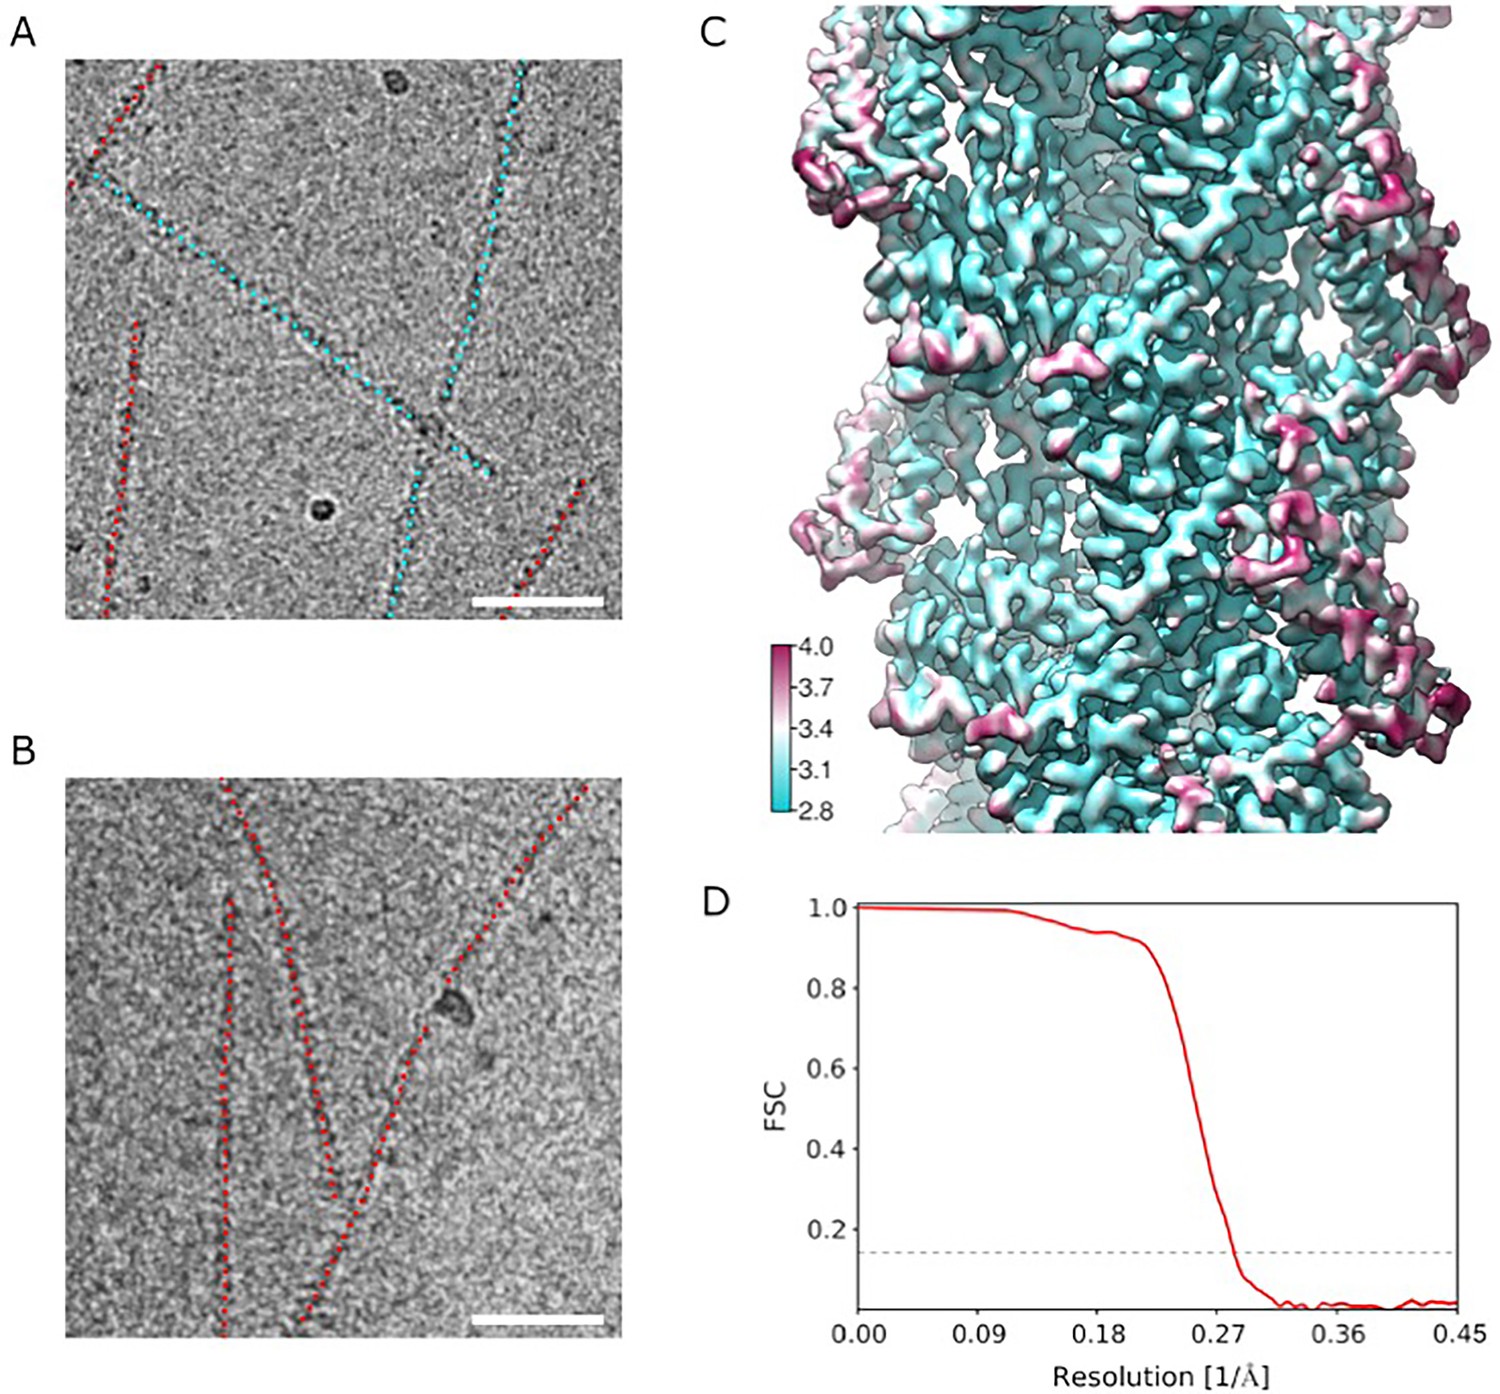
Cryo EM analysis.
(A, B) Representative micrographs of actin filaments in the presence of truncated 671–906 ABD (A) and full-length ABD (B). Segments recognized as bare are marked with red dots, segments recognized as having ABD bound are marked with cyan dots. Scale bars are 50 nm. (C) Local resolution analysis. (D) Fourier Shell Correlation (FSC) curves using two reconstructions independently derived from two halves of the data. The 0.143 FSC cutoff used for estimating the resolution is indicated as a dashed line.
Figure 2—figure supplement 2
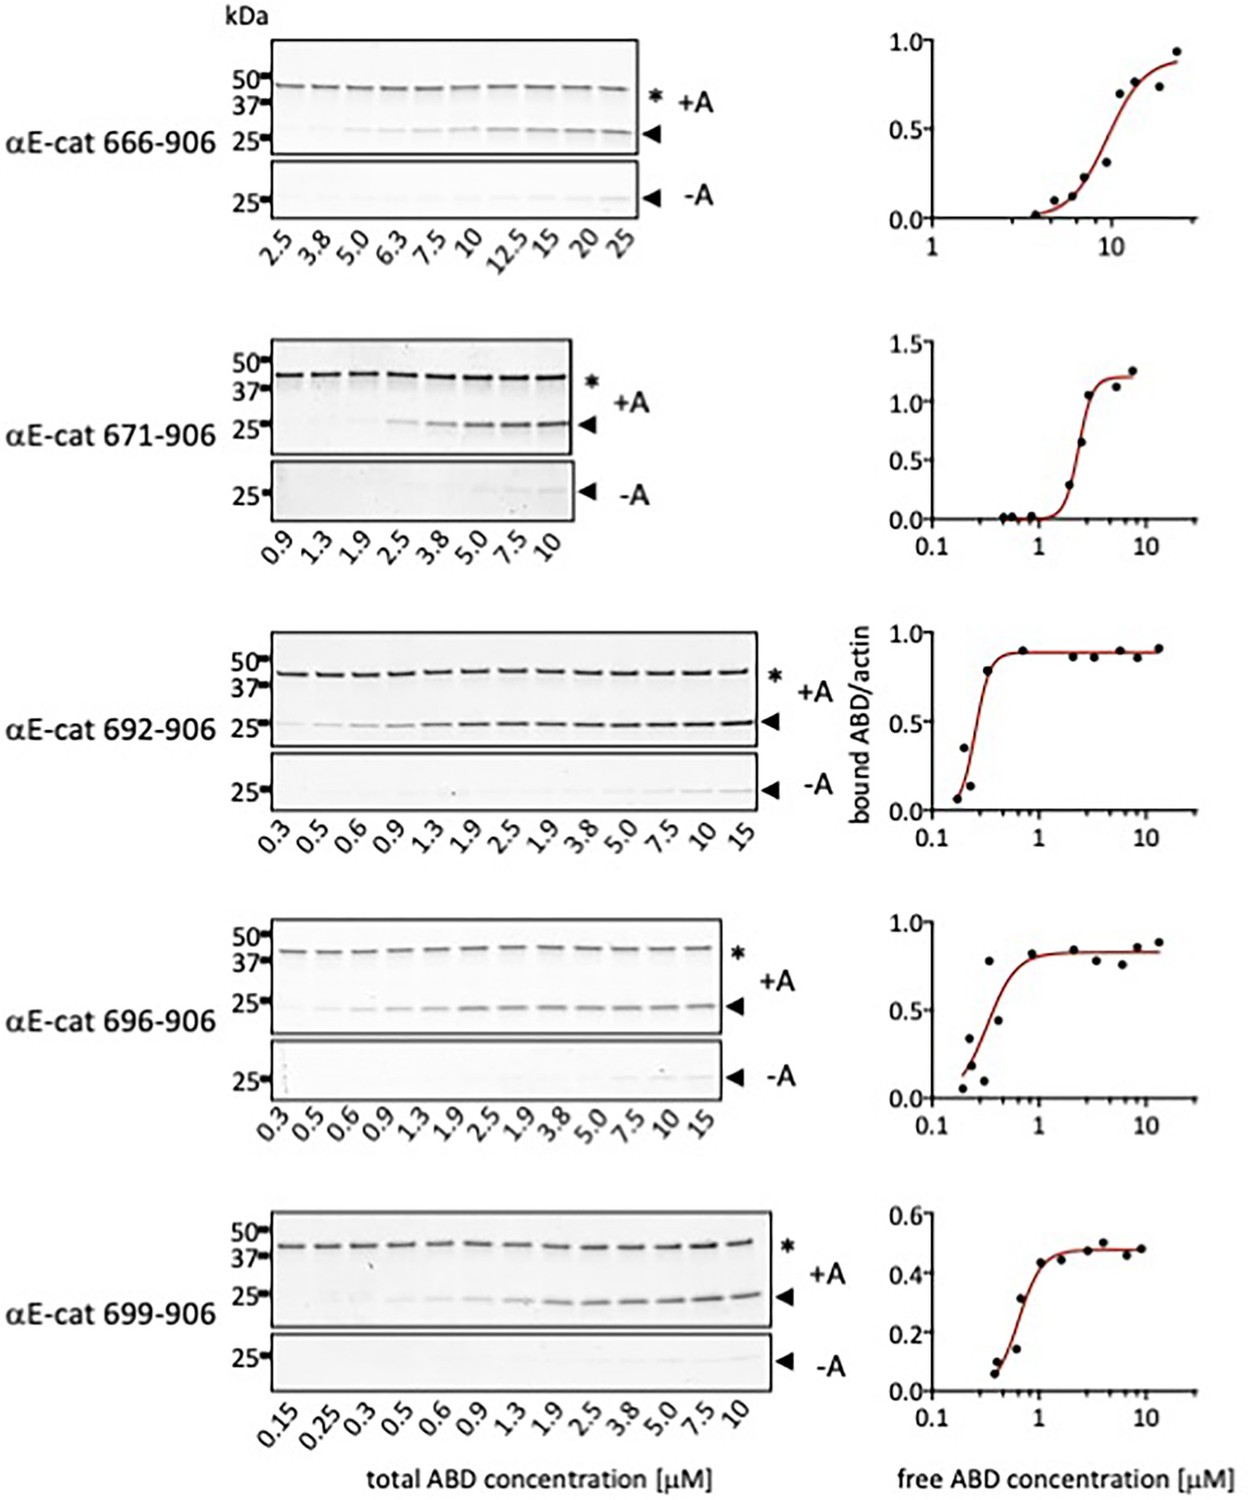
Representative gels and binding curves for actin co-sedimentation assays with αE-catenin N-terminal deletion constructs.
Pellets of actin co-sedimentation assays with (+A) and without (-A) F-actin are shown. * Indicates the actin band and the arrow indicates the ABD band.
Figure 2—figure supplement 3
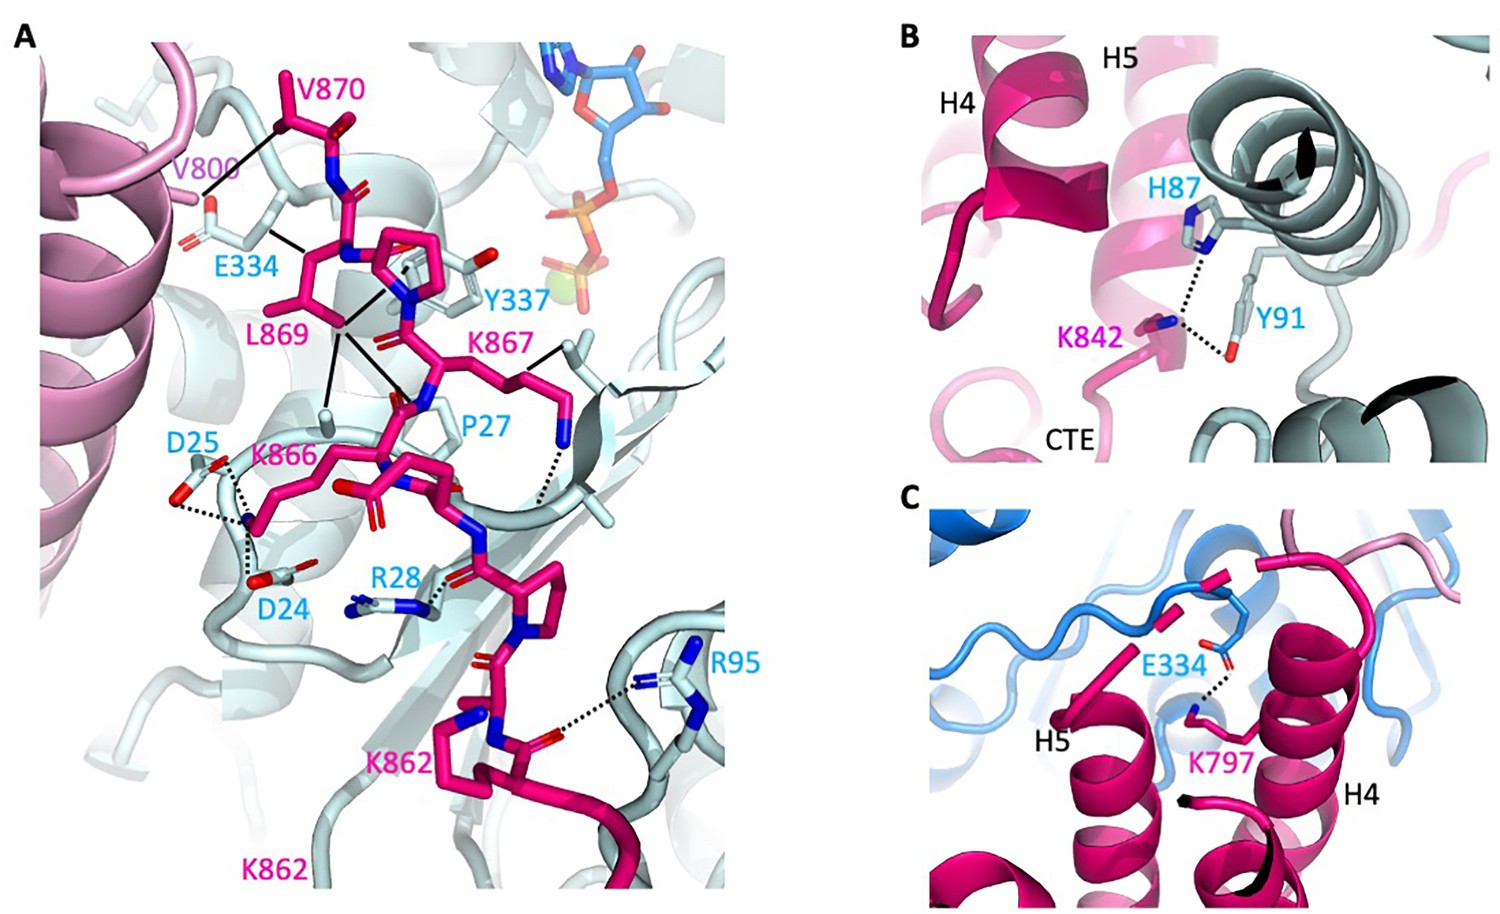
Close-up of αE-catenin–F-actin interactions.
Colors are as shown in Figure 2. Hydrogen bonds are shown as dashed lines, and van der Waals contacts as solid lines. (A) Interactions of the αE-catenin CTE. (B) Interaction of αE-catenin K842 actin residues H87 and Y91. (C) αE-catenin K797 salt bridge with actin E334.
Figure 2—figure supplement 4

Representative gels and binding curves for actin co-sedimentation assays with αE-catenin C-terminal deletion constructs.
Pellets of actin co-sedimentation assays with (+A) and without (-A) F-actin are shown. * Indicates the actin band and the arrow indicates the ABD band.
Figure 2—figure supplement 5
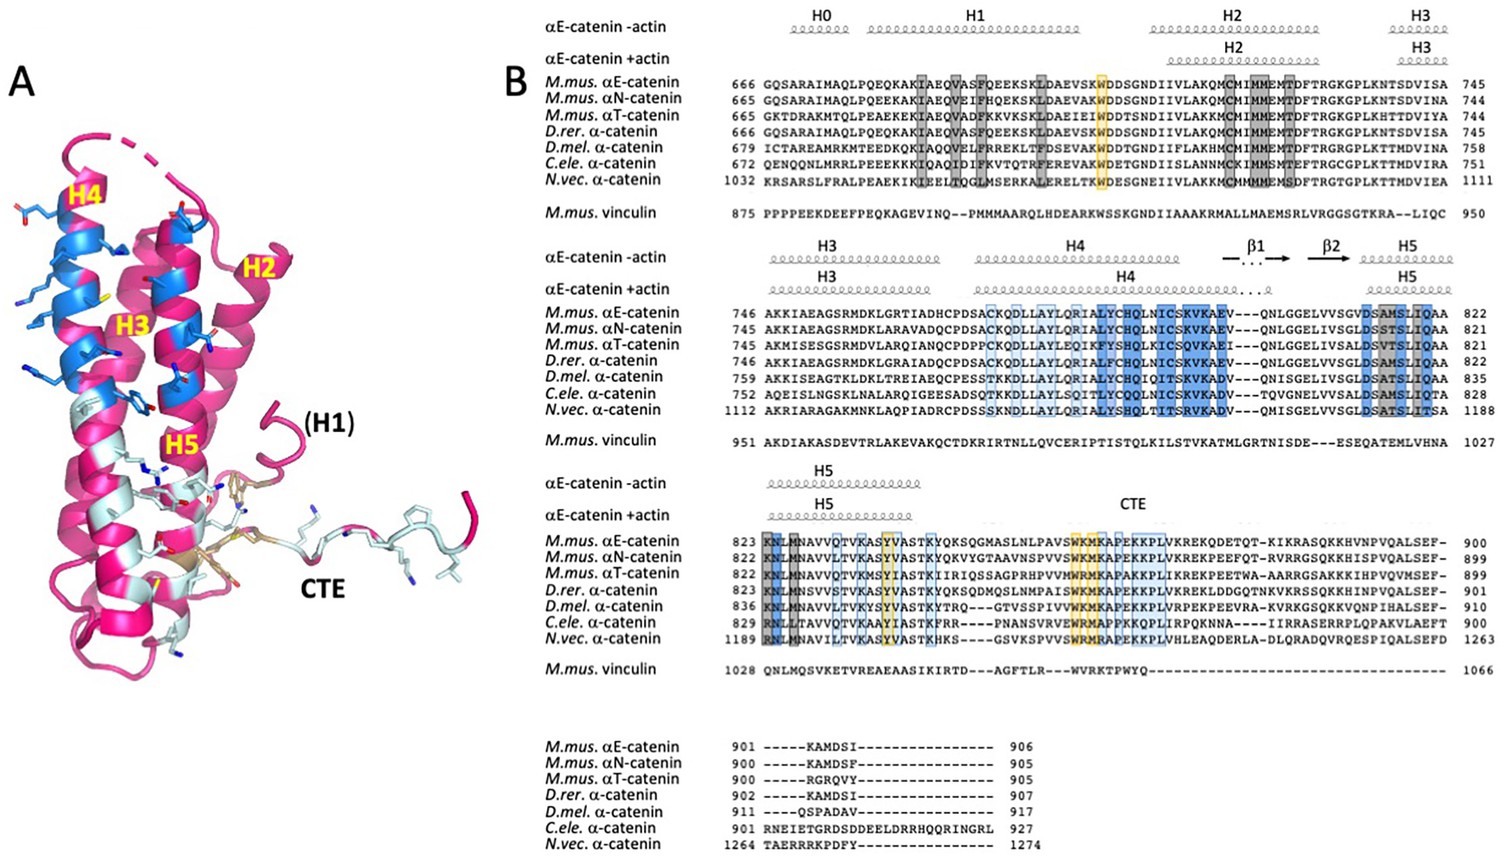
Alignment of α-catenin and vinculin ABD sequences.
(A) Residues that contact actin are shown in stick representation and colored in dark and light blue according to which actin protomer they contact, as shown Figure 2. The hydrophobic cluster residues W705, Y837 and W859 are shown in light orange. (B) ABD sequence alignments. The secondary structure elements of the unbound ABD and the actin-bound ABD are shown above the alignments. Residues that contact actin and the hydrophobic cluster residues are highlighted in the colors used in panel A. Residues in grey form the interface between H1 and H2/H5. The sequence alignment was done in Geneious 10.2.2 (www.geneious.com). The figure was prepared with ENDscript (Robert and Gouet, 2014) and UCSF Chimera (Pettersen et al., 2004). Abbreviations used M.mus.-Mus musculus D.rer. - Danio rerio, D.mel. – Drosopila melanogaster, C. ele. - Caenorhabditis elegans N.vec. - Nematostella vectensis.
Figure 3 with 2 supplements
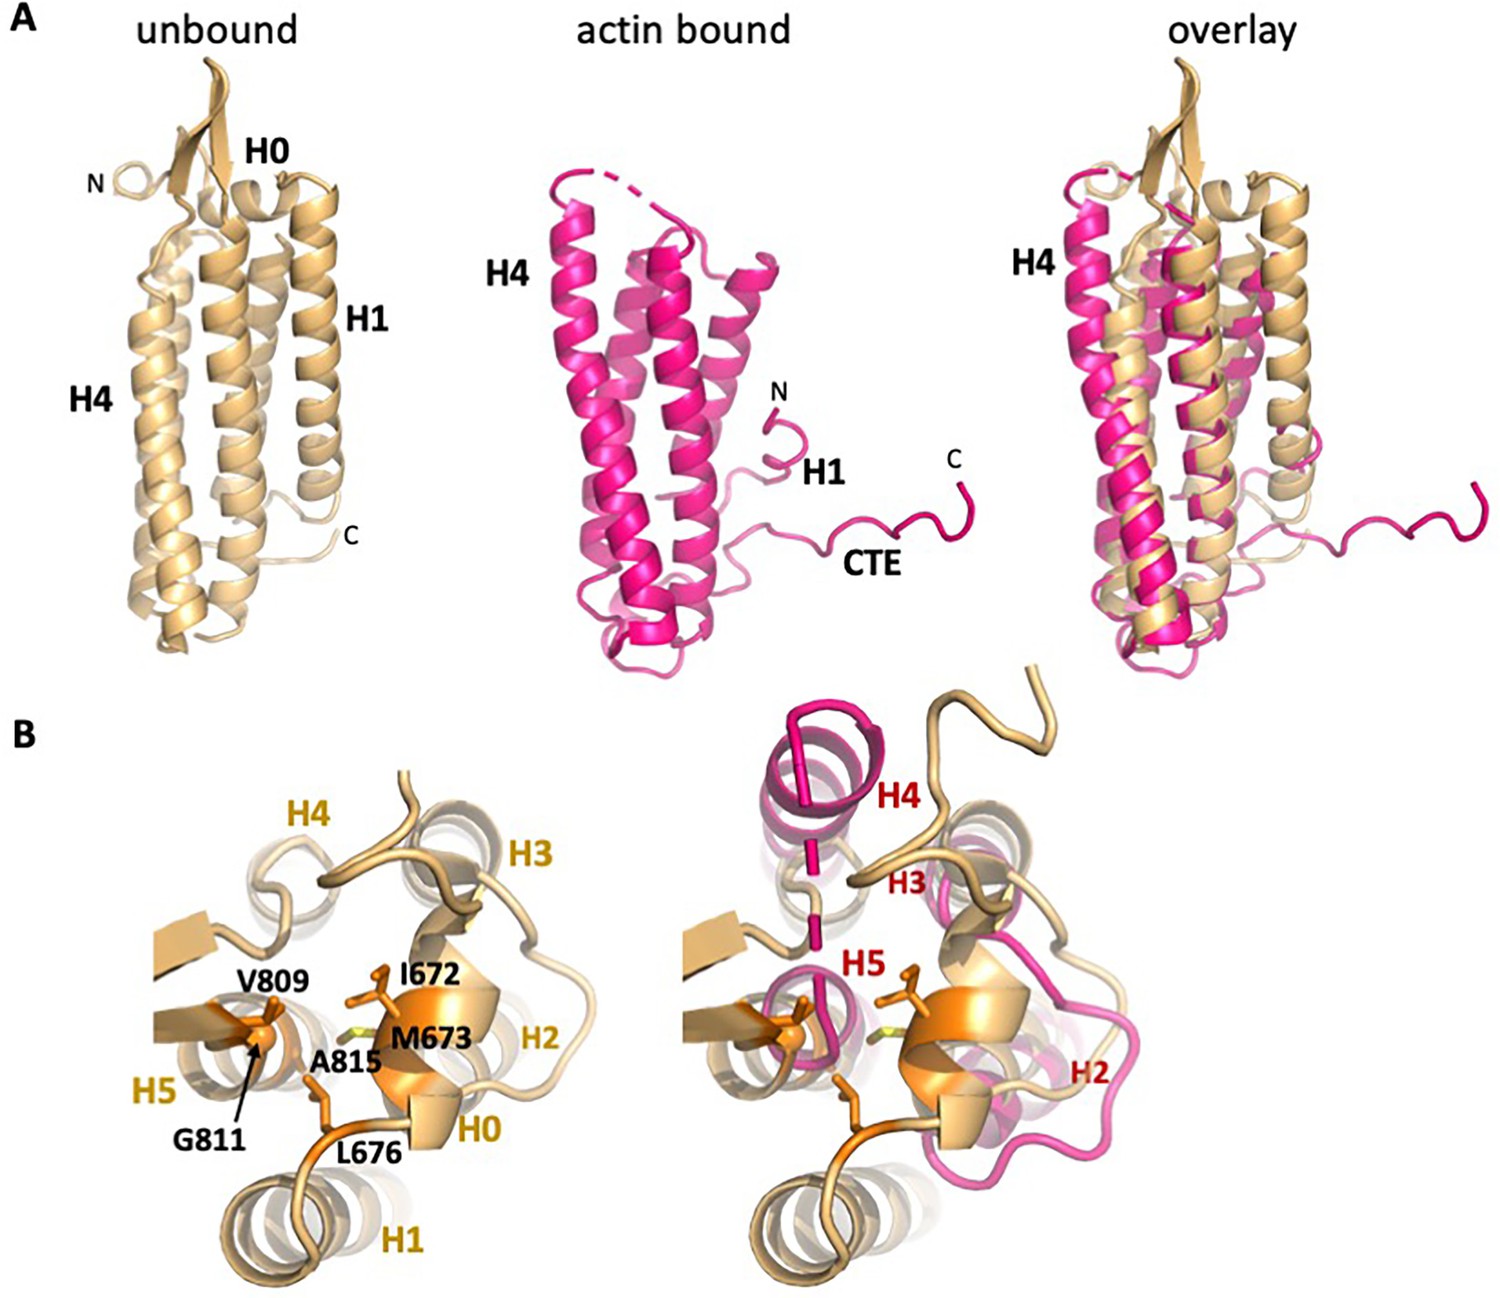
Overall changes in ABD structure upon binding to F-actin.
Comparison of the unbound ABD crystal structure (PDB 6dv1; light orange) with the ABD in the actin-bound state (magenta). (A) Overall comparison; the orientation is rotated approximately 180° from that shown in Figure 1c. (B) Top view of H0 packing interactions lost upon its removal, and rearrangements of helices 2–5. The left panel depicts packing interactions of H0 residues I672, M673 and L676 with H5 residues V809, G811 and A815 (all highlighted in orange), and the right panel overlay shows the resulting changes in H4 and H5.
Figure 3—figure supplement 1
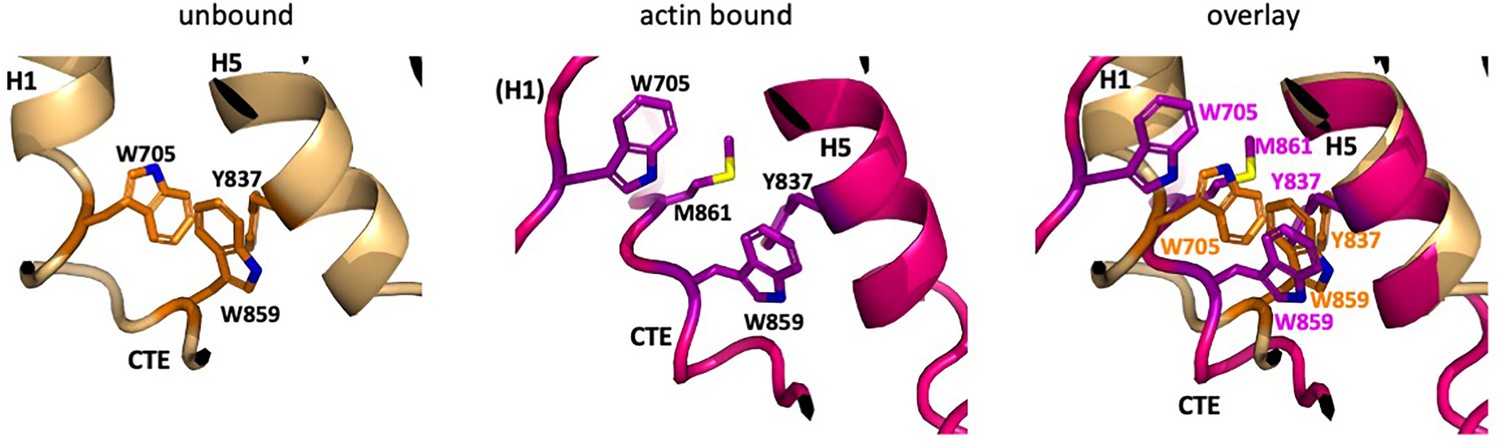
Differences in the CTE free and bound to F-actin.
In the actin-bound state, the aromatic cluster of W705 in H1, Y837 in H5, and W859 in the CTE repacks due to the shift in position of the remaining turn of H1, which pulls W705 away from Y837 and W859 and is replaced by M861 of the CTE. Colors are the same as in Figure 3.
Figure 3—figure supplement 2

Comparison of free and actin-bound αE-catenin and vinculin ABDs.
The orientations are the same as in Figure 3A. (A) The free vinculin (slate blue; PDB 1qkr Bakolitsa et al., 1999) and αE-catenin (light orange; PDB 6dv1 Ishiyama et al., 2018) ABDs superimpose with an RMSD of 1.2 Å. (B) The actin-bound vinculin (grey; PDB 3jb1 Kim et al., 2016) and αE-catenin (magenta) ABDs superimpose with an RMSD of 1.3 Å. (C) Superposition of the free (slate blue) and actin-bound vinculin (grey) ABDs, RMSD = 1.5 Å.
Figure 4
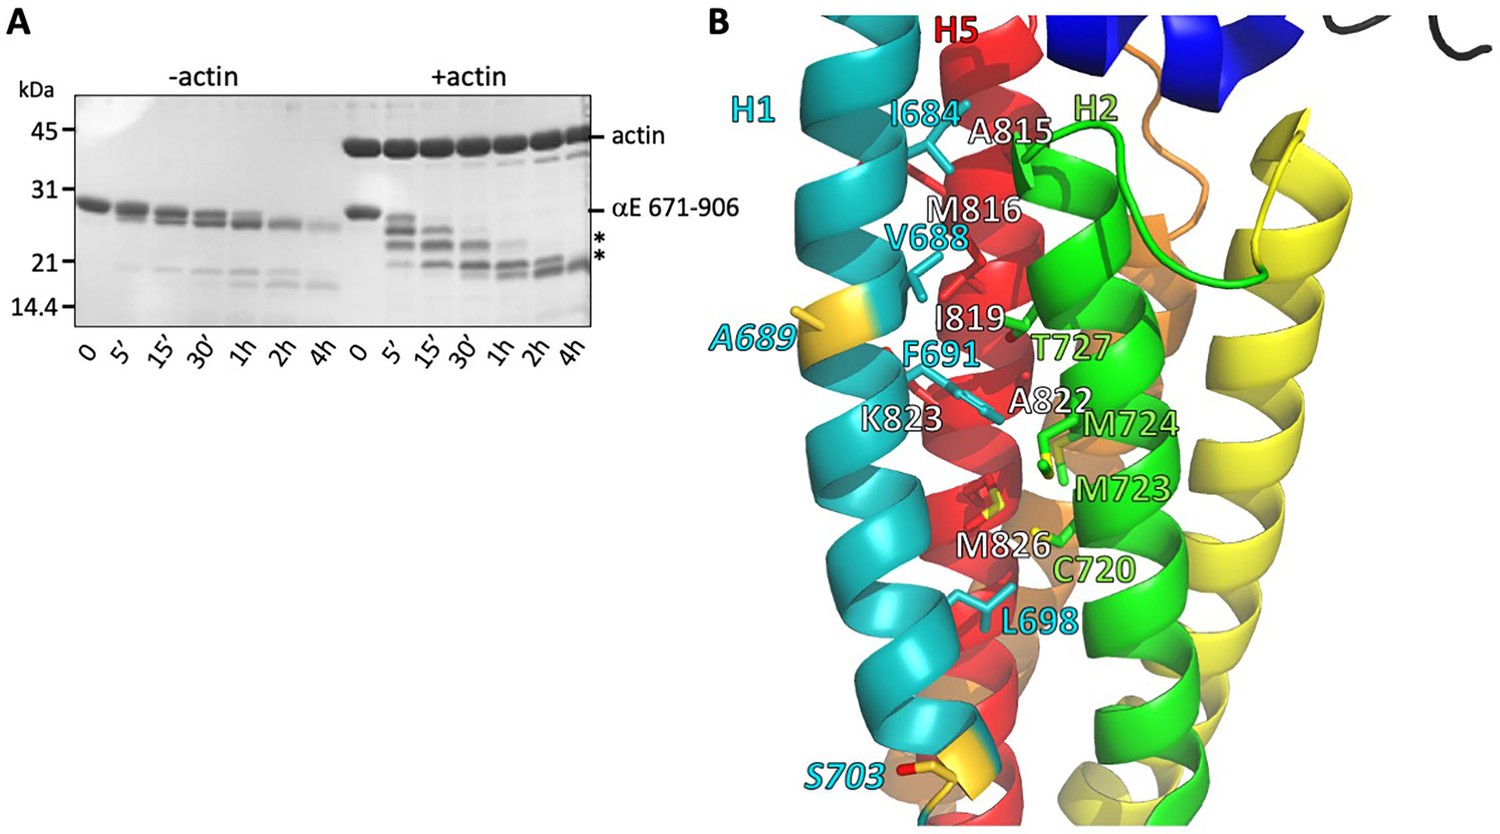
Stability of the H1- H2/H5 interface.
(A) Time course of elastase digestion of αE-catenin 671–906. The two smaller fragments analyzed by N-terminal sequencing are indicated with asterisks. (B) Rainbow diagram of the unbound αE-catenin ABD (PDB 6dv1), colored as in Figure 1c. Residue labels for the H5 (red) helix are shown in white for clarity. The two residues at the elastase cut sites are indicated in gold. Side chains in the H1- H2/H5 interface are shown in stick representation.
Figure 5 with 1 supplement

Model of the weak and strong actin-binding states of αE-catenin.
(A) Superposition of the isolated αE-catenin ABD on the actin-bound structure reveals no major clashes with F-actin (left panel). When the ABD is bound to F-actin, H0 and H1 dissociate from the H2-5 bundle, which results in the extension and shift of the C-terminal part of H4 as well as ordering and repositioning of the CTE to bind to actin. (B) Schematic diagram of αE-catenin ABD conformational states when unbound, weakly bound, and strongly bound to actin. Cooperative binding of the ABD, as observed in the cryo-EM structure, is illustrated for the strong state. Note that in the strong state, the H0 and H1 regions are drawn as helices when dissociated from the H2-5 bundle, but it is likely that they are unstructured in this case (see text for details).
Figure 5—figure supplement 1
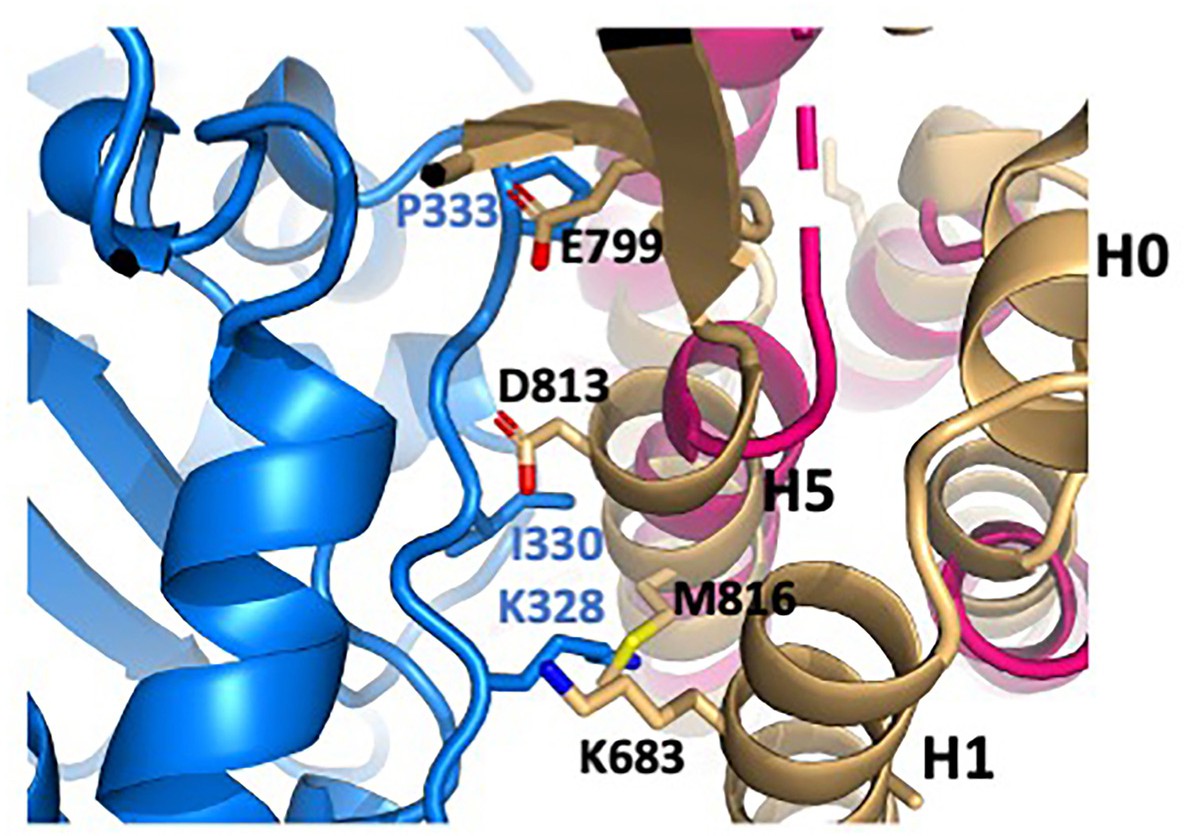
Clash of isolated ABD structure with actin.
The isolated ABD structure (light orange; PDB 6dv1) was superimposed on the actin-bound structure (magenta). Actin is shown in blue. αE-catenin residues K683 (H1), E799 (H4-H5 connector), and D813 and M816 (H5) clash with actin residues K328, I330 and P333. Comparison with the actin-bound ABD shows that small movements associated with at least partial removal of H1 would relieve these clashes.
Figure 6

Model of directional catch bonding.
Actin and the αE-catenin ABD in the strong and weak states are illustrated as in Figure 5B. The N-terminus of the ABD is shown tethered to a stationary point, that is, as part of the cadherin/β-catenin/α-catenin complex. The grey arrows indicate the direction of force. (A) Tension applied to the bound strong state prevents re-binding of H0/H1 to the H2-H5 bundle. Force applied in the (-) direction will move the H1 sequence away from the H2-H5 bundle and place this region in an unfavorable orientation for rebinding, whereas force directed in the (+) direction will place the H1 sequence closer to and in a more favorable orientation for rebinding. See Video 1 for an animated version. (B) Tension applied to the bound weak state will remove H0/H1 from the H2-H5 bundle. Force applied in the (-) direction will tend to pull H0/H1 away from the H2-H5 bundle, whereas force in the (+) direction is predicted to have a smaller effect on H0/H1 dissociation. See Video 2 for an animated version.
Videos
Video 1
The strong to weak transition.
Animation illustrating changes in the αE-catenin ABD going from the strong to weak actin-bound state. The first half of the movie shows force is applied in the (-) direction, and the second half shows force in the (+) direction, highlighting the difference in distance for reassociation of H0 and H1 in the two directions.
Video 2
The weak to strong transition.
Animation illustrating changes in the αE-catenin ABD in going from the weak to strong actin-bound state. The first half of the movie shows force is applied in the (-) direction, and the second half shows force in the (+) direction, highlighting the difference in distance for reassociation of H0 and H1 in the two directions.
Tables
Table 1
Cryo-EM data collection and model statistics.
| Data collection | |
|---|---|
| Microscope | Titan Krios |
| Voltage [kV] | 300 |
| Detector | Falcon II |
| Magnification | 75,000 |
| Exposure parameters | |
| Total dose [e-/Å2] | 60 |
| Exposure time [s] | 1.0 |
| Pixel size [Å] | 1.035 |
| Defocus range [μm] | −0.8 to −2.8 |
| Data processing | |
| Images used | 4769 |
| Initial segments | 728,331 |
| Final segments | 422,822 |
| Helical symmetry | |
| Rise [Å] | 27.4 |
| Twist [°] | −166.9 |
| Resolution [Å] | 3.6 |
| FSC threshold | 0.143 |
| Sharpening B-factor [Å2] | −96 |
| Refinement | |
| Initial models [PDB IDs] | 6djo, 6dv1 |
| Non-hydrogen atoms | 25,248 |
| Model resolution [Å] | 3.5 |
| FSC threshold | 0.5 |
| RMS deviations | |
| Bond lengths [Å] | 0.007 |
| Bond angles [°] | 0.92 |
| Rotamer outliers [%] | 4.4 |
| Mean B-factor [Å2] | 70.4 |
| Validation | |
| Molprobity score | 2.08 |
| Clash score | 6.28 |
| Ramachandran plot | |
| Favored [%] | 96.3 |
| Allowed [%] | 3.7 |
| Disallowed [%] | 0.0 |
| CC (mask) | 0.86 |
| CC (volume) | 0.82 |
| EMringer score | 2.29 |
Table 2
Affinities of αE-catenin ABD constructs for actin, determined by co-sedimentation.
KD values and standard deviations for αE-catenin 666–906, 671–906, and 692–906 are the average of three replicate measurements. KD values for the other constructs are the average of two measurements. For αE-catenin 671–906 W859A binding did not reach saturation and therefore only a lower limit for the KD is given. N.D., no detectable binding. Representative binding curves and corresponding gels are shown in Figure 2—figure supplements 2 and 4.
| αE-catenin ABD variant | KD (μM) (SD) |
|---|---|
| 666–906 (full length) | 8.5 (0.7) |
| 671–906 | 2.0 (0.3) |
| 692–906 | 0.7 (0.3) |
| 696–906 | 0.4 (0.05) |
| 699–906 | 0.5 (0.1) |
| 671–872 | 5.0 (0.1) |
| 671–868 | N.D. |
| 671–864 | N.D. |
| 699–868 | 2.8 (0.1) |
| 671–906 W859A | >35 |
Key resources table
| Reagent type (species) or resource | Designation | Source or reference | Identifiers | Additional information |
|---|---|---|---|---|
| Recombinant DNA reagent | pGEX-TEV | Choi et al., 2012 https://doi.org/10.1074/jbc.M511338200 | Ampicillin resistance; expression in bacterial cultures; pGEX-KG plasmid (ATCC) with a new TEV protease site Contact Weis lab for distribution | |
| Recombinant DNA reagent | pGEX-4T-3 | GE Healthcare | 28-9545-52 | Vector for thrombin-cleavable GST fusion protein expression in bacteria |
| Strain, strain background (Escherichia coli) | BL21 (DE3) Codon-Plus RIL | Agilent | 230245 | Strain for expressing recombinant proteins |
| Software, algorithm | RELION3 3.0.8 | He and Scheres, 2017 https://doi.org/10.1016/j.jsb.2017.02.003 Scheres, 2012https://doi.org/10.1016/j.jmb.2011.11.010 Zivanov et al., 2018https://doi.org/10.7554/eLife.42166 | RRID:SCR_016274 | |
| Software, algorithm | MotionCor2 1.3.0 | Zheng et al., 2017 https://doi.org/10.1038/nmeth.4193 | RRID:SCR_016499 | |
| Software, algorithm | Gctf 1.06 | Zhang, 2016 https://doi.org/10.1016/j.jsb.2015.11.003 | RRID:SCR_016500 | |
| Software, algorithm | CTFFIND4 4.1.5 | Rohou and Grigorieff, 2015https://doi.org/10.1016/j.jsb.2015.08.008 | RRID:SCR_016732 | |
| Software, algorithm | pyCoAn 0.3.0 | Volkmann and Hanein, 1999 https://doi.org/10.1006/jsbi.1998.4074 | Revision 1419 | |
| Software, algorithm | Phenix 1.17.1 | Afonine et al., 2018https://doi.org/10.1107/S2059798318006551 | RRID:SCR_014224 | |
| Software, algorithm | Coot 0.8.9 | Emsley et al., 2010https://doi.org/10.1107/S0907444910007493 | RRID:SCR_014222 | |
| Software, algorithm | EMRinger | Barad et al., 2015 https://doi.org/10.1038/nmeth.3541 | Via Phenix | |
| Software, algorithm | MolProbity | Chen et al., 2010 https://doi.org/10.1107/S0907444909042073 | RRID:SCR_014226 Via Phenix | |
| Software, algorithm | ResMap 1.14 | Kucukelbir et al., 2014 https://doi.org/10.1038/nmeth.2727 | ||
| Software, algorithm | SBGrid | Morin et al., 2013https://doi.org/10.7554/eLife.01456 | RRID:SCR_003511 | |
| Software, algorithm | UCSF Chimera 1.14 | Pettersen et al., 2004https://doi.org/10.1002/jcc.20084 | RRID:SCR_004097 | |
| Software, algorithm | GraphPad Prism 8.0.2 | GraphPad Software, Inc | Version 263 RRID:SCR_002798 |
Additional files
Download links
A two-part list of links to download the article, or parts of the article, in various formats.
Downloads (link to download the article as PDF)
Open citations (links to open the citations from this article in various online reference manager services)
Cite this article (links to download the citations from this article in formats compatible with various reference manager tools)
Structural basis of αE-catenin–F-actin catch bond behavior
eLife 9:e60878.
https://doi.org/10.7554/eLife.60878


