Phenotypic analysis of the unstimulated in vivo HIV CD4 T cell reservoir
- Gladstone Institutes, United States
- Department of Urology, University of California, San Francisco, United States
- Centre for Virus Research, the Westmead Institute for Medical Research, The University of Sydney, Australia
- San Francisco Veterans Affairs (VA) Medical Center and University of California, San Francisco, United States
- Department of Medicine, University of California, San Francisco, United States
- Division of HIV, Infectious Diseases and Global Medicine, University of California, San Francisco, United States
- Department of Medicine, Division of Gastroenterology, San Francisco General Hospital and University of California, San Francisco, United States
- Department of Pathology, University of California, San Francisco, United States
- Division of Infectious Diseases, School of Medicine, University of North Carolina at Chapel Hill, United States
- Division of Experimental Medicine, University of California, San Francisco, United States
Figures
Figure 1

Validation of PP-SLIDE as a method to trace reactivated J-Lat clones to their parent.
(A) Schematic. J-Lat clones 5A8 or 6.3 were phenotyped using CyTOF in the absence of stimulation (a); 6.3 was additionally stimulated for 40 hr with PMA/ionomycin and then phenotyped using CyTOF (b). The high-dimensional datasets of unstimulated 5A8 and 6.3 were merged to generate the ‘atlas’ of unstimulated J-Lat cells. The high-dimensional data for each reactivated (Gag+) 6.3 cell was matched against the atlas by PP-SLIDE (c). The error rate was defined as the % of reactivated 6.3 cells that matched to unstimulated 5A8 cells (d). (B) PP-SLIDE correctly identifies the unstimulated precursor of reactivated 6.3 cells, 99.2% of the time. tSNE plots of unstimulated J-Lat 6.3 (a), unstimulated J-Lat 5A8 (b), and PMA/ionomycin-stimulated J-Lat 6.3 (c). PP-SLIDE was used to identify the kNN latent cell of each reactivated 6.3 cell among a merged atlas of unstimulated 6.3 and 5A8 cells. Note marked overlap of kNN latent cells (d) with unstimulated J-Lat 6.3 (e, 99.2%) and not J-Lat 5A8 (f, 0.8%).
Figure 2 with 3 supplements
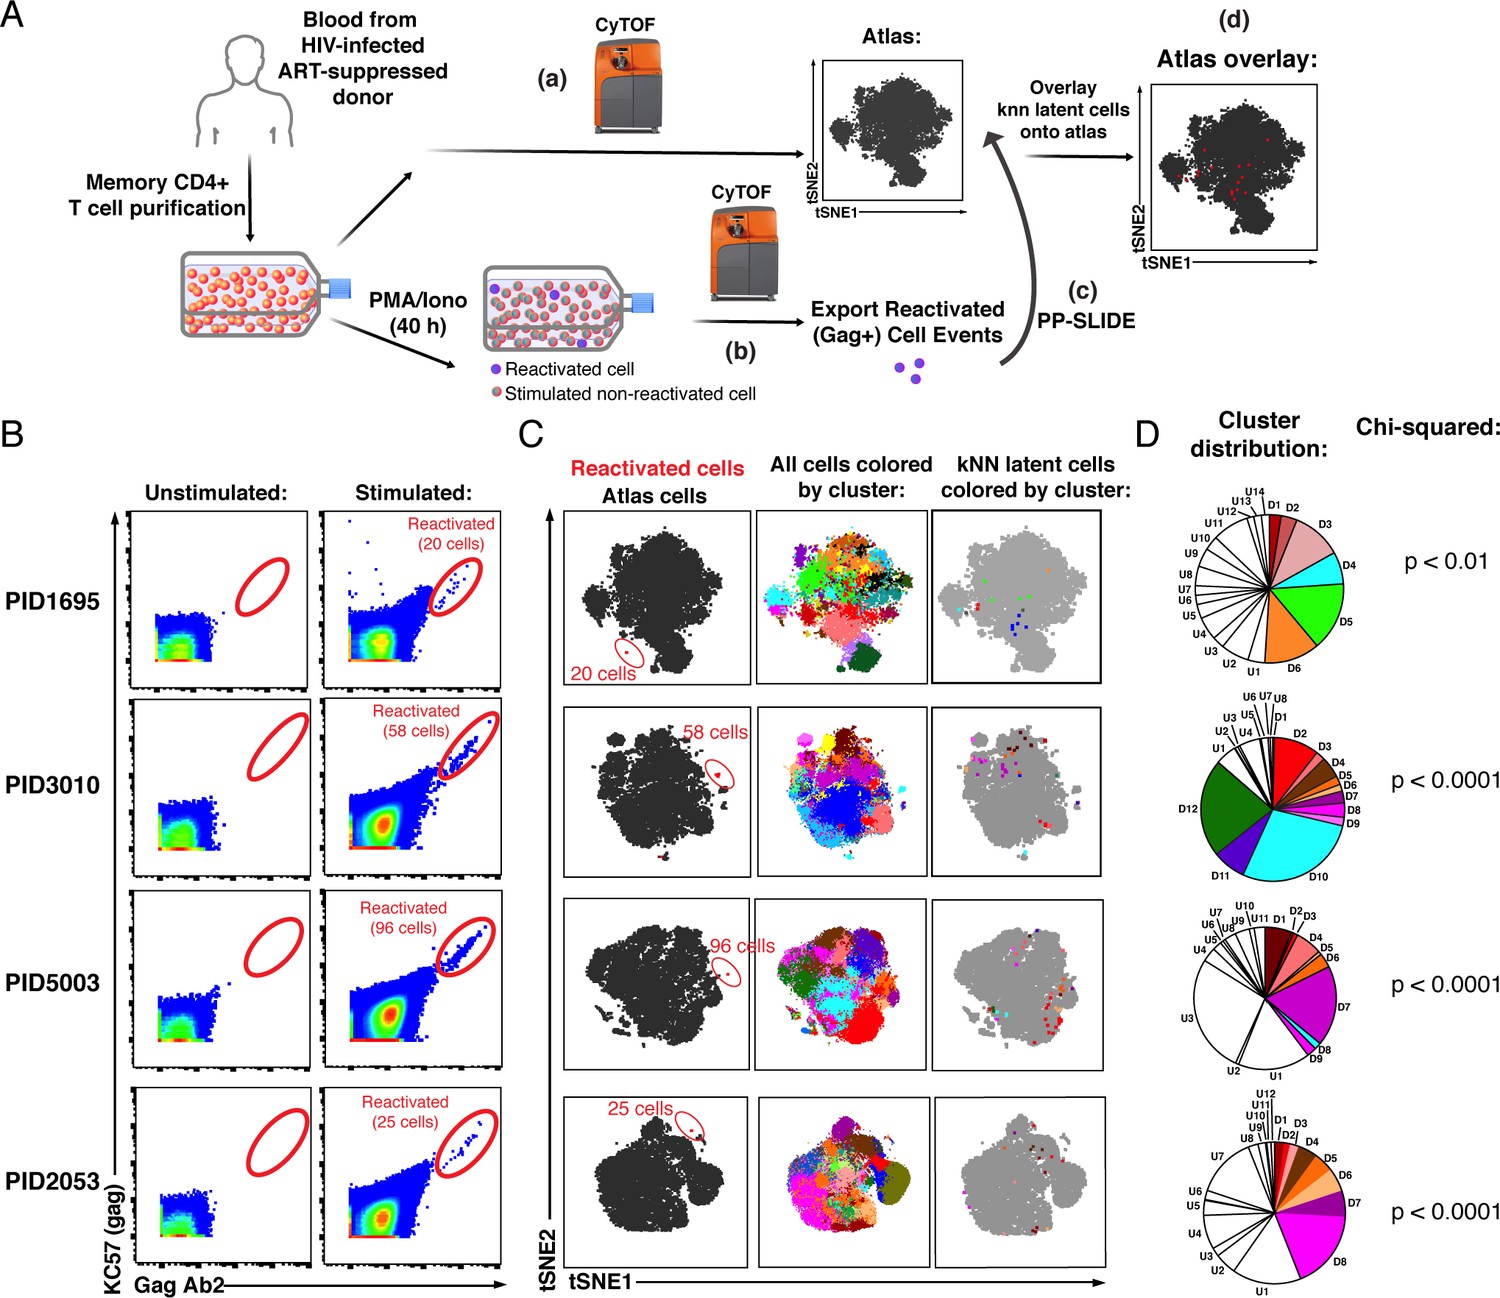
PP-SLIDE charting of in vivo latent reservoir reveals non-random distribution of latent cells.
(A) Schematic of PP-SLIDE analysis of in vivo reservoir. Memory CD4+ T cells from infected, ART-suppressed individuals were isolated and an aliquot immediately processed for CyTOF phenotyping (a), while the remaining cells were phenotyped after treatment with PMA/ionomycin for 40 hr in the presence of ART (b). PP-SLIDE identified a kNN latent cell (the most similar cell in the atlas of unstimulated cells) for each reactivated cell (c). An overlay of the kNN latent cells (red) onto the atlas (gray) reveals regions preferentially associated with latency (d). (B) Identification of ex vivo-reactivated latent cells from the blood of ART-suppressed individuals. Cells were phenotyped before or after stimulation for 40 hr with PMA/ionomycin in the presence of ART. Reactivated cells are shown in the gates. The frequencies of reactivated cells were 12.0 (PID1695), 9.9 (PID3010), 17.6 (PID5003), and 5.6 (PID2053) per million memory CD4+ T cells. (C) kNN latent cells are non-randomly distributed among memory CD4+ T cells. Left: Reactivated cells (red) visualized by tSNE alongside unstimulated memory CD4+ T cells (black) from the same patient. Due to phenotypic changes induced by stimulation and reactivation, the reactivated cells (stacked as tight populations) reside in distinct regions of each tSNE plot (red ovals). Center: Atlas of memory CD4+ T cells from each sample, clustered using FlowSOM. Each cluster is depicted in a different color. Right: The kNN latent cells are colored according to the cluster they belong to. (D) Pie graphs showing relative proportions of each cluster among the atlas. ‘D’ (Detectable) designates clusters harboring at least one kNN latent cell and ‘U’ (Undetectable) those lacking any. The D clusters are arranged in order of the frequency of kNN latent cells they harbor, with D1 clusters harboring the highest frequencies. The existence of small D clusters and large U clusters, along with the chi-squared values, demonstrate non-random distribution of the latent reservoir.
Figure 2—figure supplement 1
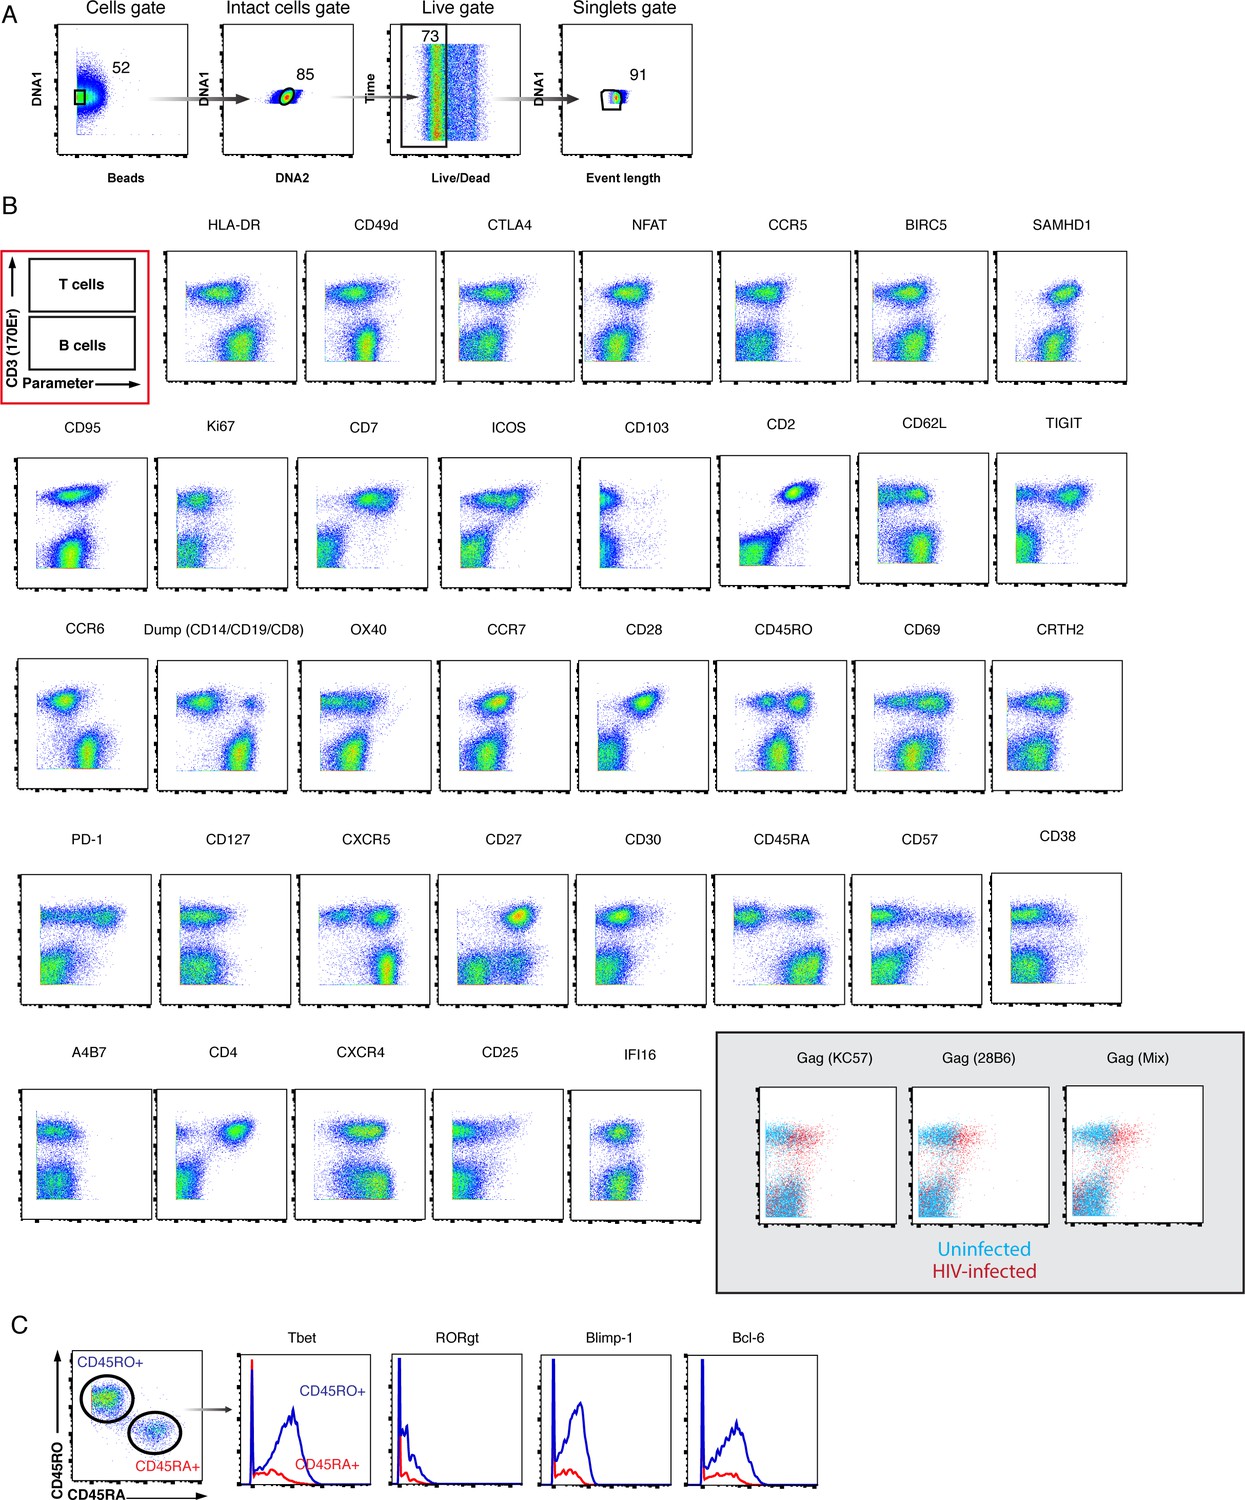
CyTOF antibody validation.
(A) Tonsils were used as a source of primary cells for validating the in vivo latency CyTOF panel, as they provide an abundant source of T and B cells, which differentially express many antigens within the panel. Shown is the gating strategy to identify live, singlet cells in human lymphoid aggregate cultures (HLACs) from tonsils. (B) Expression of antigens differentially expressed on T and B cells as assessed using CyTOF. The first two-dimensional plot boxed in red schematizes the location of T cells (CD3+) and B cells (CD3-), the two main cell populations isolated from HLACs. The indicated antibodies were validated by demonstrating that the differential expression patterns of the corresponding antigens on T versus B cells are consistent with the known expression patterns of these antigens. Cells were pre-gated on live, singlet cells. Gray inset: To validate the three sets of anti-Gag antibodies, HLACs were exposed to the HIV reporter virus F4.HSA (Cavrois et al., 2017) and the infected cultures were compared to uninfected cultures for the expression of Gag as detected by these antibodies. The ‘Gag mix’ antibody comprises a mix of four different anti-Gag clones. (C) Select antigens known to be expressed at higher levels on memory as compared to naïve CD4+ T cells were validated by demonstrating the expected expression patterns on these two populations of cells. Shown on the left are the gates to identify the memory (CD45RO+CD45RA-) and naïve (CD45RO-CD45RA+) cells. Shown on the right are the expression levels of the indicated antigens in memory (blue) and naïve (red) CD4+ T cells. Cells were pre-gated on live, singlet CD4+ T cells. These validation approaches are similar to those previously implemented to validate CyTOF panels used for characterizing HIV-induced remodeling (Cavrois et al., 2017; Ma et al., 2020).
Figure 2—figure supplement 2

Establishing conditions for ex vivo reactivation of latent cells.
(A) A combination cocktail of ART fully suppresses HIV infection. PHA-activated PBMCs were mock-treated or exposed to the CCR5-tropic HIV-1 reporter strain F4.GFP (Neidleman et al., 2017), either in the absence or presence of a cocktail of ART drugs targeting HIV-1 Reverse Transcriptase, Protease, and Integrase, as well as the fusion inhibitor T20. Cells were then analyzed using FACS 4 days later for infection levels. The proportion of HIV-infected (GFP+) cells is indicated within the gates. Results are pre-gated on live, singlet CD3+CD8- cells. (B) PMA/ionomycin stimulation of T cells for 2 days does not induce proliferation. PBMC-derived T cells were stained with CFSE and then mock-treated or stimulated with PMA/ionomycin for the indicated number of days before FACS analysis. Cells not stained with CFSE were also analyzed at each time point. The results demonstrate that proliferation begins to occur on day 3 post-stimulation. All stimulations in this study were conducted for less than 2 days when T cells had not yet proliferated.
Figure 2—figure supplement 3
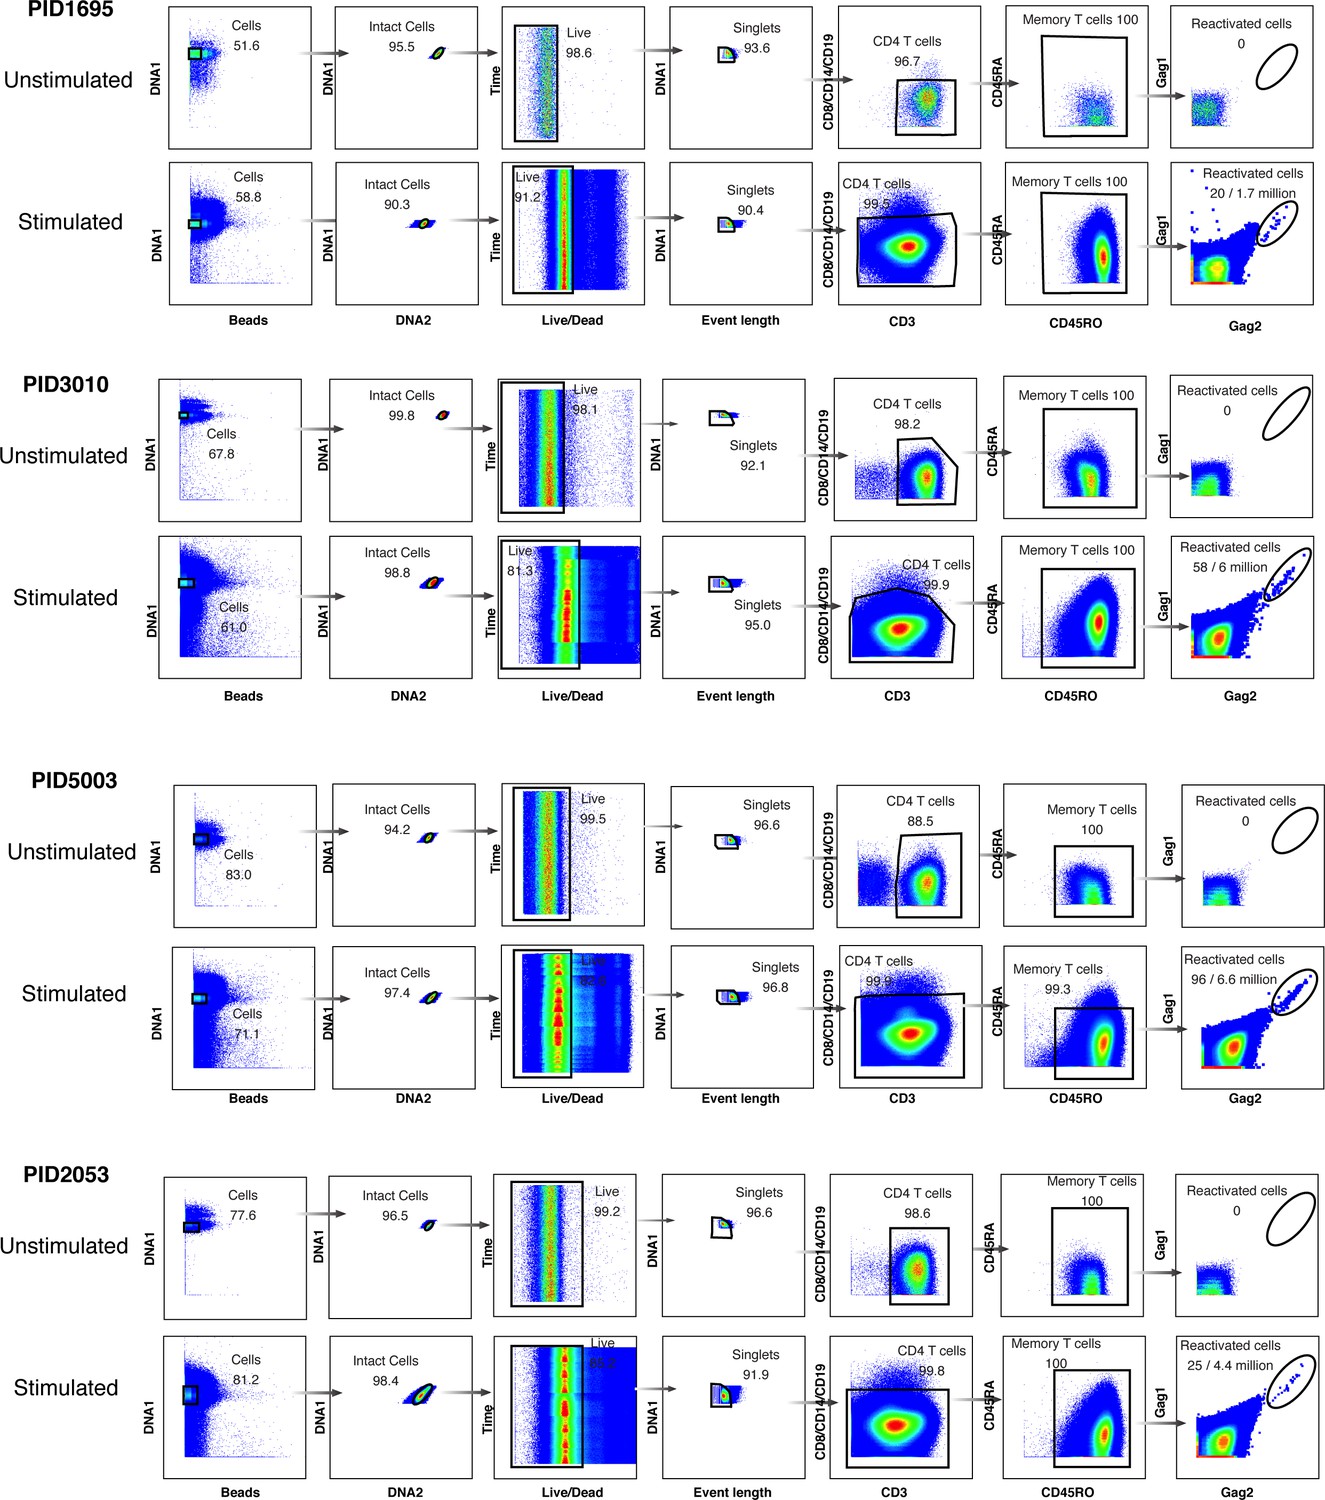
Gating strategy to identify ex vivo reactivated cells from four HIV-infected, ART-suppressed patients.
Memory CD4+ T cells were purified by negative selection from leukapheresis specimens and then either left unstimulated and fixed immediately, or stimulated for 40 hr with PMA/ionomycin and then fixed. The unstimulated and stimulated specimens were then analyzed using CyTOF. Shown is the gating strategy leading to the identification of live, singlet memory CD4+ T cells expressing HIV Gag proteins as detected on two separate channels. These cells also bind to the third set of anti-Gag antibodies and exhibit downregulation of cell-surface CD4 (data not shown).
Figure 3 with 3 supplements
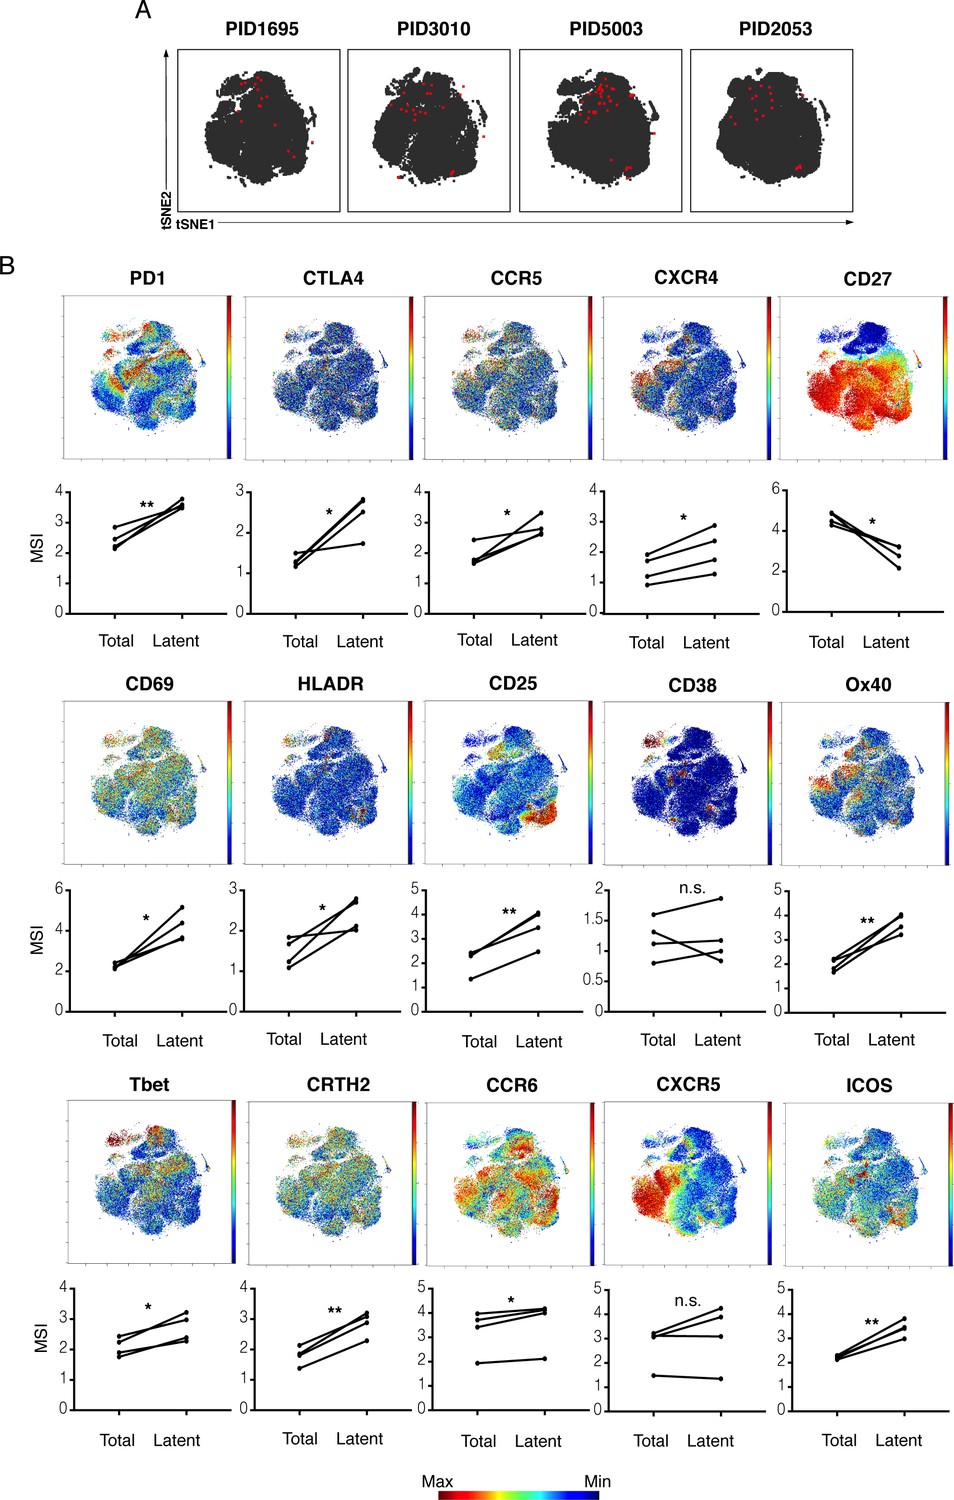
kNN latent cells from different donors are phenotypically similar.
(A) The atlas (gray) and kNN latent cells (red) for four donors are depicted within the same tSNE space. In all donors, the center region of the tSNE is devoid of kNN latent cells. The kNN latent cells depicted here are those identified in Figure 2. (B) Expression levels of select antigens on kNN latent cells as compared to the total population of memory CD4+ T cells. Top plots show the antigen expression levels as a heatmap within the tSNE space depicted in panel A. Bottom graphs show the mean signal intensity (MSI) of each antigen in the total population of memory CD4+ T cells (Total) compared to the kNN latent cells (Latent). Proteins consistently expressed at higher levels on kNN latent cells than on the total population included immune checkpoint molecules (PD1, CTLA4) and the HIV co-receptors CCR5 and CXCR4. Some activation markers (CD69, CD25, HLADR) but not others (CD38) were also upregulated, as were markers of Th1, Th2, and Th17 cells (Tbet, CRTH2, and CCR6, respectively). Some markers of Tfh (PD1, ICOS) but not others (CXCR5) were consistently elevated. By contrast, the Tcm marker CD27 was expressed at low levels on kNN latent cells. *p<0.05, **p<0.01 as determined by a Student’s paired t-test. n.s.: not significant.
Figure 3—figure supplement 1
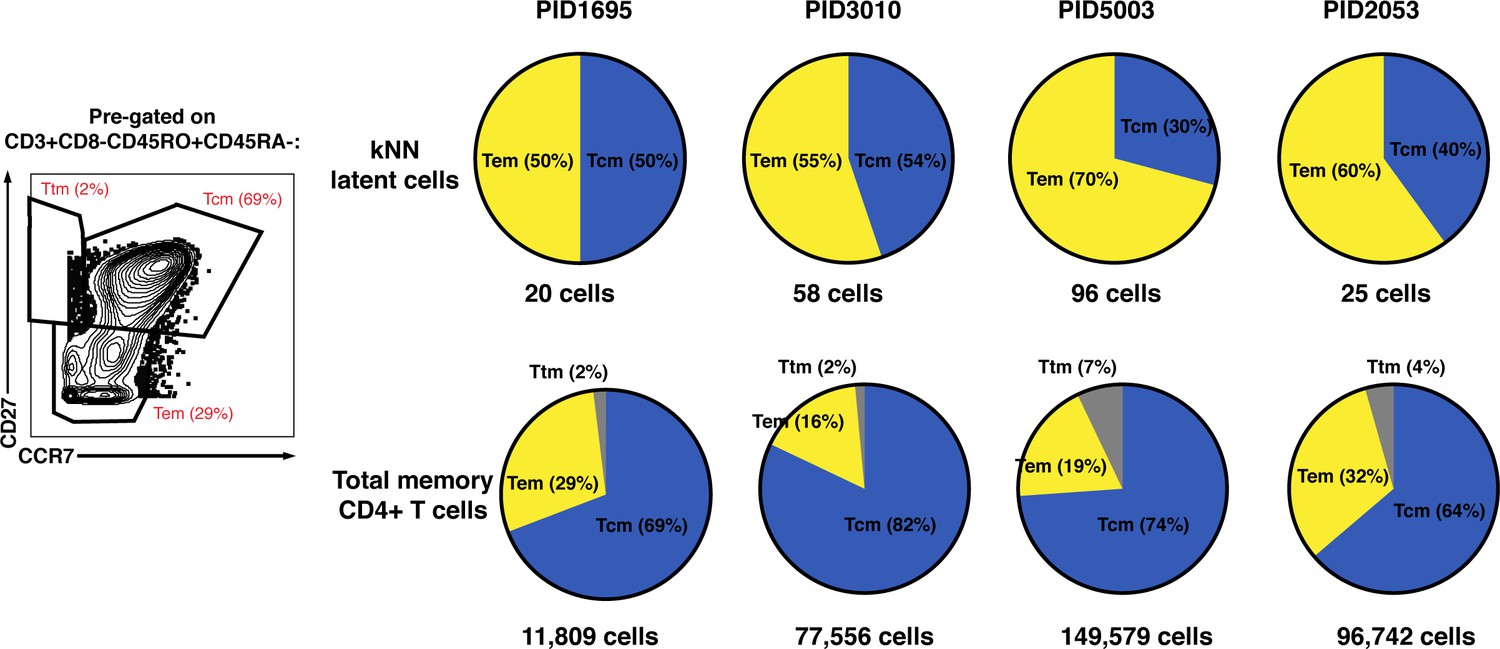
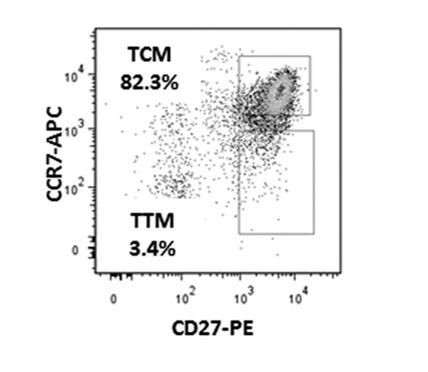
Distribution of Tcm, Tem, and Ttm among kNN latent cells and total memory CD4+ T cells.
Shown on the left is the gating strategy used to identify the Tcm (CCR7+CD27+), Tem (CCR7-CD27-), and Ttm (CCR7-CD27+) subsets, implemented on cells from PID1695. Cells were pre-gated on live, singlet CD3+CD8-CD45RO+CD45RA- cells. Shown on the right are the percent of kNN latent cells (top) or total memory CD4+ T cells (bottom) belonging to the Tcm, Tem, and Ttm subsets. Tem cells were over-represented among kNN latent cells relative to total memory CD4+ T cells. The numbers below the pie graphs correspond to the number of kNN latent cells or total memory CD4+ T cells in each sample.
Figure 3—figure supplement 2

The distribution, frequencies, and phenotypic features of clusters most enriched for kNN latent cells.
(A) Top: Shown are the distributions of kNN latent cells among all the FlowSOM ‘D’ clusters in Figure 2D that harbored at least one kNN latent cell, for each of the four participant blood specimens analyzed. Each red circle corresponds to one kNN latent cell, with the total adding up to the number of total kNN cells identified from that specimen. The percentages of kNN latent cells that belong to each of the clusters are indicated in blue. Bottom: Shown are the frequencies of kNN latent cells in each of the FlowSOM clusters that harbored at least one kNN latent cell. For a detailed explanation of how the values in this panel were calculated, see Materials and methods. (B) Shown are the percent of kNN latent cells belonging to the Tcm, Tem, and Ttm subsets for D1-D3, the three clusters in each patient sample harboring the highest frequencies of kNN latent cells.
Figure 3—figure supplement 3
Characterization of the inter-donor and stimulation-dependent variability in kNN latent cells.
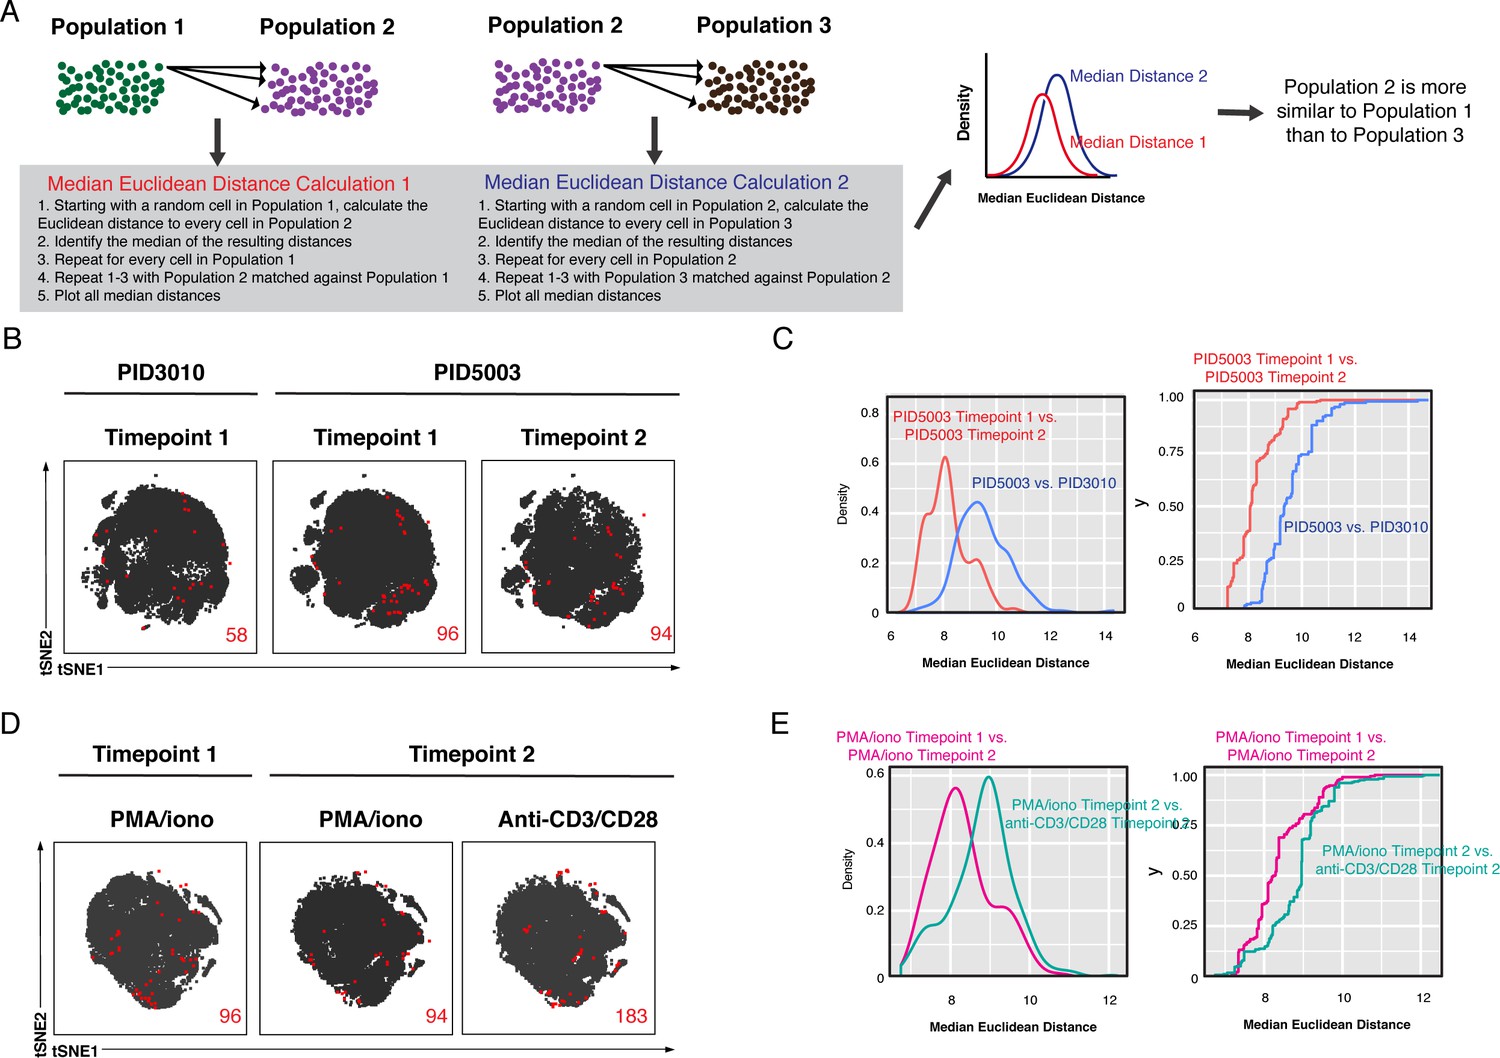
(A) Schematic of Euclidean distance calculations to assess relative similarities between different populations of cells. In this hypothetical scenario, one seeks to determine whether Population 2 is more similar to Population 1 or to Population 3. To do this, the median Euclidean distances, based on all the CyTOF parameters, are calculated for each pair of populations as shown. The resulting data are depicted as density plots. The pairs of samples with lower distance calculations are more similar. In this hypothetical scenario, Population 2 is most similar to Population 1. (B) The atlas and kNN latent cells from three leukapheresis specimens from two donors are represented as tSNE plots. The two specimens from donor PID5003 were obtained 2 months apart. Red numbers indicate the number of kNN latent cells in each plot. (C) The kNN latent cells of the two PID5003 specimens are more similar than the PID5003 specimens are to the PID3010 specimen. The empirical cumulative distribution of median distances was calculated between (1) kNN latent cells from the two PID5003 specimens (red), and (2) kNN latent cells between the PID3010 specimen and the PID5003 Time point 2 specimen (blue). The plot on the left shows the distribution of the data plotted as density plots. The plot on the right shows the same data plotted as empirical cumulative distribution curves, where the y-axis value corresponds to the proportion of the median distances that are less than the corresponding x-axis value. In both plots, the more similar two specimens are, the more the curves are shifted to the left. (D) The kNN latent cells from three leukapheresis specimens from the same donor (PID5003), reactivatable with either PMA/ionomycin or anti-CD3/CD28 as indicated. Red numbers indicate the number of kNN latent cells in each plot. (E) The kNN latent cells reactivatable by PMA/ionomycin at the two different time points are more similar than those reactivatable by PMA/ionomycin versus anti-CD3/CD28 at the same time point. The empirical cumulative distribution of median distances was calculated between (1) kNN latent cells of the Time point 1 PMA/ionomycin and Time point 2 PMA/ionomycin samples (red) and (2) the Time point 2 PMA/ionomycin and Time point 2 anti-CD3/CD28 samples (blue). The density plots and empirical cumulative distribution curves are depicted on the left and right sides, respectively.
Figure 4 with 1 supplement

Comparison of kNN latent cells reactivatable by different stimulations and from blood versus tissues using longitudinal specimens.
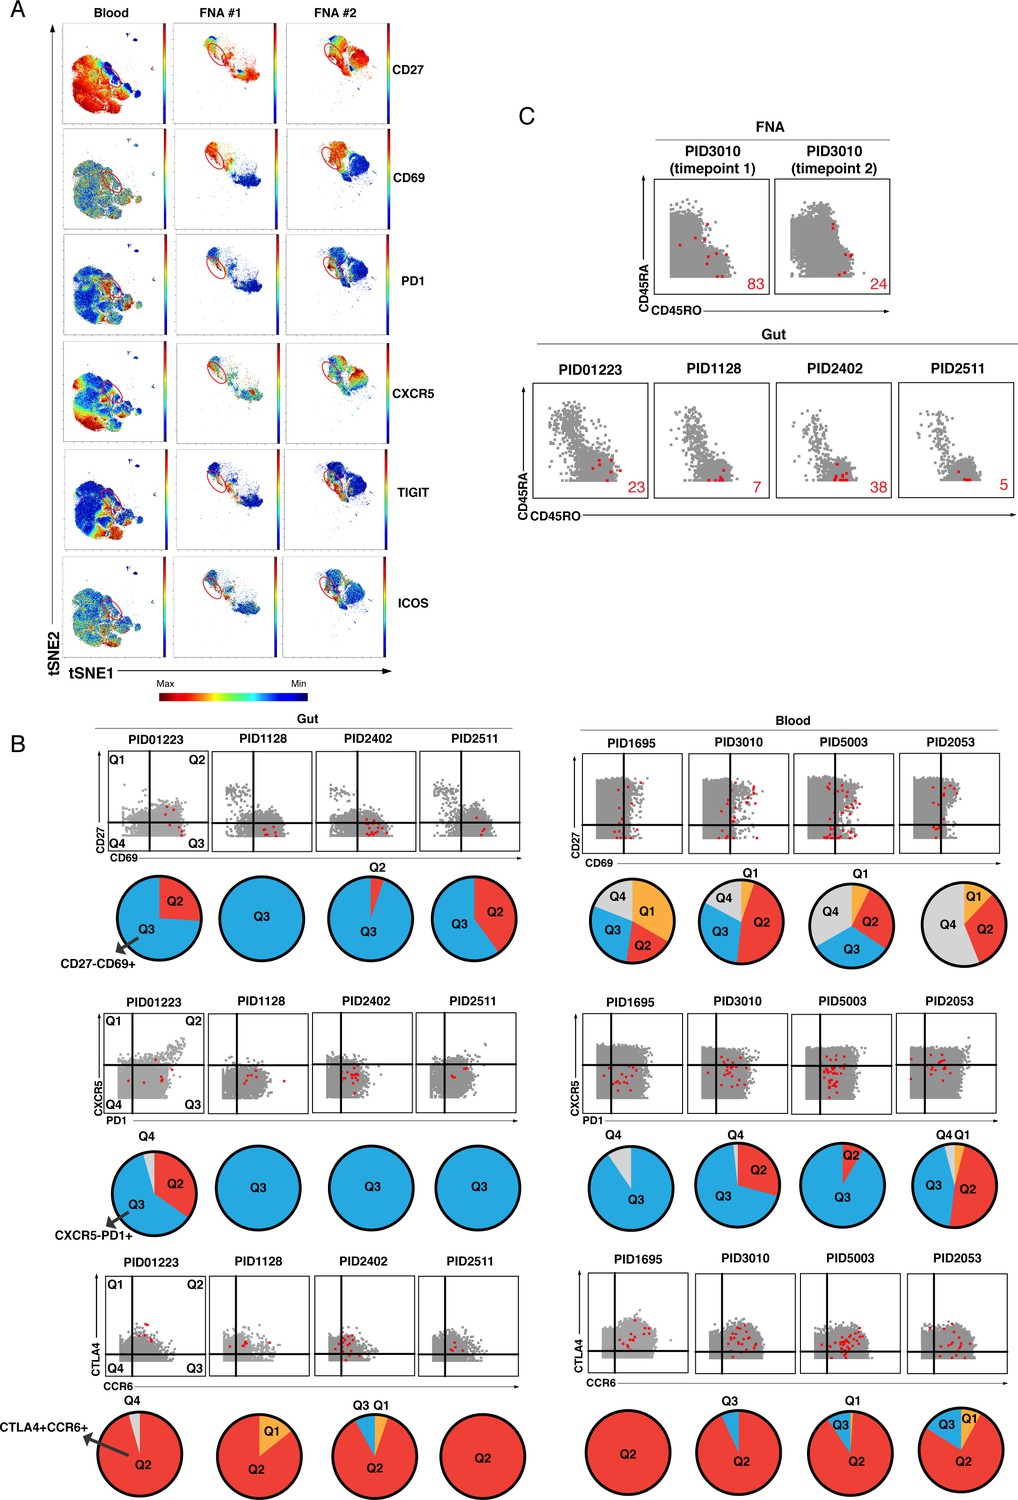
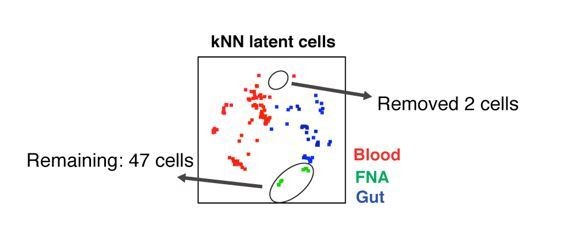
(A) Atlas (gray) and kNN latent cells (red) from three blood specimens from the same donor (PID5003) spaced 2–3 months apart, where reactivation was induced by either PMA/ionomycin or Romidepsin/PEP005. Arrows highlight regions that harbor kNN latent cells in the PMA/ionomycin but not Romidepsin/PEP005 samples. Red numbers indicate the number of kNN latent cells in each plot. (B) kNN latent cells reactivatable by PMA/ionomycin at two different time points are more similar to each other than to those reactivatable by Romidepsin/PEP005 at the same time point. The empirical cumulative distribution of median distances between kNN cells was calculated between (1) Time point 1 PMA/ionomycin and Time point 2 PMA/ionomycin samples (red), and (2) Time point 2 Romidepsin/PEP005 and Time point 3 Romidepsin/PEP005 samples (pink), and (3) Time point 2 PMA/ionomycin and Time point 2 Romidepsin/PEP005 samples (blue). (C) Atlases of memory CD4+ T cells from fine needle aspirates (FNAs) or the blood of the same donor (PID3010) with corresponding kNN latent cells (red). Red arrows point to regions of the FNA tSNEs that are concentrated in kNN latent cells. Bottom plots show each FNA atlas overlaid onto the blood atlas. Red numbers indicate the number of kNN latent cells in each plot. (D) Dot plots demonstrating that FNA but not blood kNN latent cells (red dots) express uniformly high levels of CD27, CD69, CXCR5, PD1, and ICOS. Atlas cells are in gray. Pie charts show proportions of kNN latent cells within each quadrant. (E) kNN latent cells from different tissue sites are similar. Top: Atlas (left) and kNN latent cells (right) from four blood, two FNA, and four gut specimens as depicted by tSNE. Middle/Bottom: Empirical cumulative distribution of median distances between atlas (left) or kNN cells (right), as calculated between FNA versus blood (purple) or versus gut (blue).
Figure 4—figure supplement 1
Comparison of kNN latent cells from blood and tissues.
(A) The tSNE maps presented in Figure 4C are portrayed as heatmaps showing expression levels of CD27, CD69, PD1, CXCR5, TIGIT, and ICOS. Regions with the highest density of kNN latent cells shown in Figure 4C are circled in red. Dot plot and pie graph depictions of the same datasets are presented in Figure 4D. (B) Dot plots comparing the expression patterns of CD27, CD69, CXCR5, PD1, CTLA4, and CCR6 on kNN latent cells from the gut and blood. In the dot plots, kNN latent cells are depicted in red and atlas cells in gray. The proportions of kNN latent cells that fall within each quadrant are depicted as pie charts beneath each dot plot. Top: Most kNN latent cells from the gut reside in quadrant 3 (Q3), corresponding to cells expressing high levels of CD69 and low levels of CD27. Middle: Most kNN latent cells from the gut reside in Q3, corresponding to cells expressing high levels of PD1 and low levels of CXCR5. Bottom: Most kNN latent cells from the gut reside in quadrant 2 (Q2), corresponding to cells expressing high levels of CTLA4 and CCR6. (C) kNN latent cells from FNAs but not the gut include naïve CD4+ T cells. Dot plots showing kNN latent cells (red) and atlas cells (gray) for two FNA and four gut specimens. Events were pre-gated on CD4+ T cells (CD3+CD8-CD19-). Naïve cells are visualized as those expressing high levels of CD45RA and low levels of CD45RO. These naïve cells also expressed high levels of CD27 and CCR7 (not shown). Red numbers indicate the number of kNN latent cells in each plot.
Figure 5
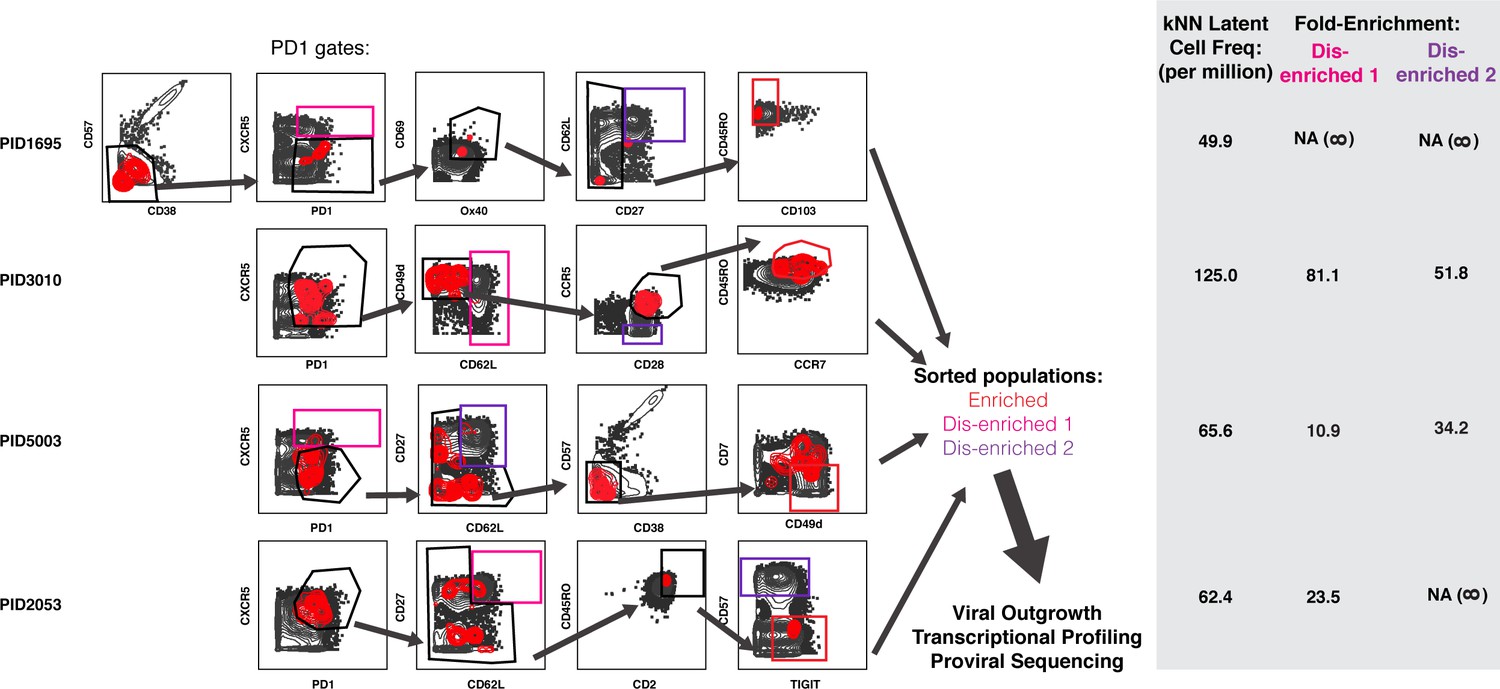
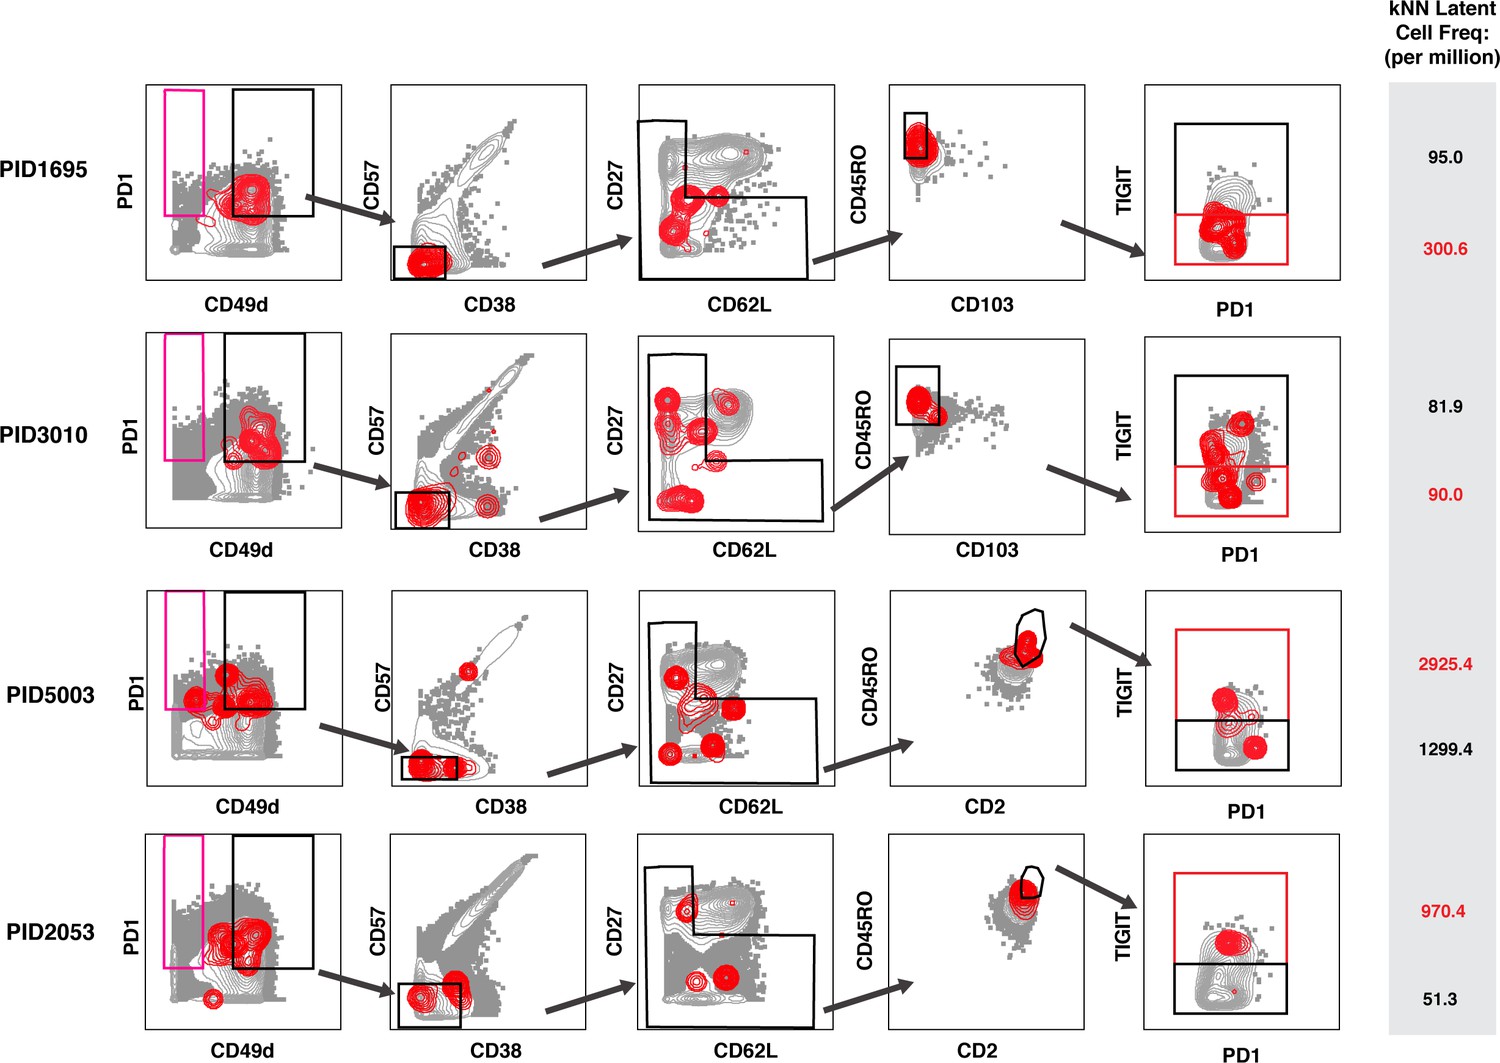
Design of tailored sort strategies to isolate three populations memory CD4+ PD1+ T cells harboring different frequencies of kNN latent cells.
Sort strategies were designed for each of the four leukapheresis donors analyzed by PP-SLIDE. Shown are the CyTOF datasets, the unstimulated atlas cells are shown as gray contours and kNN latent cells shown as red contours. Gates in black correspond to upstream gates. Each sorting strategy isolates three populations of memory CD4+ PD1+ T cells: two disenriched (pink, purple), and one enriched (red). Results were pre-gated on live, singlet memory CD4+ T cells (CD3+CD8-CD19-CD45RO+CD45RA-). The three functional assays applied to sorted cells are listed. The gray inset on the right shows frequencies of kNN latent cells in the final enriched populations (per million memory CD4+ T cells) and the fold-enrichment of kNN latent cells in the final sorted enriched population relative to each of the disenriched populations. In instances where a disenriched population did not harbor any kNN cells, the fold-enrichment is listed as NA (not available) because the fold-enrichment is infinity when divided by zero.
Figure 6 with 6 supplements
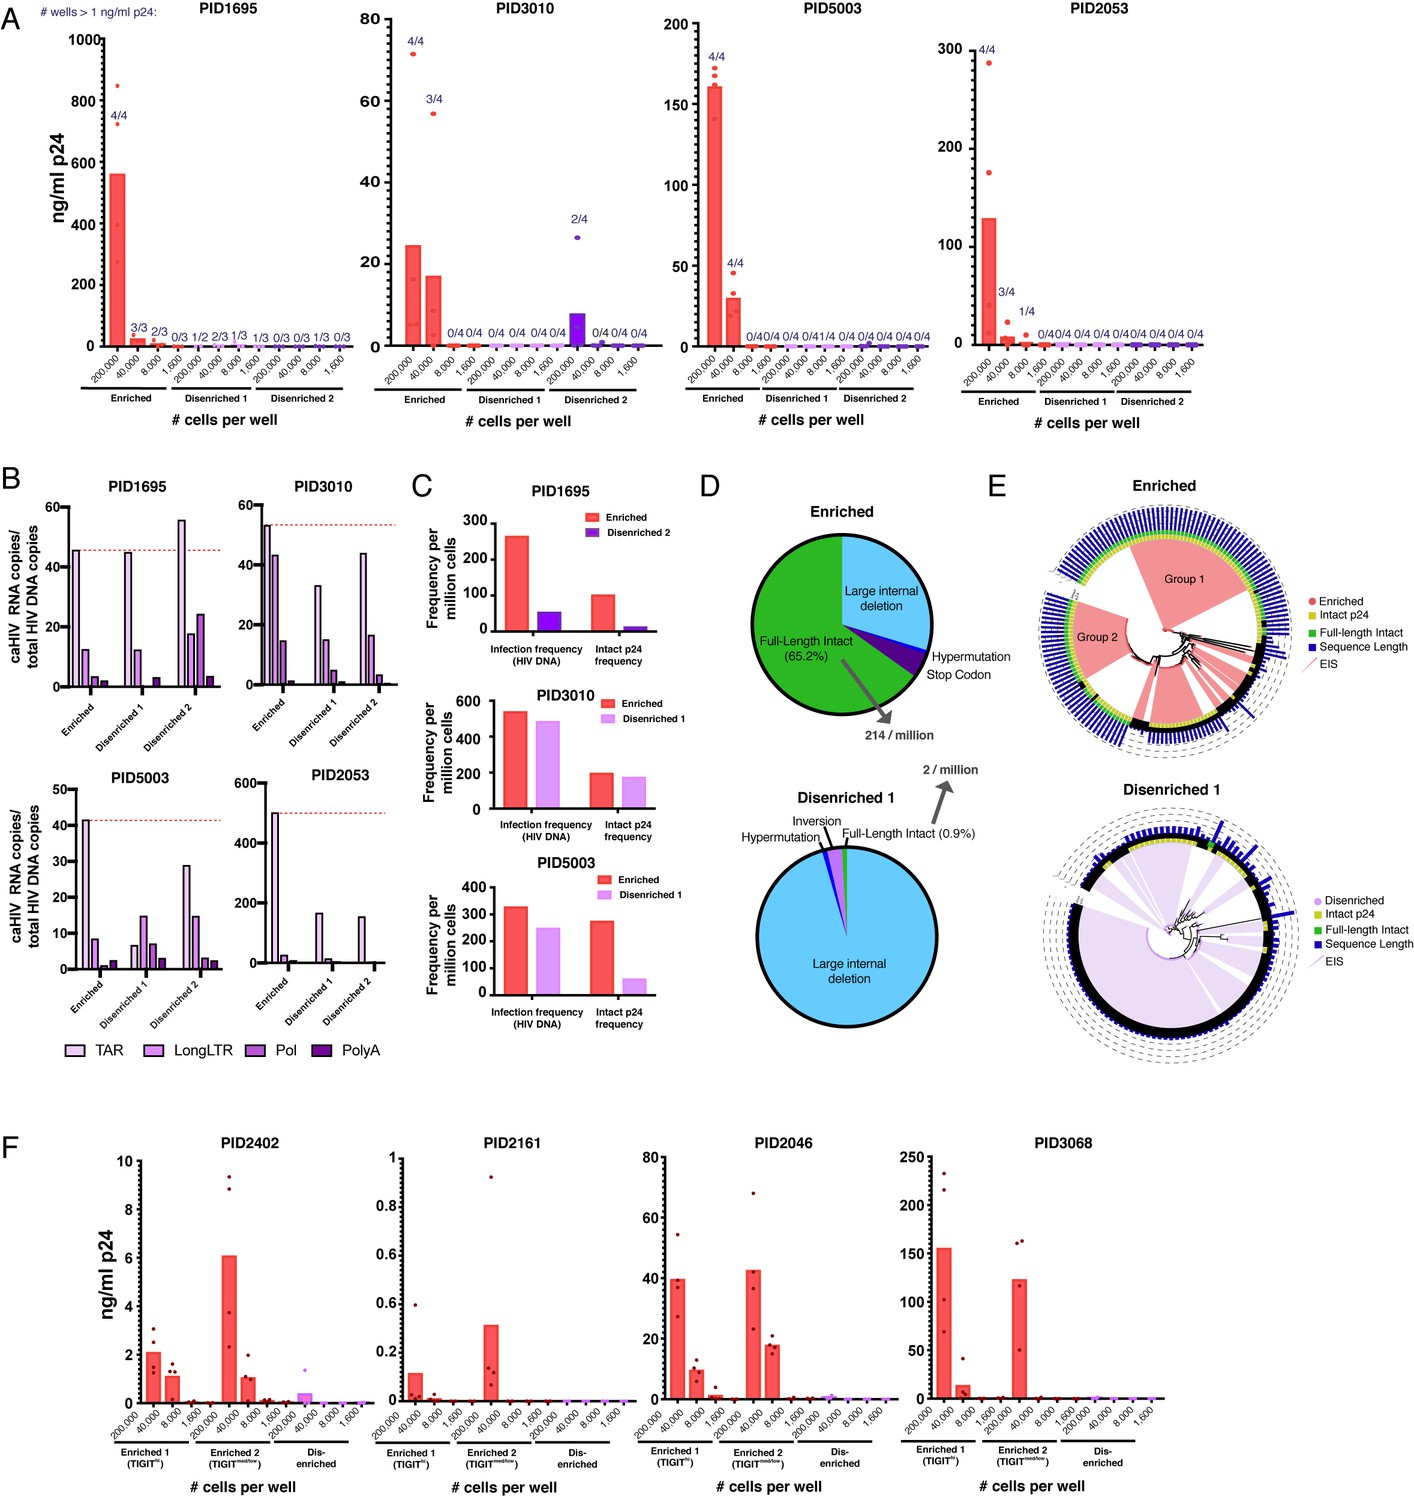
Sorting PD1+ cells based on surface markers identified by PP-SLIDE highly enriches for latent cells with replication-competent, transcriptionally active, and clonally expanded HIV.
(A) Enriched populations of sorted cells are enriched for replication-competent HIV. Three populations of memory CD4+ PD1+ cells – one enriched and two disenriched for kNN latent cells – were purified by sorting (Figure 6—figure supplement 1) and then subjected to a viral outgrowth assay. The cells were stimulated for 2 days with anti-CD3/CD28, diluted to the indicated number of cells per well, and cultured with MOLT-CCR5 cells for 15 days. Wells were then assayed for p24 by ELISA. Data are reported as the concentration of p24 in each well (bar graphs), and the fraction of wells that exhibited viral replication as defined by a final p24 content of >1 ng/mL (numbers above each bar). (B) Enriched populations harbor more HIV transcription initiation. The enriched and disenriched populations from four donors were left unstimulated and quantitated for the levels of initiated (TAR), elongated (Long LTR, Pol), and polyadenylated (PolyA) HIV RNAs. Data are normalized to the corresponding region of HIV DNA. The dotted red line shows the levels of initiated HIV transcripts for the enriched populations. (C) Enriched populations harbored higher frequencies of total HIV and intact p24 sequences in three donors, as revealed by FLIPS. (D) Pie charts showing the proportions of full-length intact and defective proviruses (including large internal deletions, hypermutations, premature stop codons, and inversions) from the enriched (top) and disenriched (bottom) populations from PID5003. The enriched and disenriched populations harbored full-length intact proviruses at proportions of 66.5% and 0.9%, and at overall frequencies of 214 and 2 per million cells, respectively. (E) Phylogenetic analysis of proviruses demonstrating enrichment of identical full-length intact proviruses in the enriched (top) and disenriched (bottom) populations from PID5003. Wedges depict expanded identical sequences (EIS). Concentric circles identify proviruses with (yellow) or without (black) intact p24 sequences and with (green) or without (black) full-length intact sequences. Blue bars depict the length of each proviral sequence. Groups 1 and 2 labels the two expansions of full-length intact sequences in the enriched population. (F) The universal panel enriches for replication-competent reservoir cells. Memory CD4+ PD1+ from four untested donors were sorted into two enriched (one TIGIThigh and one TIGITmed/low) and one disenriched population (Figure 6—figure supplement 6) and then subjected to the viral outgrowth assay described in panel A.
Figure 6—figure supplement 1

Implementation of tailored sort strategies to isolate three populations of memory CD4+ PD1+ T cells harboring different frequencies of kNN latent cells.
The sorting strategies described in Figure 5 were converted into multiparameter flow panels and used to isolate the three populations of memory CD4+ PD1+ cells for each of the four donors as shown. Shown are FACS plots from the sorts. Memory CD4+ T cells from each donor were purified by negative selection before sorting. The phenotypic features of each sorted population are depicted beneath the corresponding population.
Figure 6—figure supplement 2
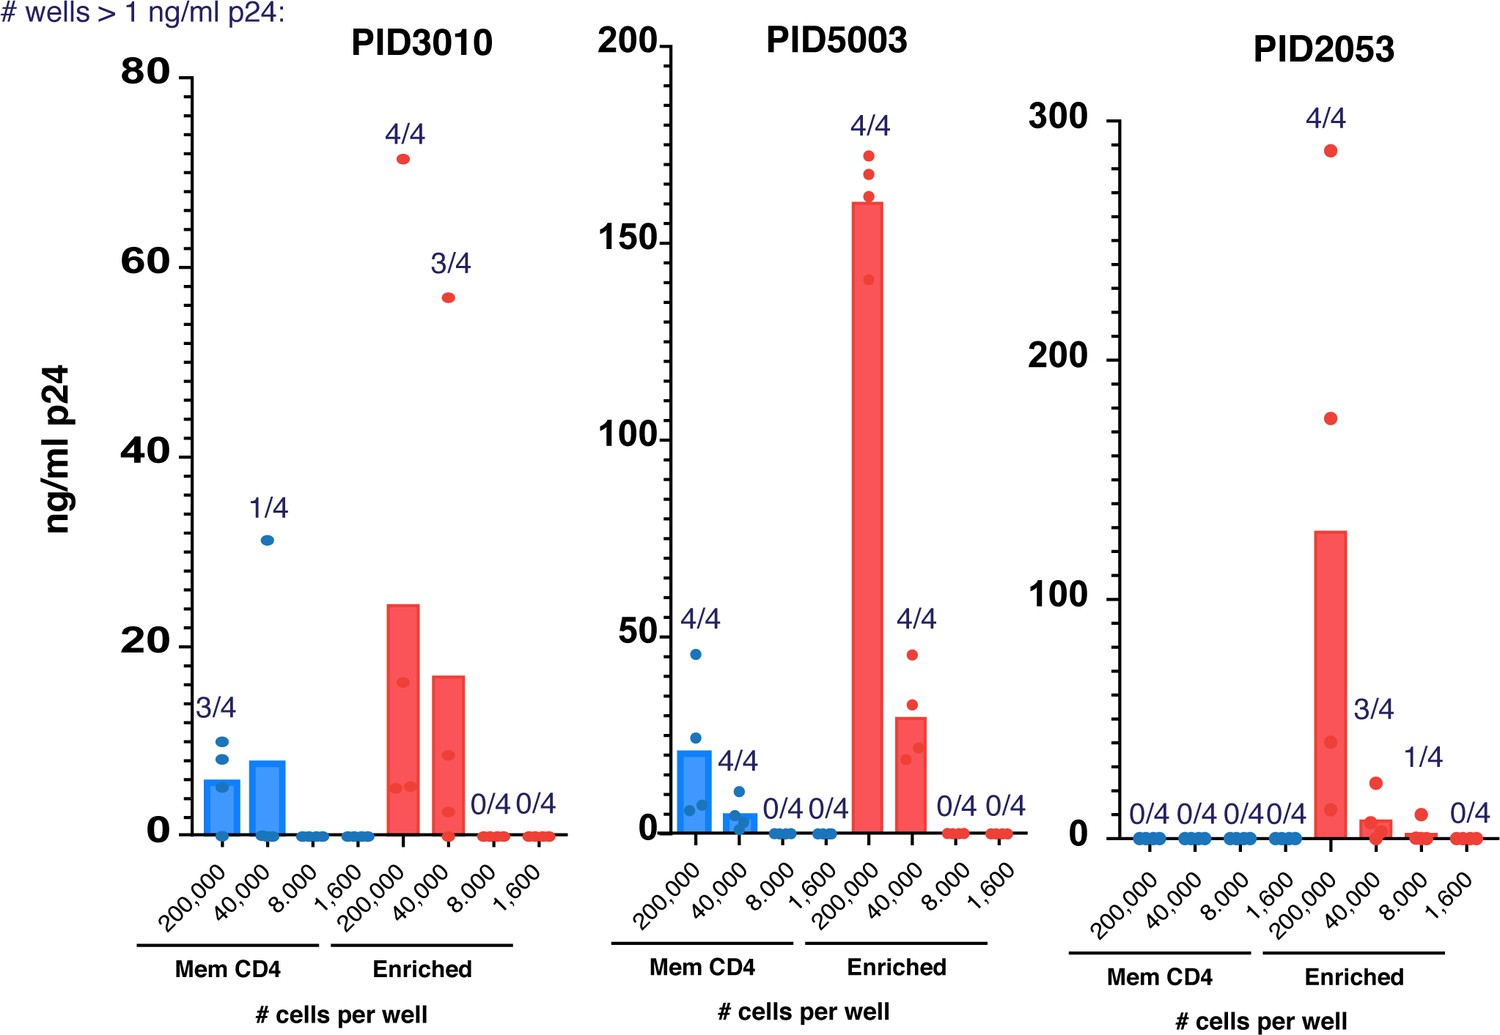
Enriched populations of sorted cells harbor more replication-competent HIV than their parent memory CD4+ T cell populations.
The enriched populations from the indicated donors analyzed in Figure 6A were sorted alongside total memory CD4+ T cells from the same donor and then subjected to the viral outgrowth assay. Cells from one of the four donors analyzed by PP-SLIDE (PID1695) were insufficient in number for outgrowth analysis of total memory CD4+ T cells, so enriched cells were only compared to disenriched cells for that donor.
Figure 6—figure supplement 3
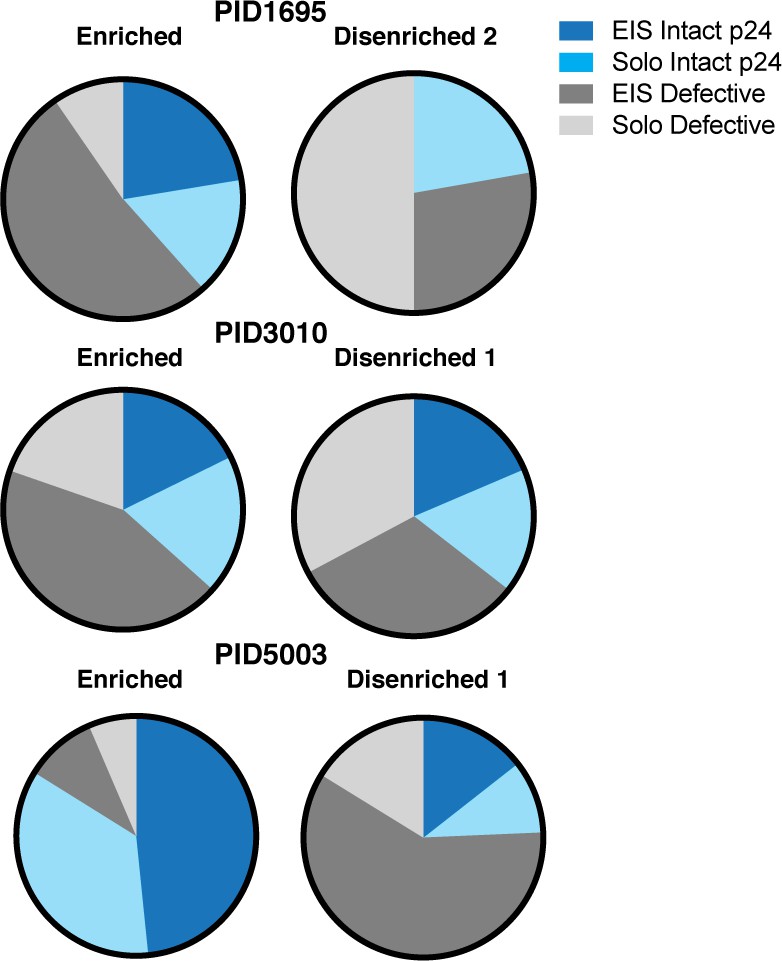
Relative to disenriched populations, enriched populations harbor more clonally expanded proviruses with intact p24 sequences.
Relative to disenriched populations, the enriched populations harbored more intact p24 sequences with expanded identical sequences (EIS). The three populations of memory CD4+ PD1+ T cells sorted in Figure 6—figure supplement 1 were subjected to proviral sequence analysis by FLIPS. Sequences were classified as EIS or solo sequences containing intact or defective p24 sequences. EIS with intact p24 were preferentially present in the enriched populations.
Figure 6—figure supplement 4
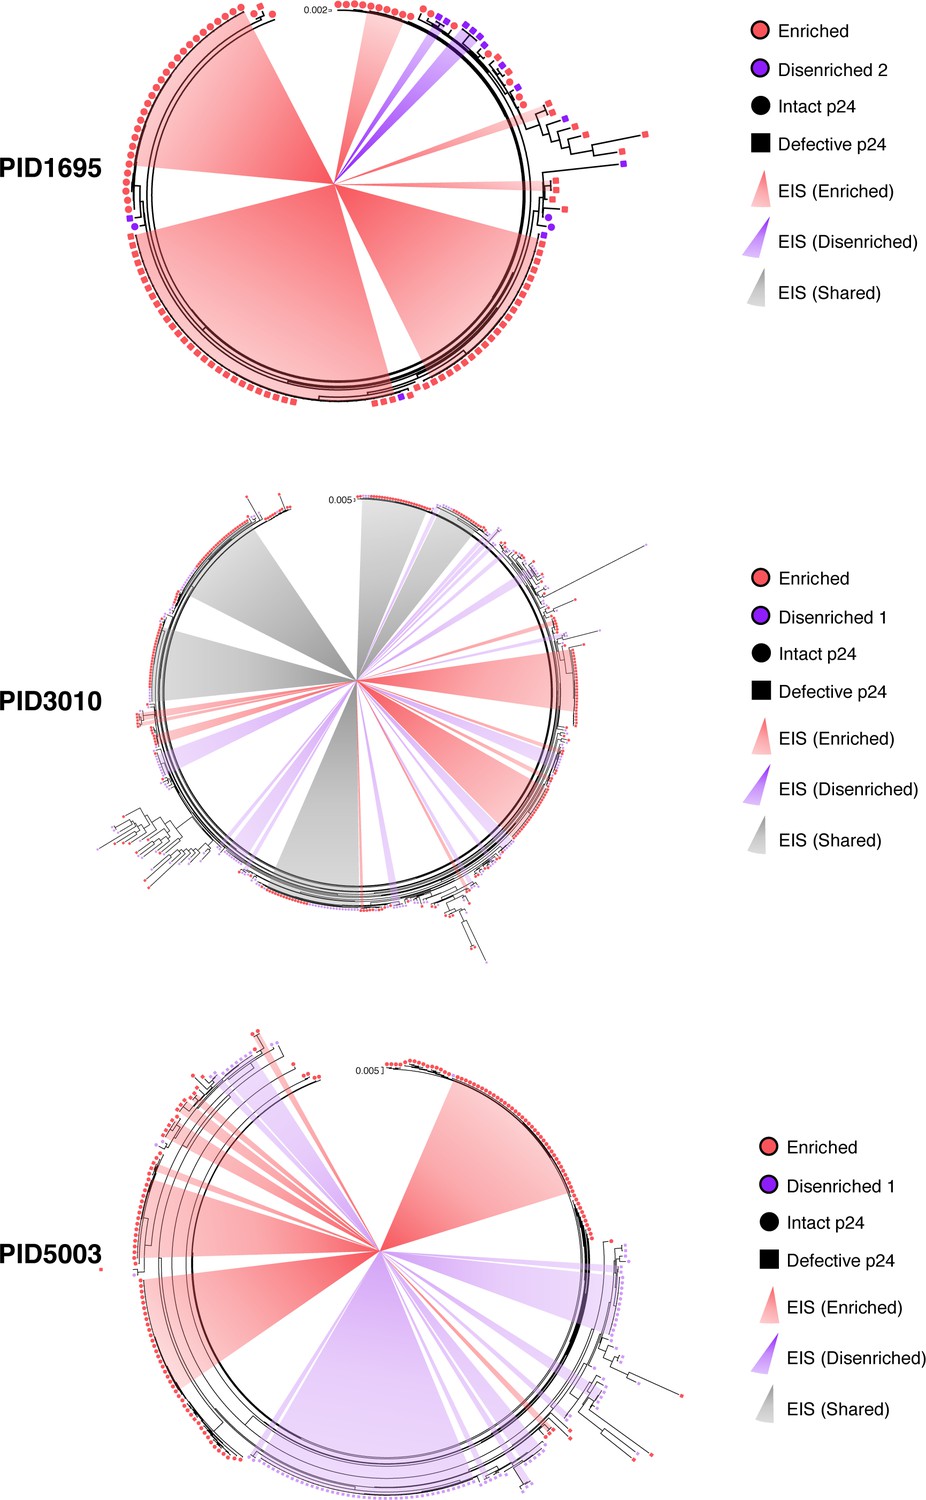
Phylogenetic trees of near full-length HIV sequences derived from sorted populations.
Maximum likelihood phylogenetic trees from three participants representing the proviral sequences from the enriched (red) and disenriched (purple/pink) populations combined within the same tree. Intact p24 sequences are depicted with circles, defective p24 sequences with squares. Clonal expansions are indicated with the shaded wedges emanating from the center. Of note, in PID5003, one proviral sequence from the disenriched population was identical to an EIS harboring 38 identical sequences from the enriched population. Because only 1/39 sequences in this EIS belonged to the disenriched population, we classified this EIS as belonging to the enriched population.
Figure 6—figure supplement 5
Design of universal sort panel to enrich for latent cells.
A universal sort strategy was designed based on the CyTOF datasets from the four leukapheresis donors analyzed by PP-SLIDE. Plots are shown as contour, with the kNN populations in red and atlas cells in gray. Of note, PID1695 and PID3010 were stained with a panel that had CD103, while PID5003 and PID2053 were stained with a panel that replaced CD103 with CD2. The PID1695 and PID3010 data suggest that kNN latent cells are enriched among CD103low cells, while the PID5003 and PID2053 data suggest that kNN latent cells are enriched among CD2high cells. Because selection for CD2high cells eliminates more atlas cells lacking kNN cells and resulted in a higher enrichment of kNN latent cells, we chose CD2 instead of CD103 to include within our panel. The final plot in the gating strategy demonstrates that kNN latent cells express high levels of TIGIT in some donors but not others (the gate most enriched for kNN latent cells is in red); both TIGIThigh and TIGITmed/low cells were sorted for comparison. The PD1+ population of disenriched cells is shown in pink. Results were pre-gated on live, singlet memory CD4+ T cells (CD3+CD8-CD19-CD45RO+CD45RA-). The gray inset on the right shows frequencies of kNN latent cells in the final TIGIT- or TIGIT+ enriched populations (per million memory CD4+ T cells).
Figure 6—figure supplement 6
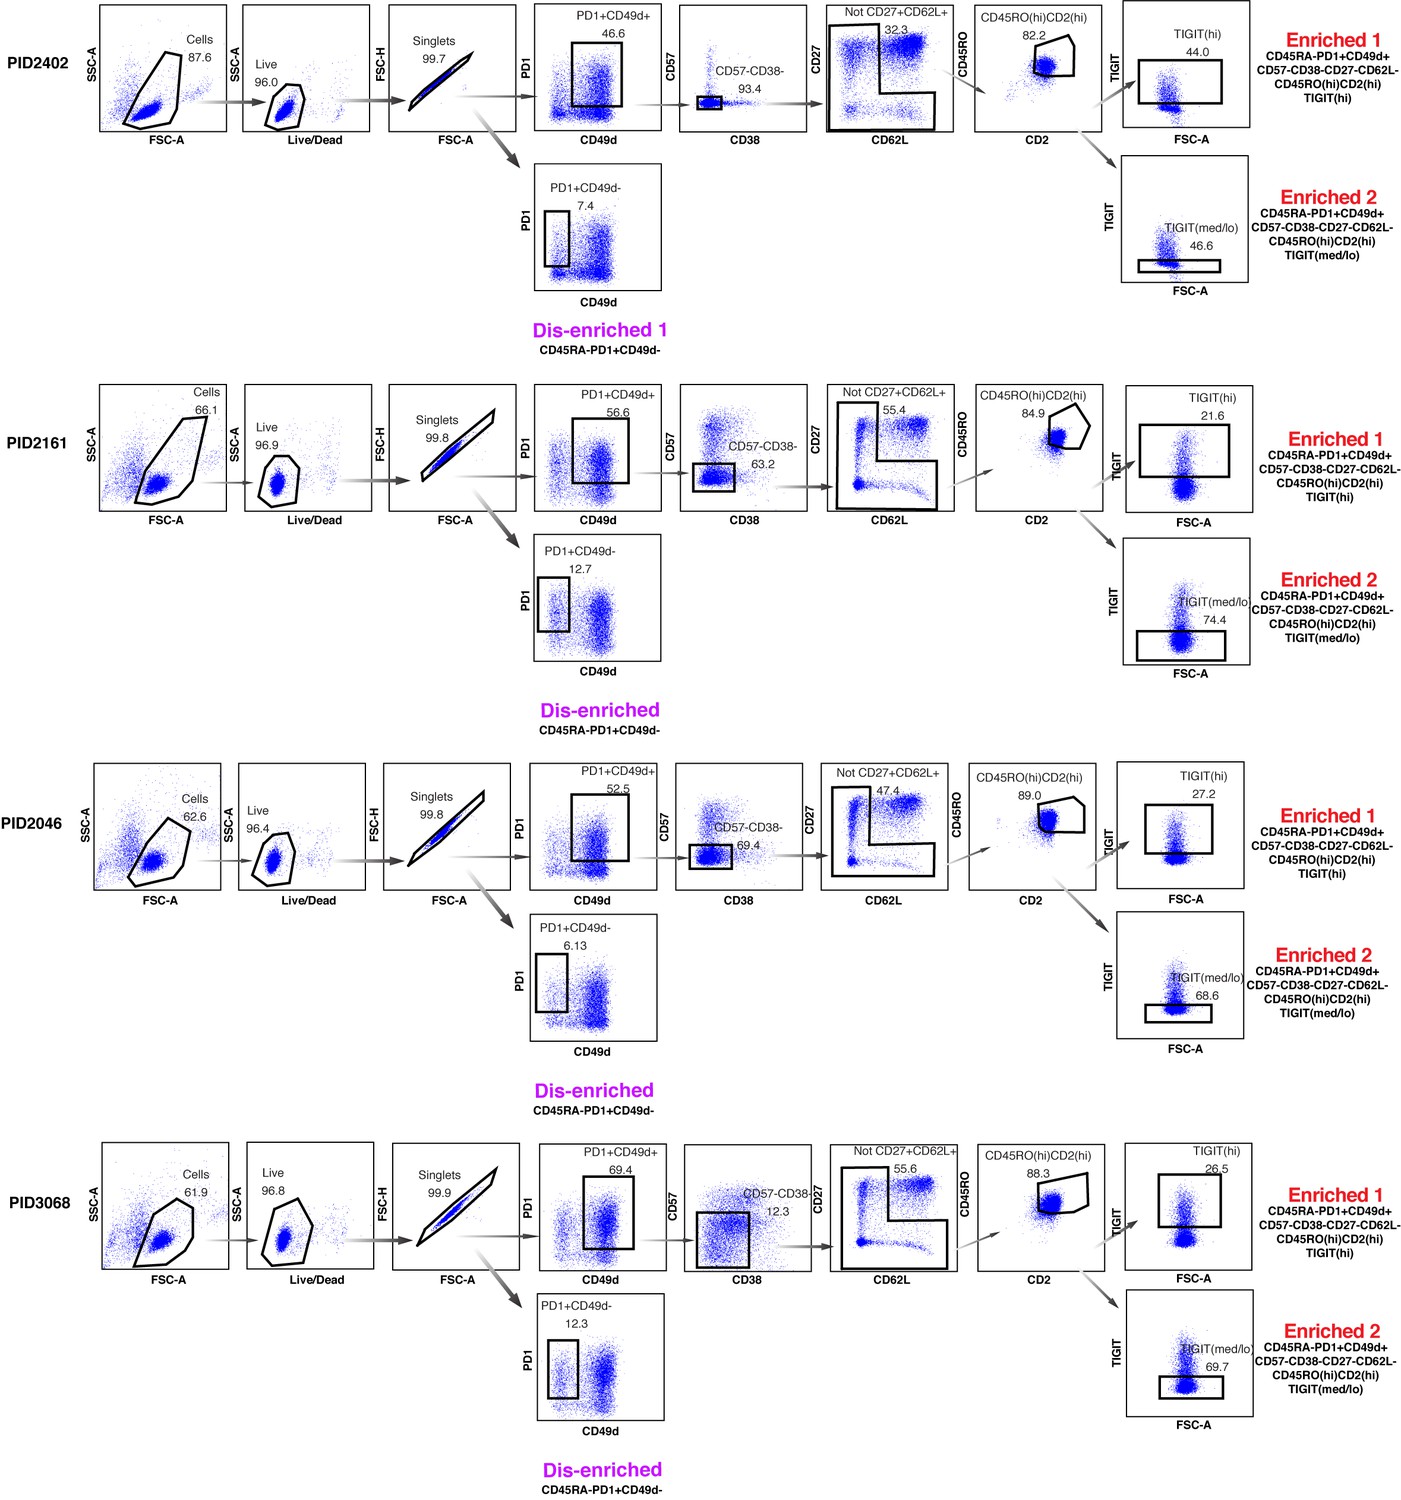
Implementation of the universal sort strategy to isolate three populations memory CD4+ PD1+ T cells harboring different frequencies of kNN latent cells from four untested donors.
The universal sort strategy shown in Figure 6—figure supplement 5 was converted into a multiparameter sort panel and implemented on four new donors. Shown are the sequential FACS plots depicting the sorting that was used to isolate, from each donor, a single population of disenriched cells and two populations of enriched cells (TIGIThigh versus TIGITmed/low). Memory CD4+ T cells from each donor were purified by negative selection before sorting. The phenotypic features of each sorted population are depicted beneath the corresponding population.
Author response image 1
Author response image 2
Tables
Key resources table
| Reagent type (species) or resource | Designation | Source or reference | Identifiers | Additional information |
|---|---|---|---|---|
| Antibody | HLADR (mouse monoclonal) | Thermofisher | Cat#Q22158 | (1 μg/100 μL) |
| Antibody | RORgt (rat monoclonal) | Fisher Scientific | Cat#5013565 | (1 μg/100 μL) |
| Antibody | CD49d (α4) (mouse monoclonal) | Fluidigm | Cat#3141004B | (1 μg/100 μL) |
| Antibody | CTLA4 (mouse monoclonal) | Fisher Scientific | Cat#5012919 | (1 μg/100 μL) |
| Antibody | NFAT (rat monoclonal) | Fluidigm | Cat#3143023A | (1 μg/100 μL) |
| Antibody | CCR5 (mouse monoclonal) | Fluidigm | Cat#3144007A | (1 μg/100 μL) |
| Antibody | BIRC5 (mouse monoclonal) | Fisher Scientific | Cat#MAB886 | (1 μg/100 μL) |
| Antibody | SAMHD1 (rabbit polyclonal) | Proteintech | Cat#12586–1-AP | (1 μg/100 μL) |
| Antibody | Ki67 (mouse monoclonal) | Fisher Scientific | Cat#BDB556003 | (1 μg/100 μL) |
| Antibody | CD95 (mouse monoclonal) | Fisher Scientific | Cat#MAB326100 | (1 μg/100 μL) |
| Antibody | Bcl6 (mouse monoclonal) | Fisher Scientific | Cat#BDB561520 | (1 μg/100 μL) |
| Antibody | CD7 (mouse monoclonal) | Fluidigm | Cat#3147006B | (1 μg/100 μL) |
| Antibody | ICOS (hamster monoclonal) | Fluidigm | Cat#3148019B | (1 μg/100 μL) |
| Antibody | Tbet (mouse monoclonal) | Fisher Scientific | Cat#5013190 | (1 μg/100 μL) |
| Antibody | Gag (71-31) (human monoclonal) | NIH AIDS Reagent | Cat#530 | (1 μg/100 μL) |
| Antibody | Gag (91-5) (human monoclonal) | NIH AIDS Reagent | Cat#1238 | (1 μg/100 μL) |
| Antibody | Gag (241-D) (human monoclonal) | NIH AIDS Reagent | Cat#1244 | (1 μg/100 μL) |
| Antibody | Gag (AG3.0) (mouse monoclonal) | NIH AIDS Reagent | Cat#4121 | (1 μg/100 μL) |
| Antibody | CD2 (mouse monoclonal) | Fluidigm | Cat#3151003B | (1 μg/100 μL) |
| Antibody | CD103 (mouse monoclonal) | Fluidigm | Cat#3151011B | (1 μg/100 μL) |
| Antibody | Gag (28B7) (human monoclonal) | Medimabs | Cat#MM-0289 | (1 μg/100 μL) |
| Antibody | CD62L (mouse monoclonal) | Fluidigm | Cat#3153004B | (1 μg/100 μL) |
| Antibody | TIGIT (mouse monoclonal) | Fludigm | Cat#3154016B | (1 μg/100 μL) |
| Antibody | CCR6 (mouse monoclonal) | BD Biosciences | Cat#559560 | (1 μg/100 μL) |
| Antibody | Gag (KC57) (mouse monoclonal) | Beckman Coulter | Cat#IMBULK1 (custom) | (1 μg/100 μL) |
| Antibody | CD8 (mouse monoclonal) | Biolegend | Cat#301053 | (1 μg/100 μL) |
| Antibody | CD19 (mouse monoclonal) | Biolegend | Cat#302247 | (1 μg/100 μL) |
| Antibody | CD14 (mouse monoclonal) | Biolegend | Cat#301843 | (1 μg/100 μL) |
| Antibody | OX40 (mouse monoclonal) | Fluidigm | Cat#3158012B | (1 μg/100 μL) |
| Antibody | CCR7 (mouse monoclonal) | Fluidigm | Cat#3159003A | (1 μg/100 μL) |
| Antibody | CD28 (mouse monoclonal) | Fluidigm | Cat#3160003B | (1 μg/100 μL) |
| Antibody | CD45RO (mouse monoclonal) | Biolegend | Cat#304239 | (1 μg/100 μL) |
| Antibody | CD69 (mouse monoclonal) | Fluidigm | Cat#3162001B | (1 μg/100 μL) |
| Antibody | CRTH2 (rat monoclonal) | Fluidigm | Cat#3163003B | (1 μg/100 μL) |
| Antibody | PD-1 (mouse monoclonal) | Biolegend | Cat#329941 | (1 μg/100 μL) |
| Antibody | CD127 (mouse monoclonal) | Fluidigm | Cat#3165008B | (1 μg/100 μL) |
| Antibody | CXCR5 (rat monoclonal) | BD Biosciences | Cat#552032 | (1 μg/100 μL) |
| Antibody | CD27 (mouse monoclonal) | Fluidigm | Cat#3167006B | (1 μg/100 μL) |
| Antibody | CD30 (mouse monoclonal) | BD Biosciences | Cat#555827 | (1 μg/100 μL) |
| Antibody | CD45RA (mouse monoclonal) | Fluidigm | Cat#3169008B | (1 μg/100 μL) |
| Antibody | CD3 (mouse monoclonal) | Fluidigm | Cat#3170001B | (1 μg/100 μL) |
| Antibody | CD57 (mouse monoclonal) | Biolegend | Cat#359602 | (1 μg/100 μL) |
| Antibody | CD38 (mouse monoclonal) | Fluidigm | Cat#3172007B | (1 μg/100 μL) |
| Antibody | CD4 (mouse monoclonal) | Fluidigm | Cat#3174004B | (1 μg/100 μL) |
| Antibody | CXCR4 (mouse monoclonal) | Fluidigm | Cat#3175001B | (1 μg/100 μL) |
| Antibody | CD25 (mouse monoclonal) | Biolegend | Cat#356102 | (1 μg/100 μL) |
| Antibody | PE-CF594 CD27 (mouse monoclonal) | BD Biosciences | Cat#562297 | (1:25–1:200) |
| Antibody | BUV737 CD38 (mouse monoclonal) | BD Biosciences | Cat#564686 | (1:25–1:200) |
| Antibody | BUV395 CD45RO (mouse monoclonal) | BD Biosciences | Cat#564291 | (1:25–1:200) |
| Antibody | FITC CD57 (mouse monoclonal) | BD Biosciences | Cat#555619 | (1:25–1:200) |
| Antibody | BV650 CD62L (mouse monoclonal) | BD Biosciences | Cat#563808 | (1:25–1:200) |
| Antibody | APC CD69 (mouse monoclonal) | Biolegend | Cat#310910 | (1:25–1:200) |
| Antibody | BV421 CD69 (mouse monoclonal) | BD Biosciences | Cat#562884 | (1:25–1:200) |
| Antibody | APC CD103 (mouse monoclonal) | BD Biosciences | Cat#563883 | (1:25–1:200) |
| Antibody | APC-R700 CXCR5 (CD185) (rat monoclonal) | BD Biosciences | Cat#565191 | (1:25–1:200) |
| Antibody | PE-Cy7 CD134 (OX40) (mouse monoclonal) | BD Biosciences | Cat#563663 | (1:25–1:200) |
| Antibody | PE CD279 (PD-1) (mouse monoclonal) | BD Biosciences | Cat#560795 | (1:25–1:200) |
| Antibody | BUV737 CD28 (mouse monoclonal) | BD Biosciences | Cat#612815 | (1:25–1:200) |
| Antibody | BB515 CD49d (mouse monoclonal) | BD Biosciences | Cat#564593 | (1:25–1:200) |
| Antibody | PE/Dazzle 594 CD197 (CCR7) (mouse monoclonal) | Biolegend | Cat#353236 | (1:25–1:200) |
| Antibody | Brilliant Violet 421 CD195 (CCR5) (mouse monoclonal) | Biolegend | Cat#359118 | (1:25–1:200) |
| Antibody | PE-Cy7 CD57 (mouse monoclonal) | Thermofisher | Cat#25-0577-42 | (1:25–1:200) |
| Antibody | BUV395 CD25 (mouse monoclonal) | BD Biosciences | Cat#564034 | (1:25–1:200) |
| Antibody | APC-H7 CD7 (mouse monoclonal) | BD Biosciences | Cat#564020 | (1:25–1:200) |
| Antibody | BV605 CD127 (mouse monoclonal) | BD Biosciences | Cat#562662 | (1:25–1:200) |
| Antibody | APC TIGIT (mouse monoclonal) | Biolegend | Cat#372706 | (1:25–1:200) |
| Antibody | PE-Cy5 CD28 (mouse monoclonal) | Biolegend | Cat#302910 | (1:25–1:200) |
| Antibody | APC-Cy7 CD69 (mouse monoclonal) | BD Biosciences | Cat#560737 | (1:25–1:200) |
| Antibody | BV421 CD2 (mouse monoclonal) | Biolegend | Cat#309218 | (1:25–1:200) |
| Antibody | PE-Cy7 CD57 (mouse monoclonal) | Thermofisher | Cat#25-0577-42 | (1:25–1:200) |
Additional files
-
Source code 1
Source code for PP-SLIDE identification of kNN latent cells.
- https://cdn.elifesciences.org/articles/60933/elife-60933-code1-v1.zip
-
Supplementary file 1
List of CyTOF antibodies used in the study.
Antibodies were either purchased from the indicated vendor or prepared in-house using commercially available MaxPAR conjugation kits per manufacturer’s instructions (Fluidigm).
- https://cdn.elifesciences.org/articles/60933/elife-60933-supp1-v1.docx
-
Supplementary file 2
Participant characteristics.
Table of participant characteristics listing gender, ethnicity, age, year of first HIV+ test, viral load, CD4 count at the time of sampling, ART regimen, and specimen type used in this study.
- https://cdn.elifesciences.org/articles/60933/elife-60933-supp2-v1.docx
-
Transparent reporting form
- https://cdn.elifesciences.org/articles/60933/elife-60933-transrepform-v1.docx
Download links
A two-part list of links to download the article, or parts of the article, in various formats.
Downloads (link to download the article as PDF)
Open citations (links to open the citations from this article in various online reference manager services)
Cite this article (links to download the citations from this article in formats compatible with various reference manager tools)
Phenotypic analysis of the unstimulated in vivo HIV CD4 T cell reservoir
eLife 9:e60933.
https://doi.org/10.7554/eLife.60933


