Subthalamic beta-targeted neurofeedback speeds up movement initiation but increases tremor in Parkinsonian patients
- MRC Brain Network Dynamics Unit at the University of Oxford, United Kingdom
- Nuffield Department of Clinical Neurosciences, University of Oxford, United Kingdom
- Neurosciences Research Centre, Molecular and Clinical Sciences Research Institute, St George’s University of London, United Kingdom
- Department of Neurology, Bern University Hospital and University of Bern, Switzerland
- Department of Neurosurgery, King's College Hospital NHS Foundation Trust, King's Health Partners, United Kingdom
- School of Automation Science and Engineering, South China University of Technology, China
Figures
Figure 1
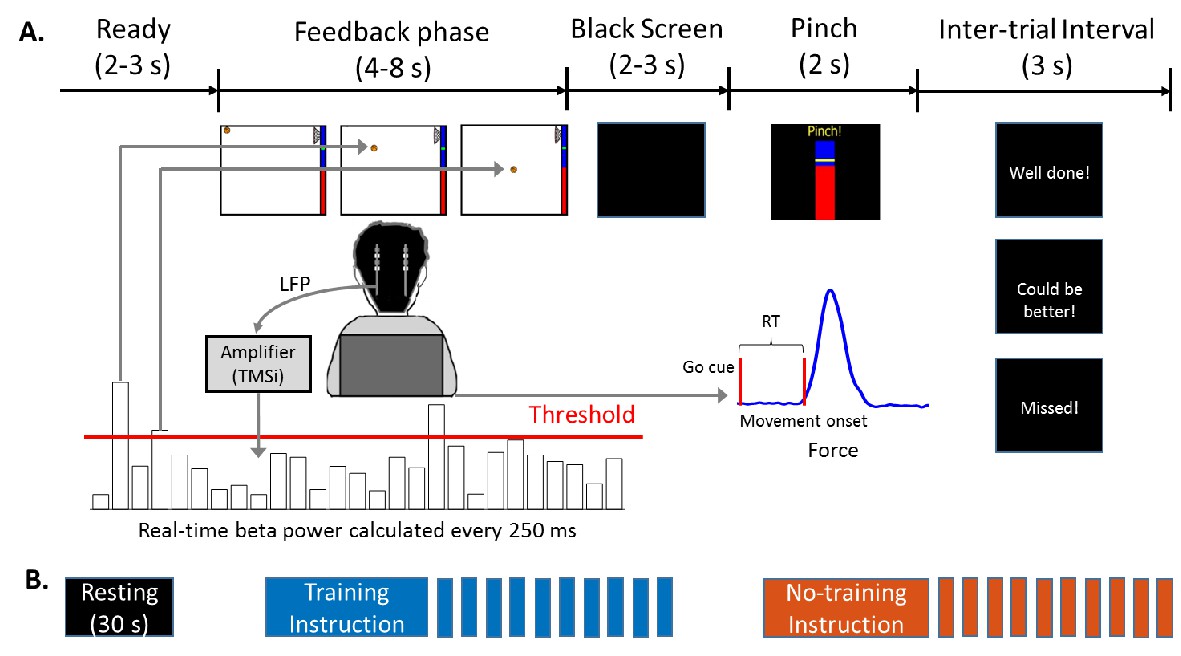
Experimental protocol.
(A) Timeline of one individual trial. Each trial consisted of a neurofeedback phase followed by a cued pinch movement. After the finger pinch motor task, a message was displayed (‘Well done!’ or ‘Could be better!’) depending on whether the reaction time of the previous movement was shorter or longer than 800 ms. If movement onset was not detected within 2 s after the Go cue, the message ‘Missed!’ was displayed. (B) Timeline of one experimental session which consisted of 30 s of resting, and one block of 10 trials in the ‘Training’ condition (when participants were instructed to keep the basketball floating) and one block of 10 trials in the ‘No Training’ condition (when the participants were instructed to just pay attention to the movement of the basketball). The order of the ‘Training’ and ‘No raining’ blocks was randomized across sessions. At the beginning of each session the threshold was recalculated based on recordings made at rest.
Figure 2
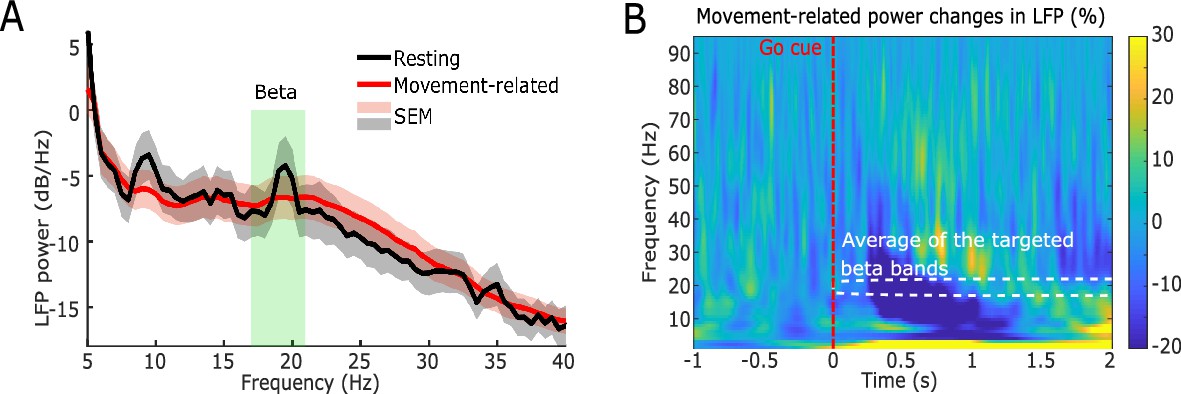
Power spectra of the neurofeedback-targeted subthalamic nucleus (STN) local field potential (LFP) signals averaged across 21 hemispheres.
(A) Resting (black) and movement-related (red) power spectral density in STN LFP recorded during the calibration procedure. The green shaded area indicates the average of the targeted beta frequency bands. (B) Group average time-frequency power spectra locked to the Go cue (red dashed line) which prompted a finger pinch movement. The white dashed rectangle indicates the average targeted beta band. The blue color displays a decrease in power relative to the pre-cue baseline (expressed as percentage change).
Figure 3
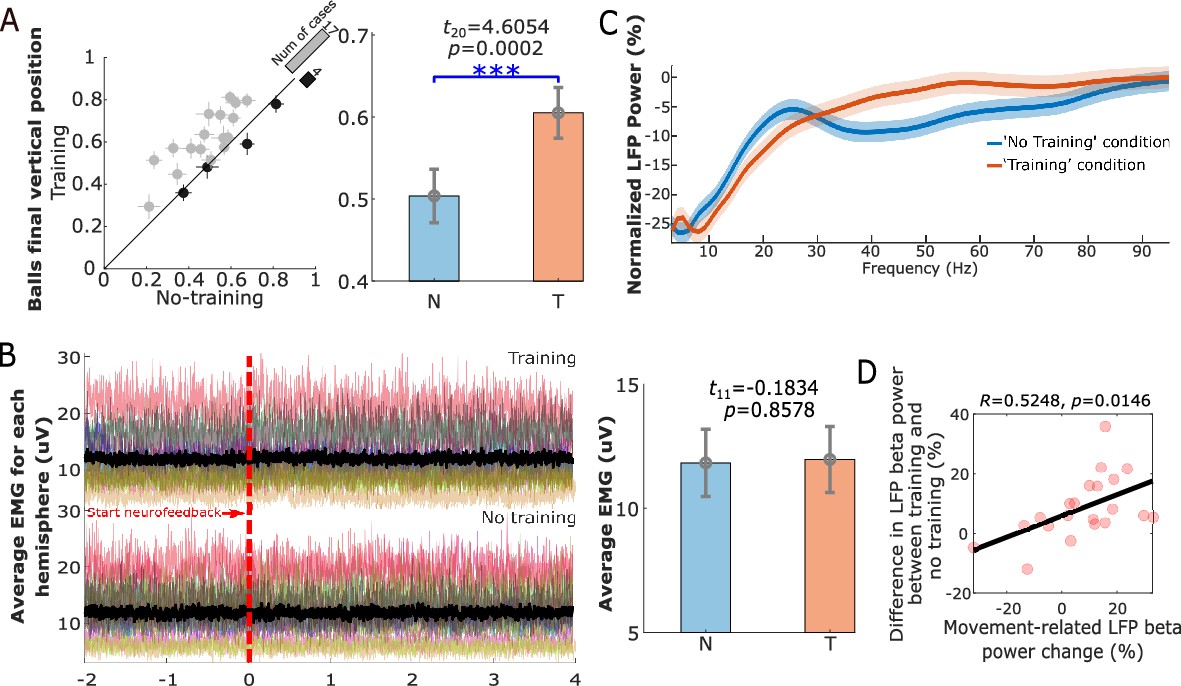
Neurofeedback training performance.
(A) The final vertical position of the basketball for each individual hemisphere (left) and group-averaged balls’ final vertical positions (mean ± SEM) in the ‘Training’ (T) and ‘No Training’ (N) conditions (right). The dots with crosses indicate the means and cross-trial SEMs for each tested hemisphere. The gray and dark-shaded dots indicate higher measurement in the ‘Training’ and ‘No Training’ conditions, respectively. The bar on the diagonal refers to the number of cases with higher measurement in each condition. The error bar plots on the right show the mean and SEM across all tested hemispheres in different conditions. (B) There was no significant difference between the rectified EMG amplitude during the neurofeedback phase in the ‘Training’ and ‘No Training’ conditions. Different colors on the left indicate the average EMGs for different hands contralateral to the tested hemispheres. The black line indicates the averaged EMG traces across hands in different conditions. The error bar plots on the right show the mean and SEM during the neurofeedback phase across hands in different conditions. (C) Group-averaged power spectra of the targeted STN LFP signals (normalized against the pre-cue resting period) in the ‘Training’ (orange) and ‘No Training’ (blue) conditions for different frequencies. Solid lines and the shaded areas show the average and SEM across all tested hemispheres. (D) The reduced beta power by neurofeedback training positively correlated with the movement-related power changes. Each pink dot indicates a hemisphere. ***p < 0.001.
Figure 4 with 1 supplement
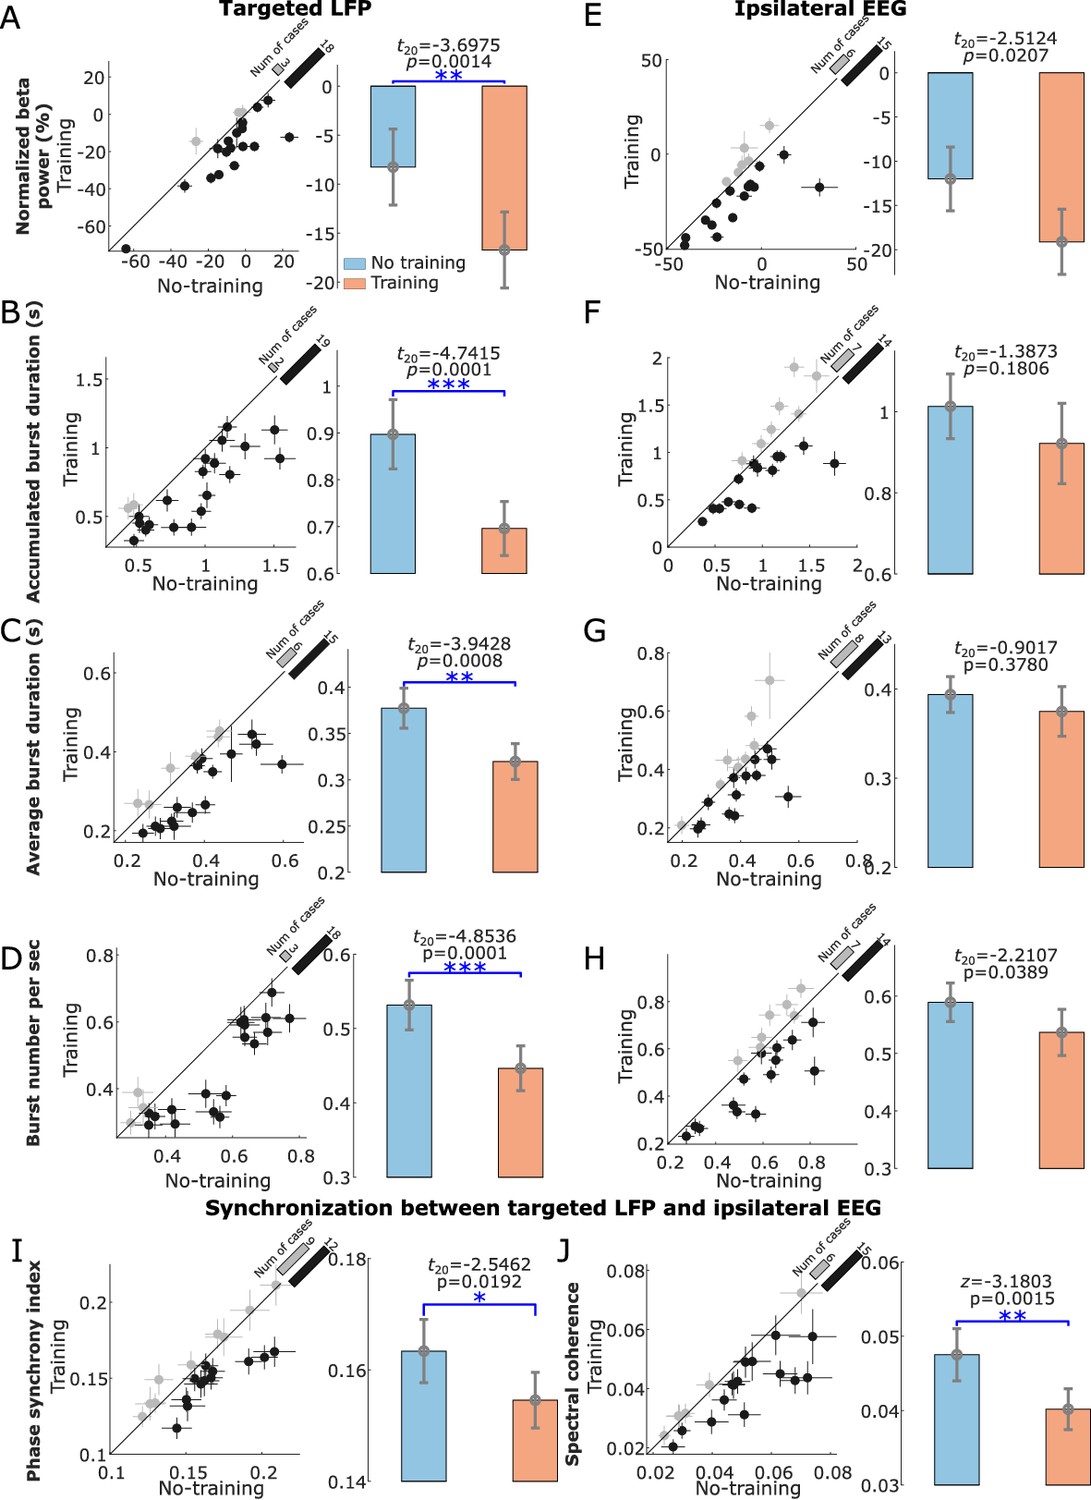
Normalized beta power and burst characteristics in the targeted subthalamic nucleus (STN) local field potential (LFP) and electroencephalogram (EEG) from ipsilateral motor cortex.
(A–D) Normalized beta power (A), total burst duration (B), average burst duration (C), and number of beta bursts per second (D) in the STN LFP were all significantly reduced in the ‘Training’ condition compared to the ‘No Training’ condition. (E–H) The same for EEG from ipsilateral motor cortex. (I and J) The phase synchrony index (I) and spectral coherence (J) between STN and ipsilateral motor cortex were significantly reduced in ‘Training’ condition compared with ‘No Training’ condition. The dots with crosses indicate the means and cross-trial SEMs for each tested hemisphere. The gray and dark-shaded dots indicate higher measurement in the ‘Training’ and ‘No Training’ conditions, respectively. The bar on the diagonal refers to the number of cases with higher measurement in each condition. The error bar plots on the right show the mean and SEM across all tested hemispheres in different conditions; *p < 0.05, **p < 0.01/4 in (A) and (C), **p < 0.01 in (J), ***p < 0.001/4; Beta indicates hemisphere-specific beta band.
Figure 4—figure supplement 1
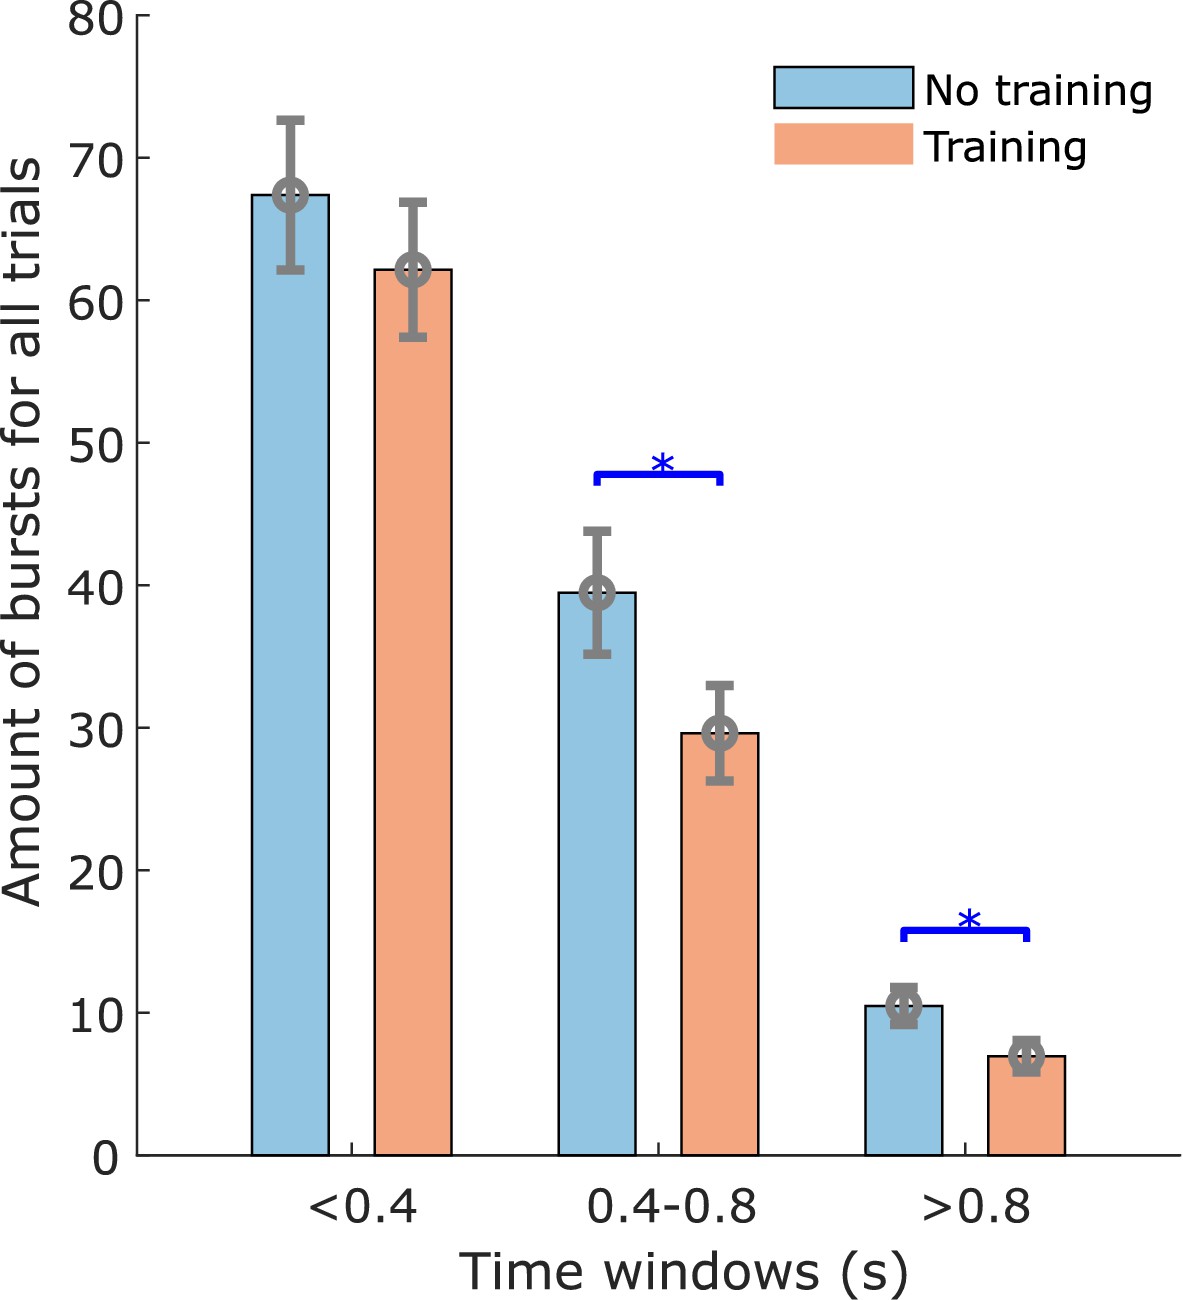
Distribution profiles of the beta bursts of different durations during the 4 s feedback phase in the ‘Training’ (orange) and ‘No Training’ (blue) conditions.
X-axis indicates different burst durations and Y-axis indicates the total number of bursts in each condition. * indicates significant difference with correction for multiple comparison (p < 0.0167).
Figure 5
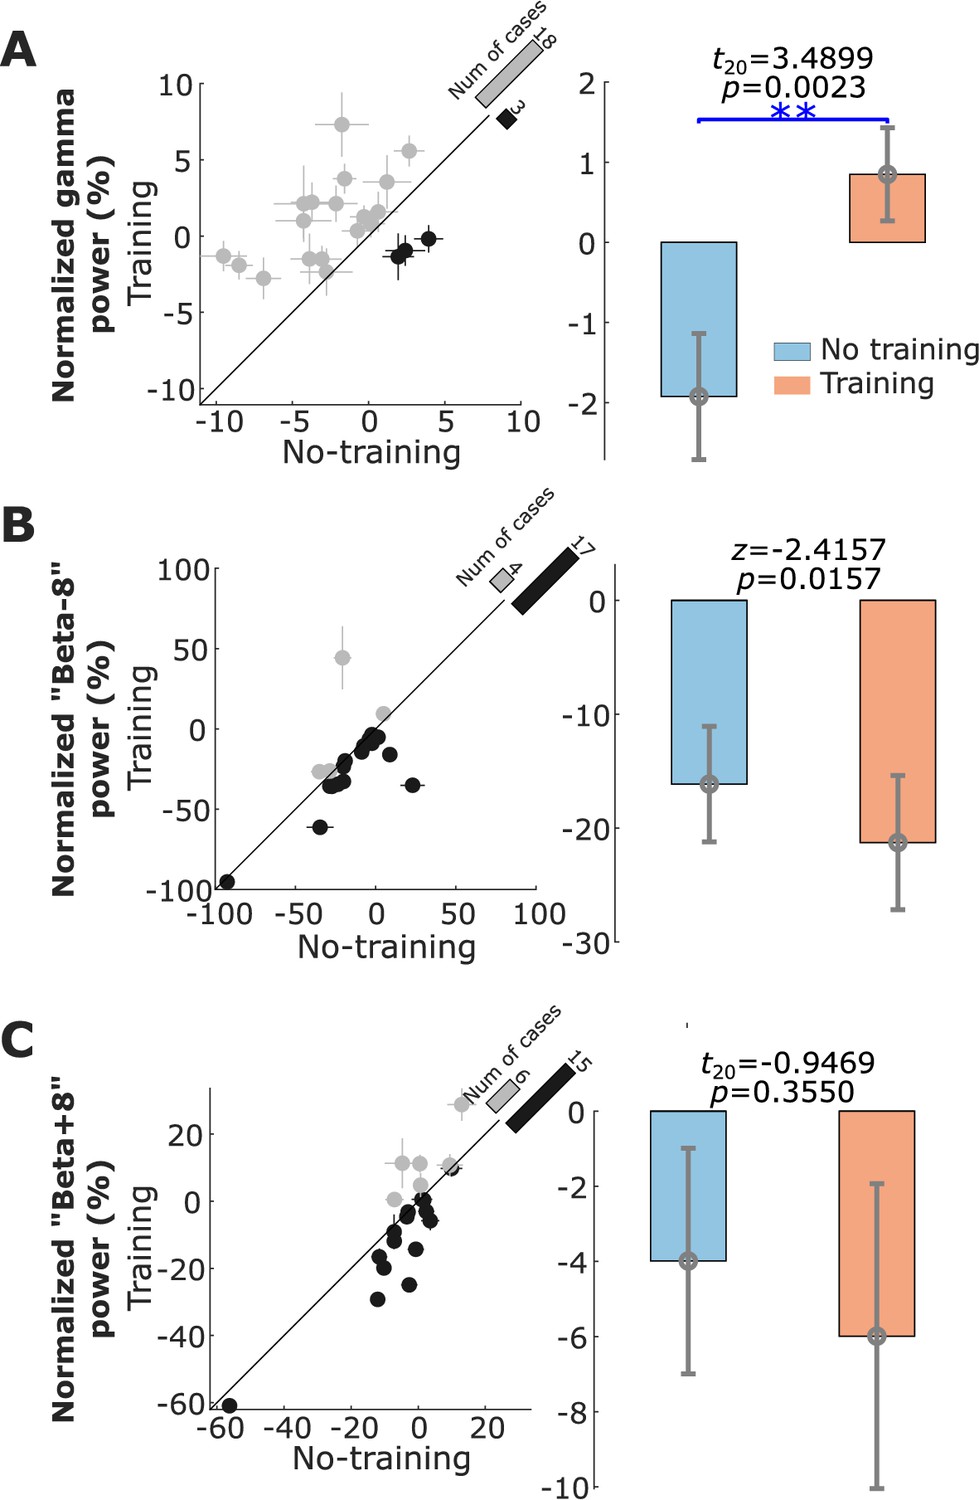
Normalized power in the gamma, ‘Beta−8’, and ‘Beta+8’ frequency bands associated with neurofeedback training in the targeted subthalamic nucleus (STN) local field potential (LFP).
(A) The average normalized gamma (55–95 Hz) power in the STN LFP was significantly increased in the ‘Training’ condition compared with the ‘No Training’ condition. (B and C) There was no significant change in the power percentage change in the ‘Beta−8’ frequency band and the ‘Beta+8’ frequency band between the ‘Training’ and ‘No Training’ conditions. The dots with crosses indicate the means and cross-trial SEMs for each tested hemisphere. The gray and dark-shaded dots indicate higher measurement in the ‘Training’ and ‘No Training’ conditions, respectively. The bar on the diagonal refers to the number of cases with higher measurement in each condition. The error bar plots on the right show the mean and SEM across all tested hemispheres in different conditions; **p < 0.01; Beta indicates hemisphere-specific beta band.
Figure 6 with 2 supplements

Behavioral changes (reaction time and tremor) associated with neurofeedback training.
(A) The reaction time for each individual hemisphere (left) and group-averaged reaction time in the ‘Training’ and ‘No Training’ conditions (right). (B) Recorded left-hand pinch force in the ‘Training’ (red) and ‘No Training’ (blue) conditions for each individual trial (dashed line) and the trial-averaged curves (solid lines) from Patient 12. (C) Normalized tremor power quantified based on measurements from the accelerometer in the ‘Training’ and ‘No Training’ conditions for the nine hemispheres that displayed contralateral tremor during the experiment. (D) Normalized power in the tremor frequency band in the subthalamic nucleus local field potential for the nine hemispheres that displayed contralateral tremor during the experiment. * indicates significance after correction for multiple comparison p < 0.0167.
Figure 6—figure supplement 1
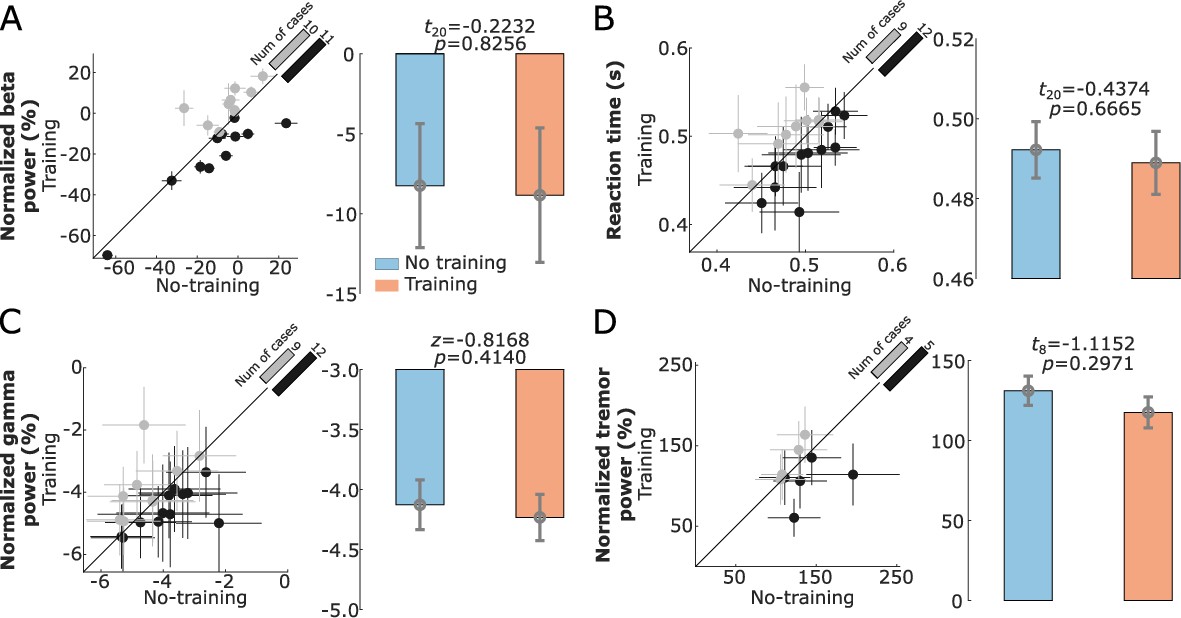
No significant difference in the reaction time, normalized gamma power, and normalized tremor power between trails from ‘Training’ and ‘No Training’ conditions with similar normalized beta power.
(A) A subgroup (75%) of trials with matched normalized beta power were selected from the ‘Training’ and ‘No Training’ conditions for each participant. When these trials with matched normalized beta power were considered, there was no significant effect of the experimental condition on the reaction time (B), normalized gamma power (C), or normalized tremor power (D). The dots with crosses indicate the means and cross-trial SEMs for each tested hemisphere. The gray and dark shading of the dots indicate higher measurement in the ‘Training’ and ‘No Training’ conditions, respectively. The bar on the diagonal refers to the number of cases with higher measurement in each condition. The error bar plots on the right show the mean and SEM across all tested hemispheres in different conditions.
Figure 6—figure supplement 2
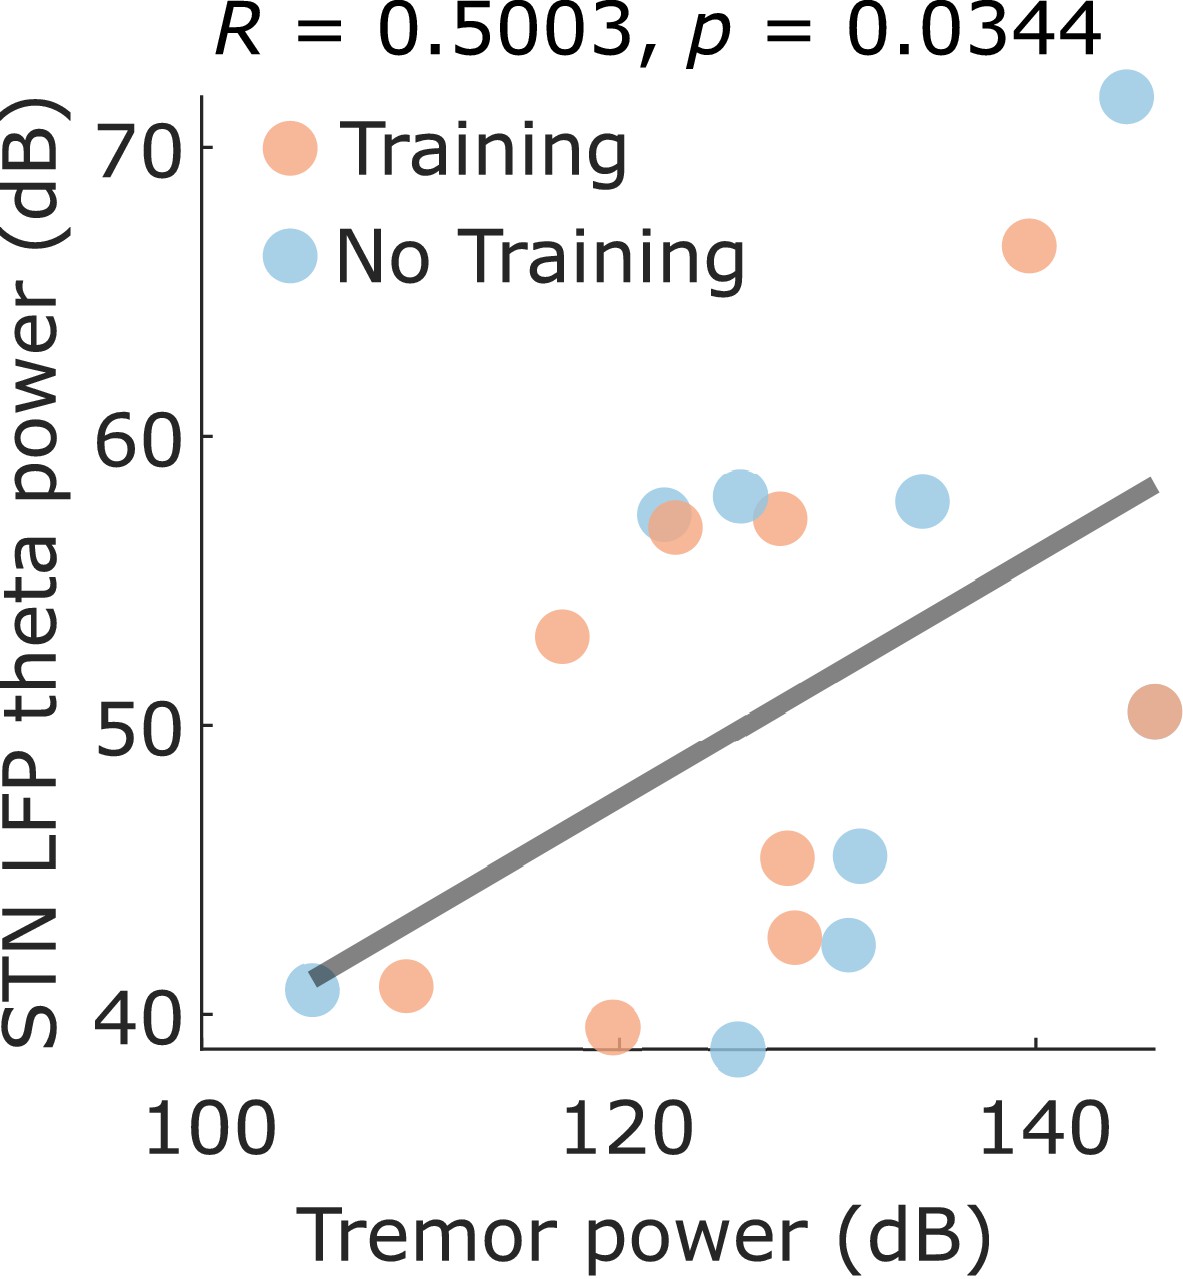
Subthalamic nucleus (STN) local field potential (LFP) theta power positively correlated with tremor power.
Each dot indicates the average tremor power measured from accelerometer (X-axis) and the theta band power in the STN LFP (X-axis) in the ‘Training’ (orange) and ‘No Training’ (blue) conditions for one hemisphere.
Figure 7
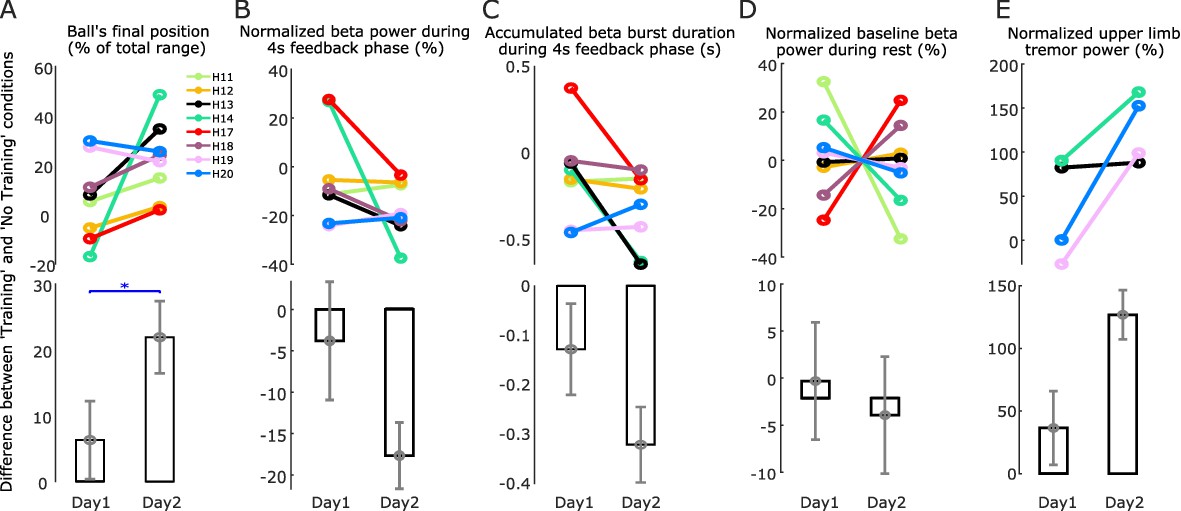
Comparison between two training days.
(A) The difference in the basketball’s final vertical position between the ‘Training’ and ‘No Training’ conditions, an indication of the neurofeedback control performance, was significantly increased on Day 2 compared to Day 1. (B) The reduction in the average normalized beta power in the ‘Training’ condition compared to the ‘No Training’ condition was further enhanced on Day 2 compared to Day 1. (C) The reduction in the total beta burst duration in the ‘Training’ condition compared to the ‘No Training’ condition was further enhanced on Day 2 compared to Day 1. (D) There was no significant change in the baseline beta power during rest between Day 1 and Day 2. The baseline beta power was quantified during all the time periods when the participants were at rest throughout the whole experiment session and then normalized by dividing the mean value across 2 days to achieve the percentage change value. (E) The increase in the normalized tremor power in the ‘Training’ condition compared to the ‘No Training’ condition was also enhanced during Day 2 compared to Day 1. Individual hemispheres and group-averaged data are shown in the upper and lower panels, respectively. Values are presented as mean ± SEM; *p < 0.05 (Wilcoxon signed rank test).
Tables
Table 1
Patients' details.
| Patient | G | Age (yr) | DD (yr) | U off | U on | DBS lead | Selected contact (L/R) | Beta peak (L/R Hz) | Predominant symptom(s) before surgery |
|---|---|---|---|---|---|---|---|---|---|
| 1 | M | 48 | 17 | 71 | 37 | Bost | L03/R03 | 15/15 | Tremor |
| 2a | M | 66 | 15 | 57 | 34 | Medt | L23/R01 | 20/20 | Mixed |
| 3a | F | 70 | 20 | 54 | 19 | Medt | L01/R23 | 20/20 | Akinetic-rigid, tremor |
| 4 | M | 69 | 17 | 37 | 18.5 | Medt | L23/R23 | 21/20 | Akinetic-rigid, tremor |
| 5 | F | 66 | 10 | 53 | 30 | Bost | L01/R01 | 15/15 | Akinetic-rigid |
| 6b | M | 65 | 5 | 34 | 16 | Medt | L01/R23 | 15/25 | Akinetic-rigid |
| 7a,b | M | 61 | 9 | 33 | 12 | Bost | L01/R23 | 20/22 | Tremor |
| 8c | M | 49 | 8 | 45 | 34 | Bost | L01 | 15 | Tremor |
| 9c | F | 57 | 6 | 48 | 19 | Bost | L23 | 19 | Mixed |
| 10b | M | 51 | 12 | 27 | 13 | Bost | L23/R23 | 22/21 | Akinetic-rigid |
| 11a,b | M | 67 | 6 | N/A | N/A | Bost | L23/R23 | 19/19 | Tremor |
| 12a,c | F | 75 | 7 | 36 | 19 | Medt | R12 | 18 | Tremor, bradykinesia, freezing |
| Mean | - | 62 | 11 | 45 | 22.9 | - | - | 18.9 | - |
| SEM | - | 8.8 | 5.1 | 13.1 | 9.1 | - | - | 0.6 | - |
-
Patients 2, 3, 7, and 11 (a) had tremor during the experiment. Patients 6, 7, 10, and 11 (b) performed the test on two consecutive days. Patient 8, 9, and 12 (c) were only recorded on one side. G = gender; yr = year; U Off/On = UPDRS Off/On; DBS = deep brain stimulation; L/R = left/right; SEM = standard error of the mean; N/A = unknown; Bost = Vercise Cartesia Directional Lead, Boston Scientific; Medt = Quadripolar Macroelectrode, Model 3389, Medtronic.
Table 2
Generalized linear mixed effects modeling details.
| ID | Model | Akaike's information criterion (AIC) | k-Value | p-Value | R2 |
|---|---|---|---|---|---|
| 1 | −1201.4 | 0.1893 | |||
| 2 | −1194.6 | 0.1912 | |||
| 3 | −1189.5 | 0.1897 | |||
| 4 | −1182.4 | 0.1869 | |||
| 5 | −1190 | 0.1888 | |||
| 6 | −1236.5 | | | 0.2072 | |
| 7 | −1195.7 | 0.1924 | |||
| 8 | −1218.1 | | | 0.1965 | |
| 9 | −1236.6 | | | 0.2076 |
-
Response distribution: Inverse Gaussian.
Link function: identity.
-
T or N: ‘Training’ (valued 1) or ‘No Training’ (valued 0) conditions.
: Average LFP beta power during the 2 s before the Go-cue.
-
: Accumulated LFP beta burst duration during the 2 s before the Go-cue.
: Average LFP beta burst duration during the 2 s before the Go-cue.
-
: LFP beta burst number during the 2 s before the Go-cue.
: Average LFP gamma (55–95 Hz) power during the 2 s before the Go-cue.
-
: Average LFP alpha (8–12 Hz) power during the 2 s before the Go-cue.
: Average EEG beta power during the 2 s before the Go-cue.
-
: Average EEG alpha (8–12 Hz) power during the 2 s before the Go-cue.
Additional files
-
Source code 1
Source data and codes for Figures 2, 3, 4, 5, 6, 7, all supplement figures, and Table 2.
- https://cdn.elifesciences.org/articles/60979/elife-60979-code1-v2.zip
-
Transparent reporting form
- https://cdn.elifesciences.org/articles/60979/elife-60979-transrepform-v2.docx
Download links
A two-part list of links to download the article, or parts of the article, in various formats.
Downloads (link to download the article as PDF)
Open citations (links to open the citations from this article in various online reference manager services)
Cite this article (links to download the citations from this article in formats compatible with various reference manager tools)
Subthalamic beta-targeted neurofeedback speeds up movement initiation but increases tremor in Parkinsonian patients
eLife 9:e60979.
https://doi.org/10.7554/eLife.60979


