Deletion of Stk11 and Fos in mouse BLA projection neurons alters intrinsic excitability and impairs formation of long-term aversive memory
- Departments of Biology, Brandeis University, United States
- Departments of Psychology, Brandeis University, United States
- Volen Center for Complex Systems, Brandeis University, United States
Figures
Figure 1 with 1 supplement
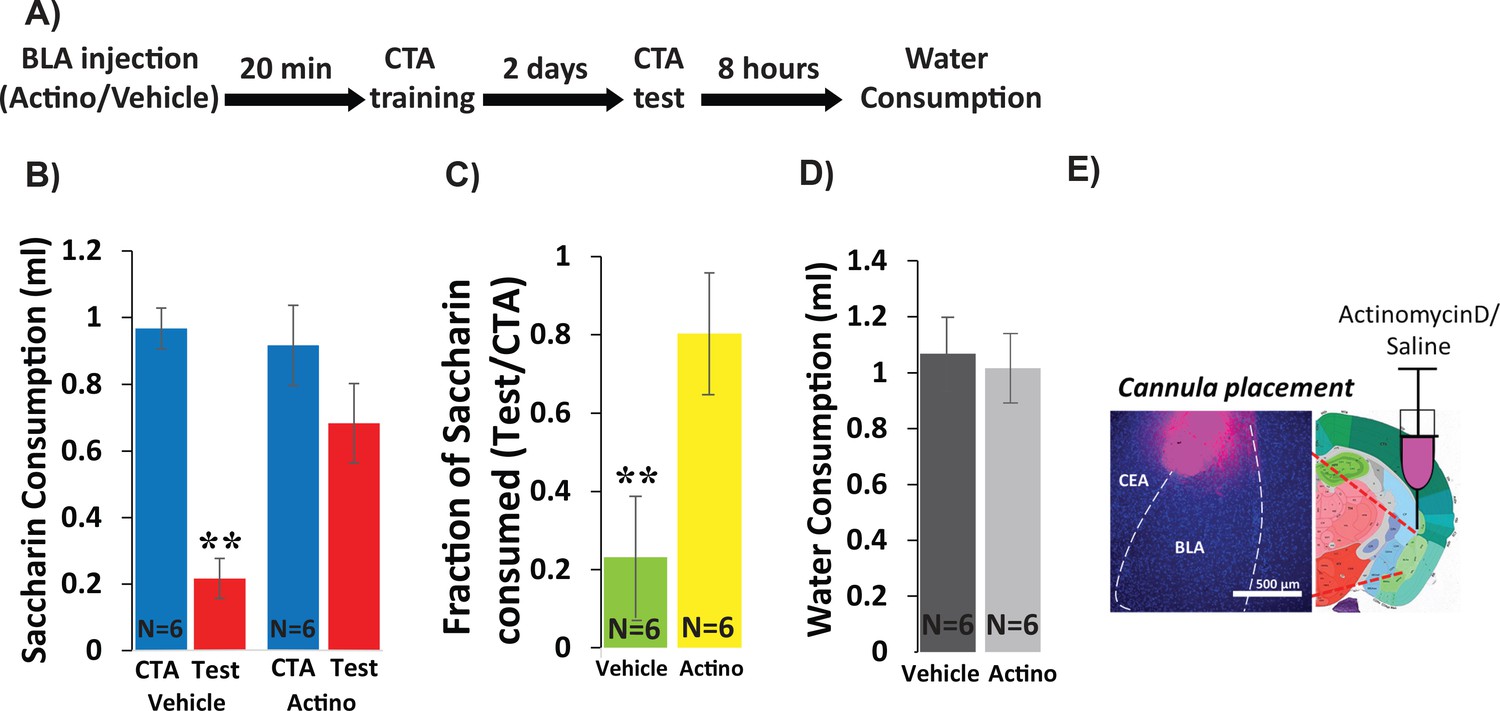
Inhibiting BLA transcription impairs CTA Learning.
(A) Protocol for injection (1 µl per hemisphere) of Actinomycin-D (50 ng) or vehicle (PBS with 0.02% DMSO). (B) Actinomycin D injection prior to CTA training impairs learning, expressed as a reduction in saccharin consumption between CTA and test sessions. Two-way mixed ANOVA revealed a significant effect of treatment and a significant interaction between training and treatment (treatment: F(1,10) = 9.99, p=0.010; training: F(1,10) = 4.62, p=0.057; interaction: F(1,10) = 5.237, p=0.045). Post hoc analysis (Bonferroni corrected) revealed significant reductions (p=0.001) of saccharin consumption (training vs. test) for vehicle treated, but not for actinomycin-D treated mice (p=0.94), and significant differences between the treatment groups during the test (p=7.1×10⁻³) but not during the training session (p=0.56). (C) Fraction of saccharin consumed (Test/CTA) was significantly higher (t(10)=-3.4; p=0.007) following Actinomycin D treatment than vehicle, consistent with weaker memory. (D) Treatments did not differ in water consumption measured 8 hr later (t(10)=0.28; p=0.79) suggesting this does not account for differences in consumption during the test. **p<0.01. (E) Guide cannula was coated with fluorescent dye to assess placement (Left) relative to desired location in anterior BLA (Right; bregma −1.4 mm; Allen brain atlas). Note that the injection cannula extended 0.5 mm further into the BLA. See also Figure 1—source datas 1 and 2 and Figure 1—figure supplement 1.
-
Figure 1—source data 1
Saccharin consumption (ml) during CTA training and test.
This data relates to Figure 1 panel B.
- https://cdn.elifesciences.org/articles/61036/elife-61036-fig1-data1-v2.docx
-
Figure 1—source data 2
Fraction of saccharin consumed (Test/Training).
This data relates to Figure 1 panel C.
- https://cdn.elifesciences.org/articles/61036/elife-61036-fig1-data2-v2.docx
Figure 1—figure supplement 1
Testing CTA in mice.
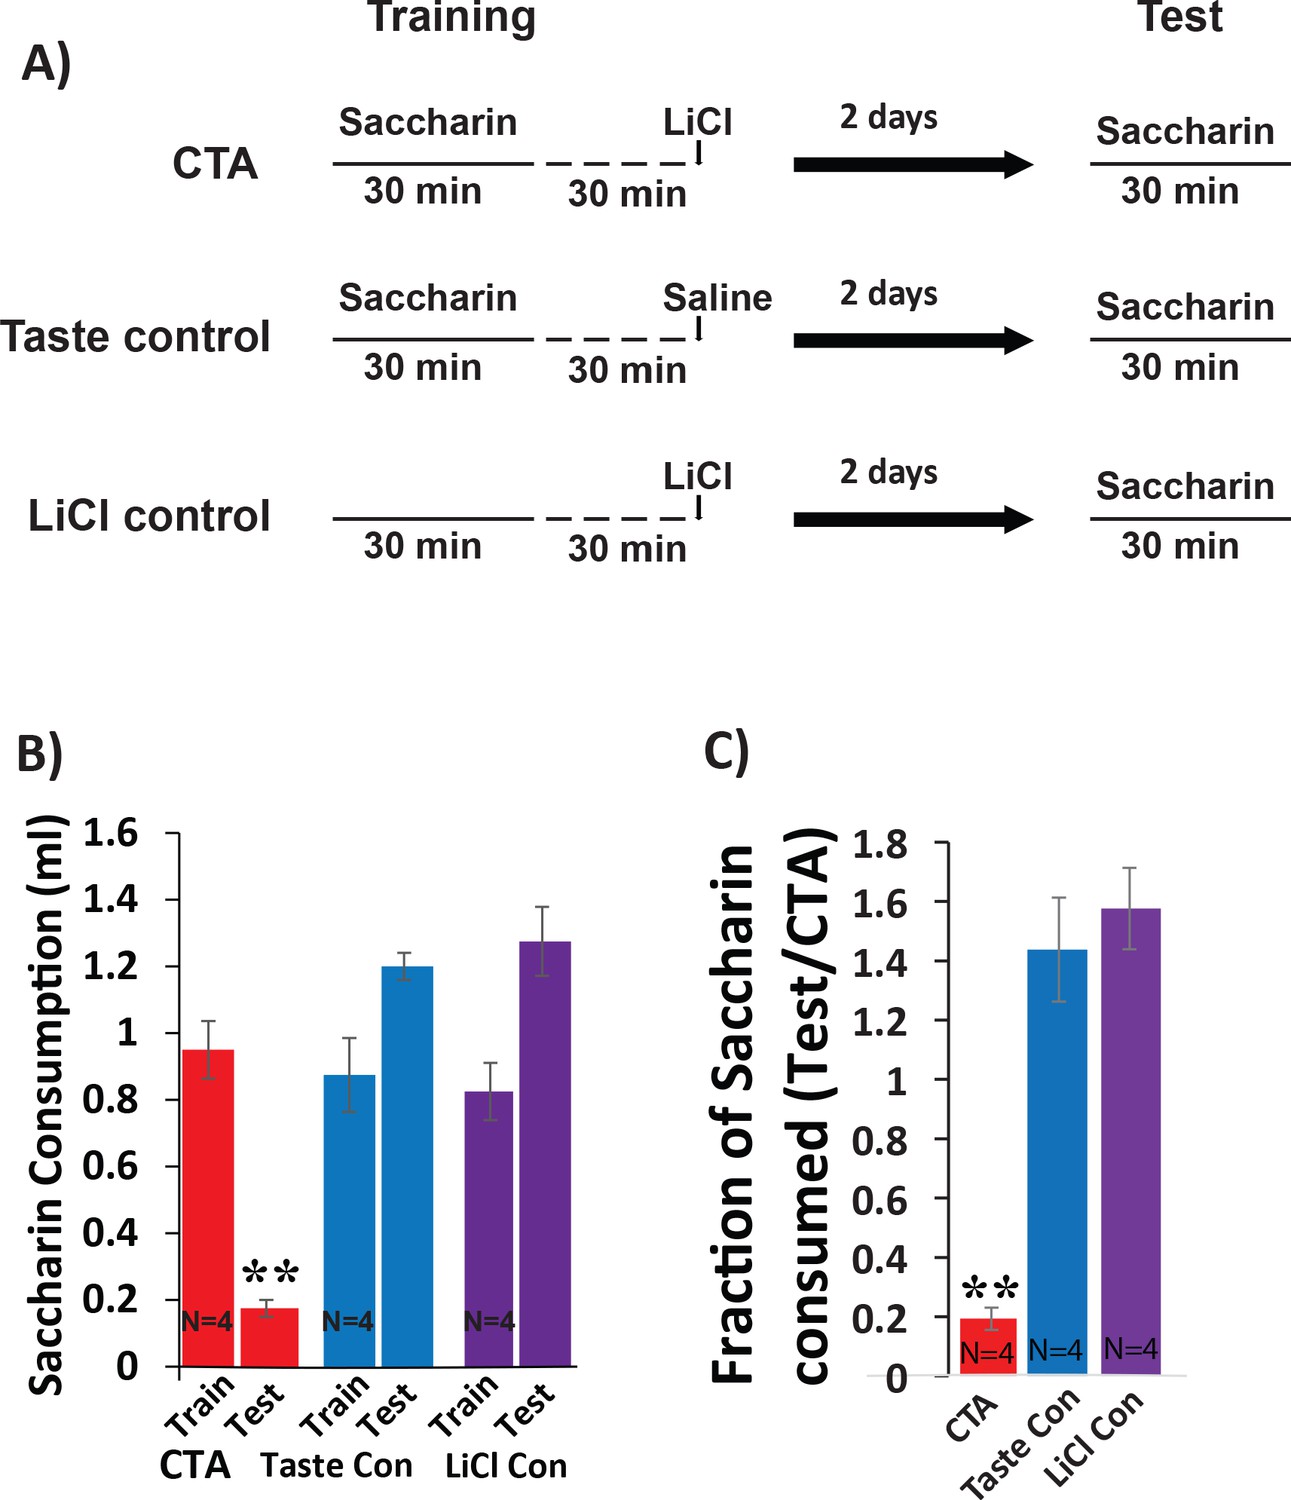
(A) Timeline showing behavioral paradigm. CTA and Taste control receive 30 min of 0.5% saccharin consumption followed by intraperitoneal injection (I.P) injection of lithium-chloride (LiCl; 0.15 M, 2% body-weigh) or saline 30 min later. The lithium control group receives the same I.P injection of LiCl, but no saccharin during the training phase. All groups were tested for consumption of saccharin during 30 min exposure 48 hr later. (B) Saccharin consumption decreases following LiCl-induced malaise (N = 4/group). There was a main effect (two-way mixed ANOVA) on the volume of saccharin consumed between groups across sessions: (F(2,9) = 18.09, p=7.03×10⁻⁴). Post-hoc analysis (Bonferroni corrected) between training and test within each group revealed significant differences only for the CTA group (CTA: p=5×10⁻³; LiCl control: p=0.14; taste control: p=0.051). (C) The strength of CTA memory was determined by quantifying the fraction of saccharin consumed on the test day relative to the training day. Comparing CTA strengths across groups revealed a significant difference f(2,9)=34.08, p=6×10⁻⁵ with significant pairwise differences for CTA vs taste control (p=2.5×10⁻⁴) and for CTA vs LiCl control (p=1.1×10⁻⁴), but not for the two control groups (p=1 for taste control vs LiCl control). *p<0.05; **p<0.01.
Figure 2 with 4 supplements
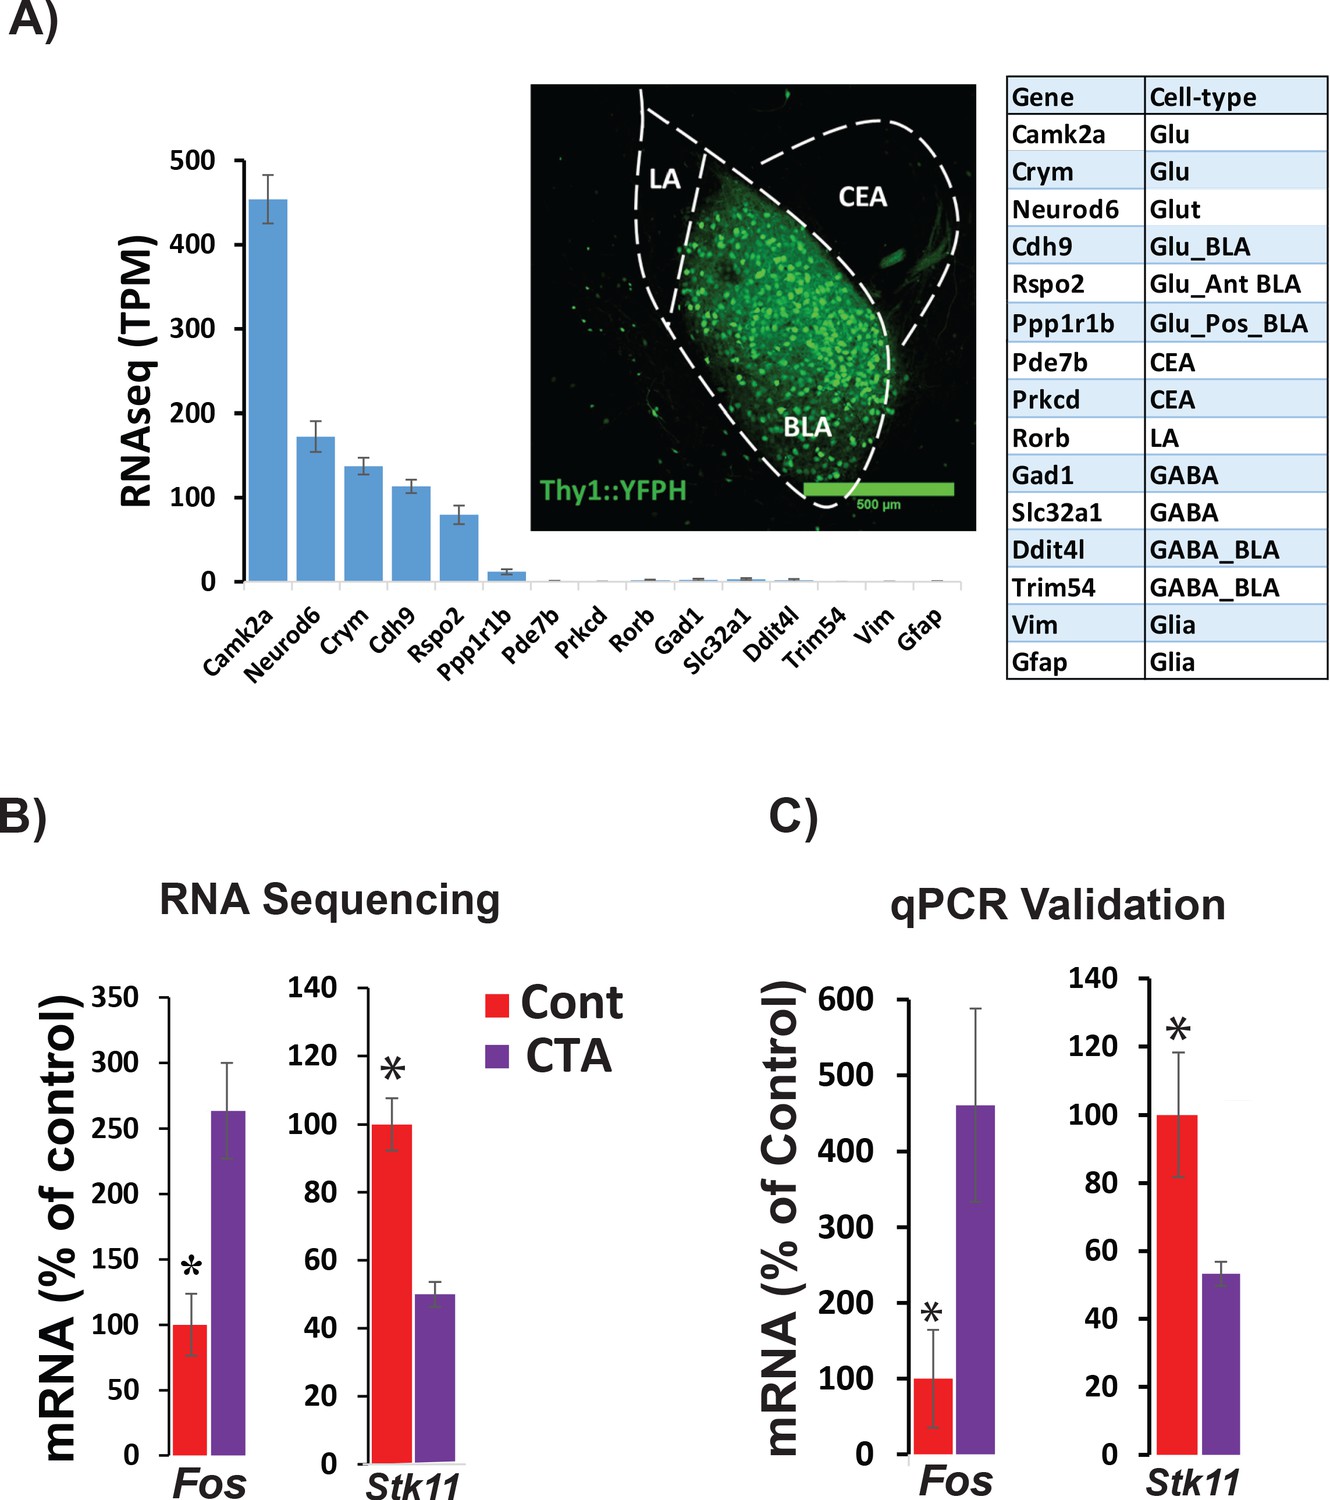
RNA sequencing from BLApn 4 hr following CTA training.
(A) BLApn were isolated from YFP-H mice following CTA or taste control (N = 4/group). Neurons (150-200) were manually sorted form coronal slices (LA-lateral amygdala; CEA-central amygdala). Abundant transcripts (histogram, averaged across both groups) are enriched for those expected in the population and depleted for those expressed in other nearby populations (Table 1) including GABAergic interneurons, glia, or neurons in LA or CEA; Sugino et al., 2006; Kim et al., 2016; Allen brain atlas). Glu- GABA-, glutamatergic, GABAergic neurons; AntBLA, PostBLA- Anterior and posterior portions of the BLA. TPM- transcript per million. (B) Among genes meeting robust criteria for differential expression (see Table 1) Stk11 and Fos were selected for further analysis, including qPCR confirmation (C) in separate experiments (N = 4/group; *p<0.05). See also Figure 2—source data 1 and Figure 2—figure supplements 1–4 and Tables 1–3.
-
Figure 2—source data 1
qPCR validation for Fos and Stk11 mRNA expression in YFPH+ neurons.
This data relates to Figure 2, panel C.
- https://cdn.elifesciences.org/articles/61036/elife-61036-fig2-data1-v2.docx
Figure 2—figure supplement 1
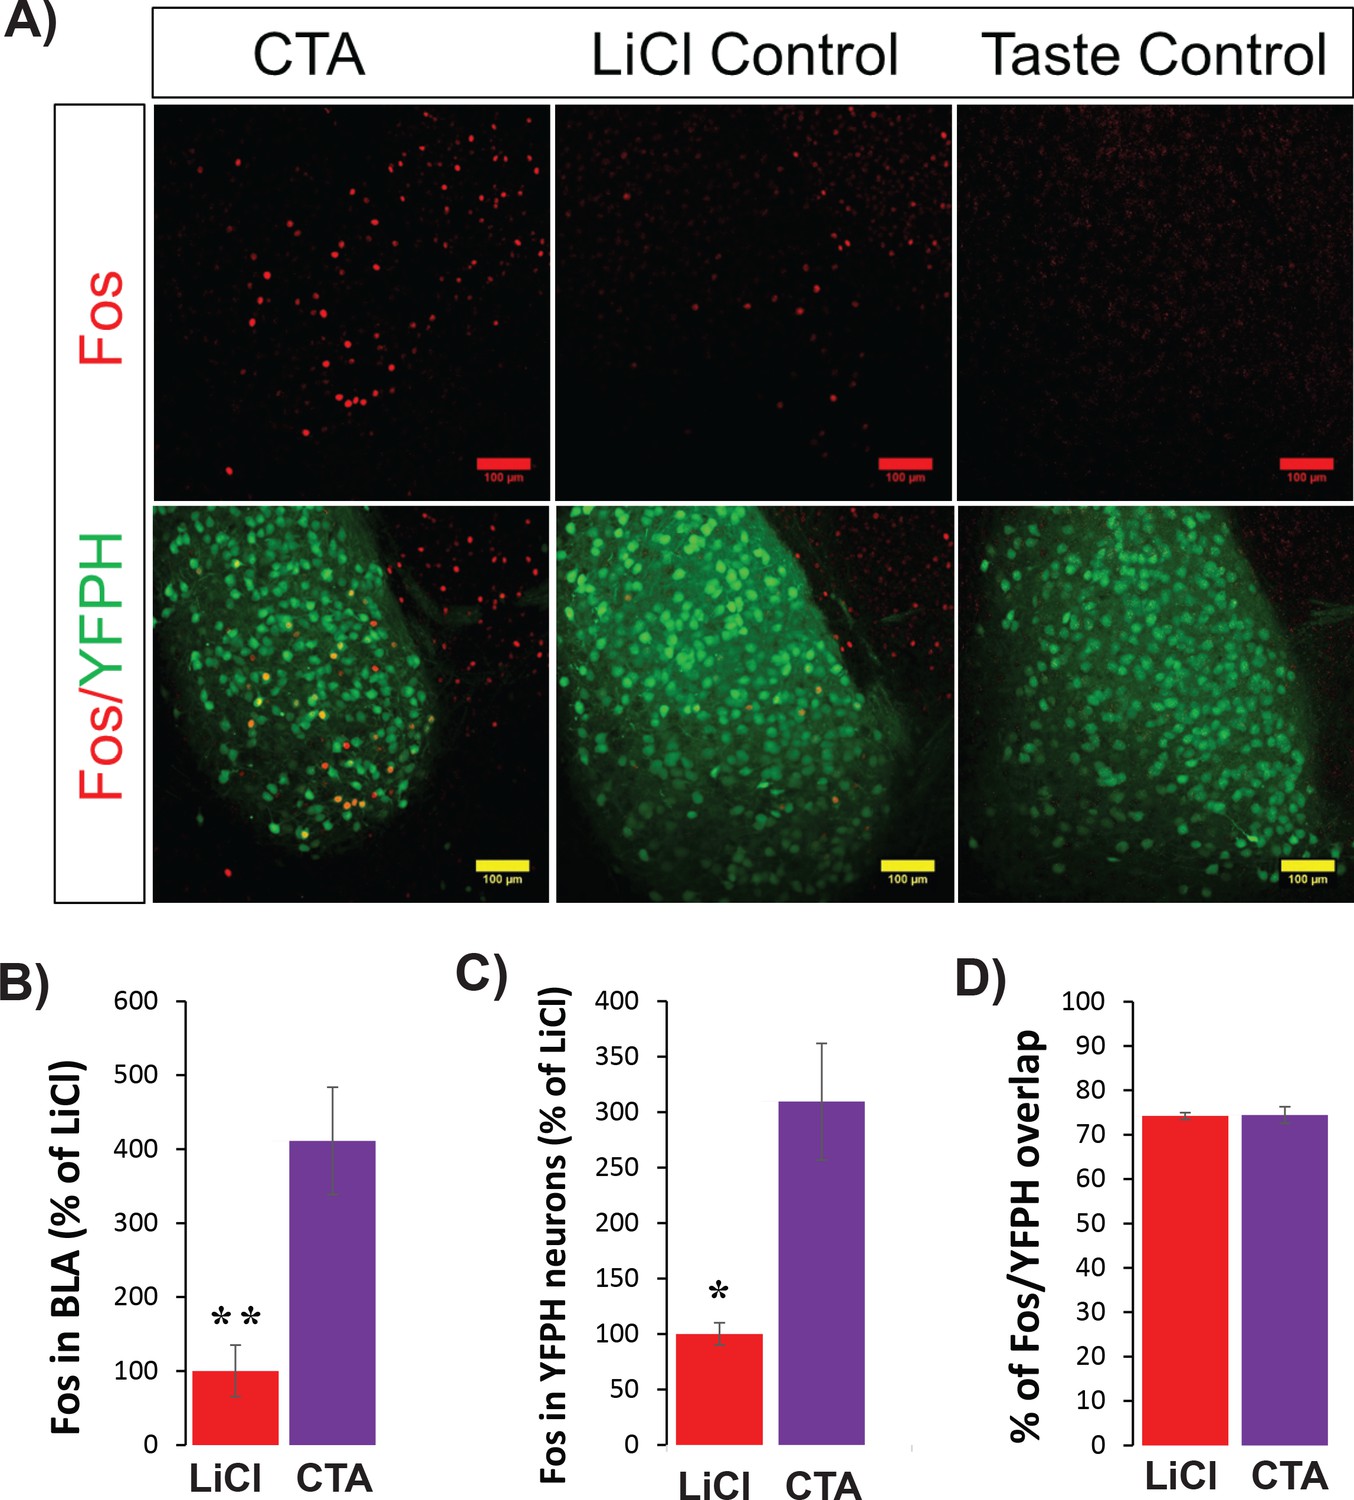
CTA increases C-FOS protein expression in BLApn including those in strain YFP-H.
(A) Images of YFP+ neurons in the BLA (green) and C-FOS protein (red) 4 hr following CTA training, LiCl and taste controls. Note that the taste control group has no C-FOS+ signal and so is not shown in B-D. (B) CTA increased C-FOS expression in BLA relative to the LiCl and taste controls (F(2,11)=21.2; p=4×10⁻⁴; Post hoc (Bonferroni corrected) difference between CTA and LiCl groups: p=0.003, and p=4×10⁻⁴ between CTA and taste control groups, N = 4/group). (C) As in (B), but only for C-FOS overlapping YFP expression (f(2,11)=23.5: p=0.008, post hoc: CTA and taste control groups: p=4×10⁻⁴; N = 3–4/group). *p<0.05; **p<0.01. (D) In both CTA and LiCl control conditions, the expression of C-FOS protein was similarly localized to YFP+ neurons (74.4% for CTA and 74.2% for LiCl control). See also Figure 2—figure supplement 1—Source datas 1–2.
-
Figure 2—figure supplement 1—source data 1
FOS protein counts in BLA 4 hr following CTA training and LiCl control.
This data relates Figure 2—figure supplement 1 panel B.
- https://cdn.elifesciences.org/articles/61036/elife-61036-fig2-figsupp1-data1-v2.docx
-
Figure 2—figure supplement 1—source data 2
FOS protein counts in BLA YFPH+ neurons 4 hr following CTA training and LiCl control.
This data relates Figure 2—figure supplement 1 panel C.
- https://cdn.elifesciences.org/articles/61036/elife-61036-fig2-figsupp1-data2-v2.docx
Figure 2—figure supplement 2
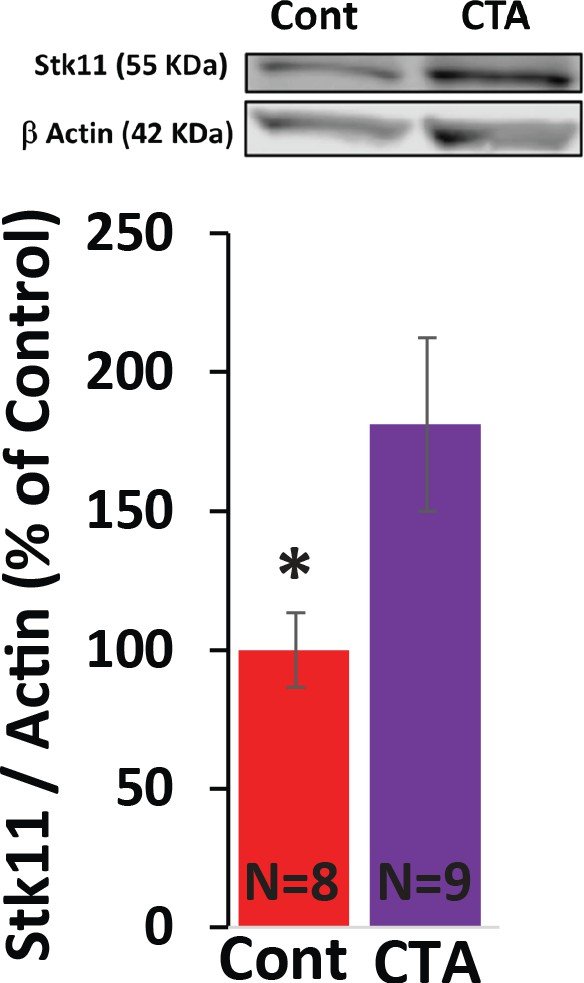
STK11 protein expression following CTA training.
YFP-H mice were trained for CTA or received a taste control and 4 hr later the anterior BLA (guided by YFP expression) was sub-dissected and used for immunoblotting with antibodies raised against STK11 and actin (as loading control). CTA increased the expression of STK11 (t(15)=2.28; p=0.037, N = 8/9 per group). *p<0.05. See also Figure 2—figure supplement 2—source data 1.
-
Figure 2—figure supplement 2—source data 1
STK11 protein levels in the BLA 4 hr following CTA training or taste control.
This data relates Figure 2—figure supplement 2.
- https://cdn.elifesciences.org/articles/61036/elife-61036-fig2-figsupp2-data1-v2.docx
Figure 2—figure supplement 3

BLApn express known downstream targets of STK11 and C-FOS.
(A) BLApn transcript levels of known downstream substrates of STK11, the members of the AMP-related kinase family (Lizcano et al., 2004). RNA sequencing from BLApn 4 hr following CTA training. Note that Mark2 mRNA expression is reduced in taste control mice relative CTA-trained mice (N = 4/group; *p<0.05); TPM- transcripts per million. (B) Nptx2, a known target of transcriptional regulation by C-FOS in neurons (Malik et al., 2014), increased following CTA. RNA sequencing (left) and qPCR validation (right) from BLApn 4 hr following CTA training. (N = 4/group; *p<0.05).
Figure 2—figure supplement 4
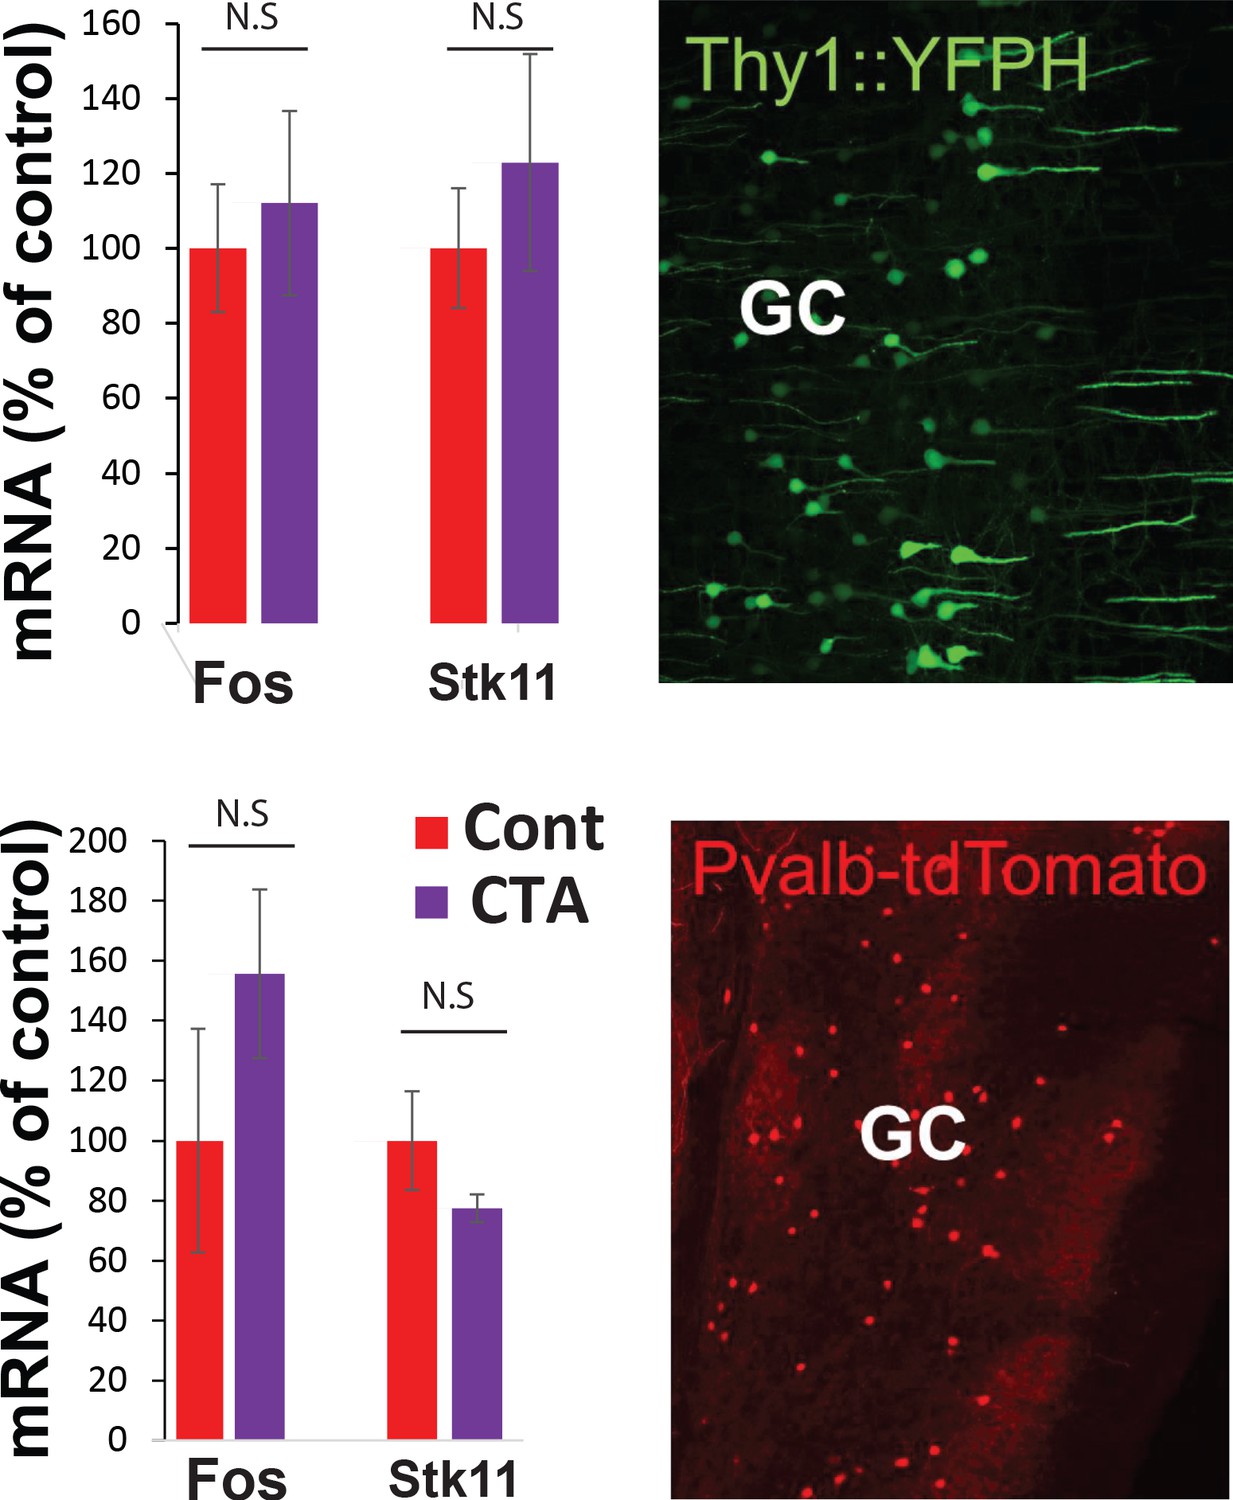
RNA sequencing from GC.
Top. YFP-H L5 pyramidal neurons and Pvalb-tdTomato-positive interneurons in the GC. Fos and Stk11 did not differ significantly between CTA and taste control groups.
Figure 3
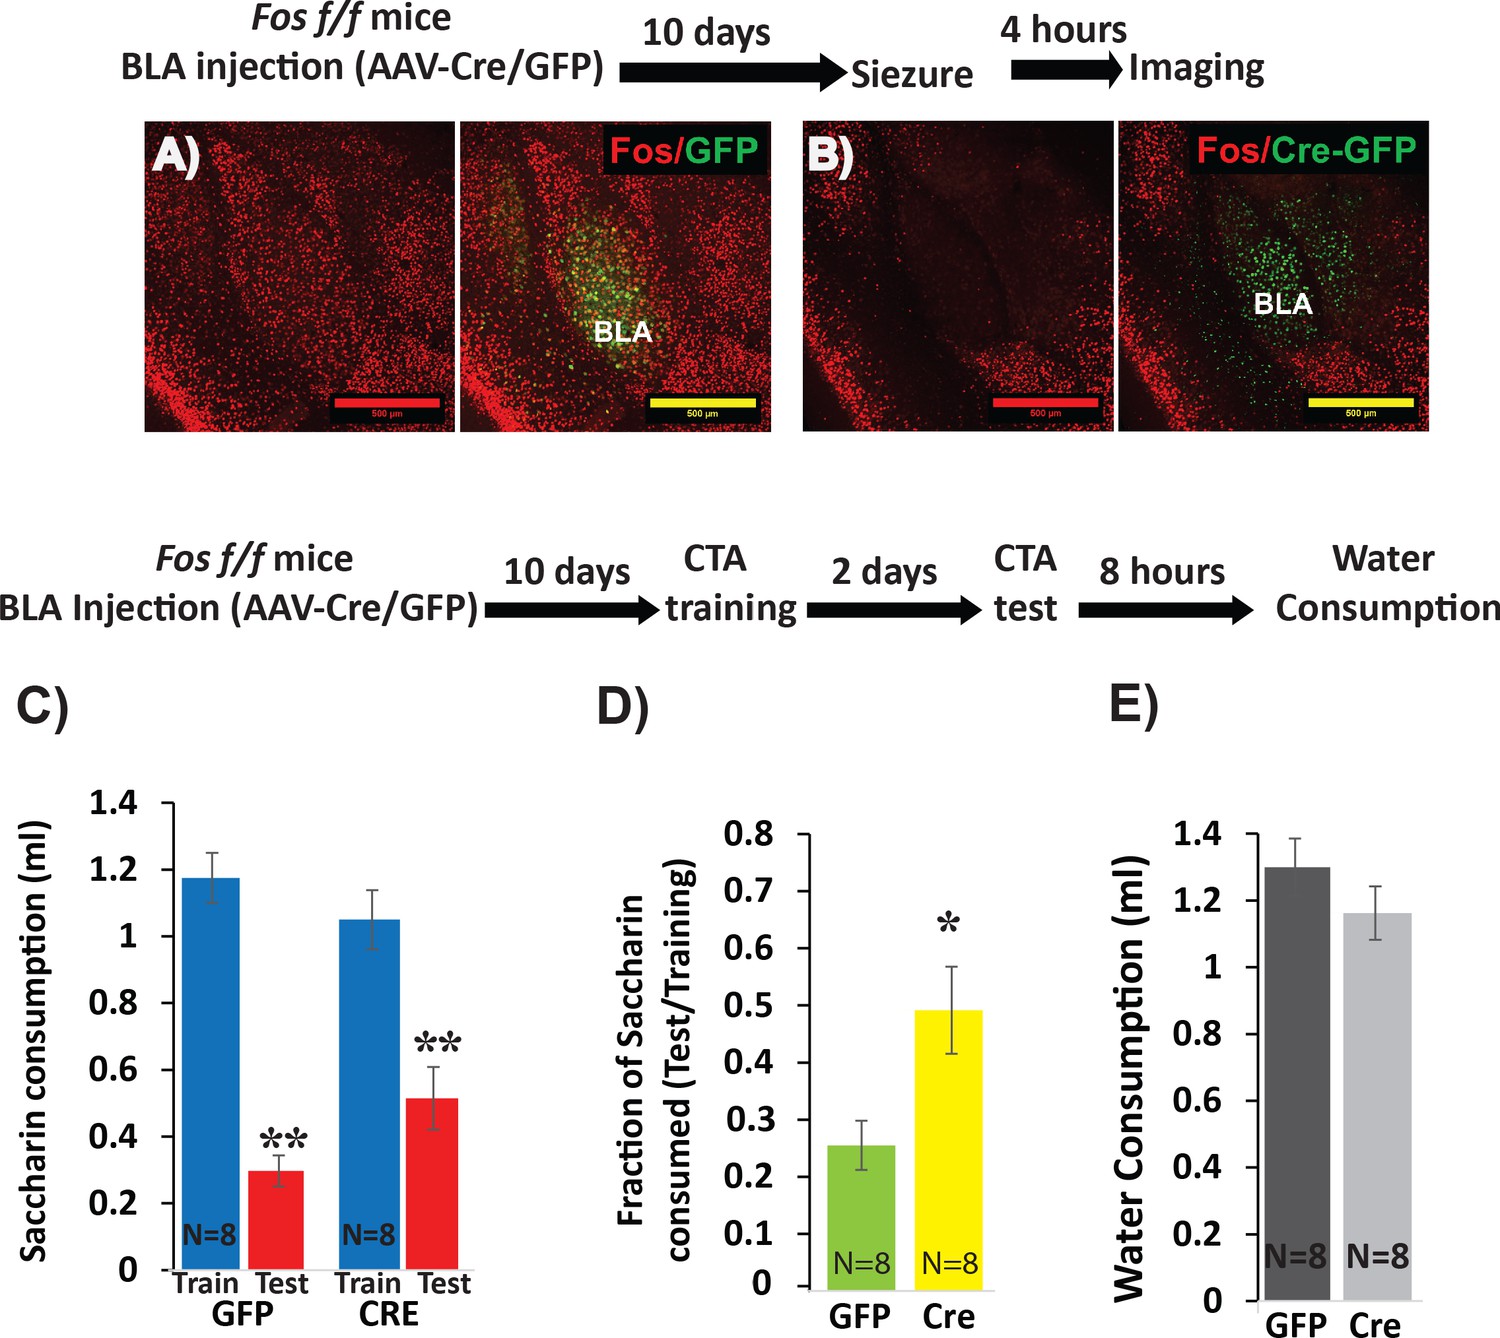
Deletion of Fos from BLApn reduces the strength of learning.
(A,B) BLA of Fosf/f mice were infected with viruses expressing Cre-GFP (B) or GFP alone (A). C-FOS induction was tested 10 days later, 4 hr after onset of seizures in response to kainic acid (20 mg/kg). Cre injected BLA’s had reduced C-FOS expression confirming penetrance of the knock-out. (C–E) Fos deletion from BLApn attenuates CTA learning. Fos f/f mice received Cre and control viruses bilaterally and were trained for CTA 10 days later and then tested after an additional 48 hr. (C) Both groups exhibited significant memory reflected by reduced saccharin consumption between training and testing sessions. Mixed ANOVA revealed a significant effect of training (F(1,14) = 154.6, p=5.9×10⁻⁹), but not of knockout (F(1,14) = 0.15, p=0.70), although there was a significant interaction (F(1,14) = 9.67, p=0.008). Post-hoc analysis revealed that both GFP (N = 8) and Cre (N = 8) group reductions following CTA (test vs. train) were significant (GFP: p=9×10⁻⁶; Cre: p=3.6×10⁻⁴) but differences between the other conditions were not (CTA-GFP vs CTA-Cre: p=0.26 and test-GFP vs test-Cre: p=0.065). (D) Fos deletion from BLApn reduced memory strength measured as the fraction of saccharin consumed (test/training): 25% (GFP) versus 49% (Cre) and this difference in ratios was significant (t(14)=-2.7; p=0.017). (E) Reduced saccharin consumption cannot be attributed to overall inhibition of drinking as the amount of water drunk 8 hr later did not differ (p=0.26). *p<0.05; **p<0.01. See also Figure 3—source datas 1 and 2.
-
Figure 3—source data 1
Saccharin consumption (ml) during CTA training and test.
This data relates to Figure 3, panel C.
- https://cdn.elifesciences.org/articles/61036/elife-61036-fig3-data1-v2.docx
-
Figure 3—source data 2
Fraction of saccharin consumed (Test/Training).
This data relates to Figure 3 panel D.
- https://cdn.elifesciences.org/articles/61036/elife-61036-fig3-data2-v2.docx
Figure 4 with 1 supplement

Deletion of Stk11 from BLApn impairs CTA learning.
(A) Stk11f/f mice were infected with Cre or control viruses 10 days before CTA training and were tested 48 hr later. Despite significant reduction in saccharin consumption between testing and training sessions in control mice, Stk11 KO animals showed almost no learning. Mixed ANOVA revealed significant training and genotype effects (training: F(1,11) = 42.1; p=4.5×10⁻⁵; genotype: F(1,11) = 18.2; p=0.001; as well as a significant interaction: F(1,11) = 9.2, p=0.012). Post-hoc analysis (Bonferroni corrected) revealed that although both GFP (N = 6) and Cre (N = 7) reductions following CTA (test vs. train) were significant (GFP: p=0.003; Cre: 0.013), there was a large and significant difference in saccharin consumption between GFP and Cre groups during the test (GFP: 0.25 ml; Cre: 0.75 ml; p=2.1×10⁻⁴), while differences in saccharin consumption during training were not significant (p=0.15). (B) Control animals (GFP) consumed only 33% of the training amount during the test, but KO mice (Cre) consumed 78% and this difference was significant (t(11)=-4.91; p=4×10⁻⁴). (C) Reduced saccharin consumption does not reflect an overall reduction in drinking measured 8 hr later (t(11)=0.25; p=0.87). **p<0.01. (D) Stk11 deletion after long-term memory formation has no effect on CTA retention. Stk11 f/f mice received Cre and control viruses 2 days after CTA training and were tested 10 days later. Mixed ANOVA revealed a significant effect of training (F(1,11) = 48.8, p=2.3×10⁻⁵) but no significant effect of genotype (F(1,11) = 1.7, p=0.23) or interaction (F(1,11) = 0.76, p=0.40). Post-hoc analysis confirmed significant reductions in both groups following CTA (GFP: N = 7, p=0.003. Cre: N = 6, p=0.002). There was no significant difference between GFP and Cre groups during training (p=0.19) or during the test (p=0.64). (E) There was no significant difference in CTA intensity as measured by the fraction of saccharin consumed (t = −0.18, p=0.86). **p<0.01. See also Figure 4—source datas 1–4 and Figure 4—figure supplement 1.
-
Figure 4—source data 1
Saccharin consumption (ml) during CTA training and test.
This data relates to Figure 4 panel A.
- https://cdn.elifesciences.org/articles/61036/elife-61036-fig4-data1-v2.docx
-
Figure 4—source data 2
Fraction of saccharin consumed (Test/Training).
This data relates to Figure 4 panel B.
- https://cdn.elifesciences.org/articles/61036/elife-61036-fig4-data2-v2.docx
-
Figure 4—source data 3
Saccharin consumption (ml) during CTA training and test.
This data relates to Figure 4 panel D.
- https://cdn.elifesciences.org/articles/61036/elife-61036-fig4-data3-v2.docx
-
Figure 4—source data 4
Fraction of saccharin consumed (Test/Training).
This data relates to Figure 4 panel E.
- https://cdn.elifesciences.org/articles/61036/elife-61036-fig4-data4-v2.docx
Figure 4—figure supplement 1
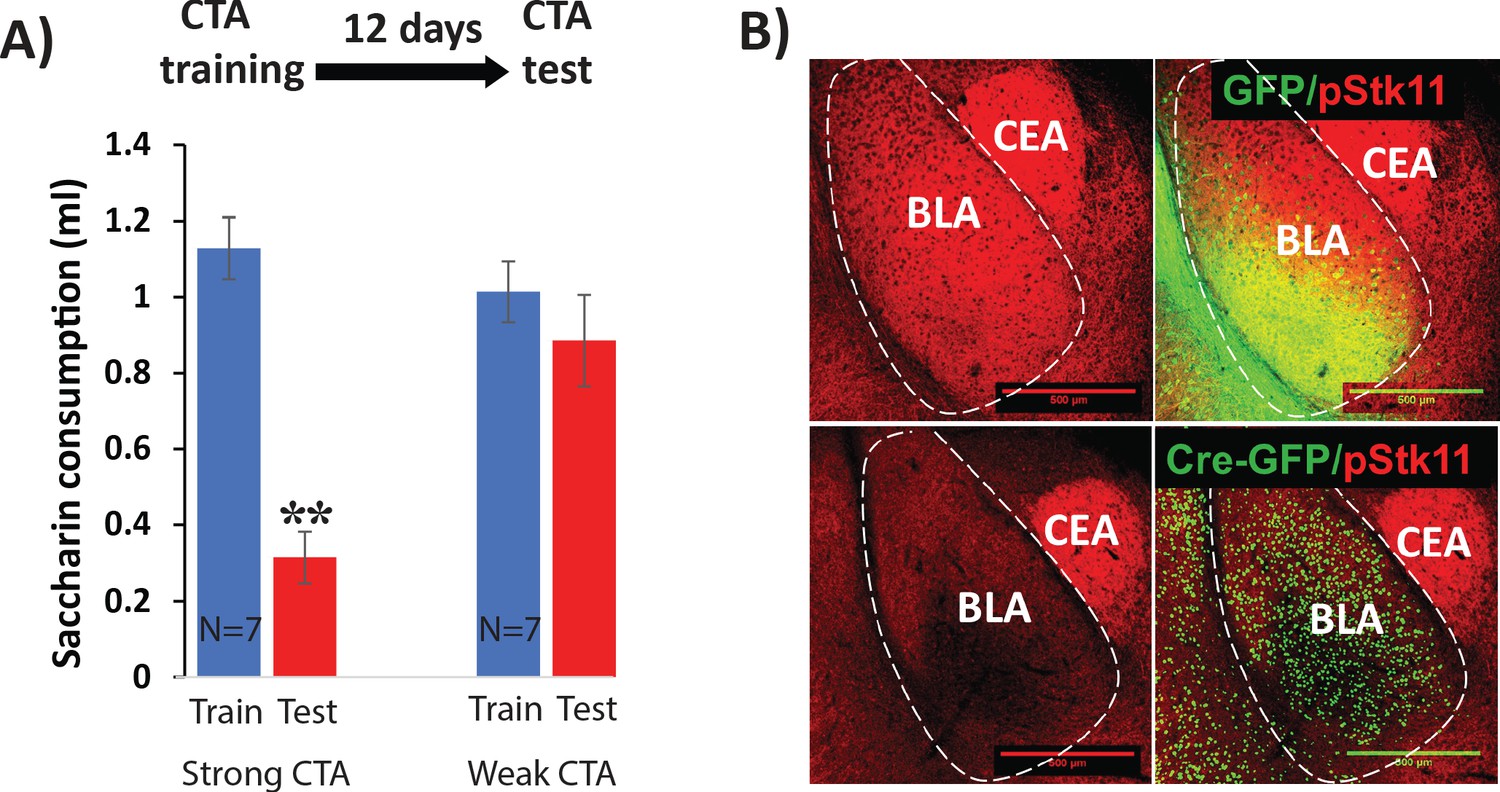
Controls for Stk11 deletion experiments.
(A) CTA elicited by a dose of 0.15 M LiCl 1% body weight (Weak CTA) does not last 12 days following training (N = 7, t(12)=0.9, p=0.39). On the other hand, CTA elicited by a LiCl dose of 0.15M 2% body weight (Strong CTA) does (N = 7, t(12)=7.8; p=5×10−06). (B) Conditional knock-out of Stk11 reduces phospho-STK11 protein expression. Immunostaining for STK11 protein (phosphorylated at serine 431) was performed 10 days after BLA infection with Cre or control viruses. Scale bar: 500 µm.
Figure 5 with 1 supplement
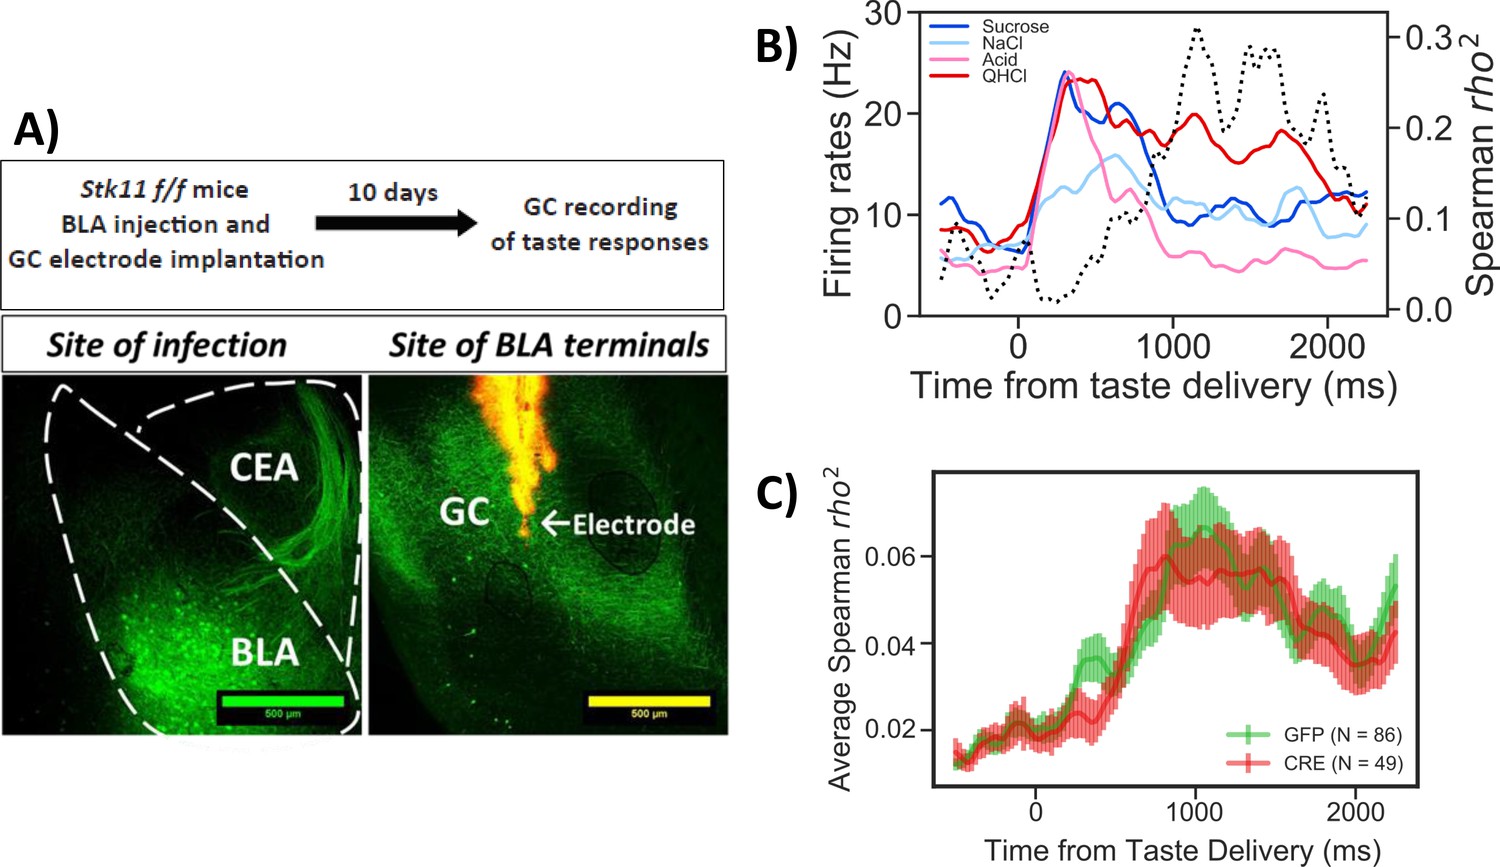
Stk11 deletion in BLApn does not affect taste palatability coding in the GC.
(A) The BLA of Stk11f/f mice was infected bilaterally with Cre or control viruses. The ventral GC, where BLA projections terminate (Haley et al., 2016) was implanted with a multi-electrode array 10 days later to record GC taste responses to a battery of four tastes differing in their hedonic value, the palatable sucrose and sodium-chloride and the aversive critic acid and quinine (Levitan et al., 2019). Images show BLA injection site (left) and labeled BLA terminals in the ventral GC co-localized with the site of dye-labeled electrodes (right). (B) PSTHs (colored lines) from a representative GC neuron in a GFP-injected control mouse that responded significantly to all tastes. Dashed line represents the magnitude of the rank correlation between firing rates and behaviorally measured palatability obtained previously in separate experiments (Levitan et al., 2019). (C) Correlation coefficients averaged across all recorded units in GFP (control) and Cre-injected mice. As revealed in a two-way ANOVA, palatability correlations in both groups rise steeply between 800 and 1000 ms with no significant difference between genotypes (F(1,133)=0.13, p=0.72) or interaction (p=0.99). See also Figure 5—figure supplement 1.
Figure 5—figure supplement 1
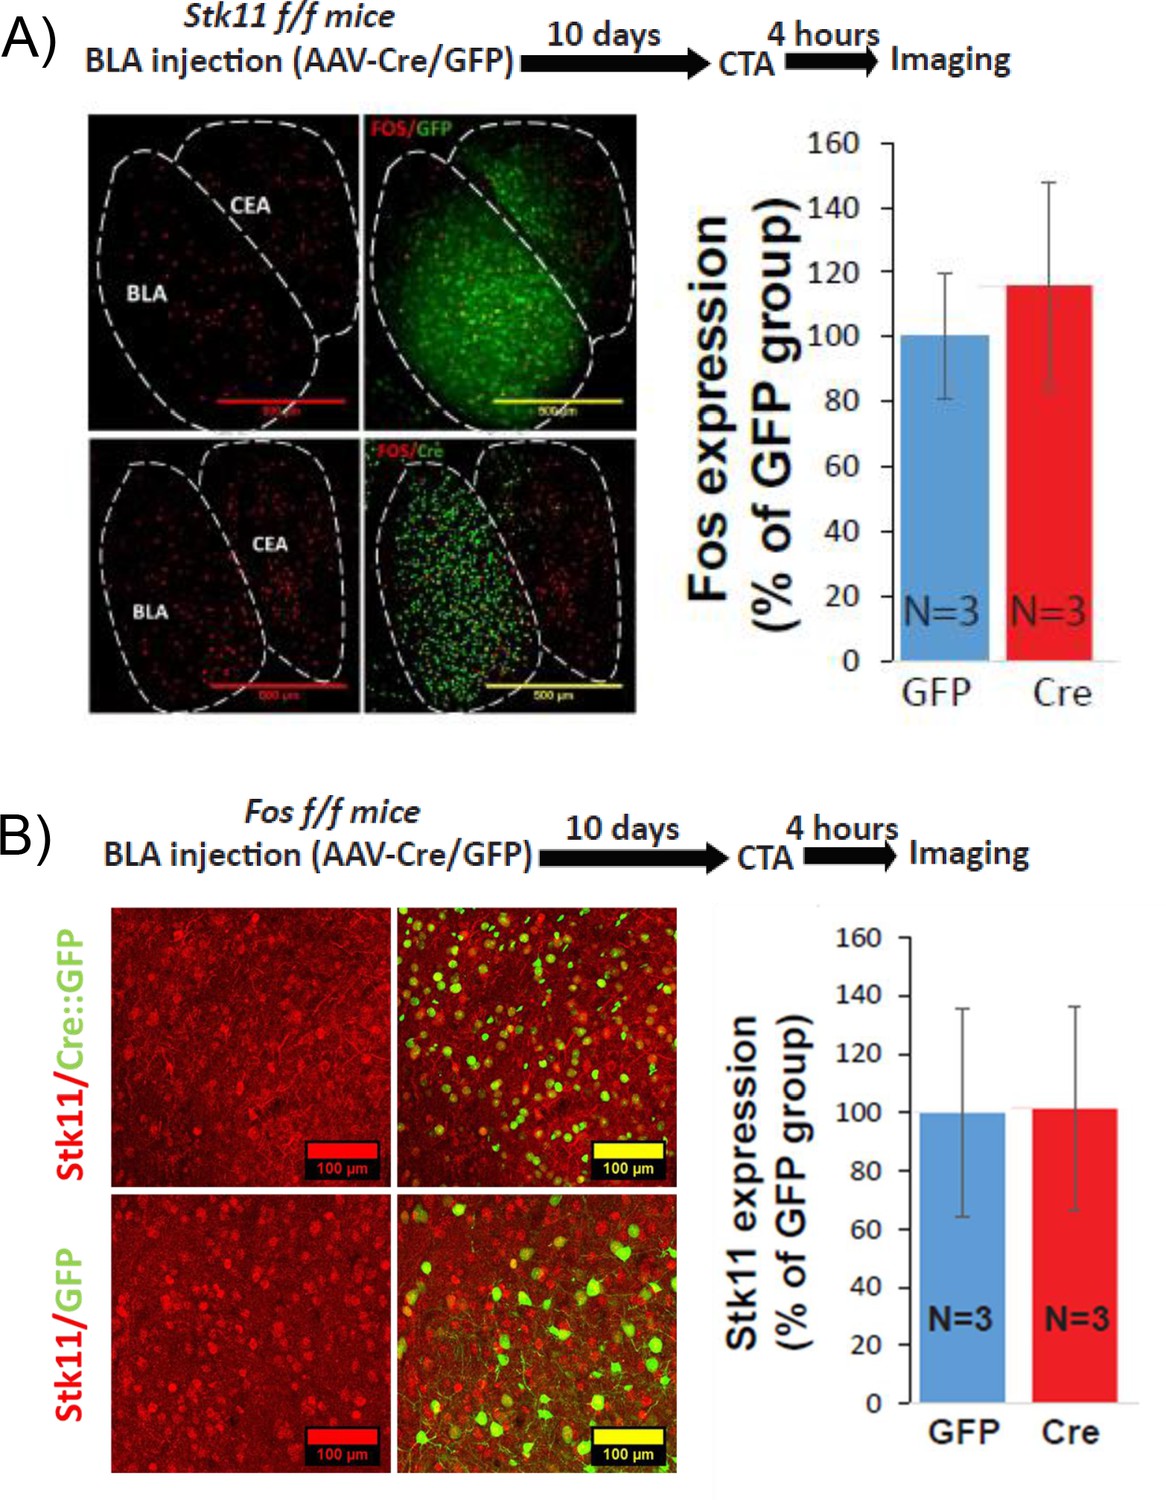
The expression of Stk11 or Fos is not dependent upon the expression of the other.
(A) Stk11 deletion in BLApn does not change C-FOS expression. C-FOS protein expression in the BLA was measured 4 hr following CTA training in Stk11f/f mice receiving Cre or control virus injection 10 days earlier. There was no difference between the groups (t(4)=-0.4; p=0.69, N = 3/group). (B) Fos deletion in BLApn does not change STK11 expression. STK11 protein expression in the BLA was measured 4 hr following CTA training in Fosf/f receiving Cre or control virus injection 10 days earlier. There was no difference between the groups (t(4)=0.03; p=0.84, N = 3/group). See also Figure 5—figure supplement 1—source data 1–2.
-
Figure 5—figure supplement 1—source data 1
Stk11 deletion in BLApn does not change C-FOS expression.
This data relates to Figure 5—figure supplement 1 panel A.
- https://cdn.elifesciences.org/articles/61036/elife-61036-fig5-figsupp1-data1-v2.docx
-
Figure 5—figure supplement 1—source data 2
Fos deletion in BLApn does not change C-FOS expression.
This data relates to Figure 5—figure supplement 1 panel B.
- https://cdn.elifesciences.org/articles/61036/elife-61036-fig5-figsupp1-data2-v2.docx
Figure 6
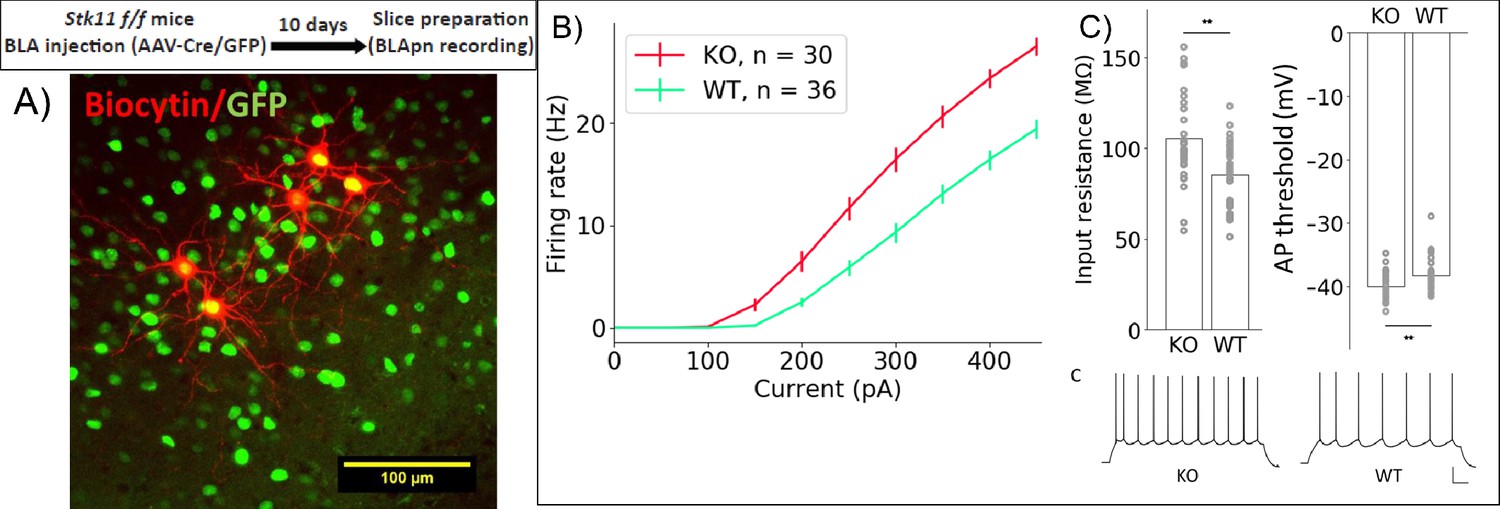
Stk11 deletion in BLApn increases intrinsic excitability.
(A) Whole-cell recordings obtained from BLApn in ex vivo slices of Stk11f/f mice 10 days after injection of Cre or control virus. Stk11 neurons were targeted based on GFP expression and validated post-hoc based on Biocytin fills. (B) Firing rates plotted against input current (F–I). Error bars are SEM. Less current is needed to evoke firing in Stk11-KO neurons compared to Stk11-WT neurons (interpolated rheobase, F(1,64) = 10.6, p=0.0018). Two-way mixed ANOVA revealed significant main effects of knockout (F(1,64) = 27.48, p=2×10⁻⁶) and current (F(10,640) = 581.7, p=1.2×10−44) on firing rate, along with a statistically significant interaction (F(10,640) = 22.4, p=4×10−36). Post-hoc pairwise comparisons showed that the firing rates of Stk11-KO neurons were significantly greater than those of Stk11-WT neurons in response to current injections from 150 to 450 pA (p<0.001). (C) Stk11-KO neurons have increased input resistance (F = 14.41, p=3.3×10⁻⁴) and decreased threshold for generating action potential (F = 7.68, p=0.0073). Traces are sample responses to 300 pA current steps. Scale bar: 100 ms, 20 mV. See also Table 4.
Figure 7

Fos deletion and CTA have opposing effects on resting input resistance.
(A,B) Whole-cell patch clamp recordings obtained from BLApn in ex vivo slices of Fosf/f mice 10 days after injection of Cre or control virus. Fos-KO neurons exhibit increased firing in response to current injection compared to Fos-WT neurons. (A) Average frequency-current (FI) curves. Two-way mixed ANOVA revealed a significant main effect of knockout (F(1,49) = 8.79, p=0.005) and current (F(9,441) = 419.4, p=6×10−210) on firing rate, along with a statistically significant interaction (F(9,441) = 8.2, p=2.57×10⁻¹¹). Post-hoc pairwise comparisons showed that the firing rates of Fos-KO neurons were significantly greater than those of Fos-WT neurons in response to current injections from 150 to 450 pA (p<0.05). (B) Differences in input resistance (F(1) = 10.62, p=0.0025) and action potential threshold (F(1) = 6.82, p=0.013) between Fos-KO and Fos-WT neurons were also significant. Traces show sample responses to 250 pA current steps. Scale bar: 100 ms, 20 mV. (C) Tet-dependent labeling of Fos expressing neurons (Reijmers et al., 2007) during CTA training. Fos::tTa mice injected with AAV-TRE::mCherry received food with 40 ppm Doxycycline (Dox) to suppress reporter expression. One day prior to CTA training, Dox was removed. Acute slices were prepared 24 hr following CTA (Saccharin+lithium) or control (Saccharin+saline) training. (D) MCherry labeled neurons in the BLA. (E) Input resistances of Fos+/- neurons in the BLA, following CTA training and taste-only control experiments. Two-way ANOVA reveals that neurons from CTA animals have lower input resistance than those from control animals (F(1,65) = 10.26, p=0.0021) and that Fos+ neurons have lower input resistance than Fos- neurons (F(1,65) = 23.64, p=7.5×10⁻⁶). Post-hoc tests show that among Fos+ neurons, those in CTA animals have lower input resistance (p=0.015), while among Fos- neurons, there was no significant difference between CTA and control animals (p=0.1). Differences between Fos+ and Fos- neurons did not reach post-hoc significance in either the CTA (p=0.25) or control animals (p=0.12) considered alone. See also Table 5.
Figure 8 with 1 supplement
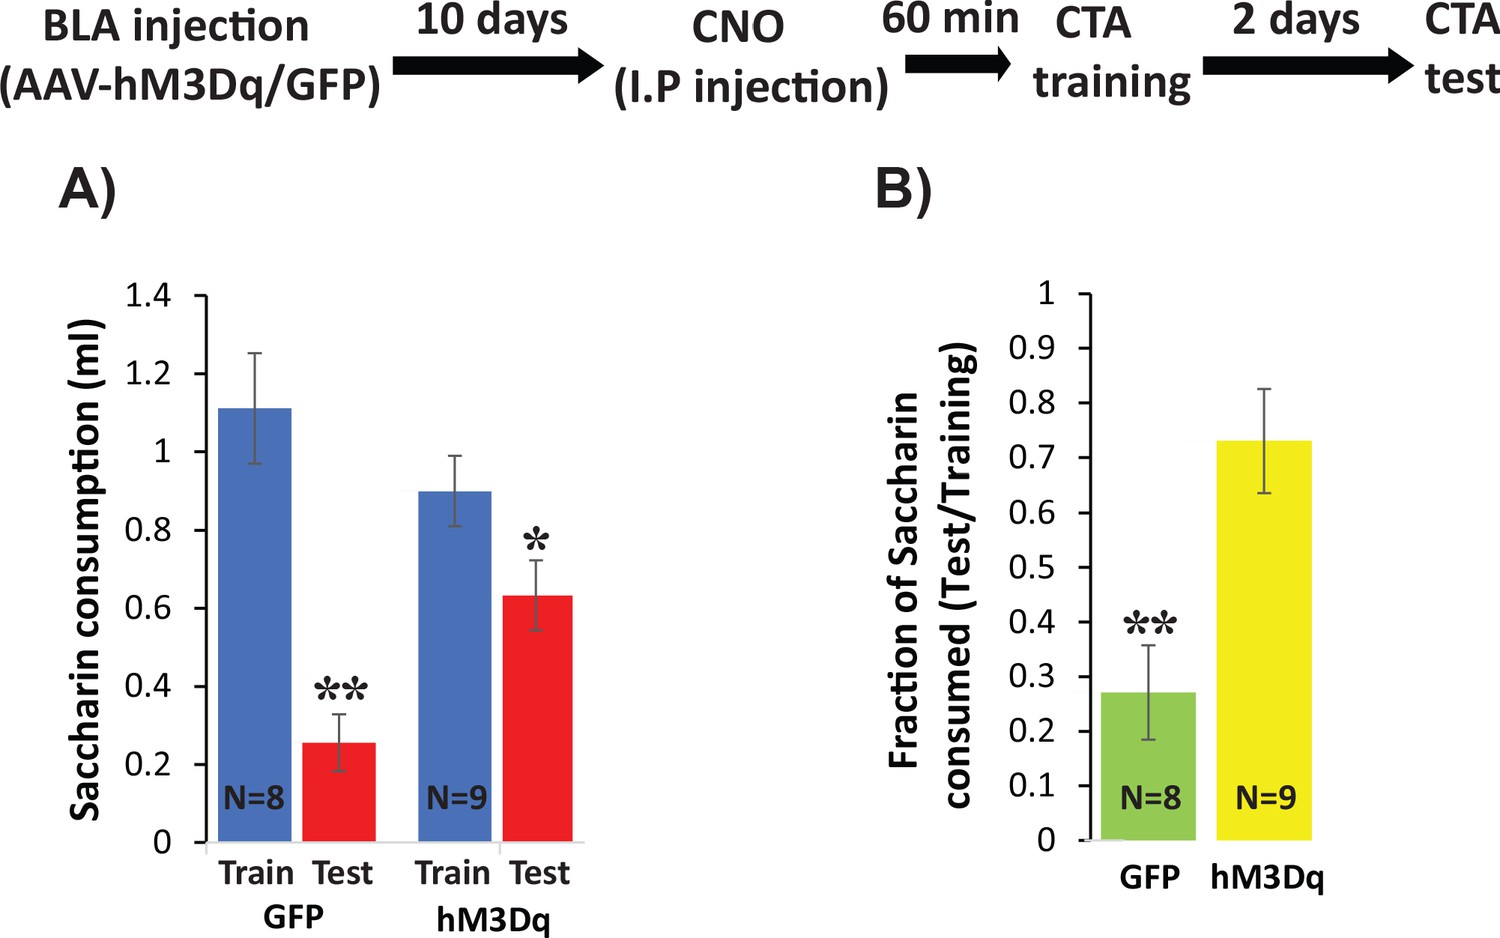
Increasing excitability using hM3Dq DREADD in BLApn during CTA training impairs CTA learning.
Stk11f/f mice were infected with Camk2α::hM3Dq or Camk2α::GFP control viruses 10 days before CTA training. Mice received systemic CNO (0.3 mg/kg) 60 min before training and were tested for CTA memory 48 hr later. (A) Control mice had greater reductions in saccharin consumption between testing and training sessions than hM3Dq mice. Mixed two-way ANOVA revealed a significant training effect and a significant interaction between training and treatment (training: F(1,16) = 32.6, p=3.2×10⁻⁵; treatment: F(1,16) = 0.63, p=0.44; interaction: F(1,16) = 8.97, p=0.009). This indicates that the effect of training depends on the treatment condition. Post hoc analysis revealed that although both GFP injected mice (N = 8) and hM3Dq injected mice (N = 9) developed CTA indicated by reduced saccharin consumption (GFP: p=0.001; hM3Dq: p=0.019), hM3Dq injected mice drank significantly more saccharin during the test then GFP mice (p=0.005). There was no significant difference in the consumption of saccharin during training (p=0.227). (B) The strength of CTA learning was expressed as the fraction of saccharin consumed between testing and training. GFP controls consumed only 22% during the test, relative to training, but hM3Dq mice consumed 72% and this difference was significant (t(15)=3.96; p=0.001). *p<0.05, **p<0.01. See also Figure 8—source datas 1–2 and Figure 8—figure supplement 1.
-
Figure 8—source data 1
Saccharin consumption (ml) during CTA training and test.
This data relates to Figure 8 panel A.
- https://cdn.elifesciences.org/articles/61036/elife-61036-fig8-data1-v2.docx
-
Figure 8—source data 2
Fraction of saccharin consumed (Test/Training).
This data relates to Figure 8 panel B.
- https://cdn.elifesciences.org/articles/61036/elife-61036-fig8-data2-v2.docx
Figure 8—figure supplement 1
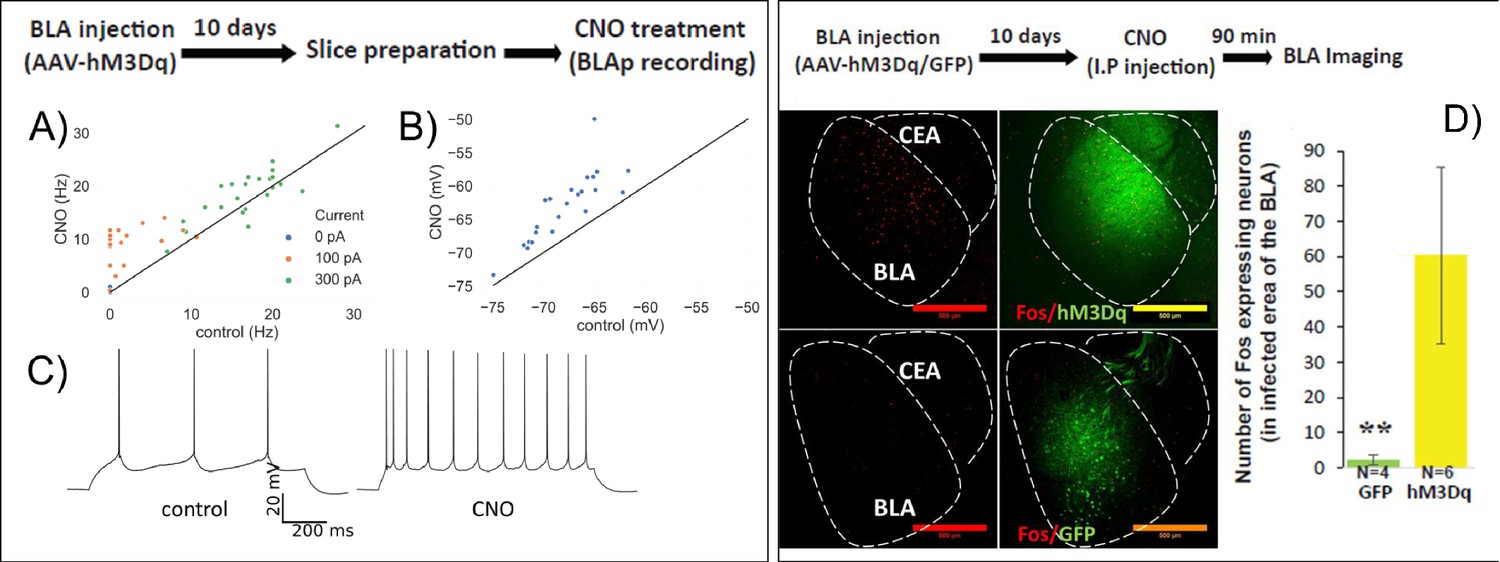
HM3Dq DREADD increases BLA activity.
(A–C) Whole-cell patch clamp recordings from BLA neurons in acute brain slices following in vivo infection with AAV-CamKIIa::HM3Dq. Firing rate (A), example in C) in response to 1 s current steps and resting membrane potential (B) measured before (control) and 5 min after (CNO) bath application of 0.1 µM CNO. (A) A repeated measures ANOVA revealed a significant main effect of CNO application (F(1,27) = 22.9, p=5.4 E-5) and current (F(2,54) = 355.4, p=8.3×10⁻³²) on firing rate, along with a statistically significant interaction (F(2,54) = 8.2, p=2.57×10⁻¹¹). Post-hoc pairwise comparisons showed that firing rates of neurons were significantly higher during the CNO treatment compared to control in response to 100 pA (p=5×10⁻⁷) and 300 pA (p=0.012) input. (B) Resting membrane potentials of neurons are significantly higher than in control (paired sample t-test, t = −8.5, p=2×10⁻⁸). (C) Sample trace of spike trains in current clamp with 100 pA stimulation of the same neuron in CNO and control conditions. (D) BLA was infected with AAV-CamKIIa-HM3Dq or GFP as control. 10 days later mice were injected with CNO and C-FOS protein expression in the infected area in the BLA was measured 90 min later. Left. Representative images of C-FOS/HM3Dq and C-FOS/GFP. Right. CNO treatment increases C-FOS expression in the infected area in the BLA (N = 4/6; Mann–Whitney: Z = − 2.76; p=0.006). **p<0.01.
Figure 9
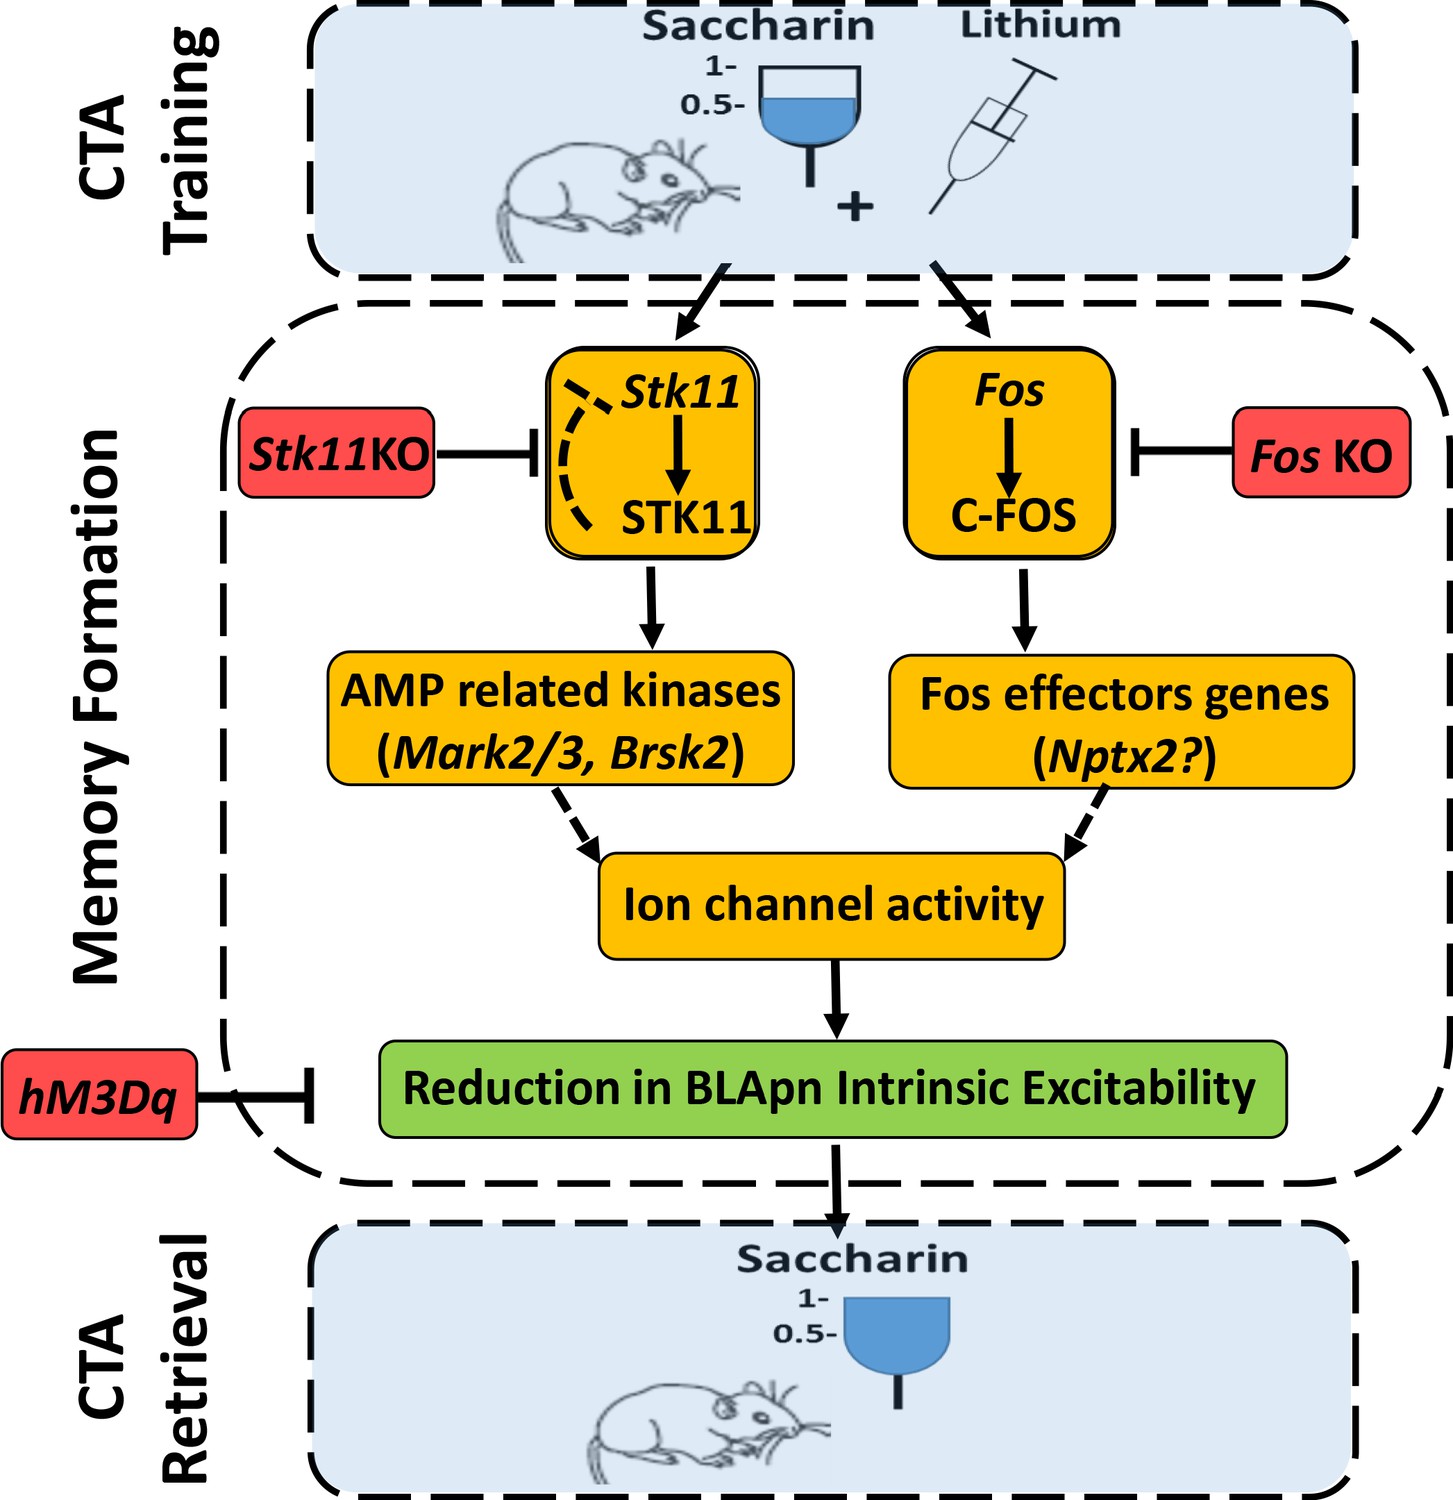
An integrated model for the formation of CTA memory.
CTA training mice associate consumption of palatable saccharin with gastric malaise (induced by systemic injection of lithium chloride). Memory formation: CTA training increases the activity STK11 and C-FOS in BLA projection neurons (BLApn) via initially separate signaling pathways. CTA increases STK11 protein but reduces its mRNA, possibly through feedback control. STK11 activation results in downstream phosphorylation and activation of AMP related kinases, likely including Mark2/3, Brsk2, and Sik3, which are abundant in BLApn. C-FOS, an activity dependent transcription factor, induces the transcription of effector genes such as Nptx2 which increases following CTA training and is known to bind not only ligand-gated receptors, but also voltage-gated ion channels. The two pathways reduce BLApn intrinsic excitability through unknown mechanism(s). CTA retrieval: Reduced BLApn intrinsic excitability plays a key role in CTA memory formation, reducing saccharin consumption in test trials. Blue-behavioral level, Orange-molecular level, Green-cellular level, Red-conditions impairing memory. Dashed line arrows are hypothesized connections.
Tables
Table 1
Transcripts in YFP+ BLApn with significantly altered expression 4 hr following CTA
Criteria: 2 ≤ Fold Change≤0.5, p<0.01, TPM >30 (TPM = transcript per million).
| Symbol | Fold- Change | P-Value | Gene name | |||
|---|---|---|---|---|---|---|
| Upregulated in CTA vs taste control | ||||||
| Nptx1 | 2.02 | 1.57E-4 | Neuronal pentraxin 1 | |||
| Ric8 | 2.06 | 0.0017 | RIC8 guanine nucleotide exchange factor A | |||
| Mmab | 3.66 | 0.0019 | Methylmalonic aciduria (cobalamin deficiency) cblB type homolog | |||
| 1110008F13Rik | 2.08 | 0.0028 | RAB5 interacting factor | |||
| Kbtbd4 | 2.09 | 0.0044 | Kelch repeat and BTB (POZ) domain containing 4(Kbtbd4) | |||
| Nudt21 | 2.14 | 0.0077 | Nudix (nucleoside diphosphate linked moiety X)-type motif 21 | |||
| Fos | 2.64 | 0.0094 | FBJ osteosarcoma oncogene | |||
| Magoh | 2.72 | 0.0095 | Mago homolog, exon junction complex core component | |||
| Downregulated in CTA vs taste control | ||||||
| Surf2 | 0.40 | 5.42E-4 | Surfeit gene 2(Surf2) | |||
| Tmem136 | 0.39 | 8.69E-4 | Transmembrane protein 136 | |||
| Stk11 | 0.50 | 0.0011 | Serine/threonine kinase 11(Stk11) | |||
| Kank3 | 0.28 | 0.0022 | KN motif and ankyrin repeat domains 3 | |||
| Lrrn1 | 0.49 | 0.0024 | Leucine-rich repeat protein 1, neuronal | |||
| Trpc1 | 0.48 | 0.0032 | Transient receptor potential cation channel, subfamily C, memb. 1 | |||
| Prpf6 | 0.49 | 0.0045 | Pre-mRNA splicing factor 6 | |||
| Tctex1d2 | 0.49 | 0.0052 | Tctex1 domain containing 2 | |||
| Gpr108 | 0.37 | 0.0056 | G-protein-coupled receptor 108 | |||
| Vkorc1 | 0.39 | 0.0069 | Vitamin K epoxide reductase complex, subunit 1 | |||
| D10Wsu102e | 0.50 | 0.0082 | DNA segment, Chr 10, Wayne State University 102, expressed | |||
| Tmem107 | 0.28 | 0.0089 | Transmembrane protein 107 | |||
Table 2
Transcripts in YFP+ L5 pyramidal neurons in the GC with significantly altered expression 4 hr following CTA
Criteria: 2 ≤ Fold Change≤0.5, p<0.01, TPM >30.
| Gene symbol | Fold-change | p-Value | Gene name |
|---|---|---|---|
| Transcript Down-regulated CTA vs taste control | |||
| Exosc1 | 0.43 | 0.008 | Exosome component 1 |
Table 3
Transcripts in Pvalb+ interneurons in the GC with significant altered expression 4 hr following CTA
Criteria: 2 ≤ Fold Change≤0.5, p<0.01, TPM >30.
| Symbol | Fold-change | p-Value | Gene name | |||
|---|---|---|---|---|---|---|
| Upregulated in CTA vs taste control | ||||||
| Uprt | 3.38 | 0.001 | Uracil phosphoribosyltransferase | |||
| Snca | 2.66 | 0.001 | Synuclein, alpha | |||
| 1810043H04Rik | 2.57 | 0.004 | NADH:ubiquinone oxidoreductase complex Assemb.Fact. 8 | |||
| Dedd | 2.47 | 0.001 | Death effector domain-containing | |||
| Fam149b | 2.26 | 0.007 | Family with sequence similarity 149, member B | |||
| Jazf1 | 2.12 | 0.008 | JAZF zinc finger 1 | |||
| Nup54 | 2.09 | 0.007 | Nucleoporin 54 | |||
| Downregulated in CTA vs taste control | ||||||
| Dear1 | 0.006 | 0.0006 | Dual endothelin 1/angiotensin II receptor 1 | |||
| Nt5c3b | 0.20 | 0.002 | 5'-nucleotidase, cytosolic IIIB | |||
| Lrrc16b | 0.26 | 0.010 | Capping protein regulator and myosin 1 linker 3 | |||
| Enc1 | 0.31 | 0.005 | Ectodermal-neural cortex 1 | |||
| Asap2 | 0.38 | 0.004 | ArfGAP with SH3 domain, ankyrin repeat and PH domain 2 | |||
| Pacs2 | 0.38 | 2E-4 | Phosphofurin acidic cluster sorting protein 2 | |||
| Ncan | 0.42 | 0.008 | Neurocan | |||
| uc008jhl.1 | 0.42 | 0.010 | ||||
| Smarcd3 | 0.45 | 0.006 | SWI/SNF Related, Matrix Assoc.Actin Dep.Reg. Chromatin, Subfamily D, Member 3 | |||
| Tbce | 0.46 | 0.002 | Tubulin-specific chaperone E | |||
| uc009mzt.1 | 0.47 | 0.008 | ||||
| Anxa6 | 0.50 | 0.001 | Annexin A6 | |||
Table 4
Electrophysiological properties of BLApn: Stk11 knockout vs. GFP controls
| Group | Statistics | Resting membrane potential (mV) | Access resistance (mΩ) | Input resistance (mΩ) | mAHP (mV) | sAHP (mV) | Action potential amplitude (mV) | Action potential half width (ms) | Action potential threshold (mV) | Sag ratio |
|---|---|---|---|---|---|---|---|---|---|---|
| KO Mice = 11 Neuron = 30 | Mean | −78.23 | 19.68 | 105.33 | 7.44 | 0.92 | 74.41 | 0.80 | −50.01 | 0.13 |
| S.D. | 3.73 | 2.76 | 24.88 | 1.93 | 0.35 | 6.58 | 0.10 | 2.44 | 0.04 | |
| GFP Mice = 11 Neuron = 36 | Mean | −76.96 | 18.02 | 85.41 | 9.71 | 0.64 | 78.05 | 0.79 | −48.30 | 0.15 |
| S.D. | 2.66 | 3.47 | 17.65 | 1.64 | 0.26 | 4.39 | 0.07 | 2.55 | 0.03 | |
| F | 2.59 | 4.47 | 14.41 | 26.69 | 13.78 | 7.17 | 0.19 | 7.68 | 7.48 | |
| p | 0.112 | 0.0383 | 3.29E-4 | 2.54E-06 | 4.32E-4 | 0.0094 | 0.664 | 0.0073 | 0.008 |
Table 5
Electrophysiological properties of BLApn: Fos knockout vs. GFP controls
| Group | Statistics | Resting membrane potential (mV) | Access resistance (mΩ) | Input resistance (mΩ) | mAHP (mV) | sAHP (mV) | Action potential amplitude (mV) | Action potential half width (ms) | Action potential threshold (mV) |
|---|---|---|---|---|---|---|---|---|---|
| KO Mice = 5 Neuron = 27 | Mean | −75.43 | 19.63 | 113.91 | 10.34 | 0.40 | 65.87 | 0.72 | −40.79 |
| S.D. | 5.08 | 4.95 | 27.73 | 4.30 | 0.19 | 8.31 | 0.11 | 5.83 | |
| GFP Mice = 5 Neuron = 24 | Mean | −76.50 | 14.35 | 86.01 | 8.95 | 0.38 | 73.30 | 0.74 | −45.62 |
| S.D. | 3.38 | 5.17 | 19.58 | 2.05 | 0.17 | 5.11 | 0.12 | 3.02 | |
| F | 0.768 | 13.882 | 16.812 | 2.096 | 0.144 | 14.334 | 0.224 | 13.306 | |
| p | 0.385 | 5.04E-04 | 1.55E-04 | 0.154 | 0.706 | 4.18E-04 | 0.638 | 6.40E-04 |
Additional files
Download links
A two-part list of links to download the article, or parts of the article, in various formats.
Downloads (link to download the article as PDF)
Open citations (links to open the citations from this article in various online reference manager services)
Cite this article (links to download the citations from this article in formats compatible with various reference manager tools)
Deletion of Stk11 and Fos in mouse BLA projection neurons alters intrinsic excitability and impairs formation of long-term aversive memory
eLife 9:e61036.
https://doi.org/10.7554/eLife.61036


