EKLF/KLF1 expression defines a unique macrophage subset during mouse erythropoiesis
- Department of Cell, Developmental, and Regenerative Biology, Mount Sinai School of Medicine, United States
- Black Family Stem Cell Institute, United States
- Tisch Cancer Institute, United States
- Mindich Child Health and Development Institute, Mount Sinai School of Medicine, United States
Figures
Figure 1 with 1 supplement
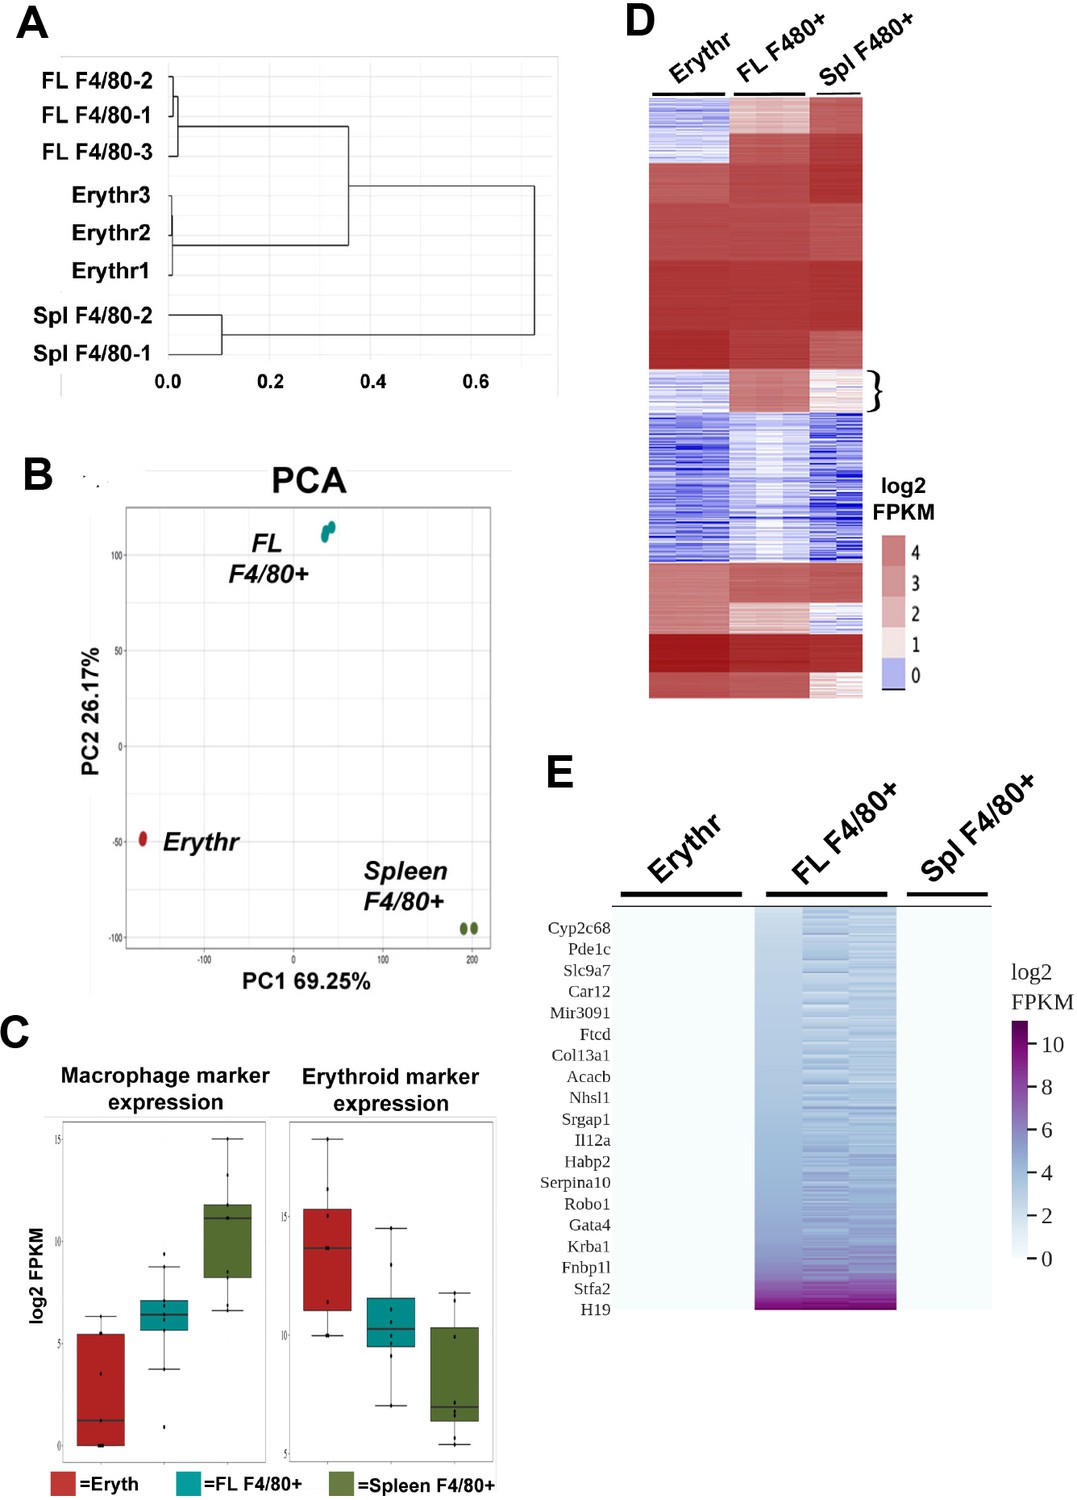
Gene expression comparison of fetal liver (FL) F4/80+ macrophages with extensively self-renewing erythroblasts (ESREs; Erythr) and adult spleen (Spl) F4/80+ macrophages showing unique gene expression in F4/80+ FL macrophages.
(A) Hierarchical clustering dendrogram using scaled Z-scores based on the expression of the top 10,000 highly expressed genes is shown for individual RNA-Seq biological replicates from each cell type (source data: Figure 1—source data 1). (B) Principal component analysis of the cell types is plotted showing principal components 1 and 2 for each biological replicate (source data: Figure 1—source data 1). (C) Macrophage-specific or erythroid-specific marker expression in the cell types is shown, with replicates averaged together (source data: Figure 1—source data 3). (D) k-means clustering of individual RNA-Seq biological replicates of the different cell types (ESREs, Erythr; fetal liver, FL; spleen, Spl) by log2 FPKM displayed as a heatmap (source data: Figure 1—source data 4). Flower bracket indicates the gene cluster with enriched expression in F4/80+ FL macrophages. (E) Heatmap of only the uniquely expressed genes in F4/80+ FL macrophages that define the signature genes of this cell type (source data: Figure 1—source data 2). A few representative signature gene names are displayed.
-
Figure 1—source data 1
Scaled Z-scores of FPKM values of the top 10,000 highly expressed genes in each cell type shown in Figure 1.
- https://cdn.elifesciences.org/articles/61070/elife-61070-fig1-data1-v2.csv.zip
-
Figure 1—source data 2
Expression of signature genes of fetal liver F4/80+ macrophages in each cell type.
- https://cdn.elifesciences.org/articles/61070/elife-61070-fig1-data2-v2.xlsx
-
Figure 1—source data 3
List of macrophage and erythroid markers and their expression levels in each cell type.
- https://cdn.elifesciences.org/articles/61070/elife-61070-fig1-data3-v2.xlsx
-
Figure 1—source data 4
Log2 FPKM values of all expressed genes in the cell types shown in Figure 1.
- https://cdn.elifesciences.org/articles/61070/elife-61070-fig1-data4-v2.csv.zip
Figure 1—figure supplement 1

Isolation of a pure population of F4/80+ E13.5 fetal liver cells by FACS.
(A) Gating strategy used to stringently sort singlets that are F4/80+ is shown from unstained (no antibody [Ab]) or treated (anti-F4/80 Ab) fetal liver cells from EKLF+/+ E13.5 fetal livers. (The same approach was used for EKLF-/- cell sorting in Figure 3A.) (B) FACS-sorted cells using the strategy above were cytospun on a slide and observed after May-Grunwald-Giemsa staining for singlets, doublets, or >3 cells. 25 µm scale bars are indicated. (C) Quantification of data from (B) (source data: Figure 1—figure supplement 1—source data 1 ).
-
Figure 1—figure supplement 1—source data 1
Quantification of cells isolated by FACS sorting F4/80+ macrophages from E13.5 fetal liver after cytospin.
- https://cdn.elifesciences.org/articles/61070/elife-61070-fig1-figsupp1-data1-v2.csv.zip
Figure 2

EKLF/Klf1 is expressed in fetal liver macrophages during development.
(A) Immunofluorescence tests with anti-EKLF (white), 4′,6-diamidino-2-phenylindole (DAPI) (blue), and anti-F4/80 (red) antibodies in E13.5 fetal liver cells. (A) White arrowheads show coexpression of EKLF and F4/80 proteins in single cells (representative of over 20 EKLF+/F4/80+ cells in this field of 300 cells); red arrow shows that not all F4/80+ cells are EKLF+. (B) White arrow shows that not all EKLF+ cells are F4/80+ , as expected from the FACS data (cytoplasmic EKLF signal is expected [Quadrini et al., 2008; Schoenfelder et al., 2010]). (C) Collated RNA-Seq data (Mass et al., 2016) of sorted macrophage cells from multiple staged embryonic (E) day 10.25–16.5 fetal livers or postnatal (P) day 2–21 livers (ckit-/CD45+/F480+/AA4.1-/CD11b+; n = 24 samples) show transient and abundant Klf1 reads (UCSC Genome Browser). (D) Same analysis as (C) showing RNA-Seq reads of the gene encoding F4/80 (Adgre1) as a positive control across all samples.
Figure 3
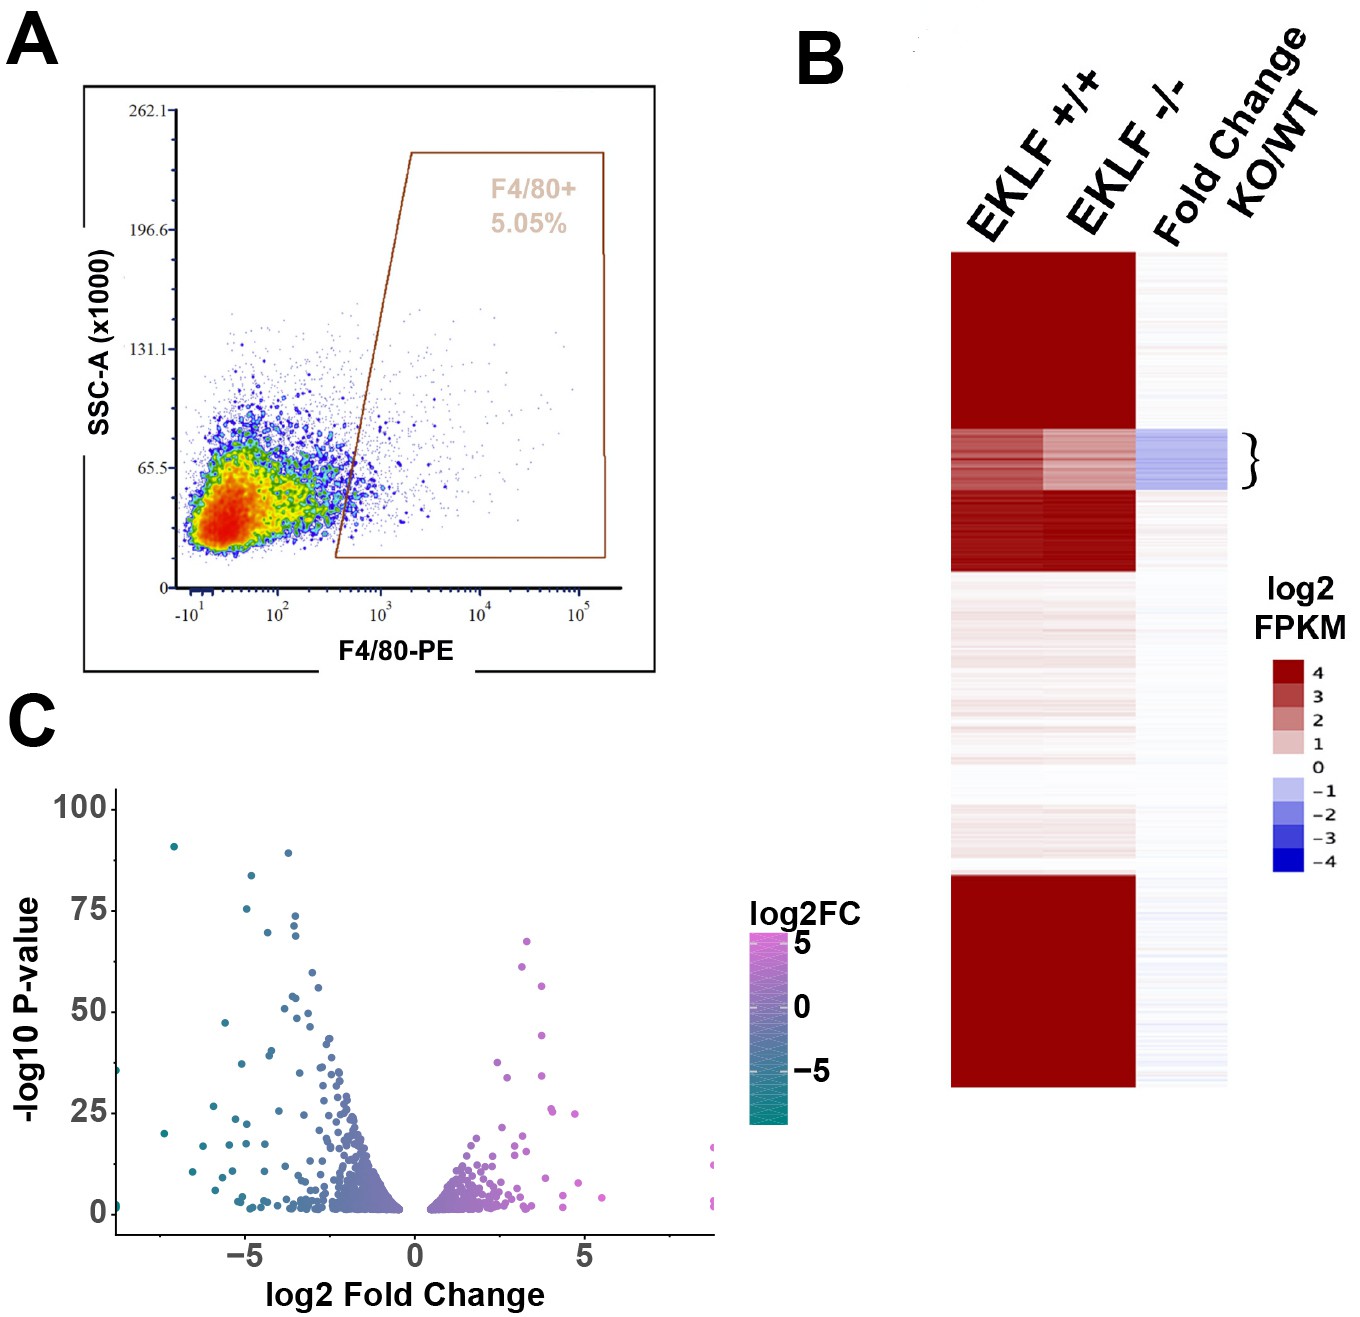
EKLF-dependent gene expression in fetal liver (FL) macrophages.
(A) A representative yield of cells from EKLF-/- FL sorted by F4/80 expression, used for RNA-Seq analysis, is shown (compare to WT yield in Figure 1—figure supplement 1A). (B) k-means clustering of absolute log2 FPKM of F4/80+ EKLF+/+ and F4/80+ EKLF-/-, and log2 FKPM ratio EKLF-/-(KO)/WT is displayed as a heatmap. Flower bracket indicates downregulated genes. (C) Differentially expressed genes in EKLF-/- (KO) compared to WT shown as a volcano plot (source data: Figure 3—source data 1).
-
Figure 3—source data 1
Differential expression test results obtained from DESeq2 using the RNA-Seq data from EKLF+/+ and EKLF-/- fetal liver F4/80+ macrophages.
- https://cdn.elifesciences.org/articles/61070/elife-61070-fig3-data1-v2.csv.zip
Figure 4 with 1 supplement
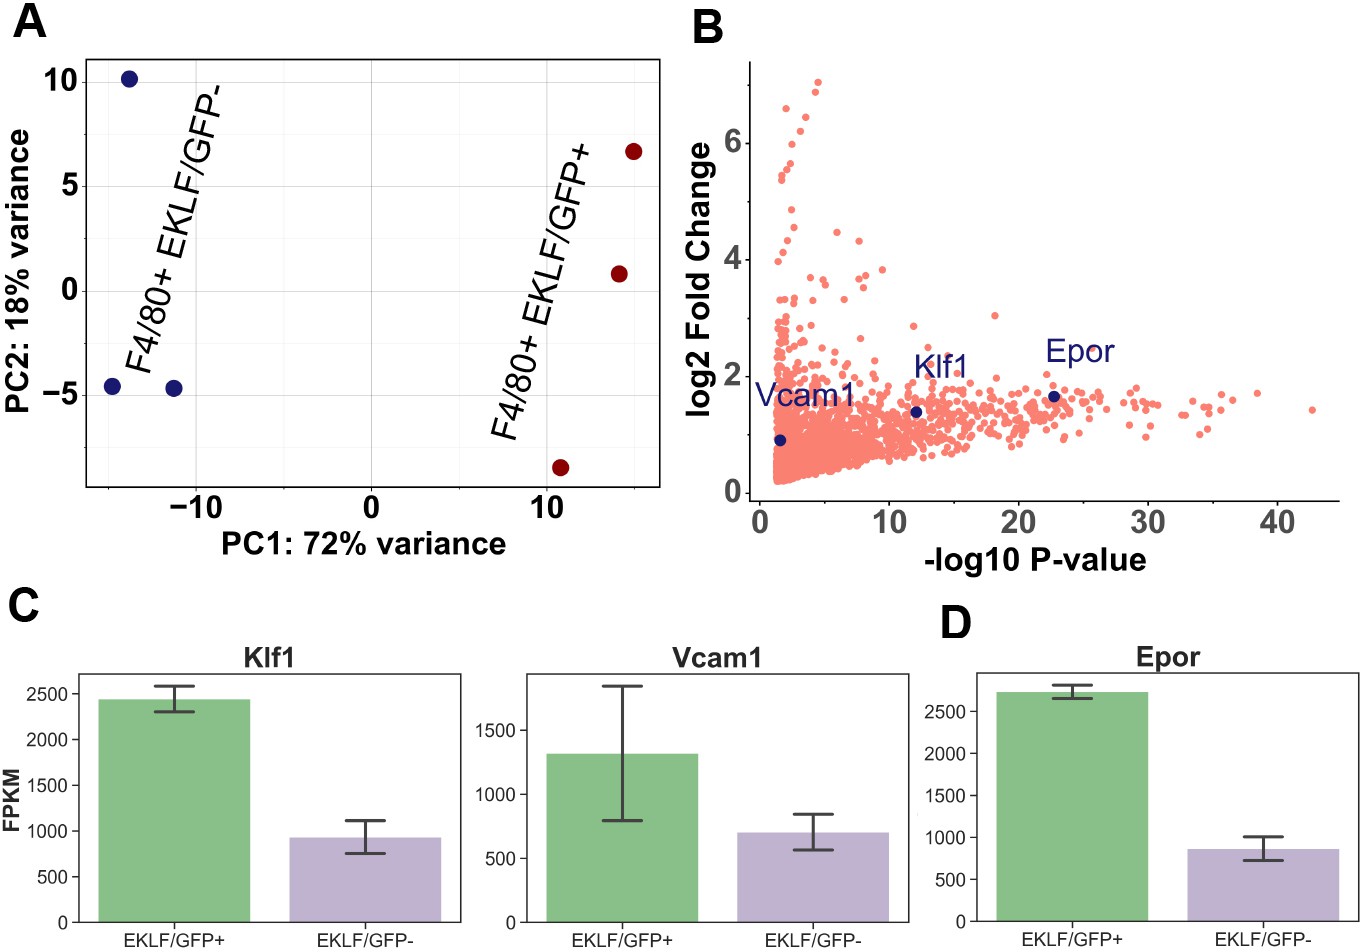
Comparison of gene expression in F4/80+ EKLF/GFP+ and F4/80+ EKLF/GFP- fetal liver macrophages.
(A) Principal component analysis using scaled Z-score based on the expression level of the top 10,000 highly expressed genes from RNA-Seq replicates of F4/80+ EKLF/GFP+ and F4/80+ EKLF/GFP- is plotted with each axis depicting the two major principal components (source data: Figure 4—source data 1). (B) Scatterplot showing the significantly enriched genes in the F4/80+ EKLF/GFP+ population compared to F4/80+ EKLF/GFP-. Vcam1, Klf1, and Epor are highlighted in blue (source data: Figure 4—source data 2). Fragments per kilobase million (FPKM) values of (C) EKLF/Klf1 and Vcam1 and (D) Epor in the two populations.
-
Figure 4—source data 1
Coordinates of principal components 1 and 2 corresponding to each replicate of EKLF/GFP+ and EKLF/GFP- RNA-Seq data.
- https://cdn.elifesciences.org/articles/61070/elife-61070-fig4-data1-v2.csv.zip
-
Figure 4—source data 2
Differential gene expression results obtained using DESeq2 from the EKLF/GFP RNA-Seq dataset.
- https://cdn.elifesciences.org/articles/61070/elife-61070-fig4-data2-v2.csv.zip
Figure 4—figure supplement 1
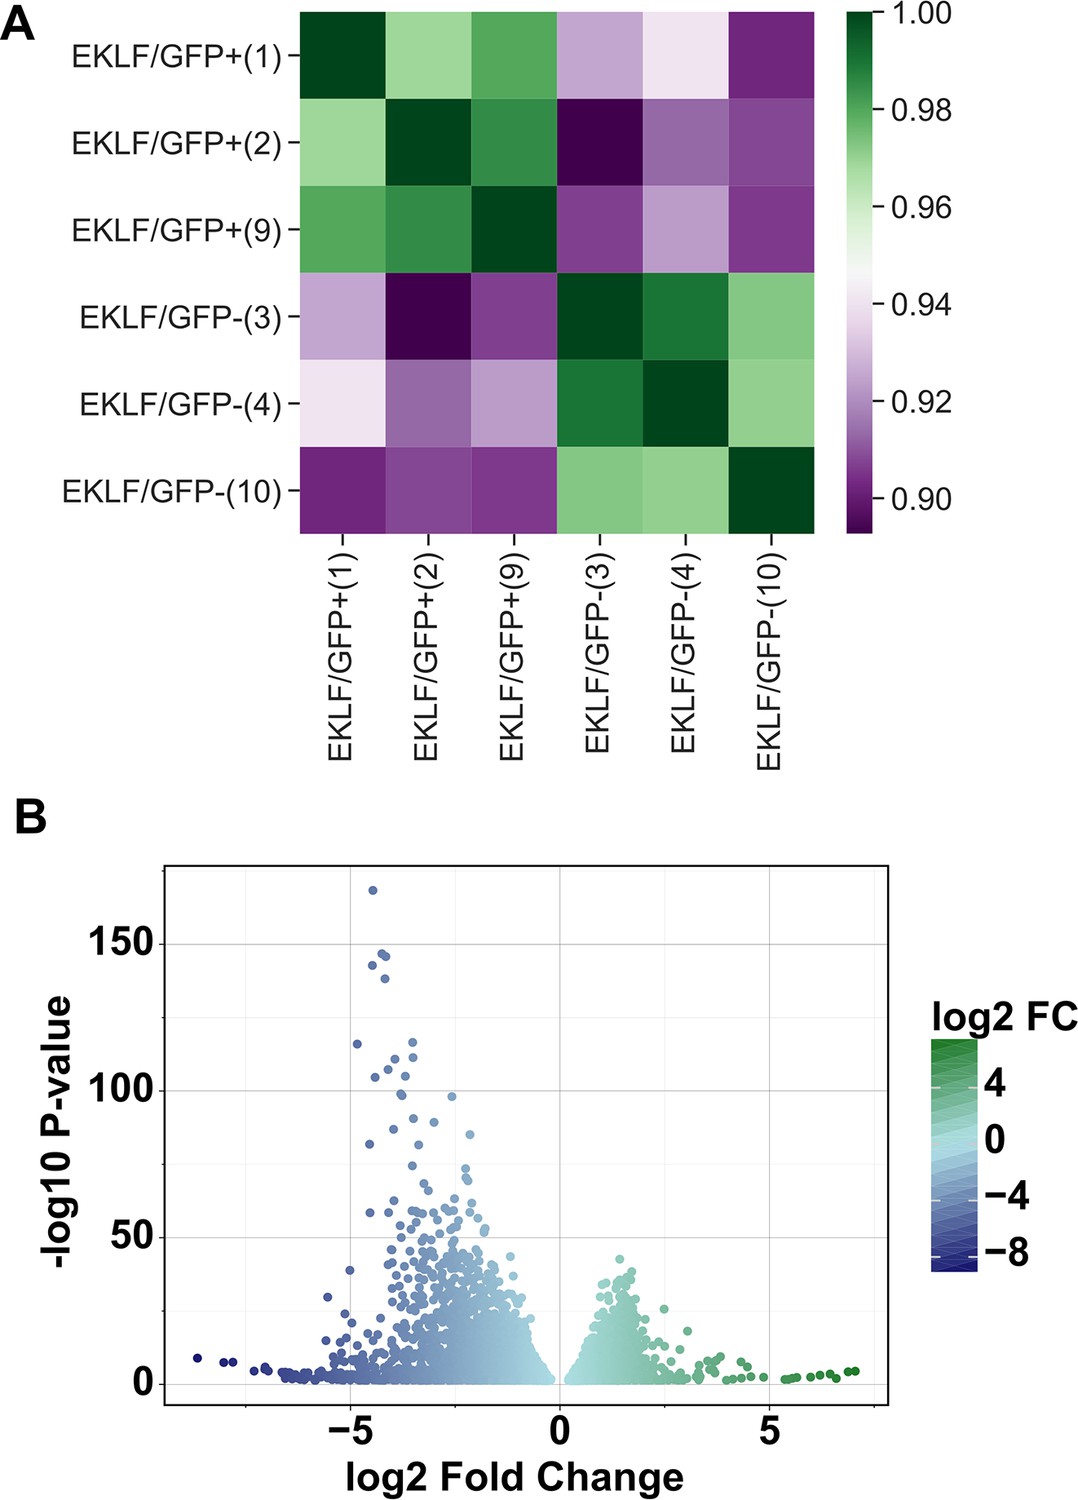
Comparison of gene expression in F4/80+ EKLF/GFP+ and F4/80+ EKLF/GFP- fetal liver macrophages.
(A) Correlation analysis of Z-score transformed gene expression data for each replicate in RNA-Seq showing high correlation between EKLF/GFP+ and EKLF/GFP- replicates, respectively (source data: Figure 4—figure supplement 1—source data 1). (B) Volcano plot showing genes enriched in EKLF/GFP+ and EKLF/GFP- (source data: Figure 4—source data 2).
-
Figure 4—figure supplement 1—source data 1
Scaled Z-scores of FPKM values of the top 10,000 highly expressed genes in the EKLF/GFP+ F4/80+ RNA-Seq dataset.
- https://cdn.elifesciences.org/articles/61070/elife-61070-fig4-figsupp1-data1-v2.csv.zip
Figure 5 with 2 supplements
EKLF specifies lineage and cell-cycle transcription factors in F4/80+ fetal liver (FL) island macrophages.
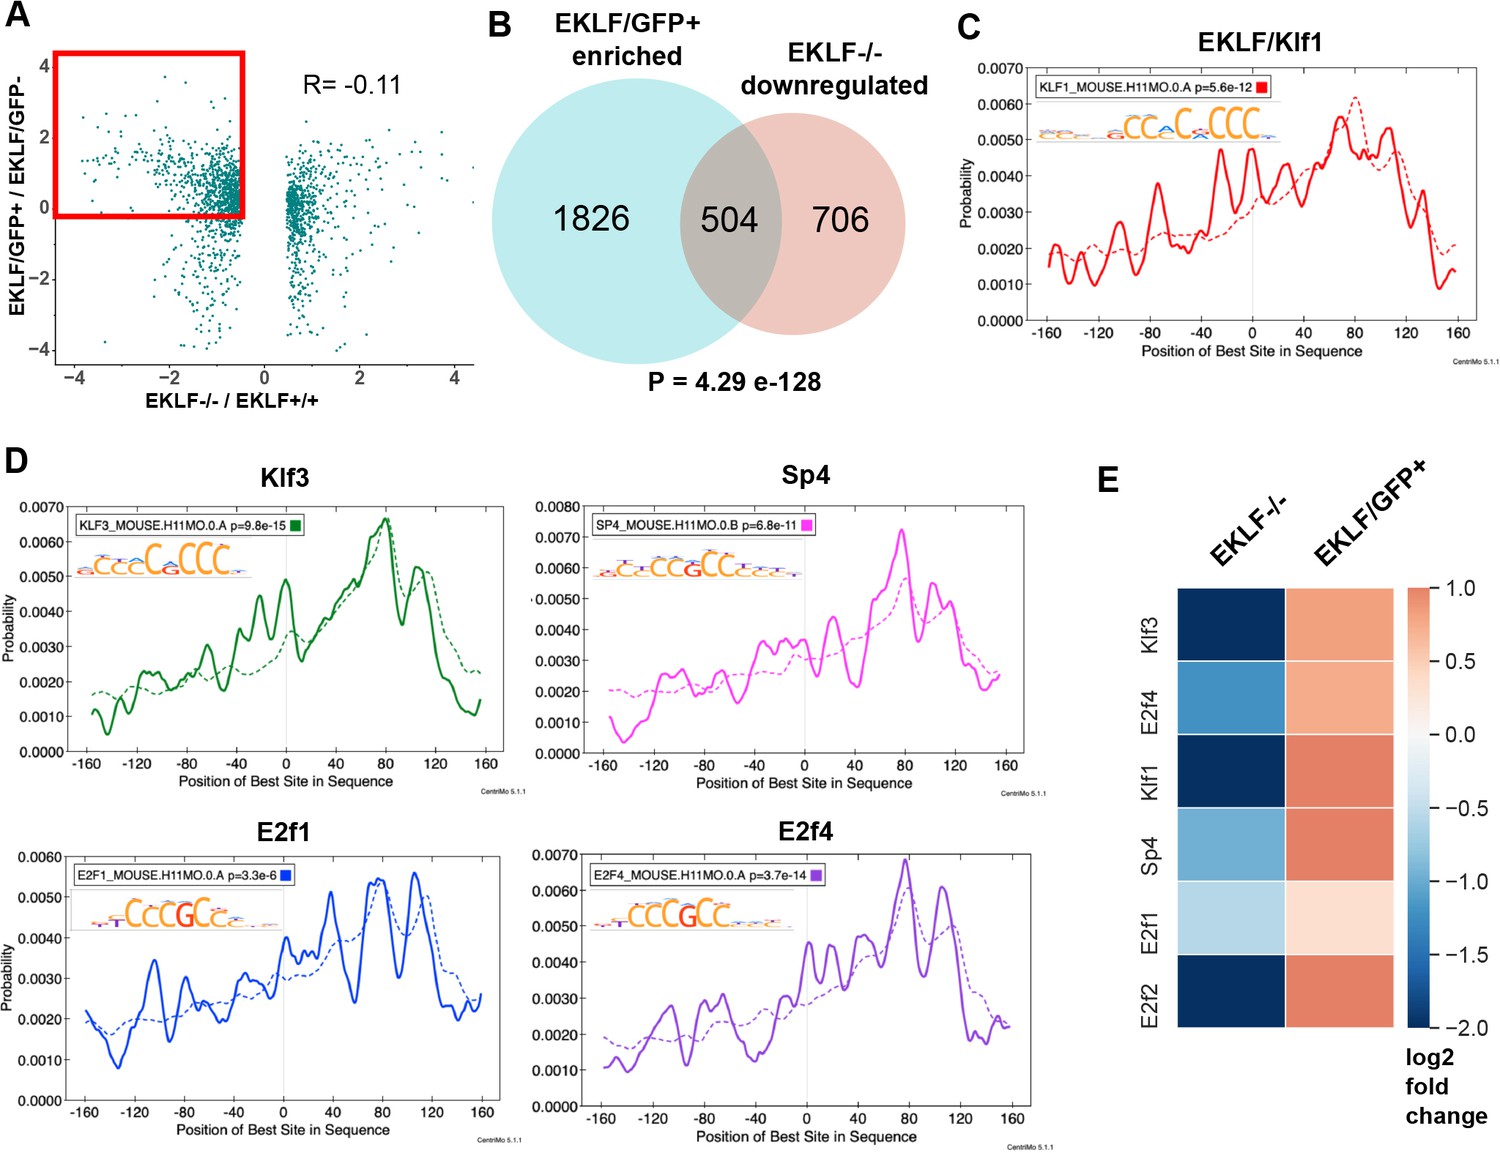
(A) Scatterplot of log2-fold changes in EKLF/GFP+ plotted against EKLF-/-. Red box shows the genes that are common and of interest from both datasets, that is, enriched in EKLF/GFP+ and downregulated in EKLF-/- F4/80+ FL macrophages (source data: Figure 5—source data 1). (B) Venn diagram showing the number of genes in each category from (A). Centrimo analysis of promoters of EKLF-dependent genes showing differential motif enrichment of (C) EKLF/Klf1 and (D) Klf3, Sp4, E2f1, and E2f4 motifs (source data: Figure 5—source data 2, 3). Dotted line depicts the expected probability of occurrence of the respective motif in the background dataset (see 'Materials and methods'). (E) Heatmap showing log2-fold change of expression in EKLF-/- and EKLF/GFP+ of the above EKLF-dependent transcription factors in F4/80+ FL macrophages.
-
Figure 5—source data 1
Expression values of differentially expressed genes in EKLF-/- cells vs WT cells compared with their expression in the EKLF/GFP+ dataset.
- https://cdn.elifesciences.org/articles/61070/elife-61070-fig5-data1-v2.csv.zip
-
Figure 5—source data 2
FASTA sequences of the promoters of EKLF-dependent genes.
- https://cdn.elifesciences.org/articles/61070/elife-61070-fig5-data2-v2.fa.zip
-
Figure 5—source data 3
FASTA sequences of the promoters of all genes not included in the EKLF-dependent gene set.
- https://cdn.elifesciences.org/articles/61070/elife-61070-fig5-data3-v2.fa.zip
Figure 5—figure supplement 1
EKLF-dependent genes expressed in F4/80+ fetal liver (FL) macrophages.
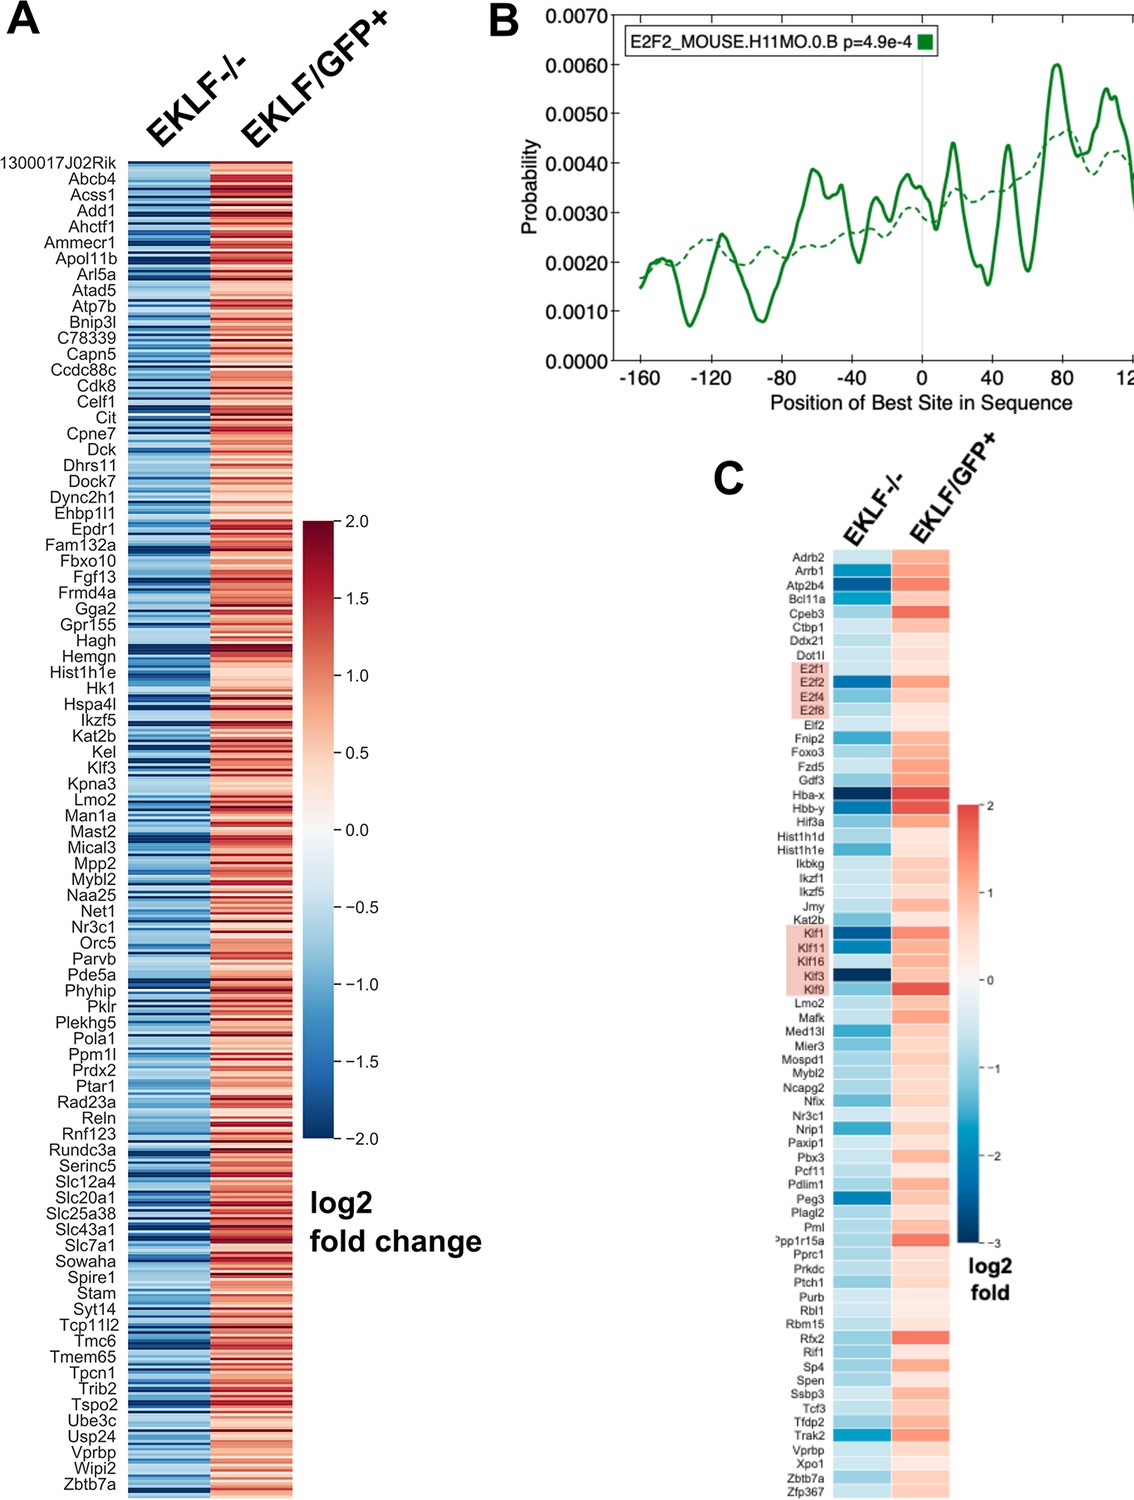
(A) Heatmap showing log2-fold change expression in EKLF-/- over WT and EKLF/GFP+ over EKLF/GFP- of all the 504 EKLF-dependent genes in F4/80+ FL macrophages (source data: Figure 5—figure supplement 1—source data 1). One in every six genes’ name is displayed for visibility. (B) Centrimo analysis of E2f2 promoter of EKLF-dependent genes showing differential motif enrichment of E2f2 motifs (source data: Figure 5—source data 2, 3). Dotted line depicts the expected probability of occurrence of the E2f2 motif in the background dataset (see 'Materials and methods'). (C) Heatmap showing log2-fold change expression of potential EKLF-dependent transcription factors (source data: Figure 5—figure supplement 1—source data 1). Red boxes highlight the lineage Klf transcription factors and the cell-cycle E2f transcription factors.
-
Figure 5—figure supplement 1—source data 1
Expression values of EKLF-dependent genes.
- https://cdn.elifesciences.org/articles/61070/elife-61070-fig5-figsupp1-data1-v2.csv.zip
Figure 5—figure supplement 2
EKLF-dependent signature genes in F4/80+ fetal liver (FL) macrophages.
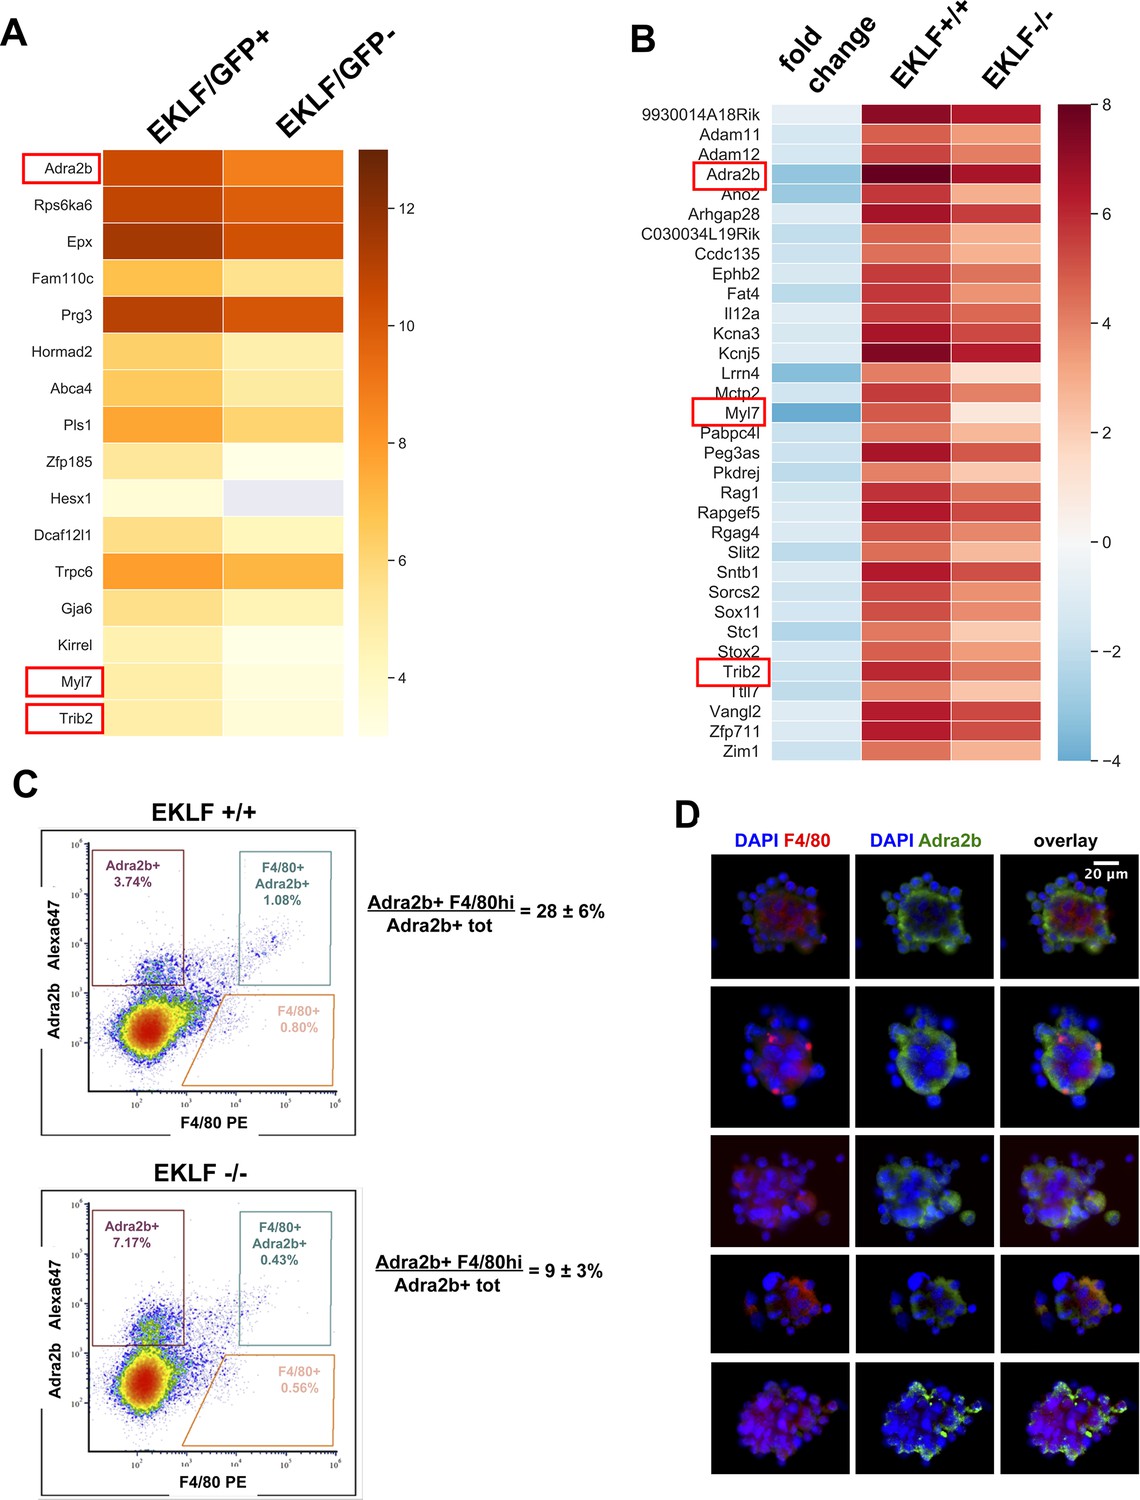
(A) Heatmap of log2 FPKM values of F4/80+ FL signature genes (Figure 1E) that are also enriched in F4/80+ EKLF/GFP+ cells (source data: Figure 5—figure supplement 2—source data 1). (B) Heatmap of log2 FPKM and fold changes of FL signature genes that are significantly downregulated in EKLF-/- (source data: Figure 5—figure supplement 2—source data 2). Red boxes depict the EKLF-dependent signature genes that are common to both (A) and (B). (C) Density plot of flow cytometry analysis of E13.5 FLs stained with F4/80 and Adra2b antibodies. Gating scheme for F4/80-hi and Adra2b+ cells is shown in blue. The percentage of double-positive Adra2b+ and F4/80-hi cells, compared to total Adra2b+ cells, is indicated. (D) Representative pictures of erythroblastic islands from E13.5 FLs are shown after immunostaining with anti-F4/80 (red) or anti-Adra2b (green) antibodies. DNA stain was with DAPI (blue).
-
Figure 5—figure supplement 2—source data 1
Expression values of signature genes from Figure 1E that are significantly enriched in EKLF/GFP+ cells.
- https://cdn.elifesciences.org/articles/61070/elife-61070-fig5-figsupp2-data1-v2.csv.zip
-
Figure 5—figure supplement 2—source data 2
Expression of signature genes from Figure 1E that are significantly downregulated in EKLF-/- cells compared to WT.
- https://cdn.elifesciences.org/articles/61070/elife-61070-fig5-figsupp2-data2-v2.csv.zip
Figure 6 with 3 supplements

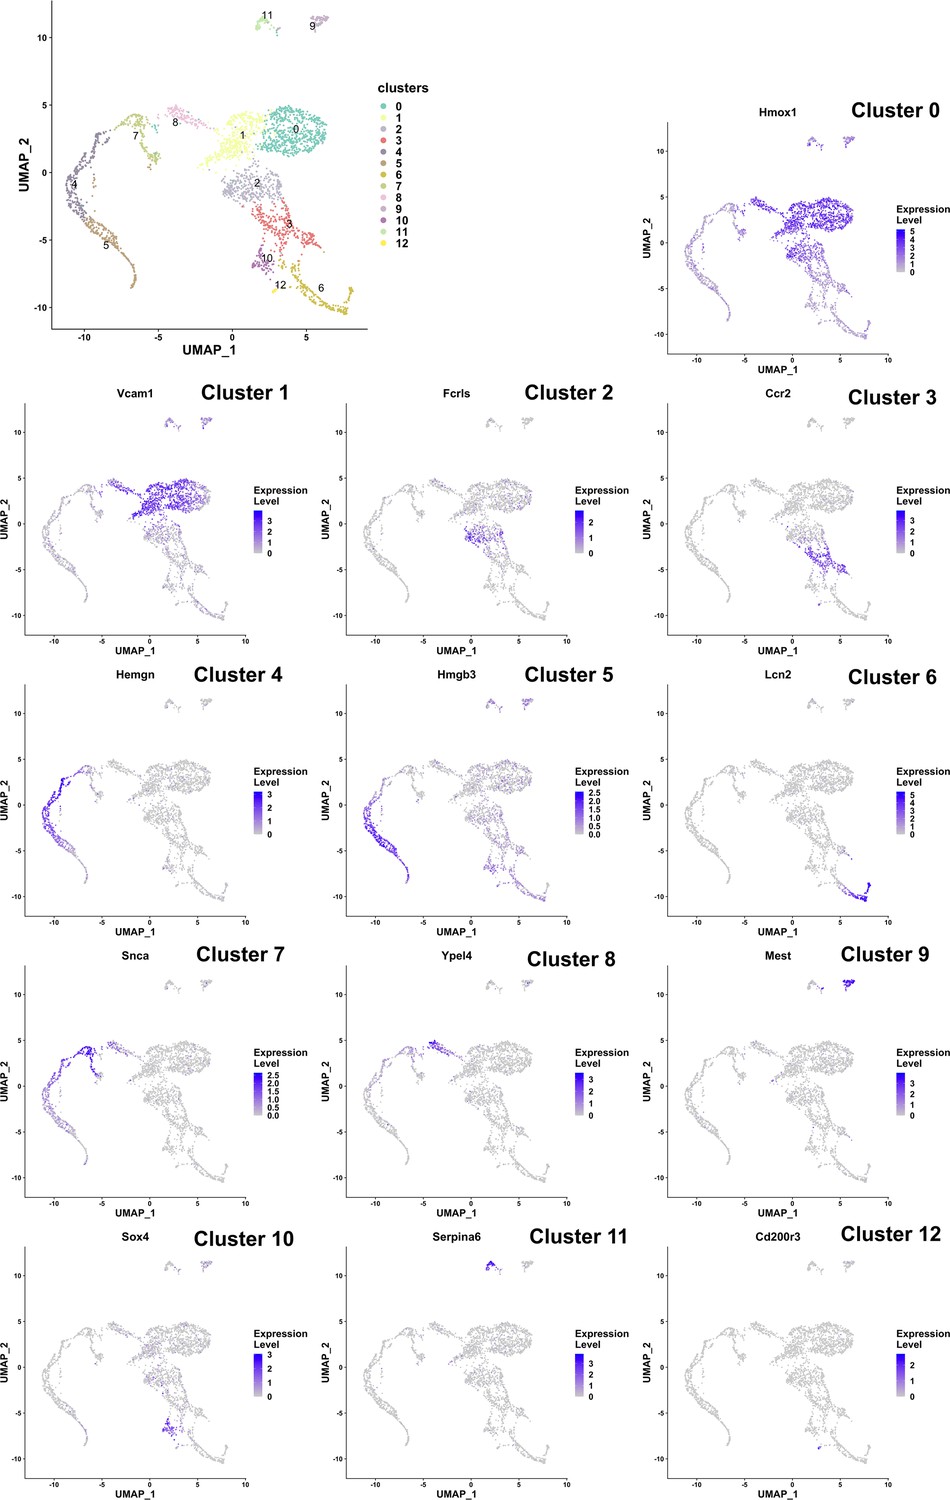
Resolving the cellular heterogeneity of E13.5 fetal liver (FL) macrophages using single-cell RNA-Seq.
(A) Unsupervised clustering using principal component analysis and subsequent U-MAP projections computed and plotted using the R Seurat package for single-cell RNA-Seq of purified E13.5 FL F4/80+ cells. Cluster numbers are indicated on the clusters. (B) Violin plot showing the distribution of F4/80 (Adgre1) mRNA expression in the clusters identified in (A). (C) Feature plots (left panel) showing individual cellular expression superimposed on the cluster, and Violin plots (right) showing the distribution of expression in each cluster of macrophage markers Vcam1 and Marco, and the macrophage-specific transcription factor PU.1 (Spic). (D) Differential mRNA enrichment in each cluster plotted as a heatmap, showing putative unique markers of each cluster (source data: Figure 6—source data 1). Relative expression levels are indicated by color: yellow=high, black=mid, and purple=low.
-
Figure 6—source data 1
Differentially expressed genes associated with each cluster of the single-cell RNA-Seq dataset.
- https://cdn.elifesciences.org/articles/61070/elife-61070-fig6-data1-v2.csv.zip
Figure 6—figure supplement 1
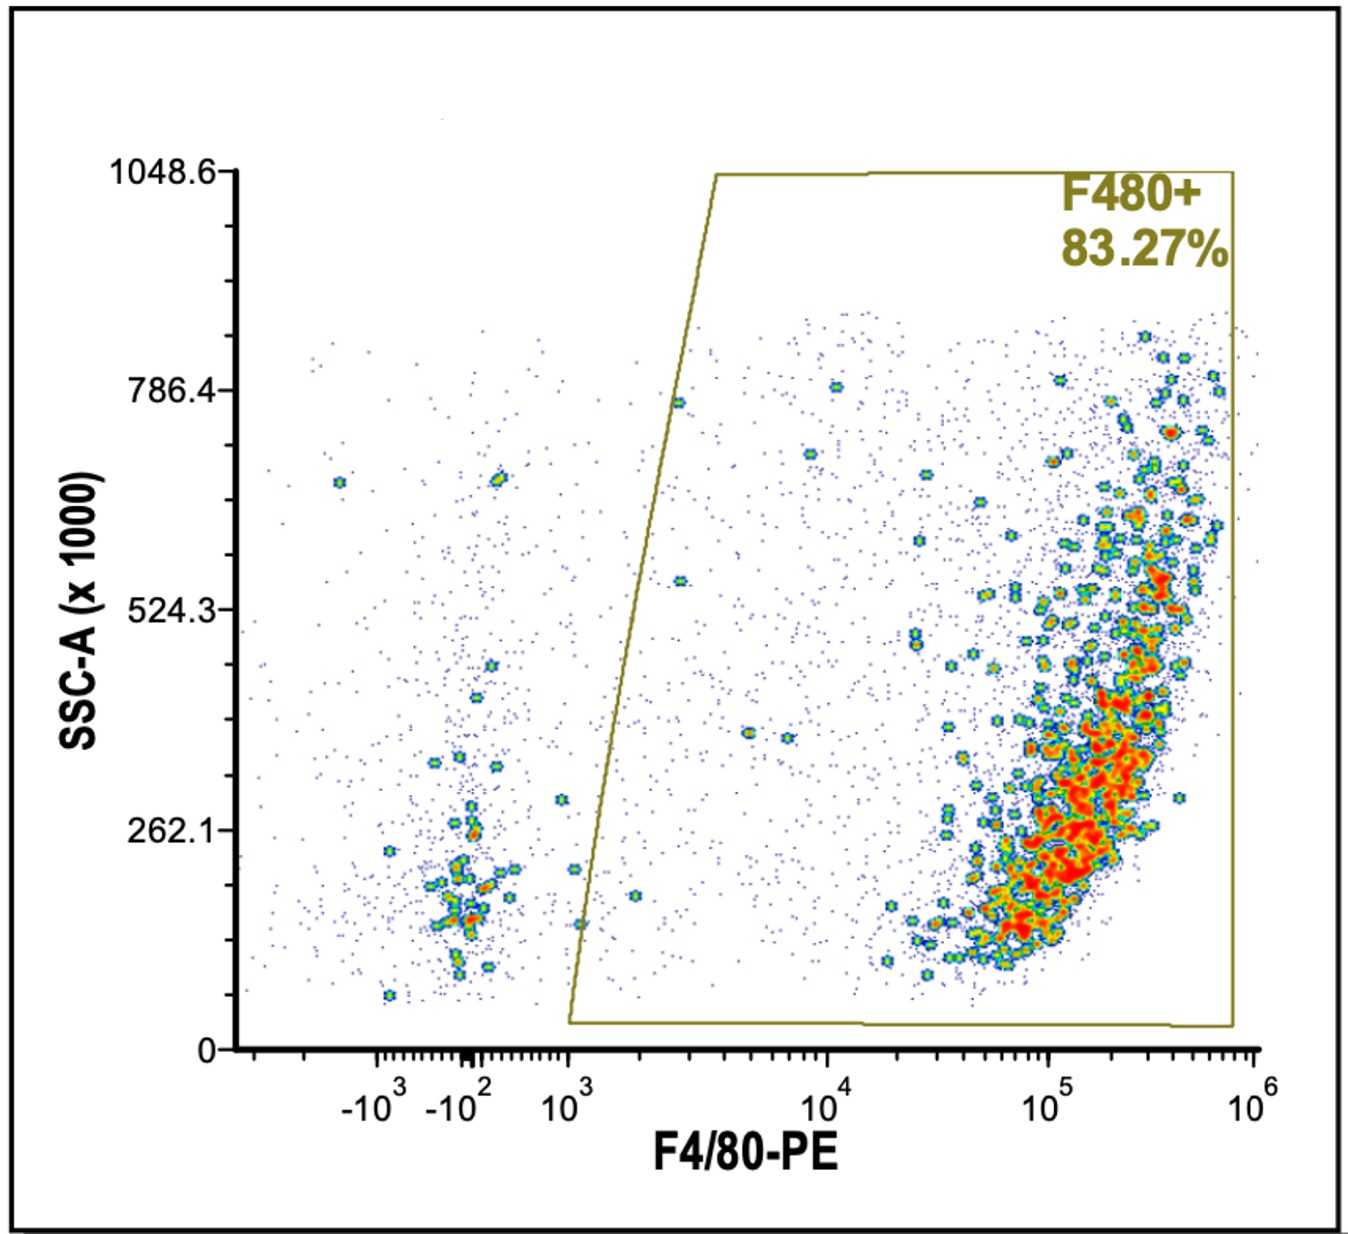
F4/80 purity check.
F4/80-PE cells isolated from E13.5 fetal livers using the EZSep (Cell Signaling Technologies) magnetic bead method in the presence of Icam4/αv inhibitor peptide (Xue et al., 2014) and analyzed by flow cytometry to determine purity of the F4/80+ population for single-cell sequencing.
Figure 6—figure supplement 2
Markers for each gene expression-based cluster of cells identified from single-cell sequencing of F4/80+ fetal liver macrophages.
Cluster number and marker names are indicated.
Figure 6—figure supplement 3
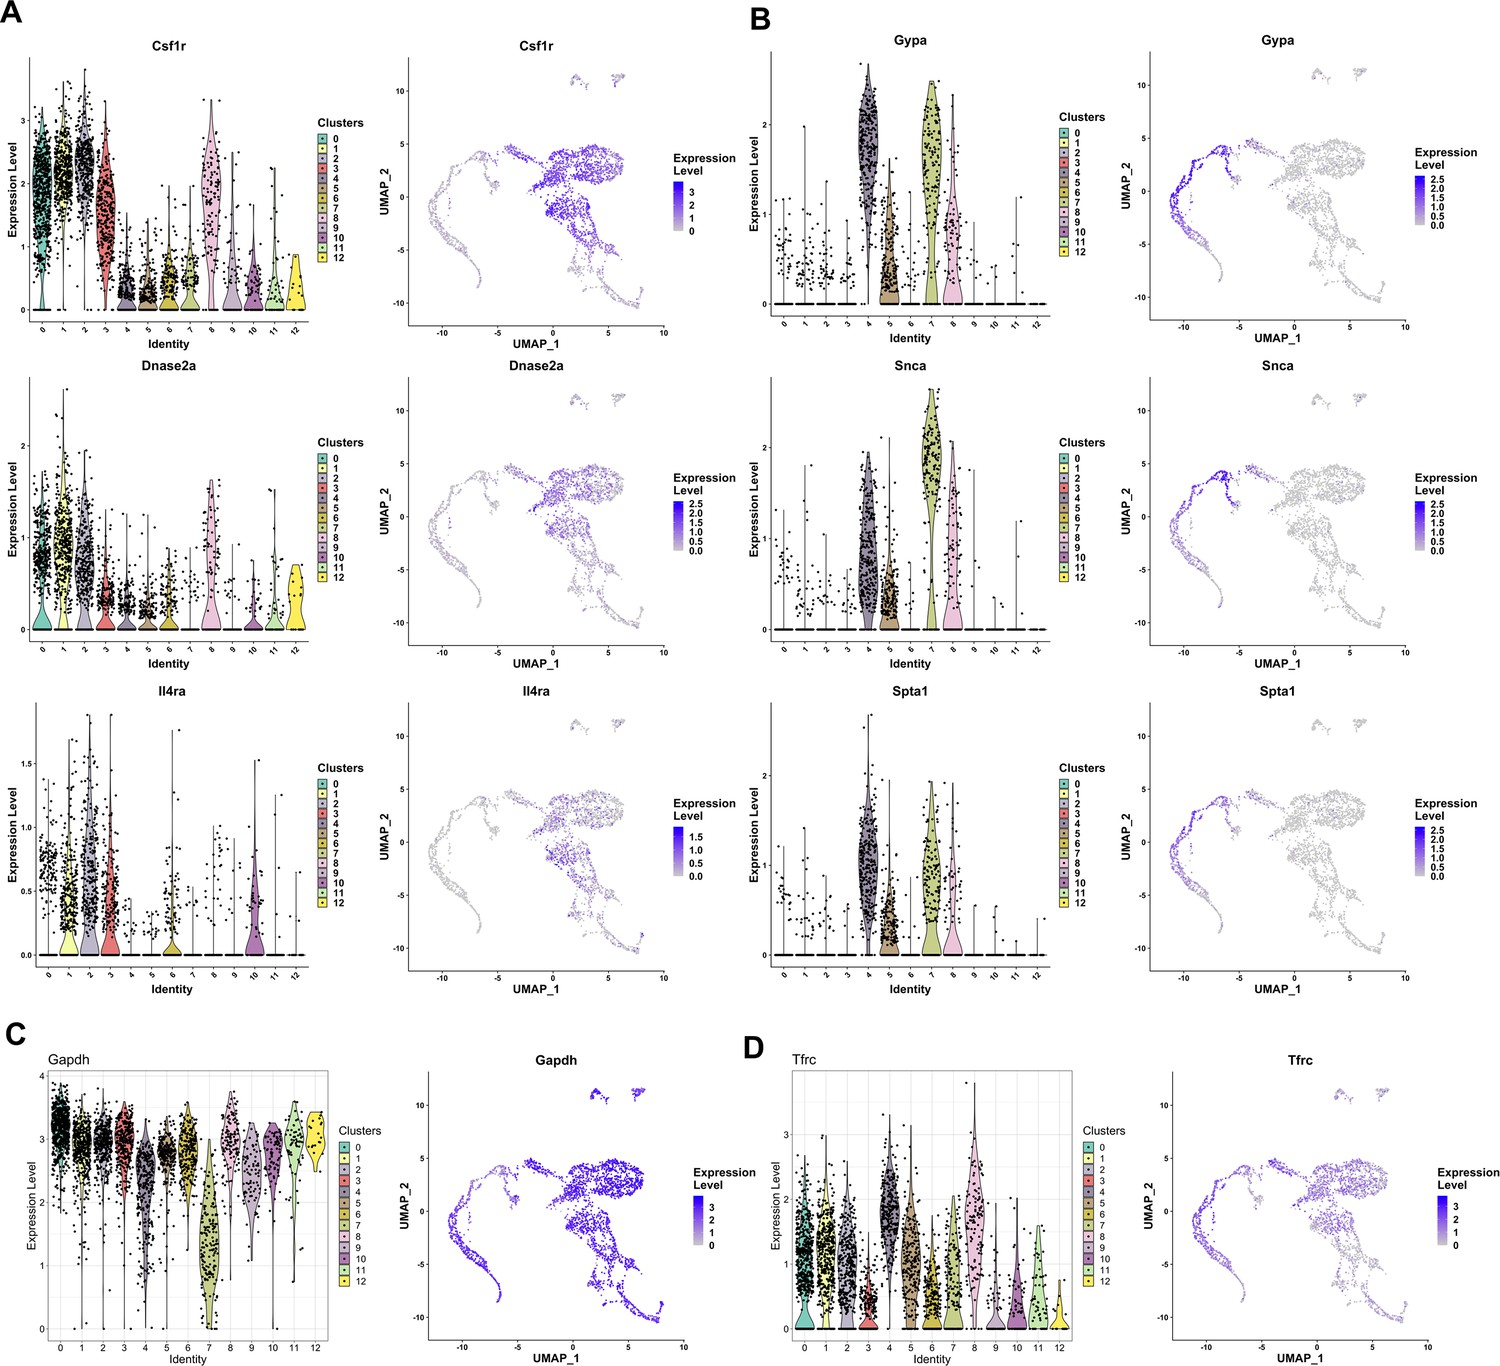
Markers of F4/80+ cell clusters with various cell identities.
Violin plot showing the distribution (left) and feature plot showing individual cell expression (right) of (A) Csf1r, Dnase2a, and Il4rα genes associated with activated macrophages; (B) Gypa, Snca, and Spta1 genes, which are markers for erythro-myeloid characteristics; (C) Gapdh; and (D) Tfrc (CD71), which are uniformly expressed in most clusters.
Figure 7
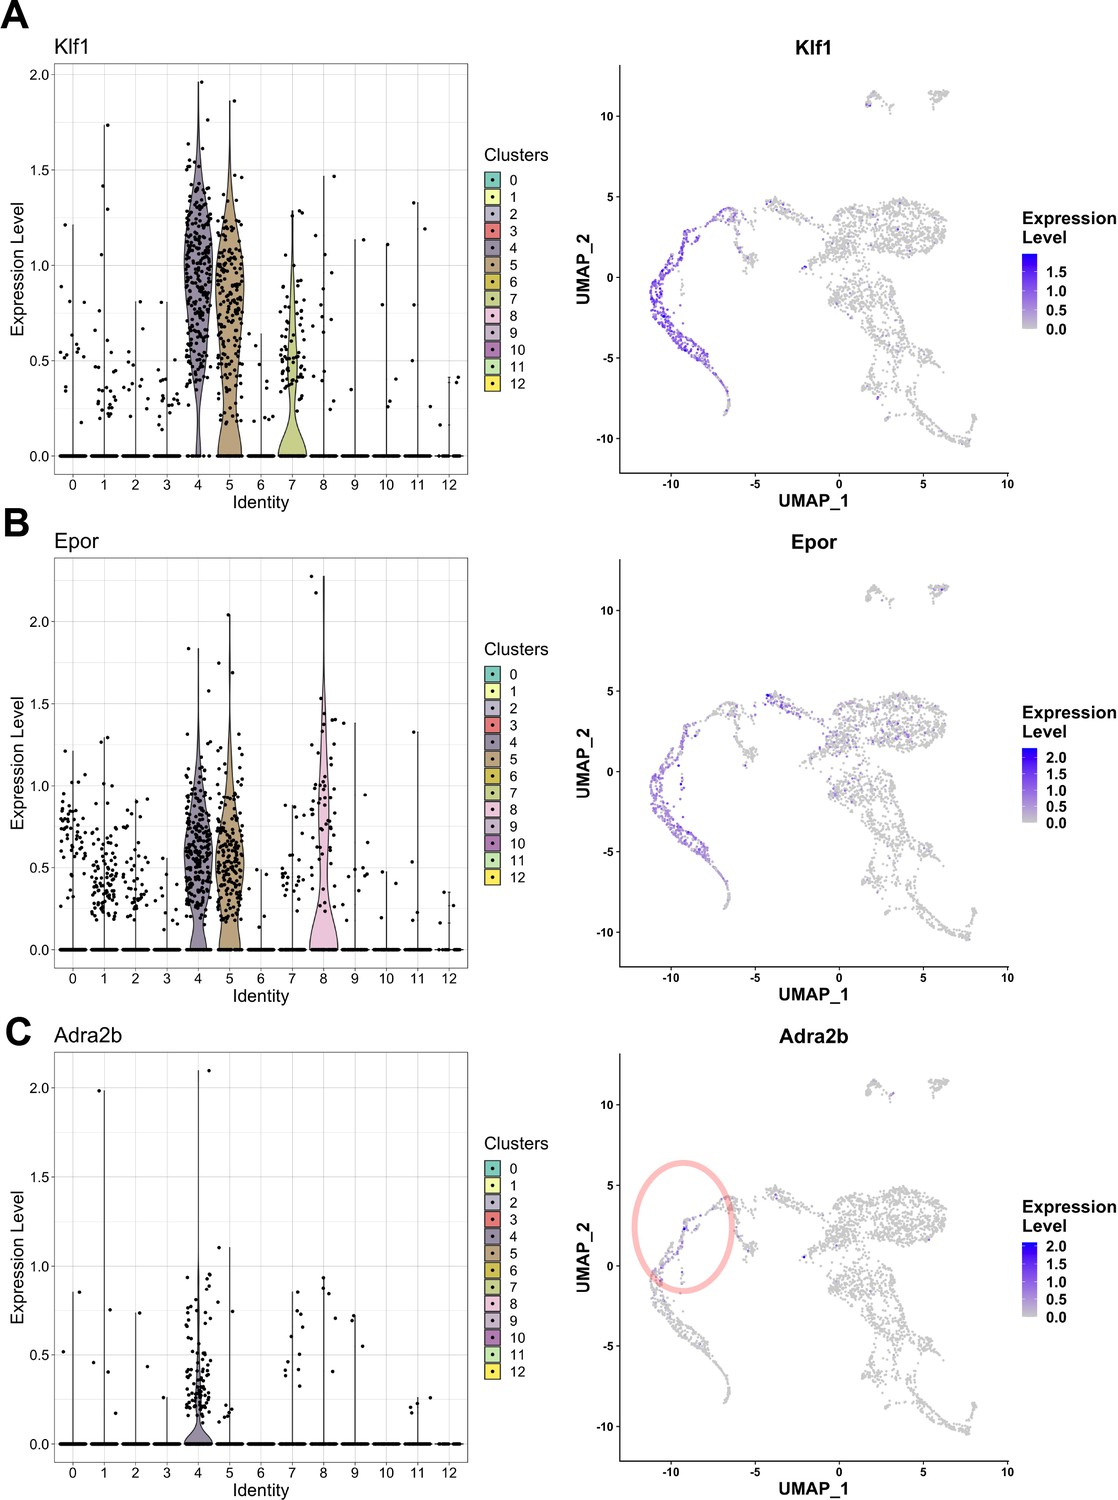
EKLF/Klf1-expressing clusters in F4/80+ fetal liver macrophages.
Violin plots showing distribution (left) and feature plots (right) showing individual cellular mRNA expression of (A) Klf1, (B) Epor, and (C) Adra2b superimposed on the clusters.
Figure 8
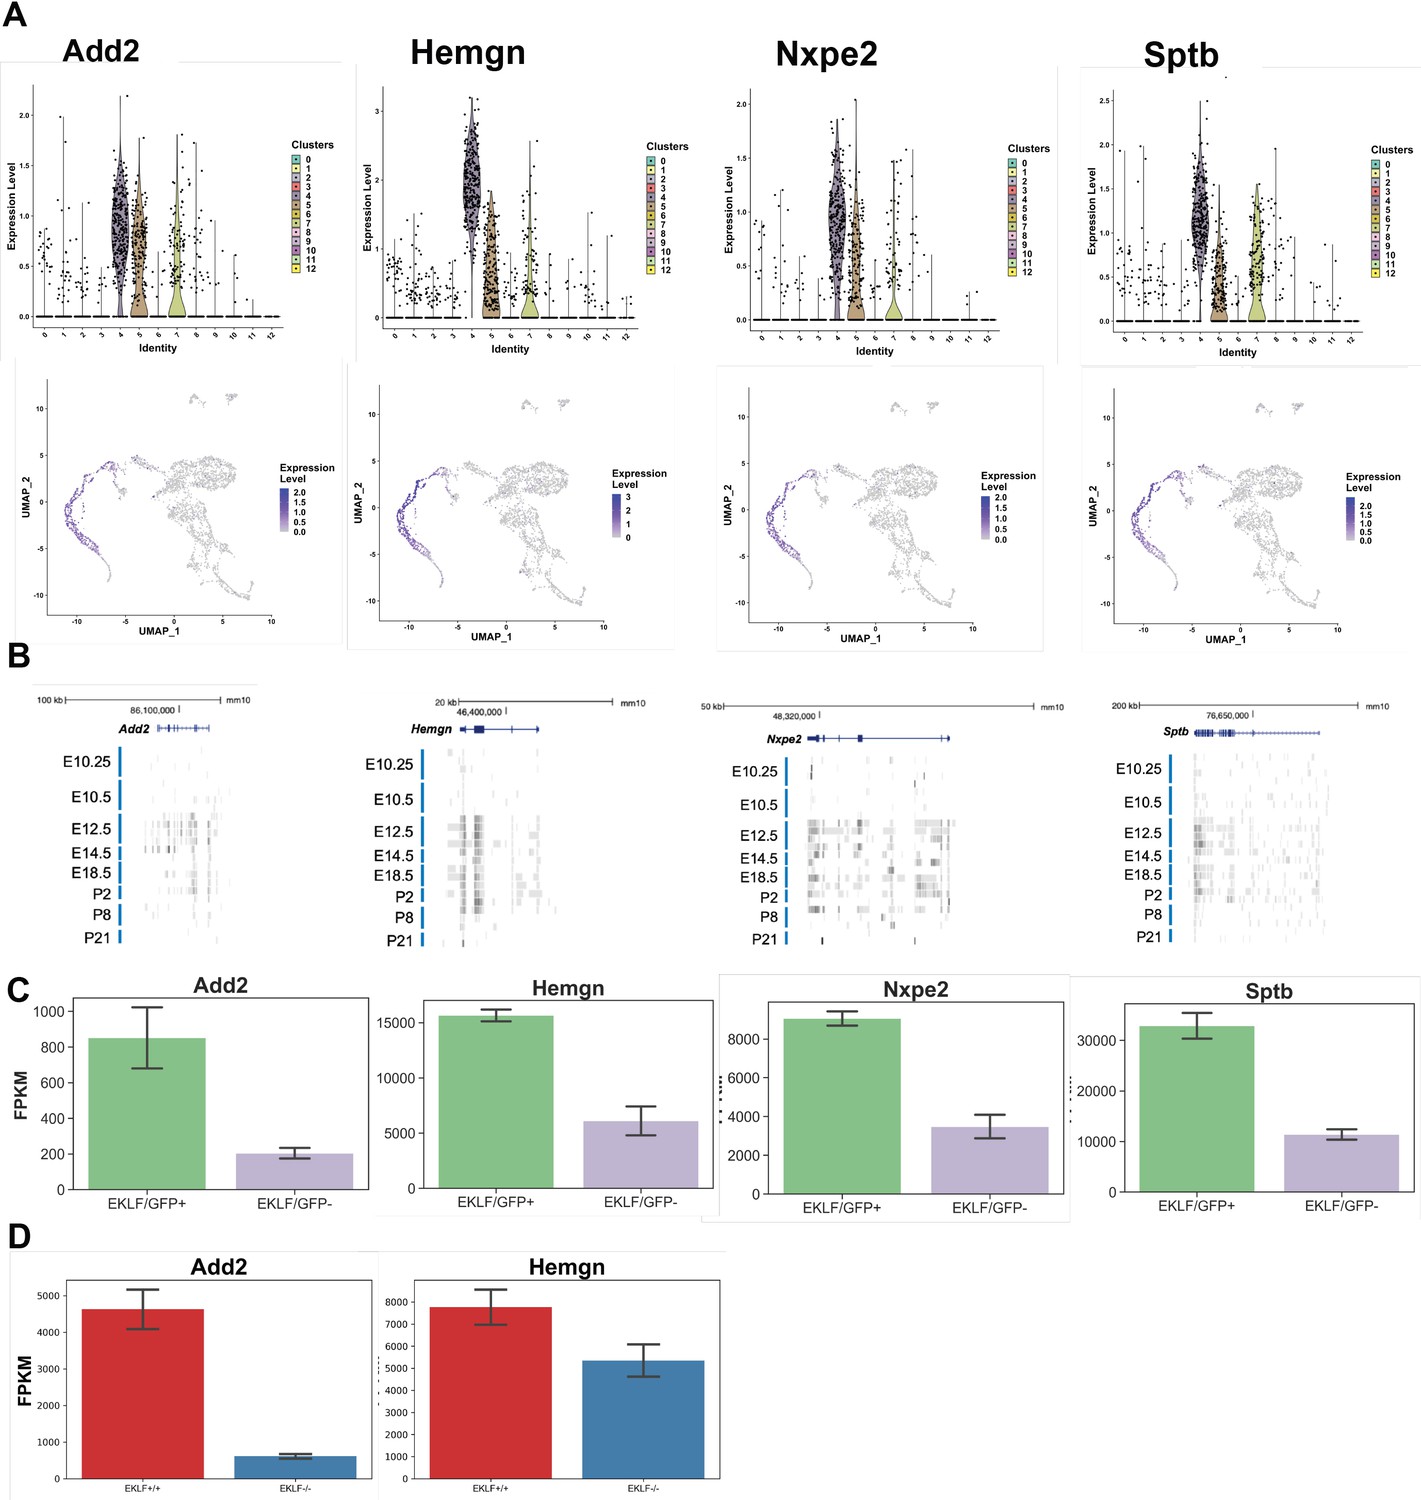
Identification of novel markers for F4/80+/EKLF+ fetal liver macrophages from single-cell sequencing.
Using differential enrichment analysis of EKLF clusters 4, 5, and 7 compared with the rest of the cells, putative markers for F4/80+ EKLF+ cells were identified. (A) Violin and feature plots for the identified markers Add2 (adducinβ), Hemgn (hemogen), Nxpe2 (neurexophilin and PC-esterase domain family, member2), and Sptb (spectrinβ). (B) Data (as in Figure 2C, Mass et al., 2016) showing RNA-Seq reads of F4/80+ EKLF+ cell markers from staged and sorted fetal or postnatal liver macrophages. (C) FPKM expression levels of EKLF markers in F4/80+ EKLF/GFP+ and F4/80+ EKLF/GFP- fetal liver macrophage. (D) FPKM expression levels of EKLF markers Add2 and Hemgn in F4/80+ EKLF+/+ and F4/80+ EKLF-/- fetal liver macrophage.
Figure 9
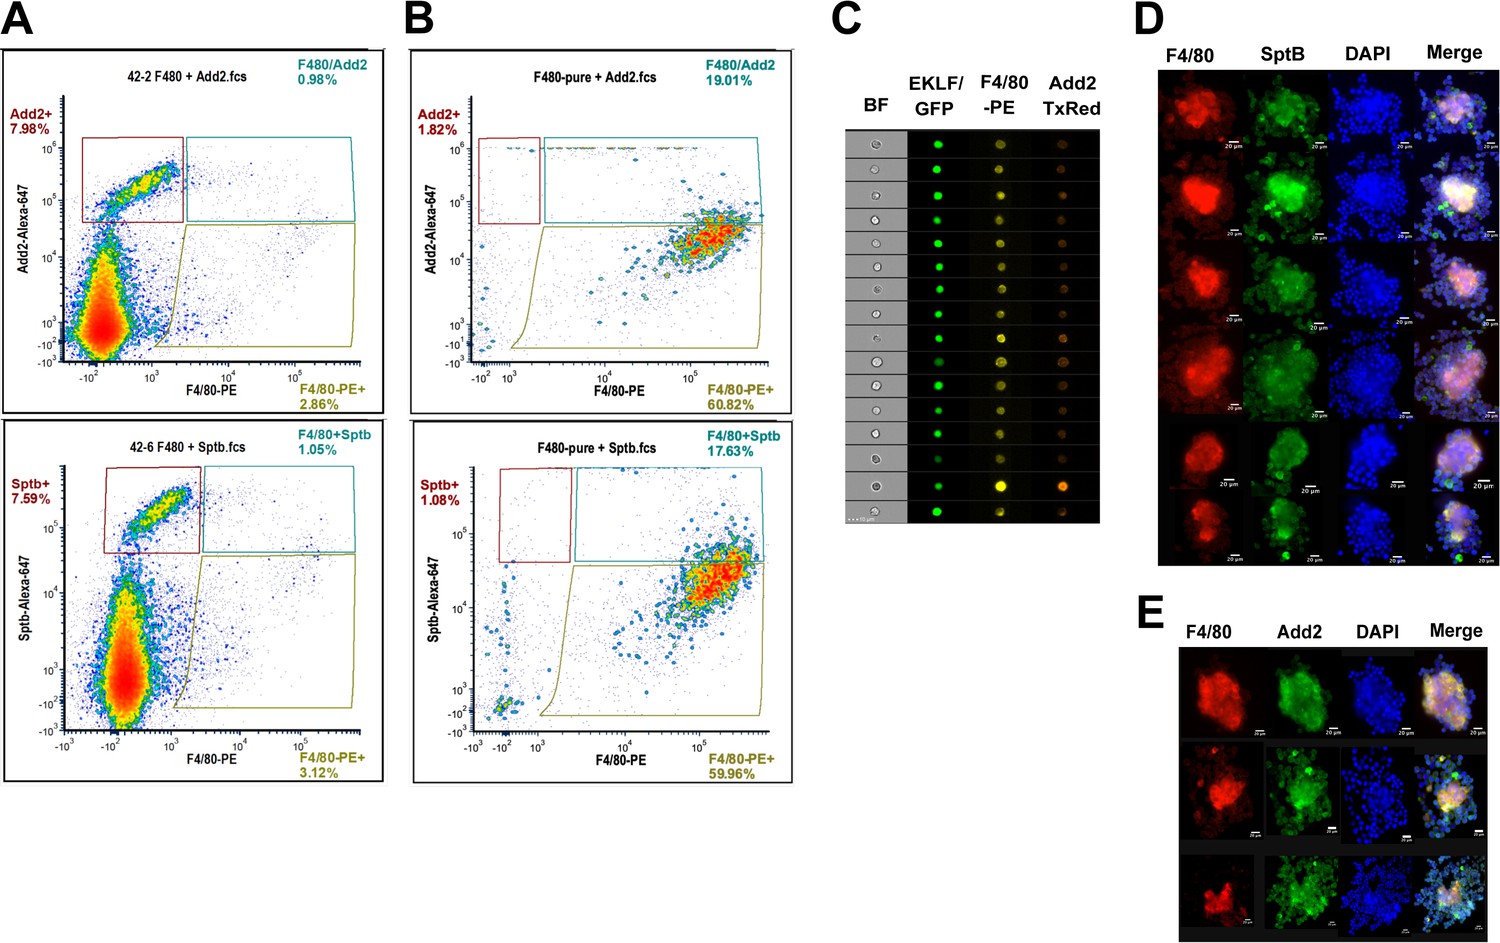
An improved strategy for antibody-based isolation of F4/80+/EKLF+ cells using novel markers identified from single-cell sequencing.
(A) Flow cytometry analysis of E13.5 fetal liver cells stained with anti-F4/80-PE and anti-adducinβ (top) or anti-spectrinβ (below) antibodies conjugated to AlexaFluor 647. Gates are drawn based on unstained and single-color compensation controls for PE and AlexaFluor 647. Population percentages within each gate are indicated. (B) F4/80+ cells purified from E13.5 fetal livers using magnetic bead selection stained for anti-adducinβ (top) or anti-spectrinβ (below). Gates are the same as (A) and population percentages are indicated. (C) Imaging flow cytometry analysis of E13.5 fetal liver cells from the pEKLF/GFP mouse stained for F4/80-PE and Add2-TxRed. Single cells positive for F4/80, Add2, and GFP are shown. (D, E) Isolated erythroblast islands stained for DAPI, F4/80-PE, and (D) Sptb-Alexa647 or (E) Add2-Alexa647 and examined by fluorescent microscopy. Scale bars are indicated.
Tables
Table 1
Summary of significant GO terms for the subset of genes significantly downregulated in EKLF-/- vs WT.
| Term_ID | Description | Frequency (%) | log10 p-value |
|---|---|---|---|
| GO:0006464 | Cellular protein modification process | 16.80 | −6.8427 |
| GO:0032502 | Developmental process | 27.72 | −6.6535 |
| GO:0051179 | Localization | 26.83 | −5.5895 |
| GO:0030097 | Hemopoiesis | 3.96 | −5.5005 |
| GO:0048518 | Positive regulation of biological process | 24.84 | −4.1355 |
| GO:0044699 | Single-organism process | 65.98 | −3.6956 |
| GO:0022610 | Biological adhesion | 6.66 | −3.5792 |
| GO:0016043 | Cellular component organization | 27.23 | −3.3699 |
| GO:0008152 | Metabolic process | 51.22 | −3.3045 |
| GO:0071840 | Cellular component organization or biogenesis | 27.98 | −3.2058 |
| GO:0065007 | Biological regulation | 57.48 | −3.1341 |
| GO:0065008 | Regulation of biological quality | 15.62 | −2.4455 |
| GO:0044763 | Single-organism cellular process | 47.39 | −2.4259 |
| GO:0007169 | Transmembrane receptor protein tyrosine kinase signaling pathway | 2.62 | −2.028 |
| GO:0009791 | Post-embryonic development | 0.60 | −1.8994 |
| GO:0098609 | Cell–cell adhesion | 4.30 | −1.7231 |
| GO:0008219 | Cell death | 8.78 | −1.5167 |
| GO:0002376 | Immune system process | 11.16 | −1.4235 |
| GO:0009987 | Cellular process | 75.10 | −1.408 |
Table 2
Summary of GO terms for genes significantly enriched in EKLF/GFP+ F4/80+ fetal liver macrophages.
| Term_ID | Description | Frequency (%) | log10 p-valueue | Uniqueness |
|---|---|---|---|---|
| GO:0006778 | Porphyrin-containing compound metabolic process | 0.18 | −12.8484 | 0.777 |
| GO:0051186 | Cofactor metabolic process | 1.60 | −12.2111 | 0.915 |
| GO:0033013 | Tetrapyrrole metabolic process | 0.20 | −11.1538 | 0.869 |
| GO:0051179 | Localization | 26.83 | −8.8728 | 0.994 |
| GO:0034101 | Erythrocyte homeostasis | 0.58 | −8.3027 | 0.786 |
| GO:0006810 | Transport | 20.74 | −8.0986 | 0.952 |
| GO:0051234 | Establishment of localization | 21.48 | −7.6831 | 0.957 |
| GO:0065008 | Regulation of biological quality | 15.62 | −6.8115 | 0.959 |
| GO:0055085 | Transmembrane transport | 5.98 | −6.4975 | 0.945 |
| GO:0042592 | Homeostatic process | 7.64 | −6.1826 | 0.886 |
| GO:0061515 | Myeloid cell development | 0.32 | −5.6997 | 0.83 |
| GO:0048731 | System development | 21.00 | −5.4423 | 0.93 |
| GO:1901564 | Organonitrogen compound metabolic process | 9.12 | −5.1438 | 0.923 |
| GO:0042744 | Hydrogen peroxide catabolic process | 0.07 | −5.0001 | 0.868 |
| GO:0006811 | Ion transport | 7.05 | −4.9442 | 0.946 |
| GO:0048513 | Animal organ development | 15.85 | −4.7331 | 0.926 |
| GO:0008152 | Metabolic process | 51.22 | −4.3756 | 0.997 |
| GO:0044237 | Cellular metabolic process | 45.64 | −4.3162 | 0.937 |
| GO:0055076 | Transition metal ion homeostasis | 0.58 | −4.2923 | 0.831 |
| GO:0007275 | Multicellular organism development | 23.55 | −4.161 | 0.933 |
| GO:0032502 | Developmental process | 27.72 | −4.1078 | 0.994 |
| GO:0048872 | Homeostasis of number of cells | 1.37 | −4.0386 | 0.845 |
| GO:0008643 | Carbohydrate transport | 0.71 | −3.9826 | 0.911 |
| GO:0048878 | Chemical homeostasis | 4.85 | −3.8372 | 0.85 |
| GO:0006796 | Phosphate-containing compound metabolic process | 13.70 | −3.7212 | 0.925 |
| GO:0006793 | Phosphorus metabolic process | 14.00 | −3.5364 | 0.925 |
| GO:0055072 | Iron ion homeostasis | 0.38 | −3.5032 | 0.829 |
| GO:0030099 | Myeloid cell differentiation | 1.70 | −3.3938 | 0.848 |
| GO:0042440 | Pigment metabolic process | 0.30 | −3.2046 | 0.893 |
| GO:0050801 | Ion homeostasis | 3.30 | −3.1372 | 0.843 |
| GO:0048856 | Anatomical structure development | 25.70 | −2.9598 | 0.947 |
| GO:0006820 | Anion transport | 2.43 | −2.8403 | 0.941 |
| GO:0017001 | Antibiotic catabolic process | 0.52 | −2.6912 | 0.876 |
| GO:0098771 | Inorganic ion homeostasis | 3.02 | −2.6573 | 0.839 |
| GO:0019755 | One-carbon compound transport | 0.06 | −2.4416 | 0.9 |
| GO:0019725 | Cellular homeostasis | 3.80 | −2.1148 | 0.81 |
| GO:0071704 | Organic substance metabolic process | 49.01 | −2.0066 | 0.945 |
Table 3
Summary of GO terms for genes significantly enriched in EKLF/GFP- F4/80+ fetal liver macrophages.
| Term_ID | Description | Frequency (%) | log10 p-valueue | Uniqueness |
|---|---|---|---|---|
| GO:0002376 | Immune system process | 11.16 | −90.8785 | 0.492 |
| GO:0001775 | Cell activation | 4.73 | −58.5949 | 0.502 |
| GO:0045321 | Leukocyte activation | 4.17 | −57.3276 | 0.435 |
| GO:0001816 | Cytokine production | 2.93 | −56.1898 | 0.522 |
| GO:0040011 | Locomotion | 7.21 | −51.1415 | 0.515 |
| GO:0001817 | Regulation of cytokine production | 2.62 | −48.8035 | 0.477 |
| GO:0006928 | Movement of cell or subcellular component | 7.93 | −47.6096 | 0.474 |
| GO:0006954 | Inflammatory response | 2.89 | −45.4918 | 0.524 |
| GO:0022610 | Biological adhesion | 6.66 | −45.4019 | 0.519 |
| GO:0030334 | Regulation of cell migration | 3.21 | −37.8661 | 0.468 |
| GO:0051707 | Response to other organism | 4.45 | −34.3509 | 0.498 |
| GO:0009607 | Response to biotic stimulus | 4.67 | −34.2713 | 0.514 |
| GO:0030155 | Regulation of cell adhesion | 2.92 | −34.1483 | 0.502 |
| GO:0022603 | Regulation of anatomical structure morphogenesis | 4.20 | −33.7719 | 0.47 |
| GO:0008283 | Cell proliferation | 8.83 | −29.2539 | 0.482 |
| GO:0030036 | Actin cytoskeleton organization | 2.80 | −28.0214 | 0.516 |
| GO:0030029 | Actin filament-based process | 3.14 | −27.3893 | 0.523 |
| GO:0035295 | Tube development | 3.20 | −25.1916 | 0.507 |
| GO:0008219 | Cell death | 8.78 | −24.5897 | 0.468 |
| GO:0070661 | Leukocyte proliferation | 1.41 | −23.5623 | 0.563 |
| GO:0072358 | Cardiovascular system development | 3.13 | −23.0994 | 0.498 |
| GO:0006793 | Phosphorus metabolic process | 14.00 | −22.2385 | 0.449 |
| GO:0044093 | Positive regulation of molecular function | 7.70 | −22.1855 | 0.47 |
| GO:0006897 | Endocytosis | 3.19 | −19.725 | 0.532 |
| GO:0098657 | Import into cell | 0.29 | −19.1913 | 0.625 |
| GO:0050764 | Regulation of phagocytosis | 0.36 | −18.9505 | 0.578 |
| GO:1902533 | Positive regulation of intracellular signal transduction | 4.07 | −18.4109 | 0.439 |
| GO:0051704 | Multiorganism process | 6.53 | −17.9065 | 0.52 |
| GO:0034097 | Response to cytokine | 3.34 | −17.0337 | 0.525 |
| GO:0032940 | secretion by cell | 4.11 | −16.2249 | 0.486 |
| GO:0002699 | Positive regulation of immune effector process | 0.86 | −14.2444 | 0.51 |
| GO:0007167 | Enzyme-linked receptor protein signaling pathway | 4.02 | −14.1906 | 0.48 |
| GO:0001774 | Microglial cell activation | 0.07 | −12.1713 | 0.623 |
| GO:0010942 | Positive regulation of cell death | 2.72 | −11.1617 | 0.486 |
| GO:0097435 | Supramolecular fiber organization | 2.73 | −11.1108 | 0.525 |
| GO:0042592 | Homeostatic process | 7.64 | −10.9553 | 0.477 |
| GO:0035456 | Response to interferon-beta | 0.22 | −10.2302 | 0.627 |
| GO:0008360 | Regulation of cell shape | 0.65 | −10.1463 | 0.547 |
| GO:0042107 | Cytokine metabolic process | 0.55 | −9.76 | 0.605 |
| GO:0050777 | Negative regulation of immune response | 0.61 | −9.7184 | 0.523 |
| GO:0002444 | Myeloid leukocyte-mediated immunity | 0.38 | −9.7099 | 0.588 |
| GO:0090130 | Tissue migration | 1.14 | −9.6676 | 0.563 |
| GO:0051129 | Negative regulation of cellular component organization | 2.94 | −9.0279 | 0.504 |
Key resources table
| Reagent type (species) or resource | Designation | Source or reference | Identifiers | Additional information |
|---|---|---|---|---|
| Genetic reagent (Mus musculus) | Klf-/- (Klf1tm1Sho) | 10.1038/375318a0 | MGI:1857162 | EKLF-null mouse in 129S4/SvJae background |
| Genetic reagent (Mus musculus) | pEKLF/GFP | 10.1242/dev.018200 | Peklf-GFP | eGFP expressed from the EKLF promoter |
| Antibody | Anti-F4/80-PE (rabbit polyclonal) | eBiosciences | #12-4801-80 | (1:100) |
| Antibody | Anti-Adra2b (rabbit polyclonal) | Alomone Labs | #AAR-021 | (1:100) |
| Antibody | Anti-adducinβ (mouse monoclonal) | Santa Cruz Biotechnologies | # sc-376063 | (1:100) |
| Antibody | Anti-spectrinβ1 (mouse monoclonal) | Santa Cruz Biotechnologies | # sc-374309 | (1:100) |
| Antibody | Donkey anti-rabbit IgG – AlexaFluor 647 (donkey polyclonal) | Invitrogen | # A-31573 | (1:200) |
| Peptide, recombinant protein | FWV peptide (GenScript custom) | 10.1242/dev.103960 | # SC1848 | 2 mM |
| Commercial assay or kit | EasySep mouse PE positive selection kit | Cell Signaling Technologies | # 17656 | |
| Commercial assay or kit | Zip AlexaFluor 647 antibody labeling kit | Invitrogen | # Z11235 | |
| Commercial assay or kit | Lightning link Texas red conjugation kit | Abcam | # ab195225 | |
| Commercial assay or kit | RNA Nanoprep kit | Agilent | #400753 | |
| Commercial assay or kit | Chromium Single Cell 3ʹ Library Kit v3 | 10X Genomics | # PN-1000095 | |
| Chemical compound | TRIzol reagent | Invitrogen | #15596026 | |
| Software, algorithm | STAR | 10.1093/bioinformatics/bts635 | RRID:SCR_015899 | |
| Software, algorithm | Salmon | 10.1038/nmeth.4197 | RRID:SCR_017036 | |
| Software, algorithm | HTSeq | 10.1093/bioinformatics/btu638 | RRID:SCR_005514 | |
| Software, algorithm | tximport | https://github.com/mikelove/tximport | RRID:SCR_016752 | |
| Software, algorithm | DESeq2 | 10.1186/s13059-014-0550-8 | RRID:SCR_015687 | |
| Software, algorithm | Alevin | 10.1186/s13059-019-1670-y | https://salmon.readthedocs.io | |
| Software, algorithm | Seurat | https://doi.org/10.1038/nbt.4096 | http://satijalab.org/seurat/ | |
| Software, algorithm | ggplot2 | https://github.com/tidyverse/ggplot2 | RRID:SCR_014601 | |
| Software, algorithm | Pandas | https://pandas.pydata.org | RRID:SCR_018214 | |
| Software, algorithm | Scikit-learn | http://scikit-learn.org/ | RRID:SCR_002577 | |
| Software, algorithm | Python Seaborn | https://seaborn.pydata.org/ | RRID:SCR_018132 | |
| Software, algorithm | Java Treeview | 10.1093/bioinformatics/bth349 | RRID:SCR_016916 | |
| Software, algorithm | Cluster 3.0 | 10.1093/bioinformatics/bth078 | RRID:SCR_013505 | |
| Software, algorithm | REViGO | http://revigo.irb.hr/ | RRID:SCR_005825 | |
| Software, algorithm | Generic GO Term Finder | 10.1093/bioinformatics/bth456 | RRID:SCR_008870 | |
| Software, algorithm | MEME-suite | http://meme-suite.org/ | RRID:SCR_001783 | |
| Software, algorithm | FCS Express 7 | https://www.denovosoftware.com | RRID:SCR_016431 |
Additional files
-
Supplementary file 1
Revigo analysis of the functions of fetal liver F4/80+ signature genes.
- https://cdn.elifesciences.org/articles/61070/elife-61070-supp1-v2.xlsx
-
Supplementary file 2
DESeq2 results of significantly downregulated genes in EKLF-/- cells.
- https://cdn.elifesciences.org/articles/61070/elife-61070-supp2-v2.xlsx
-
Supplementary file 3
DESeq2 results of significantly enriched genes in EKLF/GFP+ cells.
- https://cdn.elifesciences.org/articles/61070/elife-61070-supp3-v2.xlsx
-
Supplementary file 4
Complete results of Centrimo analysis of the promoters of EKLF-dependent genes in F4/80+ macrophages.
- https://cdn.elifesciences.org/articles/61070/elife-61070-supp4-v2.xlsx
-
Supplementary file 5
GO analysis of the top 100 differentially enriched genes in clusters 0, 1, 2, and 3 of the single-cell sequencing data.
- https://cdn.elifesciences.org/articles/61070/elife-61070-supp5-v2.xlsx
-
Supplementary file 6
GO analysis of the top 100 differentially enriched genes in clusters 4, 5, 7, and 8 of the single-cell sequencing data.
- https://cdn.elifesciences.org/articles/61070/elife-61070-supp6-v2.xlsx
-
Transparent reporting form
- https://cdn.elifesciences.org/articles/61070/elife-61070-transrepform-v2.docx
Download links
A two-part list of links to download the article, or parts of the article, in various formats.
Downloads (link to download the article as PDF)
Open citations (links to open the citations from this article in various online reference manager services)
Cite this article (links to download the citations from this article in formats compatible with various reference manager tools)
EKLF/KLF1 expression defines a unique macrophage subset during mouse erythropoiesis
eLife 10:e61070.
https://doi.org/10.7554/eLife.61070


