Ecological adaptation in Atlantic herring is associated with large shifts in allele frequencies at hundreds of loci
- Department of Medical Biochemistry and Microbiology, Uppsala University, Sweden
- Department of Veterinary Integrative Biosciences, Texas A&M University, United States
- National Institute of Aquatic Resources, Technical University of Denmark, Denmark
- Department of Biological Sciences, University of Bergen, Norway
- Institute of Marine Research, Norway
- Department of Aquatic Resources, Institute of Marine Research, Swedish University of Agricultural Sciences, Sweden
- Department of Biological, Geological and Environmental Sciences, University of Bologna, Italy
- School of Biology and Environmental Science, Science Centre West, University College Dublin, Ireland
- Department of Animal Breeding and Genetics, Swedish University of Agricultural Sciences, Sweden
Figures
Figure 1 with 1 supplement

Geographic distribution of sampled pools of Atlantic herring.
Color code of each population refers to the spawning season that a given pool was sampled.
Figure 1—figure supplement 1
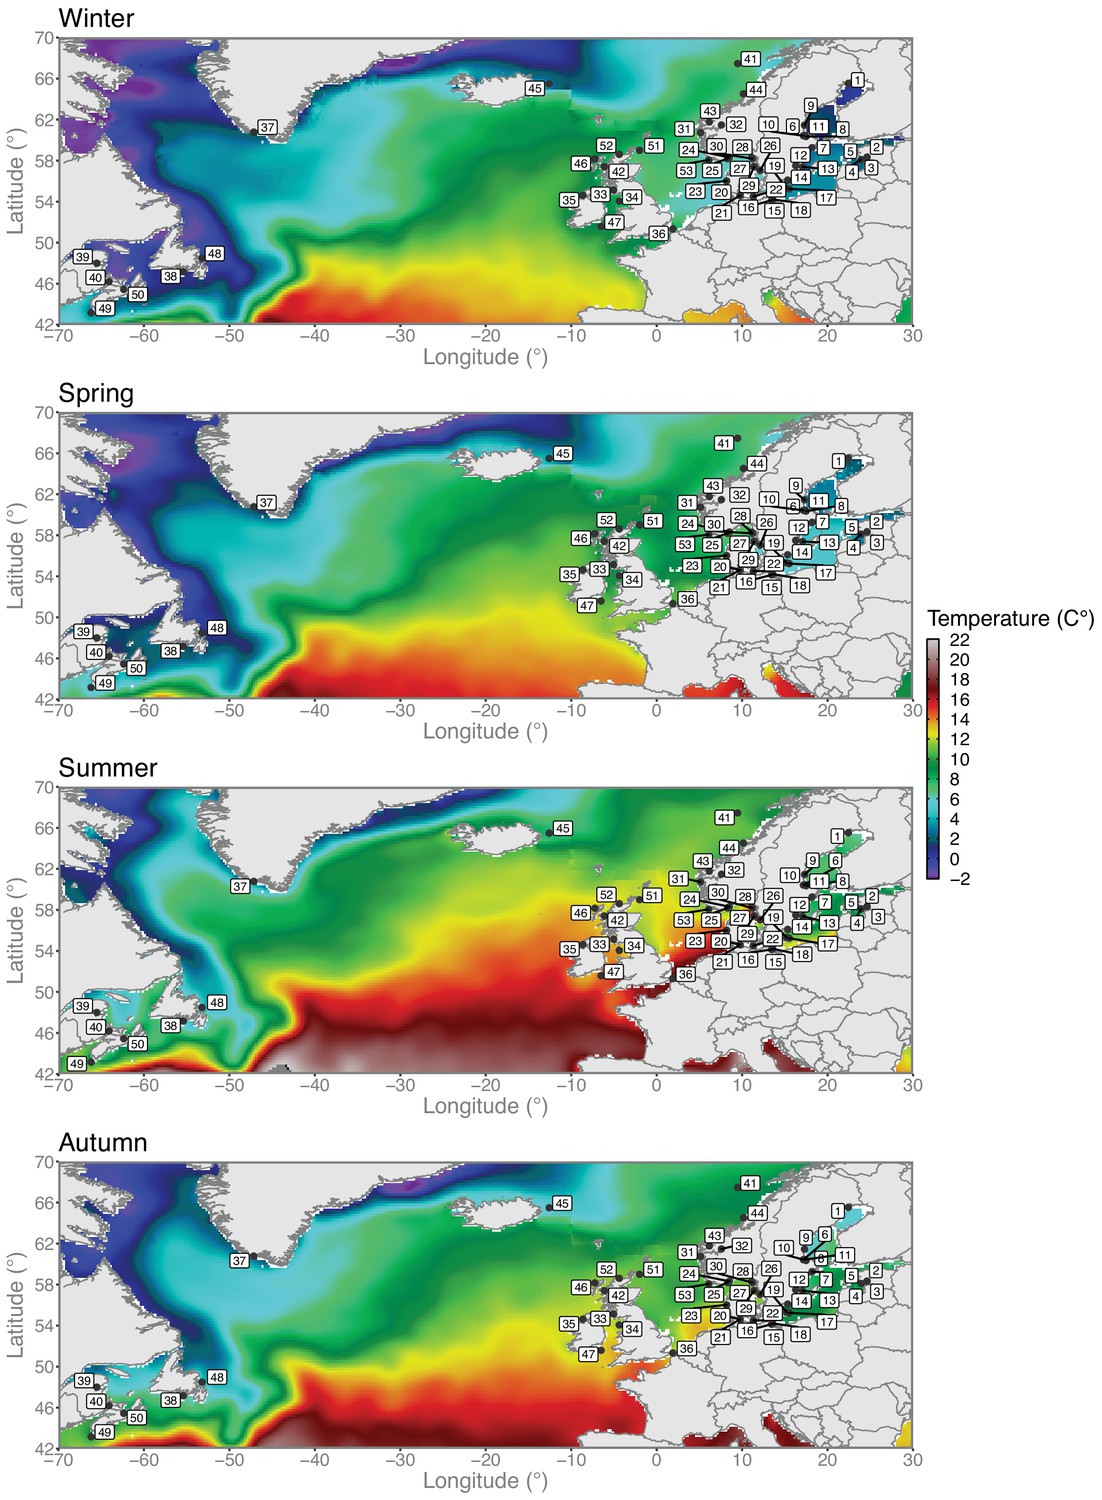
Variation in sea water temperatures among seasons.
Seasonal sea water temperature profiles across the North Atlantic and the Baltic Sea. Herring sampling locations are overlaid on top of the temperature data. Climatic data layers at a 0.25° spatial resolution were retrieved from the World Ocean Atlas 2018 (WOA18) (https://www.nodc.noaa.gov/cgi-bin/OC5/woa18/woa18.pl?parameter=t) oceanographic database created and maintained by the National Oceanic and Atmospheric Administration (NOAA). Data layers correspond to average temperature values from 2005 to 2017 aggregated in four seasons as follows: winter (January to March), spring (April to June), summer (July to September), and autumn (October to December). Map plotting was performed using the R package (https://www.r-project.org). Colors represent degree Celsius.
Figure 2 with 3 supplements

Principal component analysis (PCA) of herring populations.
(a) PCA based on 169,934 genetically undifferentiated markers. (b) PCA based on 794 markers that are likely under natural selection. Color of each population represents spawning season, as coded in Figure 1. Inset bar plot indicates the percentage of explained variance by each principal component. n = number of SNPs used in the analysis.
Figure 2—figure supplement 1
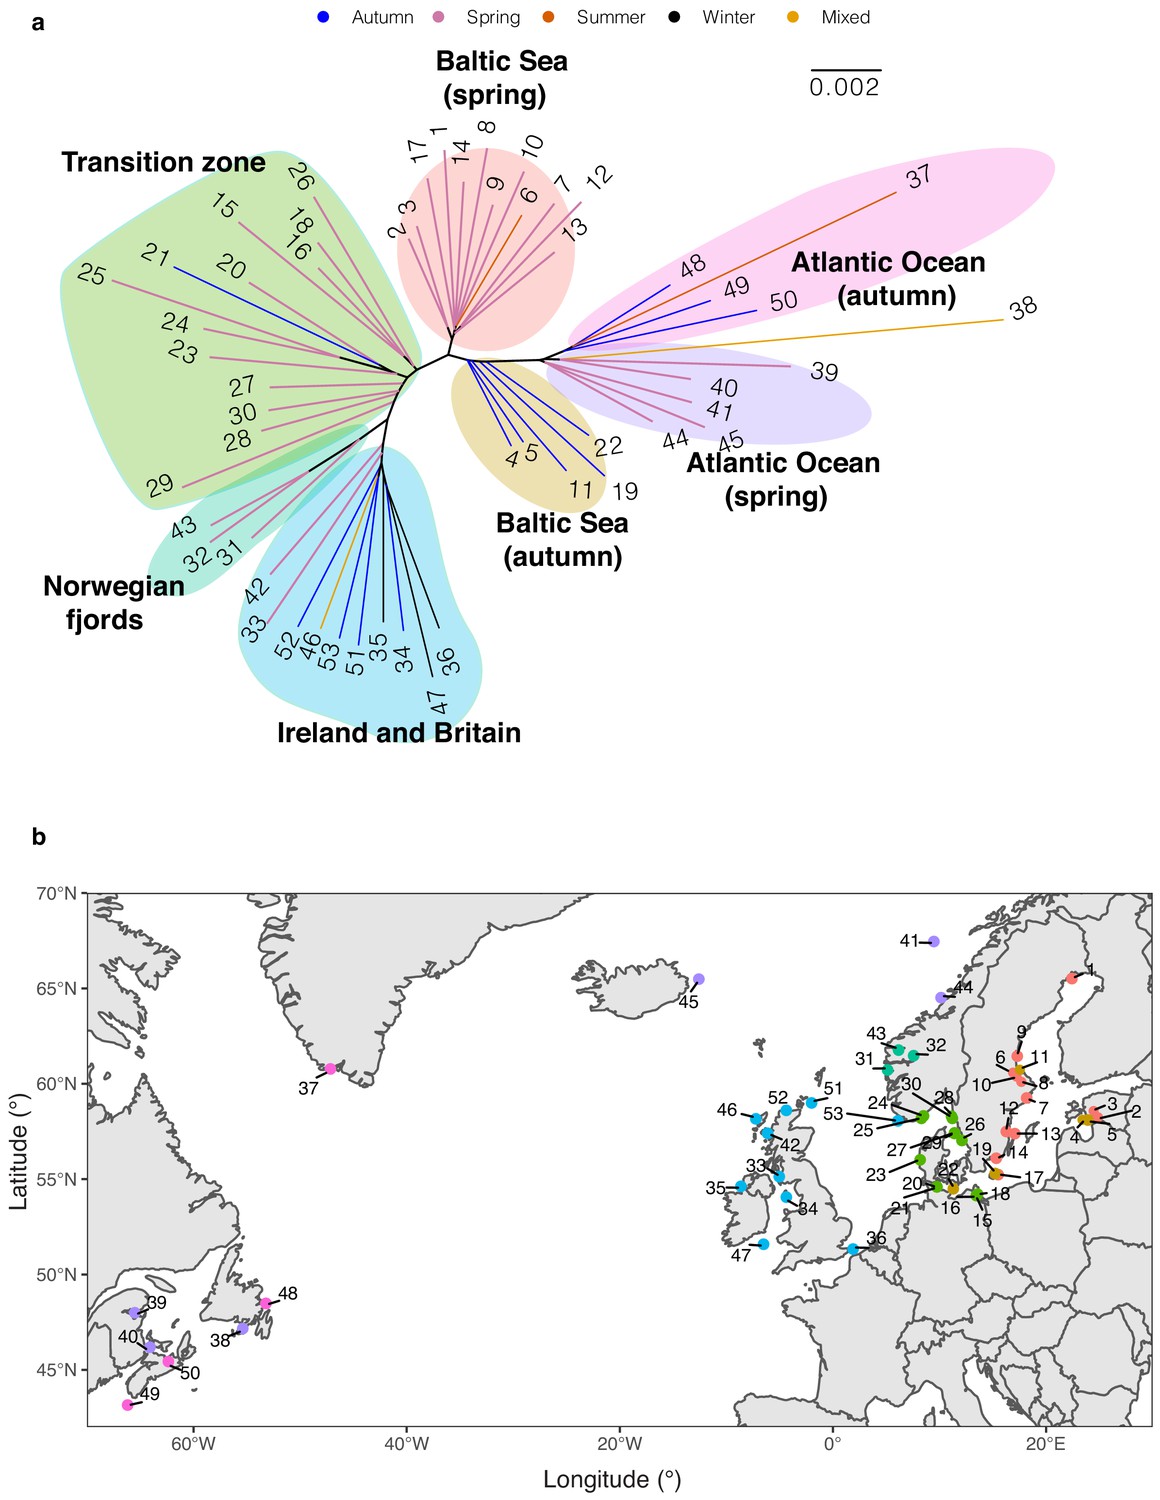
Phylogenetic reconstruction.
(a) Neighbor-joining tree of 53 Atlantic herring populations based on allele frequency of genome-wide SNPs. (b) Geographical distribution of populations in relation to phylogenetic clustering. Color code of each population refers to the cluster grouped in NJ tree.
Figure 2—figure supplement 2
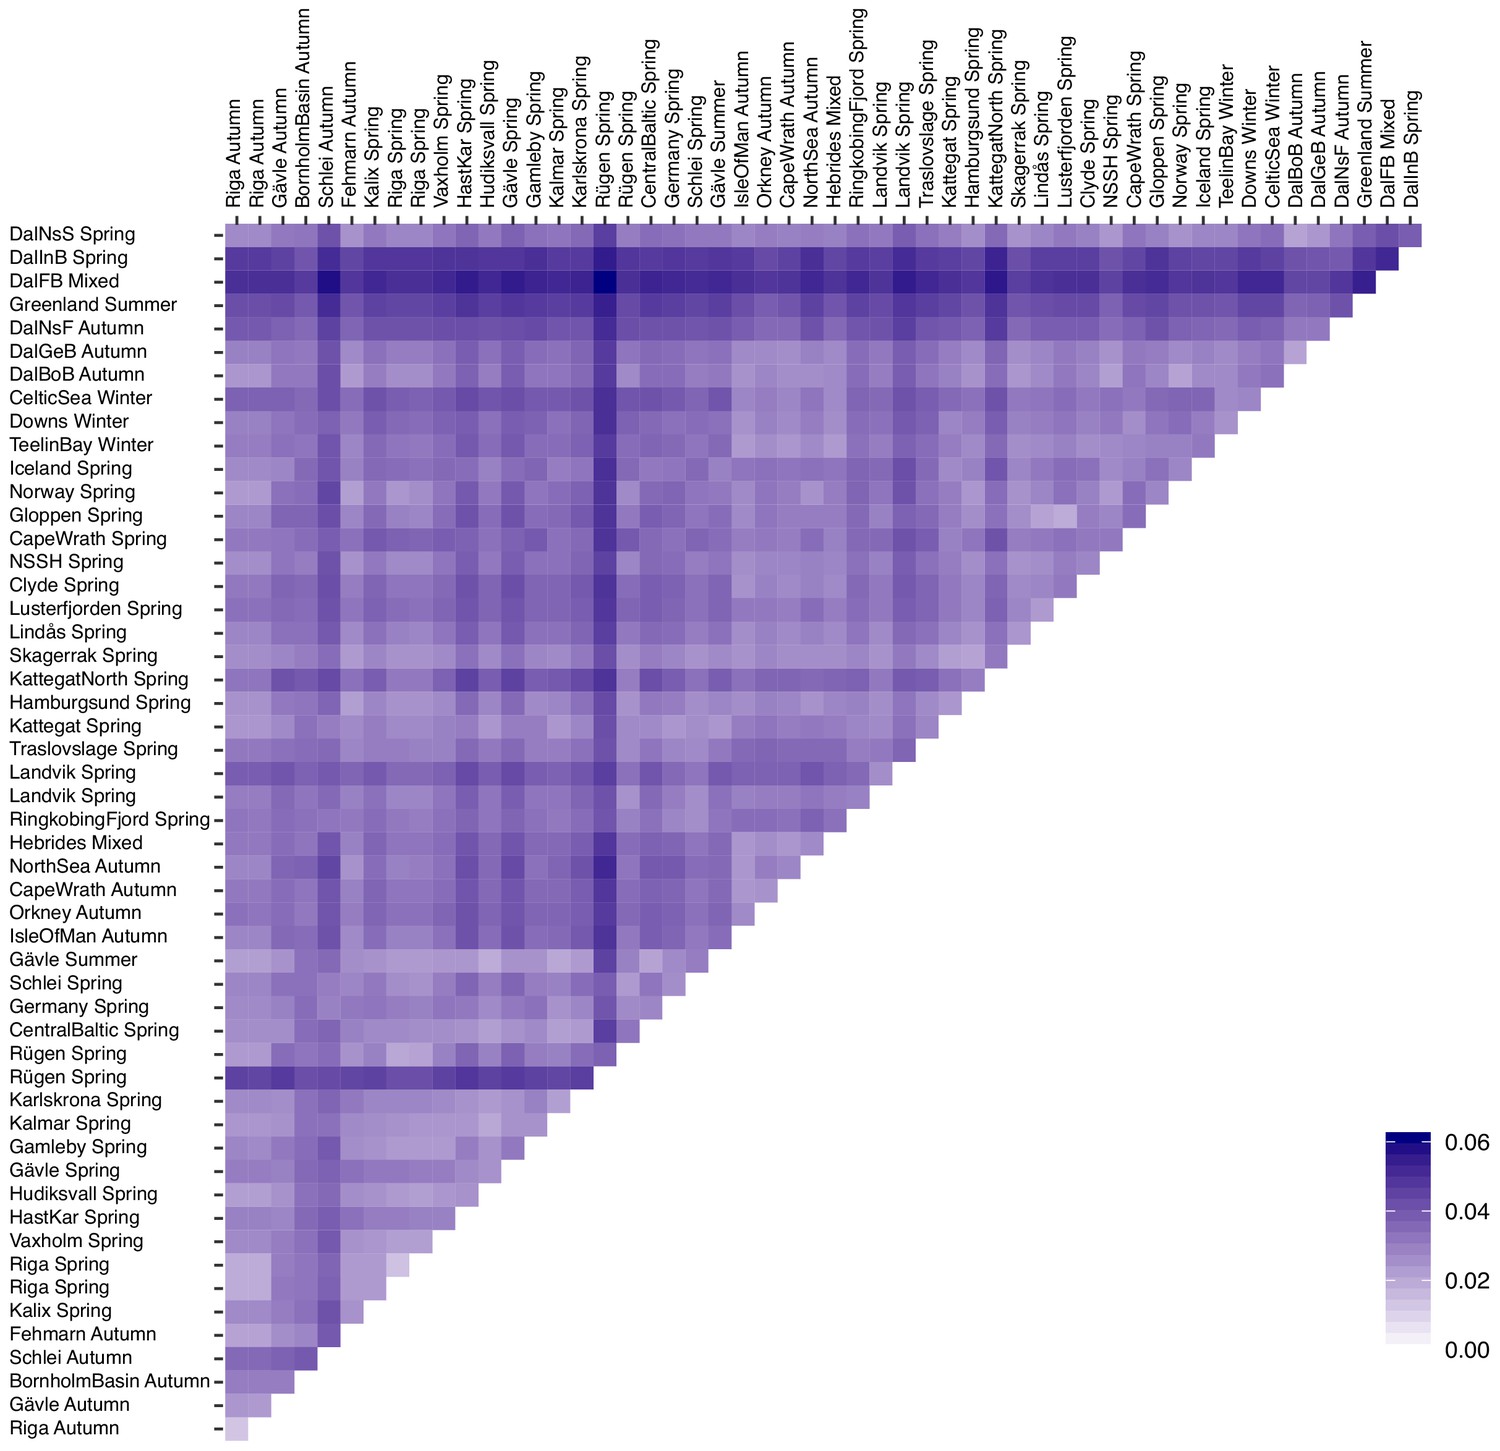
Pairwise FST among 53 populations of Atlantic herring.
Figure 2—figure supplement 3
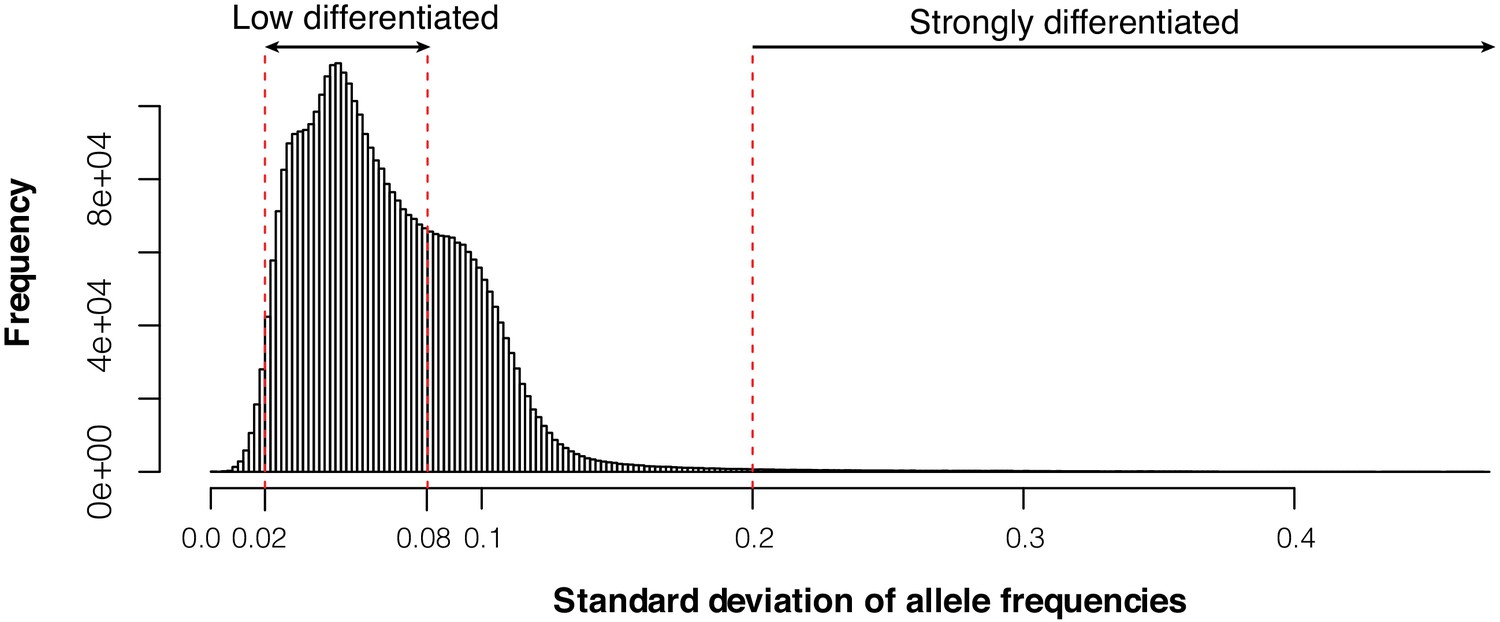
Histogram of genome-wide standard deviation of allele frequencies across 52 Atlantic and Baltic populations.
We selected 22,195 undifferentiated markers and 794 markers that are likely under natural selection based on the cutoffs (SD <0.02 and SD >0.2).
Figure 3 with 4 supplements
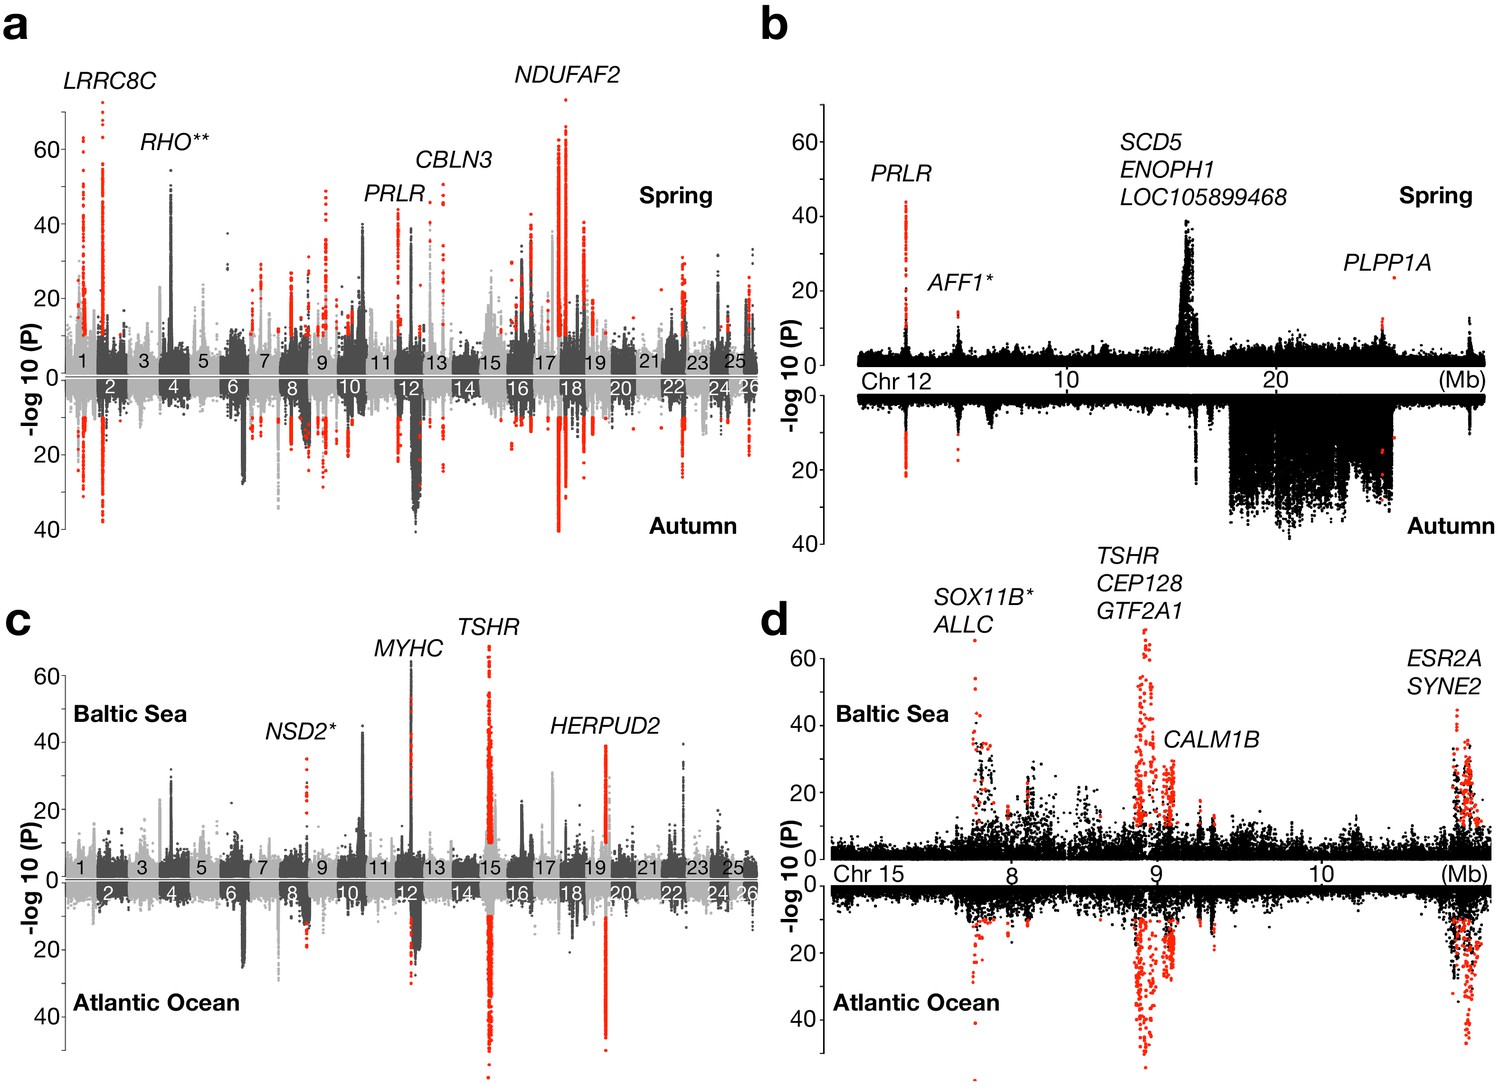
Genetic signals associated with ecological adaptation.
(a) Genetic differentiation between superpools of Baltic and Atlantic herring in spring- spawners (above) and in autumn-spawners (below) and (b) a zoomed-in profile for Chr12. (c) Genetic differentiation between super-pools of spring and autumn herring in Baltic (above) and in Atlantic herring (below) and (d) a zoomed-in profile on Chr15. Red dots indicate signals shared between the two contrasts. *Peak is located in intergenic region; the closest gene is labeled. **An identified locus associated with adaptation to the red-shifted light environment in the Baltic Sea.
Figure 3—figure supplement 1
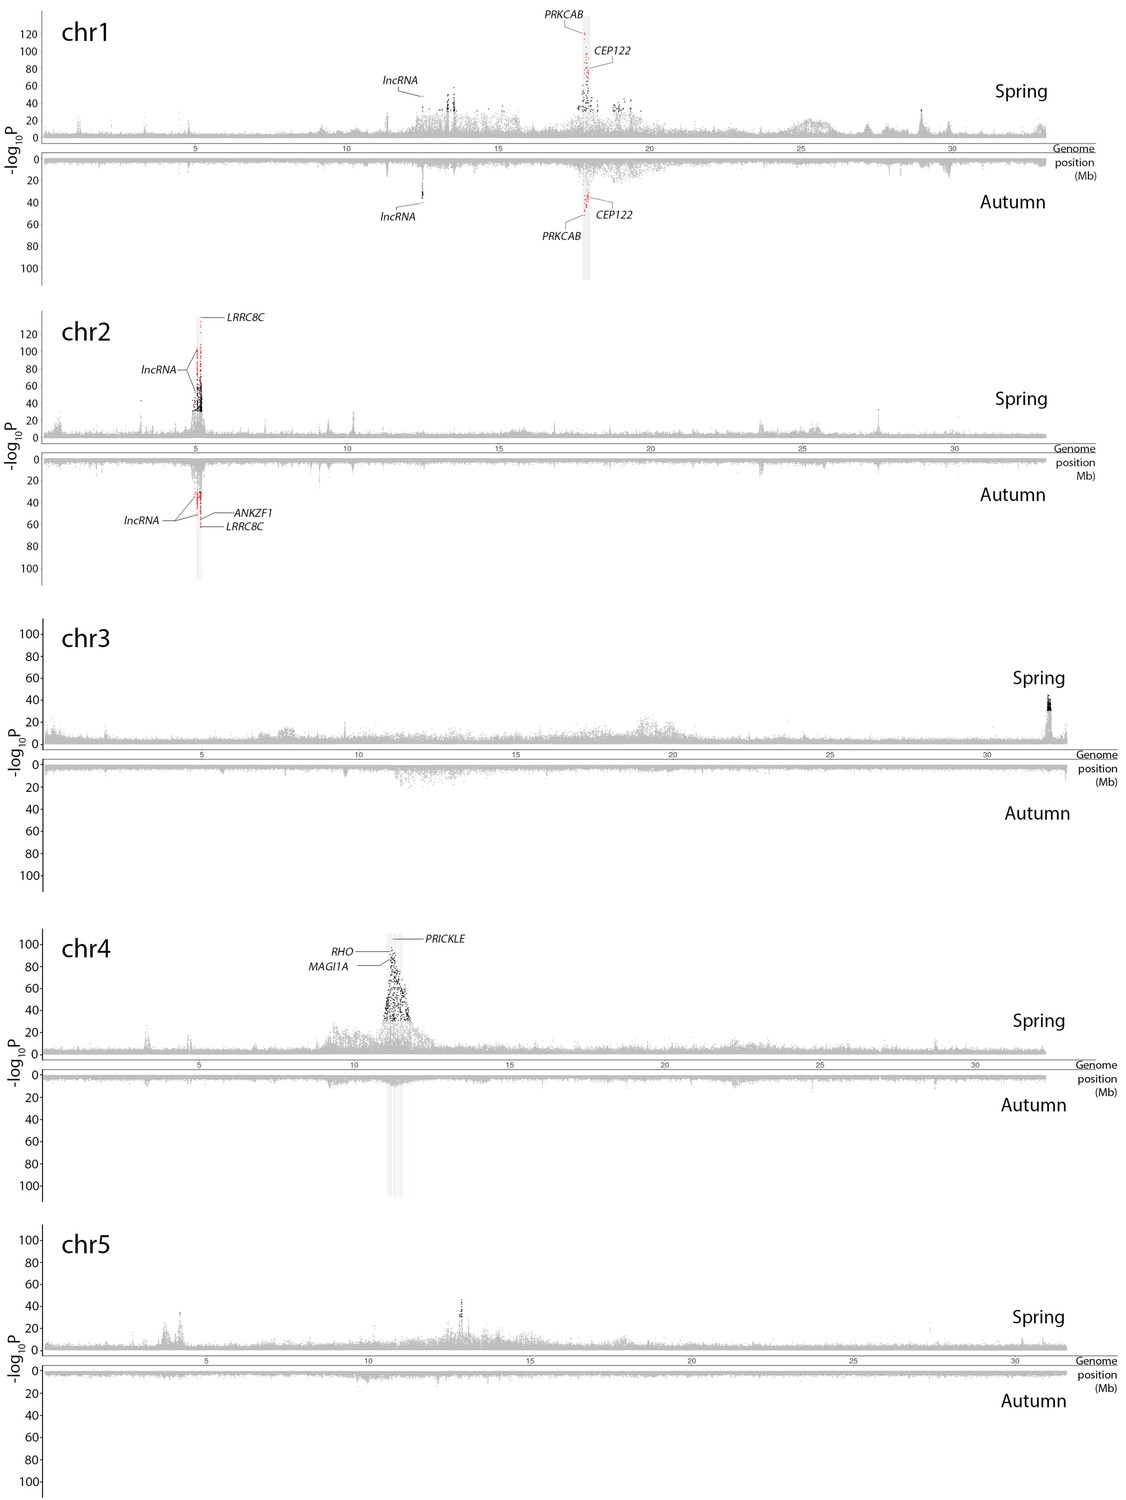
Genetic differentiation between superpools of Atlantic and Baltic herring in spring-spawners (above the x-axis) and autumn-spawners (below the x-axis).
Results for individual chromosomes. SNPs with raw p>10−30 in both spring and autumn-spawners are colored in grey. SNPs with raw raw p<10−30 in both spring and autumn-spawners are colored in red while SNPs with raw p<10−30 in only spring or autumn-spawners are colored in black. In each significant peak, we only labeled genes which are associated with SNPs with raw p-values fulfilling the criteria of (-log10P) > [Max(-log10P) - 20]. The light-grey bar on the background show the position of associated genes. Adjusted p-values are given in Supplementary file 4.
Figure 3—figure supplement 2
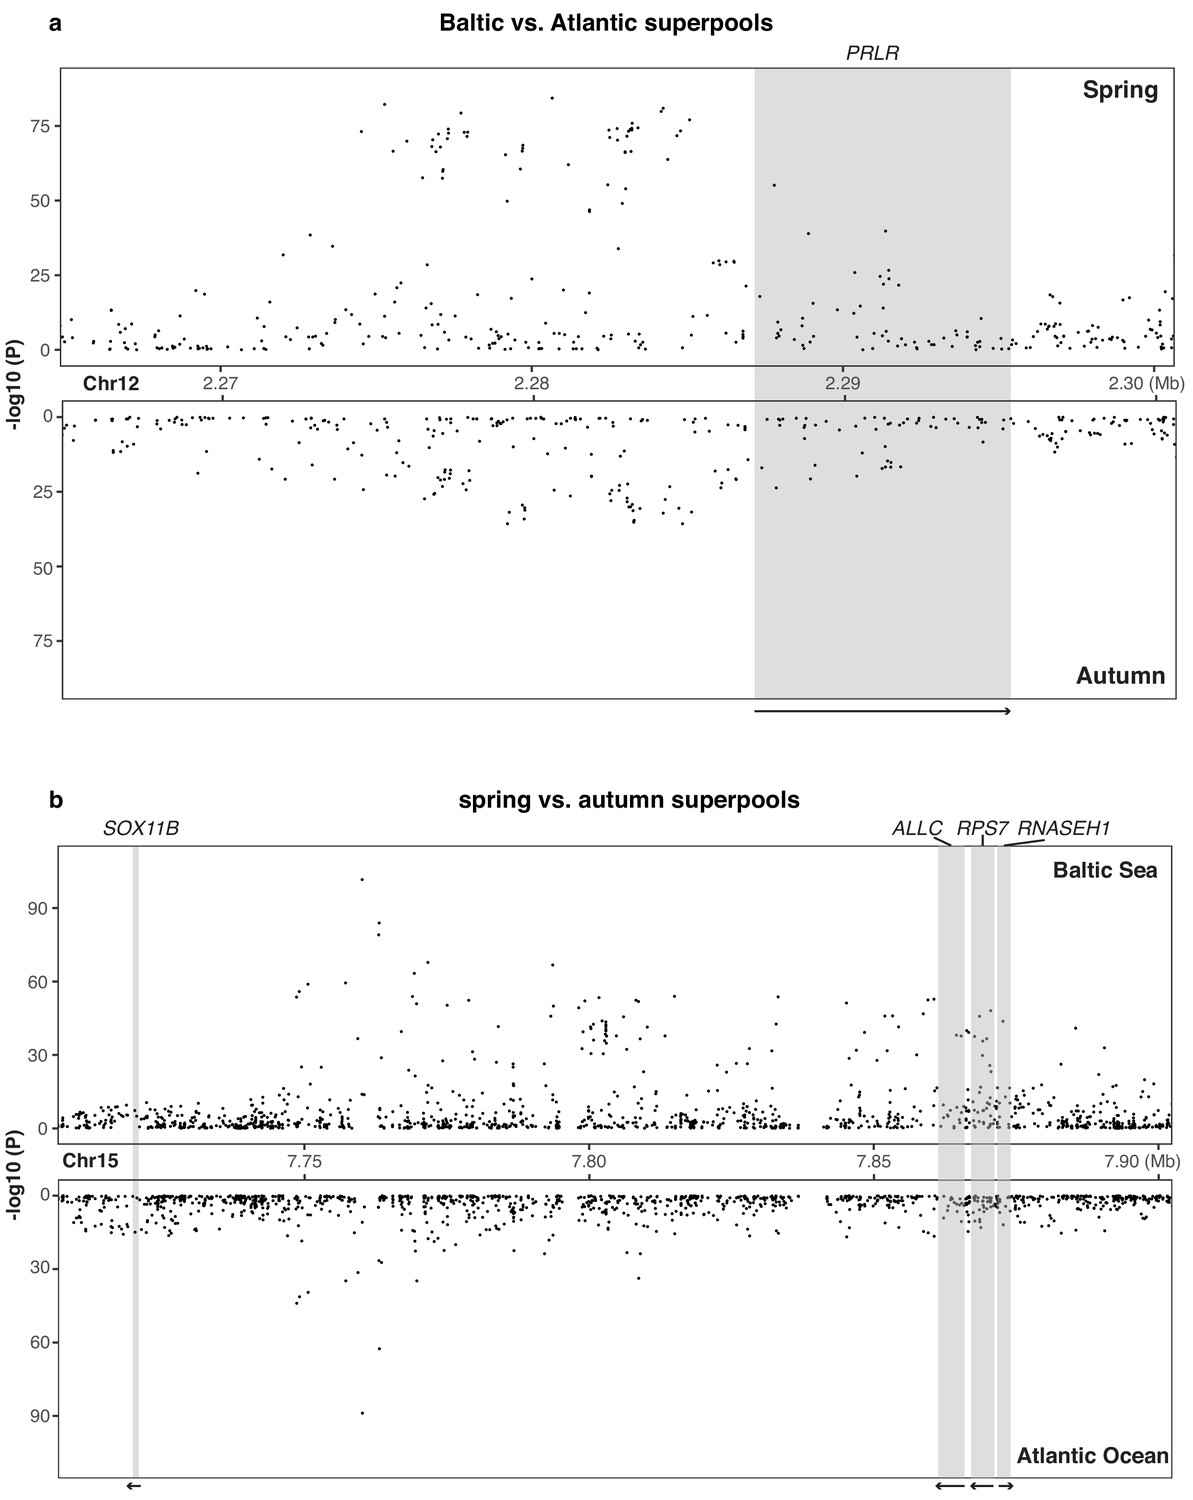
Genetic differentiation around (a) PRLR gene and (b) SOX11B gene in each contrast.
Raw p-values are presented here and adjusted p-values are given in Supplementary files 4 an5, respectively.
Figure 3—figure supplement 3
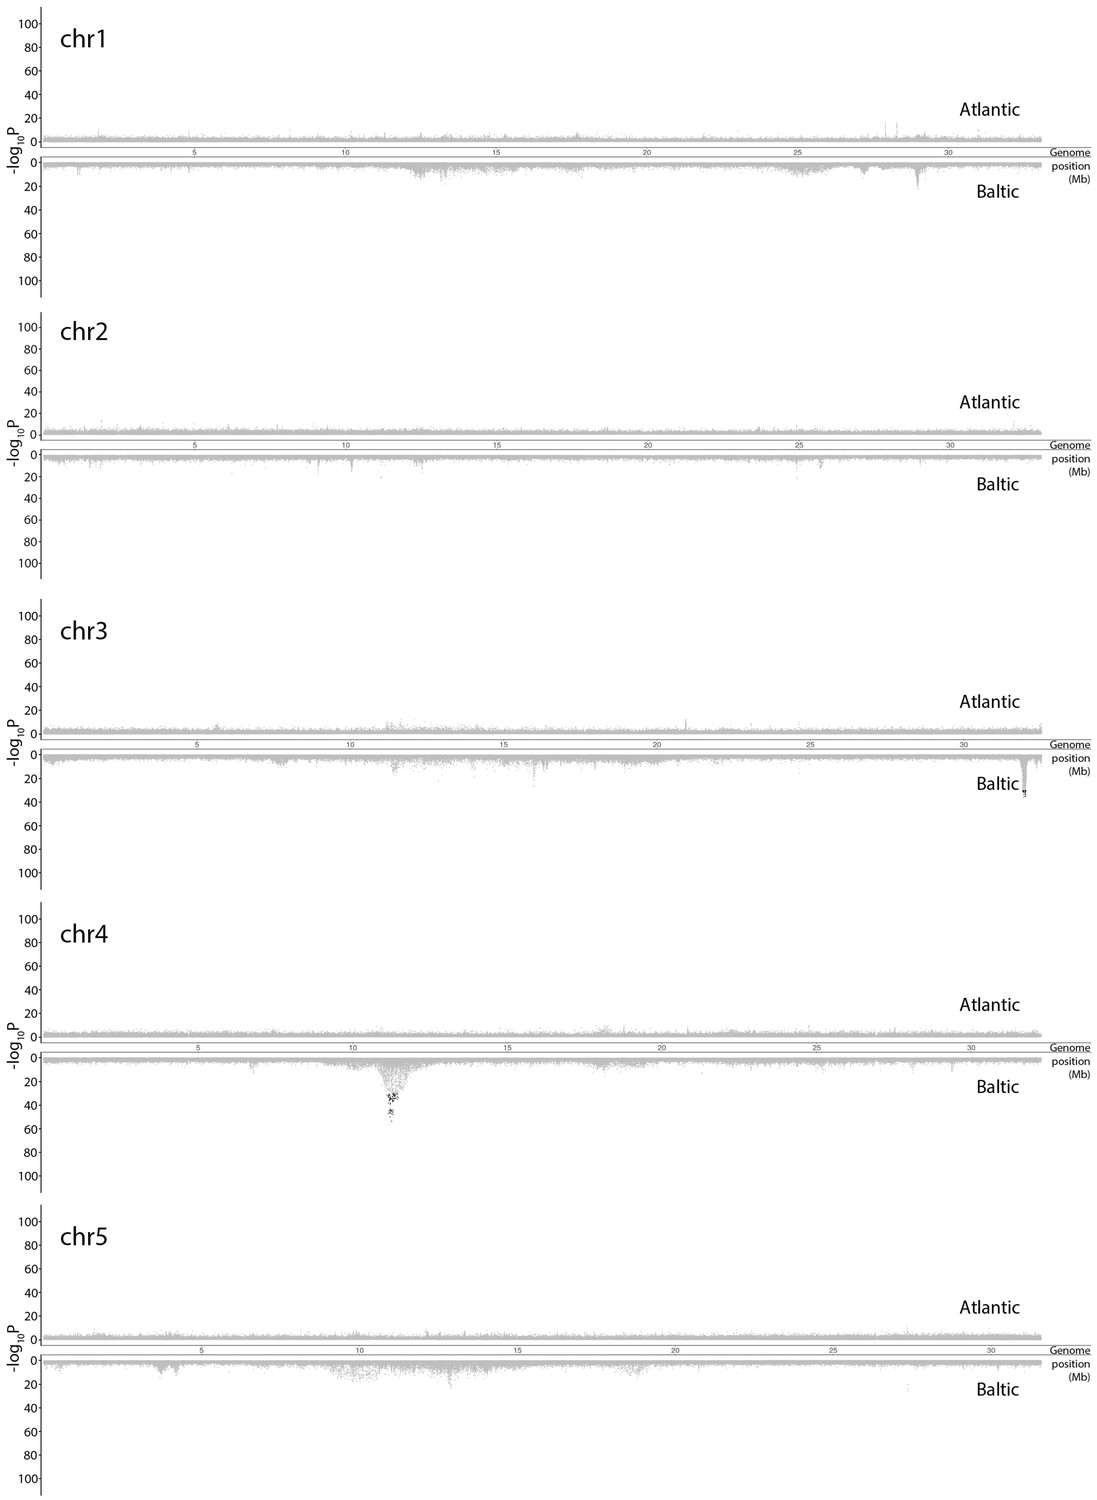
Genetic differentiation between super-pools of spring and autumn-spawning herring in Atlantic (above) and in Baltic herring (below).
Results for individual chromosomes. SNPs with raw p>10−30 in both spring and autumn-spawners are colored in grey. SNPs with raw p<10−30 in both spring and autumn-spawners are colored in red while SNPs with raw p<10−30 in only spring or autumn-spawners are colored in black. In each significant peak, we only labeled genes which are associated with SNPs with raw p-values fulfilling the criteria of (-log10P) > [Max(-log10P) - 20]. The light-grey bar on the background show the position of associated genes. Adjusted p-values are given in Supplementary file 5.
Figure 3—figure supplement 4
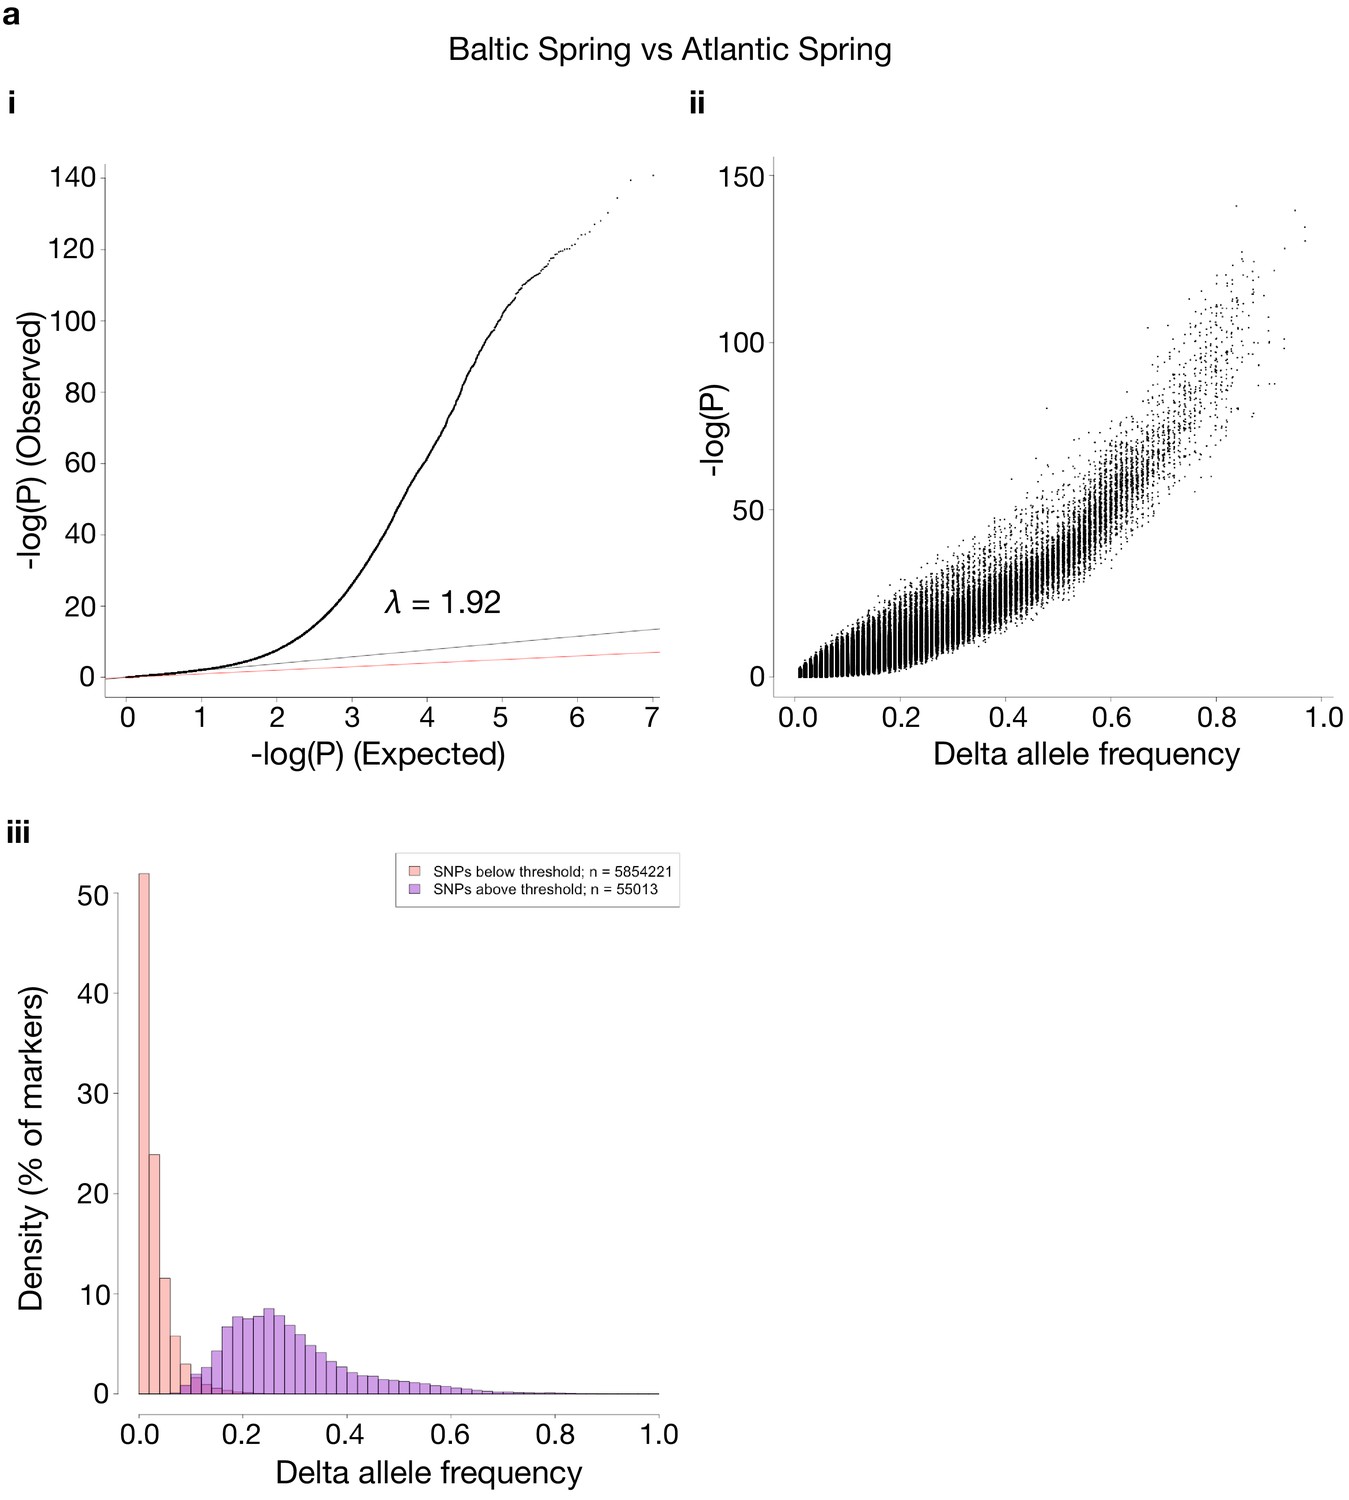
Comparisons of p-values and delta allele frequencies (DAF) for the contrasts shown in Figure 3.
For each contrast used, the same three sub-panels are shown. i: a QQ-plot of observed vs. expected –log10(P)-values, where the red line is a line with slope one and the black line represents a linear regression using the first (i.e. least significant) 90% of the values. ii: shows -log10(P)-values vs. absolute DAF between the two sides of the contrasts. iii: histograms of SNPs below and above the p-value threshold of 10−10, respectively. Each histogram is scaled to have each bar represent the fraction of markers, of the respective class, found in the bin. The total number of markers in each class is shown in the legend. The contrasts are as follows: (a) Baltic Spring vs. Atlantic Spring; (b) Baltic Autumn vs. Atlantic Autumn; (c) Baltic Spring vs. Baltic Autumn; (d) Atlantic Spring vs. Atlantic Autumn.
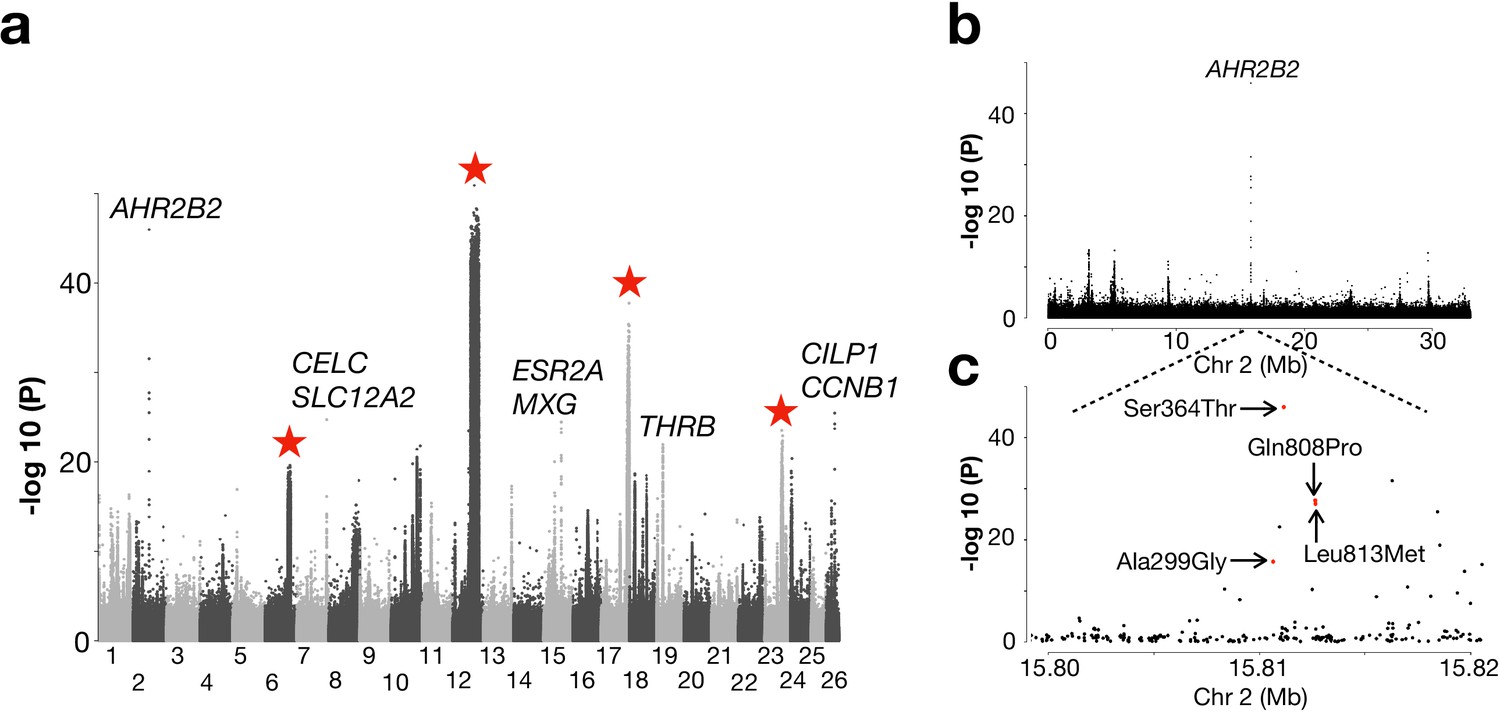
Figure 4 with 5 supplements
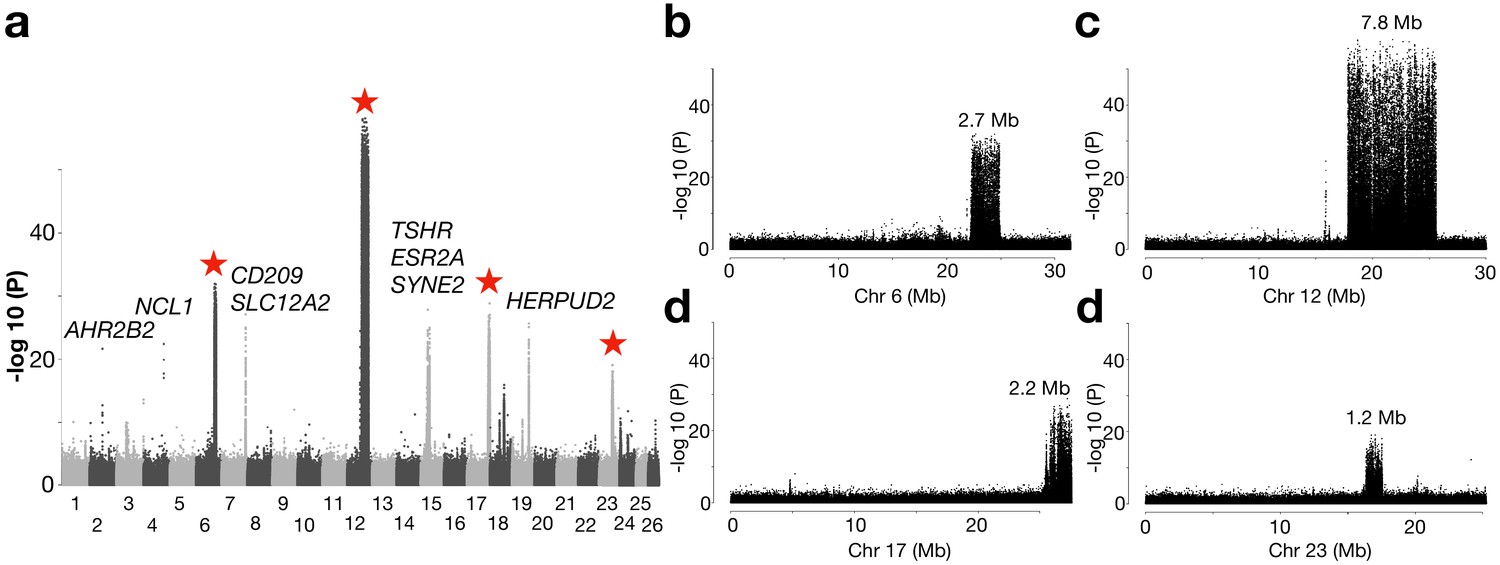
Genetic differentiation between herring populations from Ireland and Britain vs.other populations from the Northeast Atlantic.
(a) Putative structural variants on Chr6, 12, 17 and 23 are indicated with red stars. (b to e) are zoomed-in profiles on the corresponding chromosomes. Strong genetic differentiation is observed in the following intervals: Chr6: 22.2–24.8 Mb, Chr12: 17.8–25.6 Mb, Chr17: 25.8–27.5 Mb, and Chr23: 16.3–17.5 Mb.
Figure 4—figure supplement 1

Allele frequency of diagnostic SNPs at four putative structural variants across populations of Atlantic herring and one Pacific outgroup.
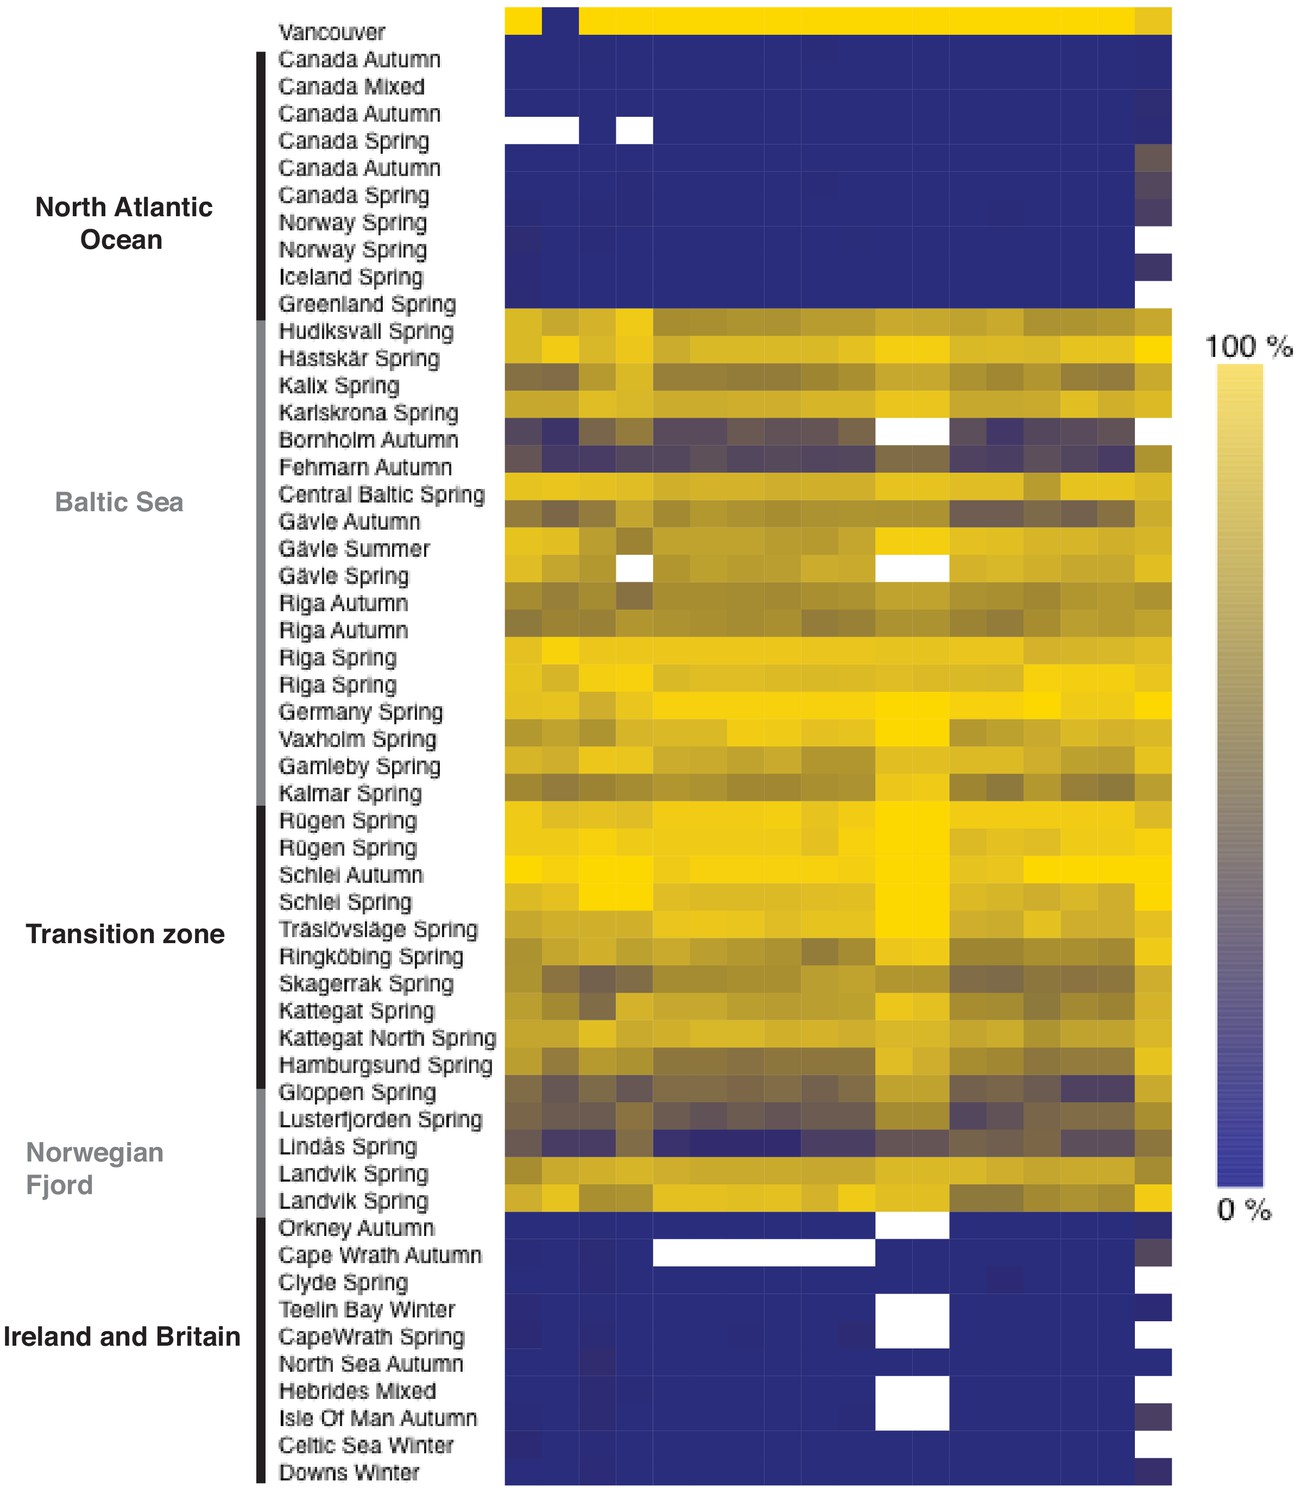
Figure 4—figure supplement 2
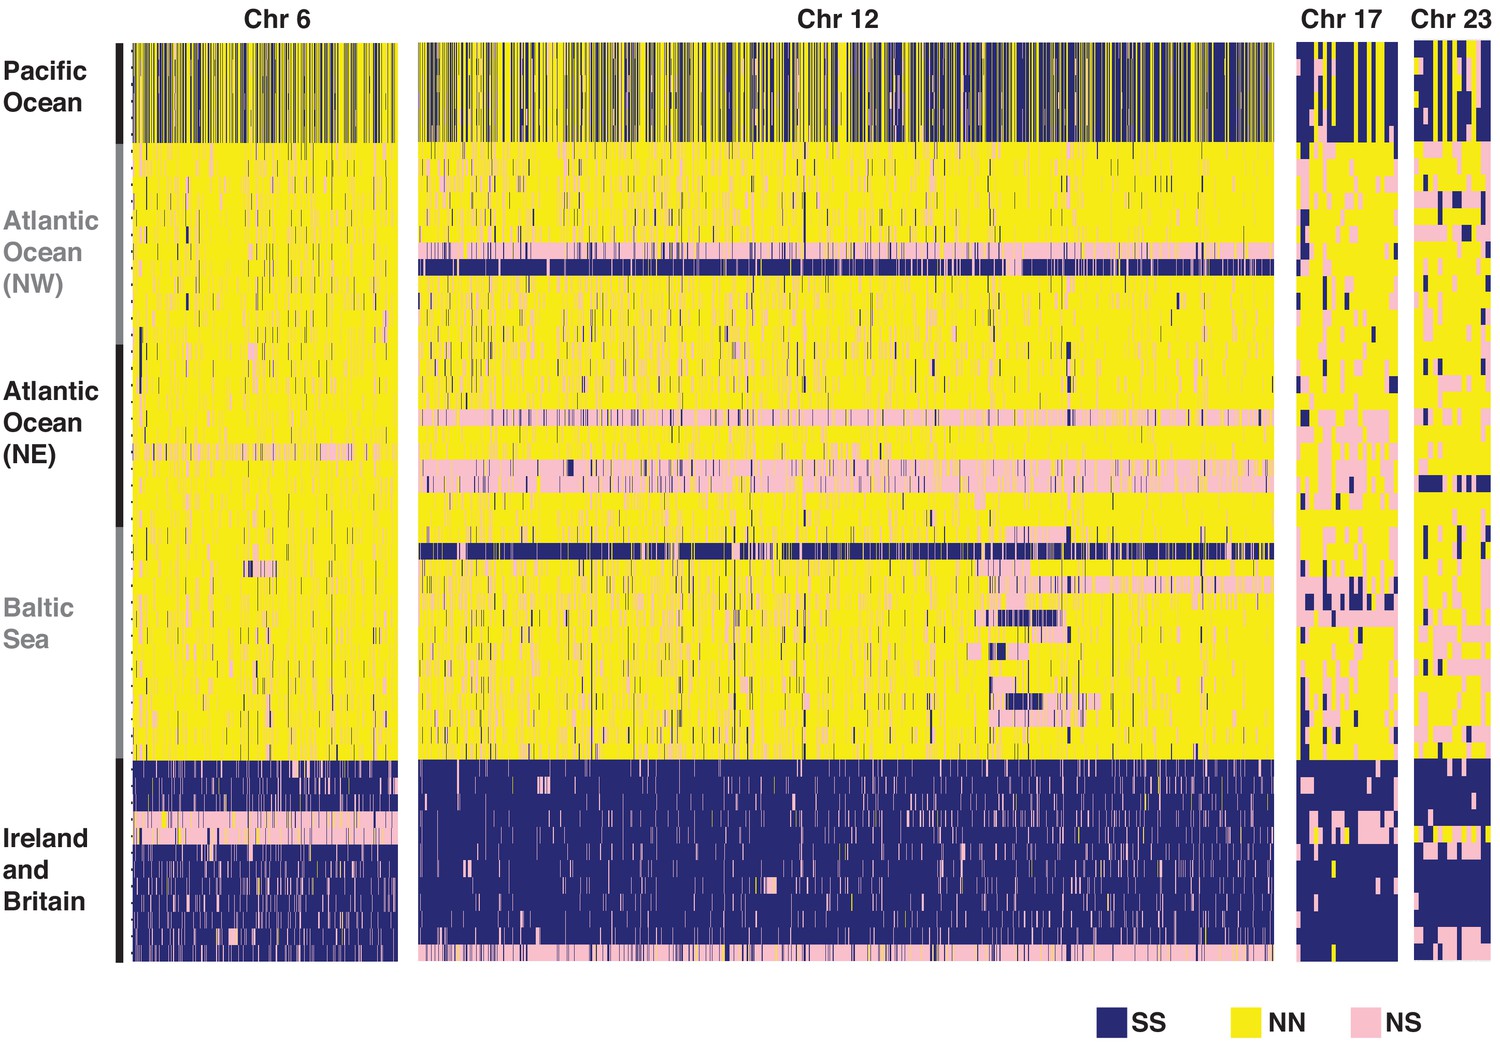
Heatmap of the genotypes for diagnostic SNPs based on individual whole-genome sequencing data at four putative structural variants.
Figure 4—figure supplement 3
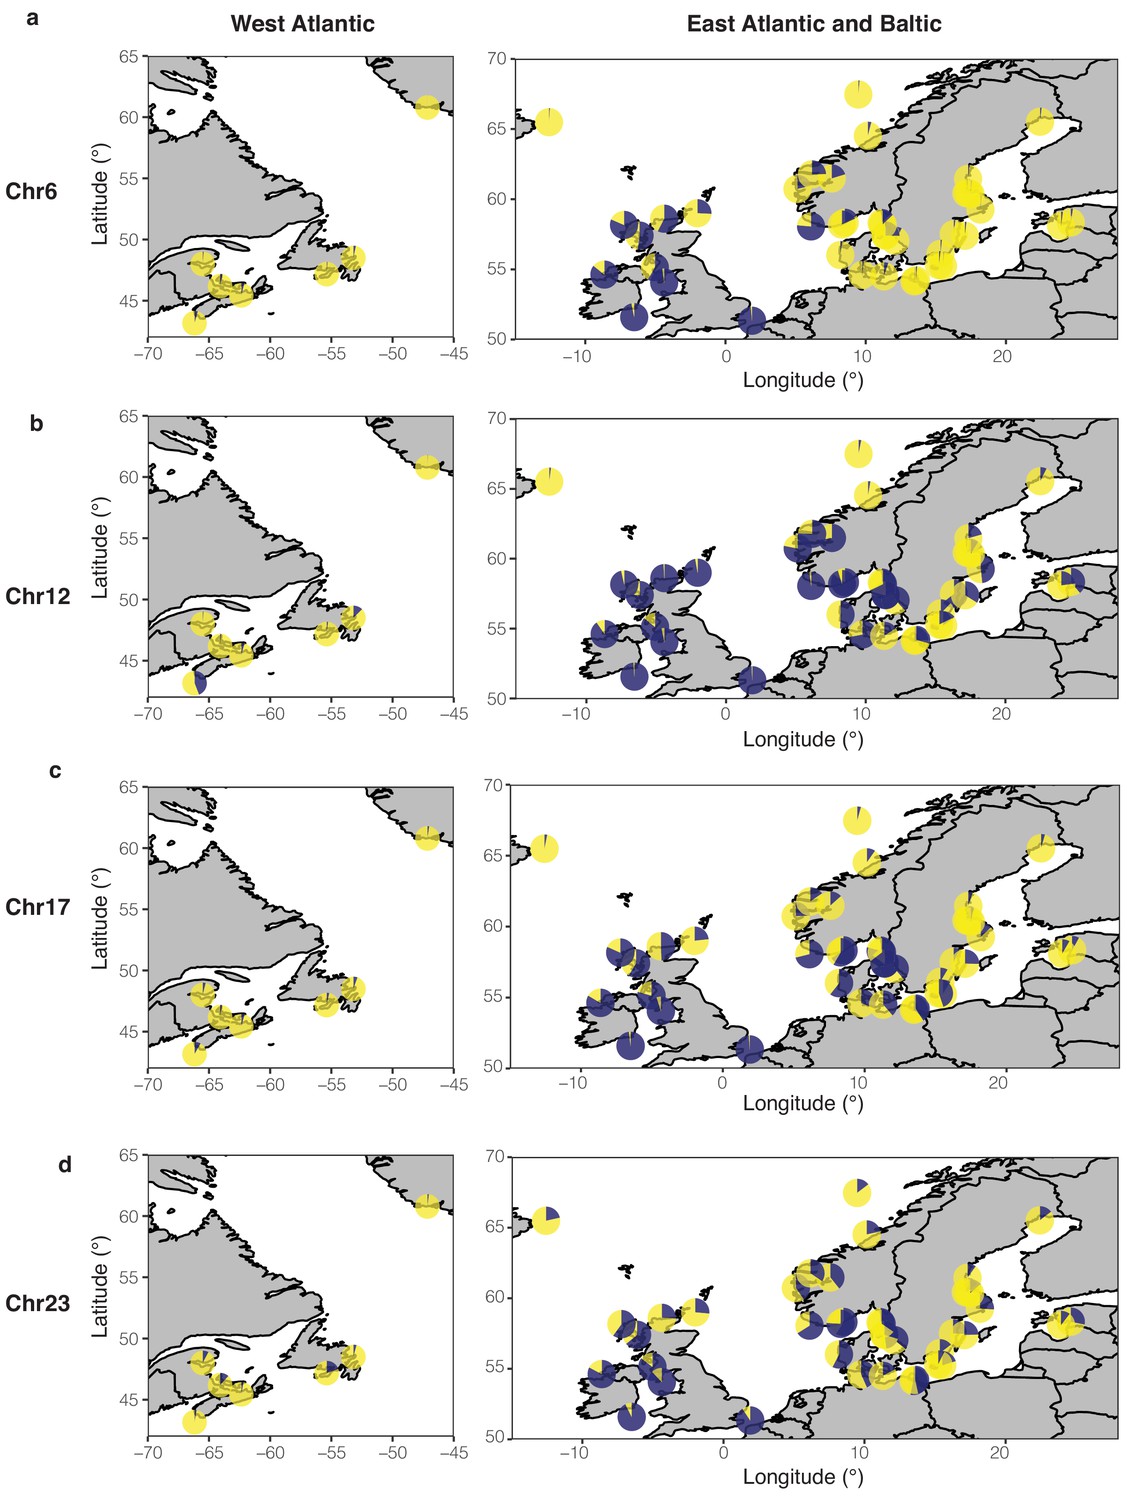
Frequencies of two estimated haplotypes in each population at four putative structural variants on Chr6 (a), Chr12 (b), Chr17 (c), and Chr23 (d) across the geographical distribution.
Figure 4—figure supplement 4
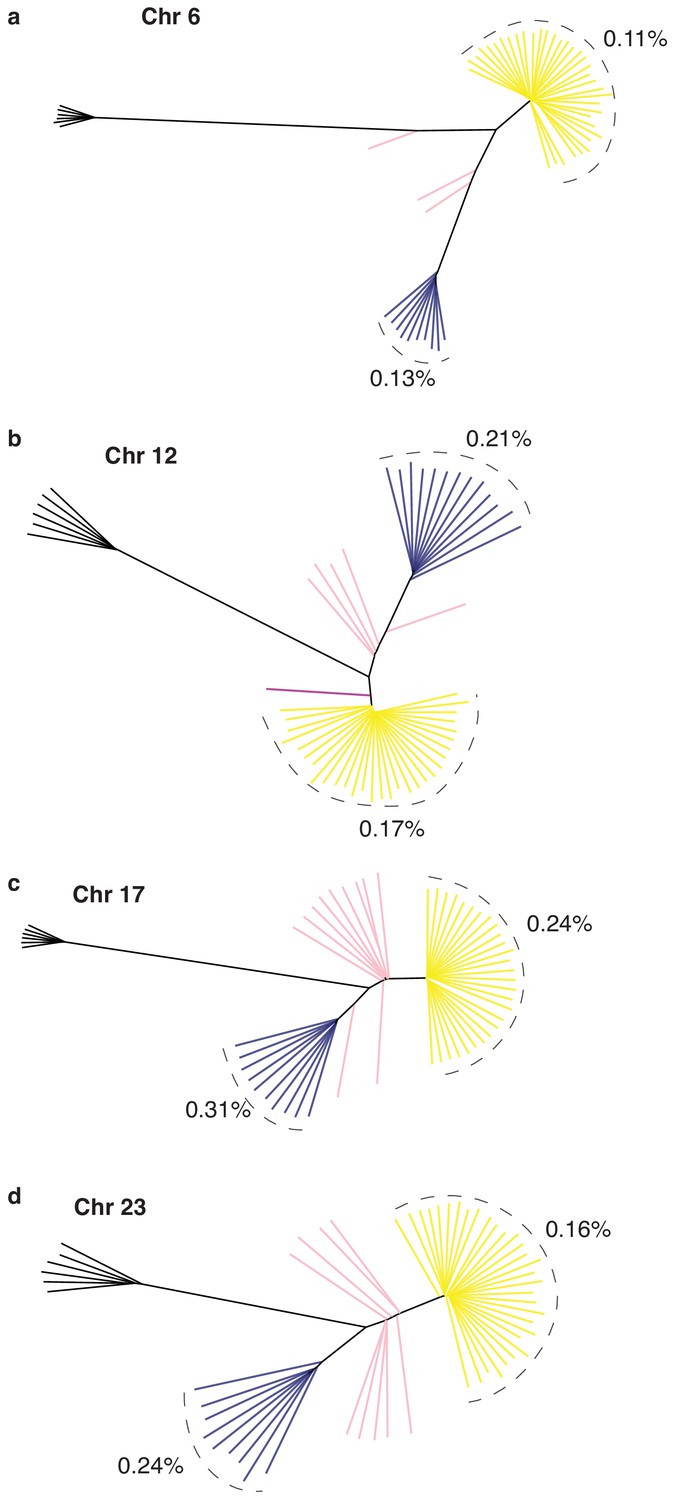
Neighbor-joining tree based on genotypes of all SNPs in each of the four putative structural variants respectively on Chr6 (a), Chr12 (b), Chr17 (c), and Chr23 (d).
Average nucleotide diversity was estimated for S and N haplotypes in each tree.
Figure 4—figure supplement 5
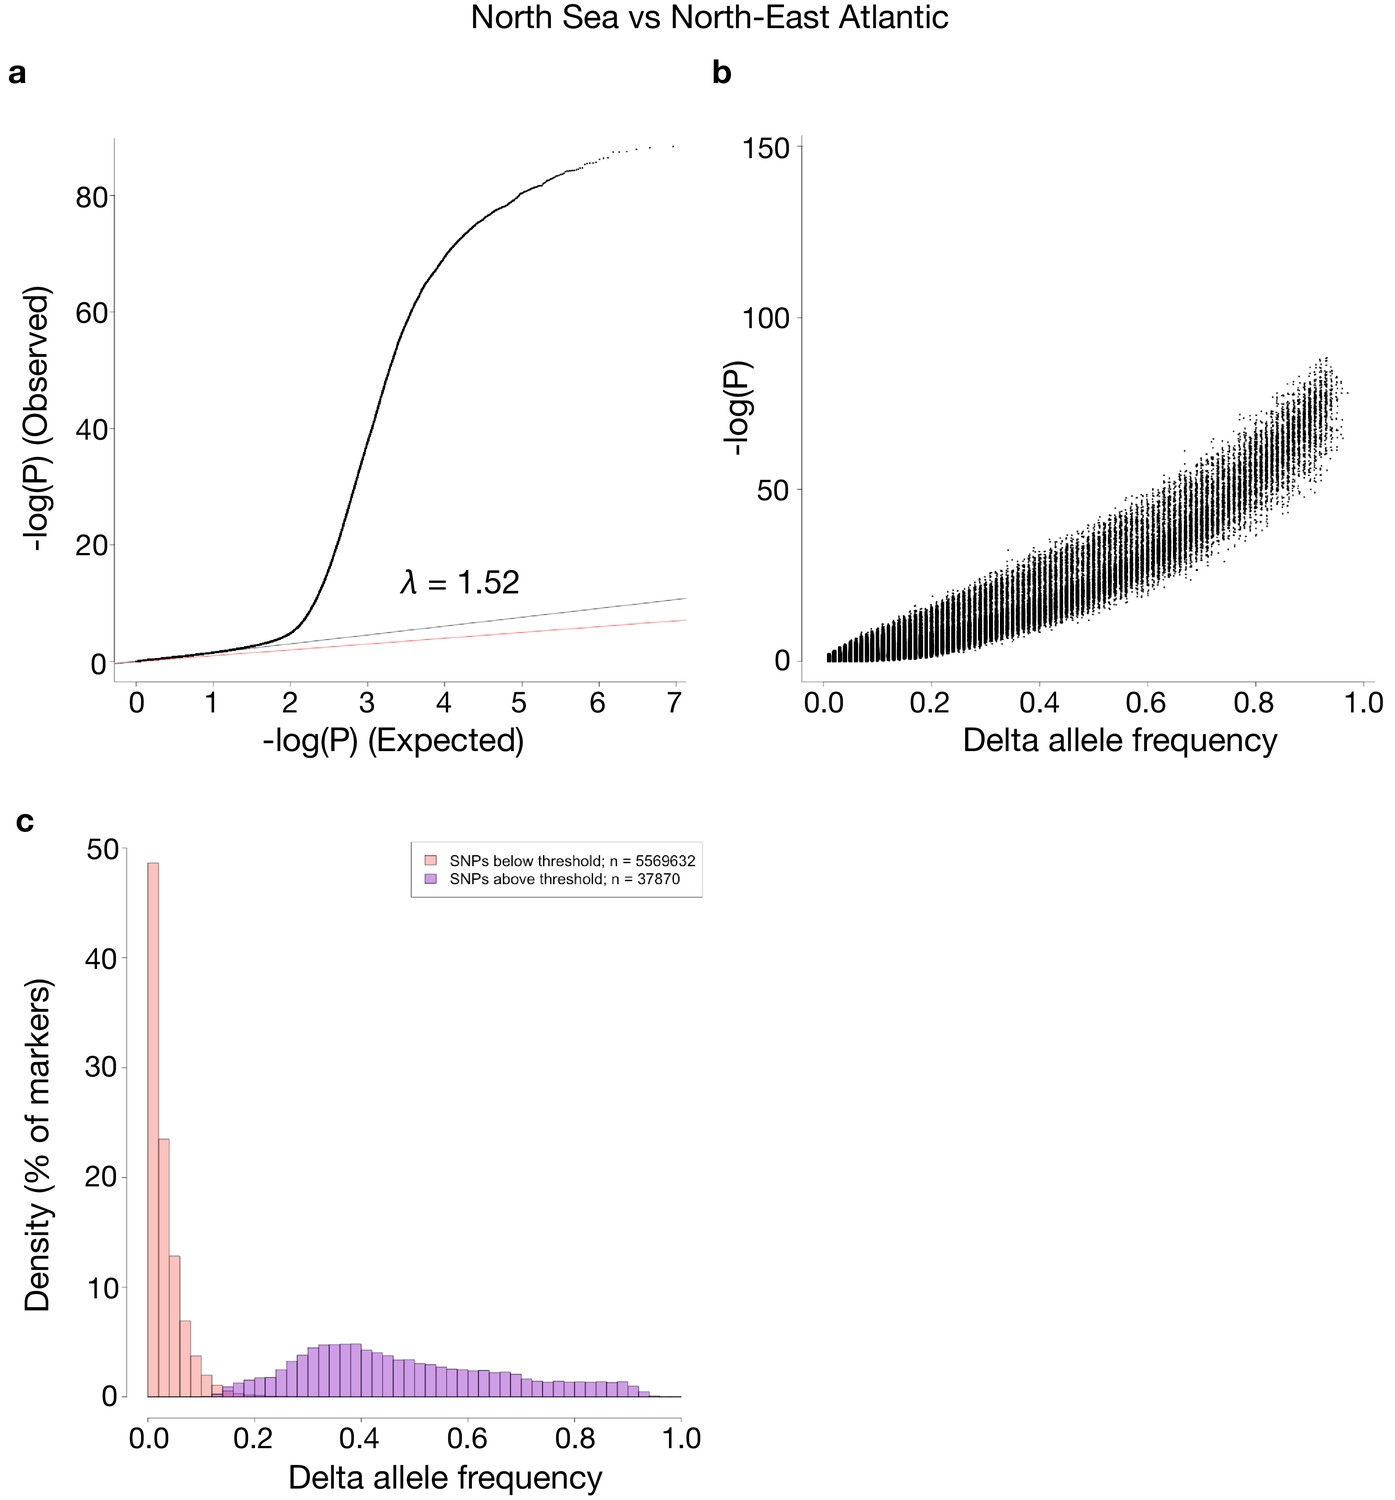
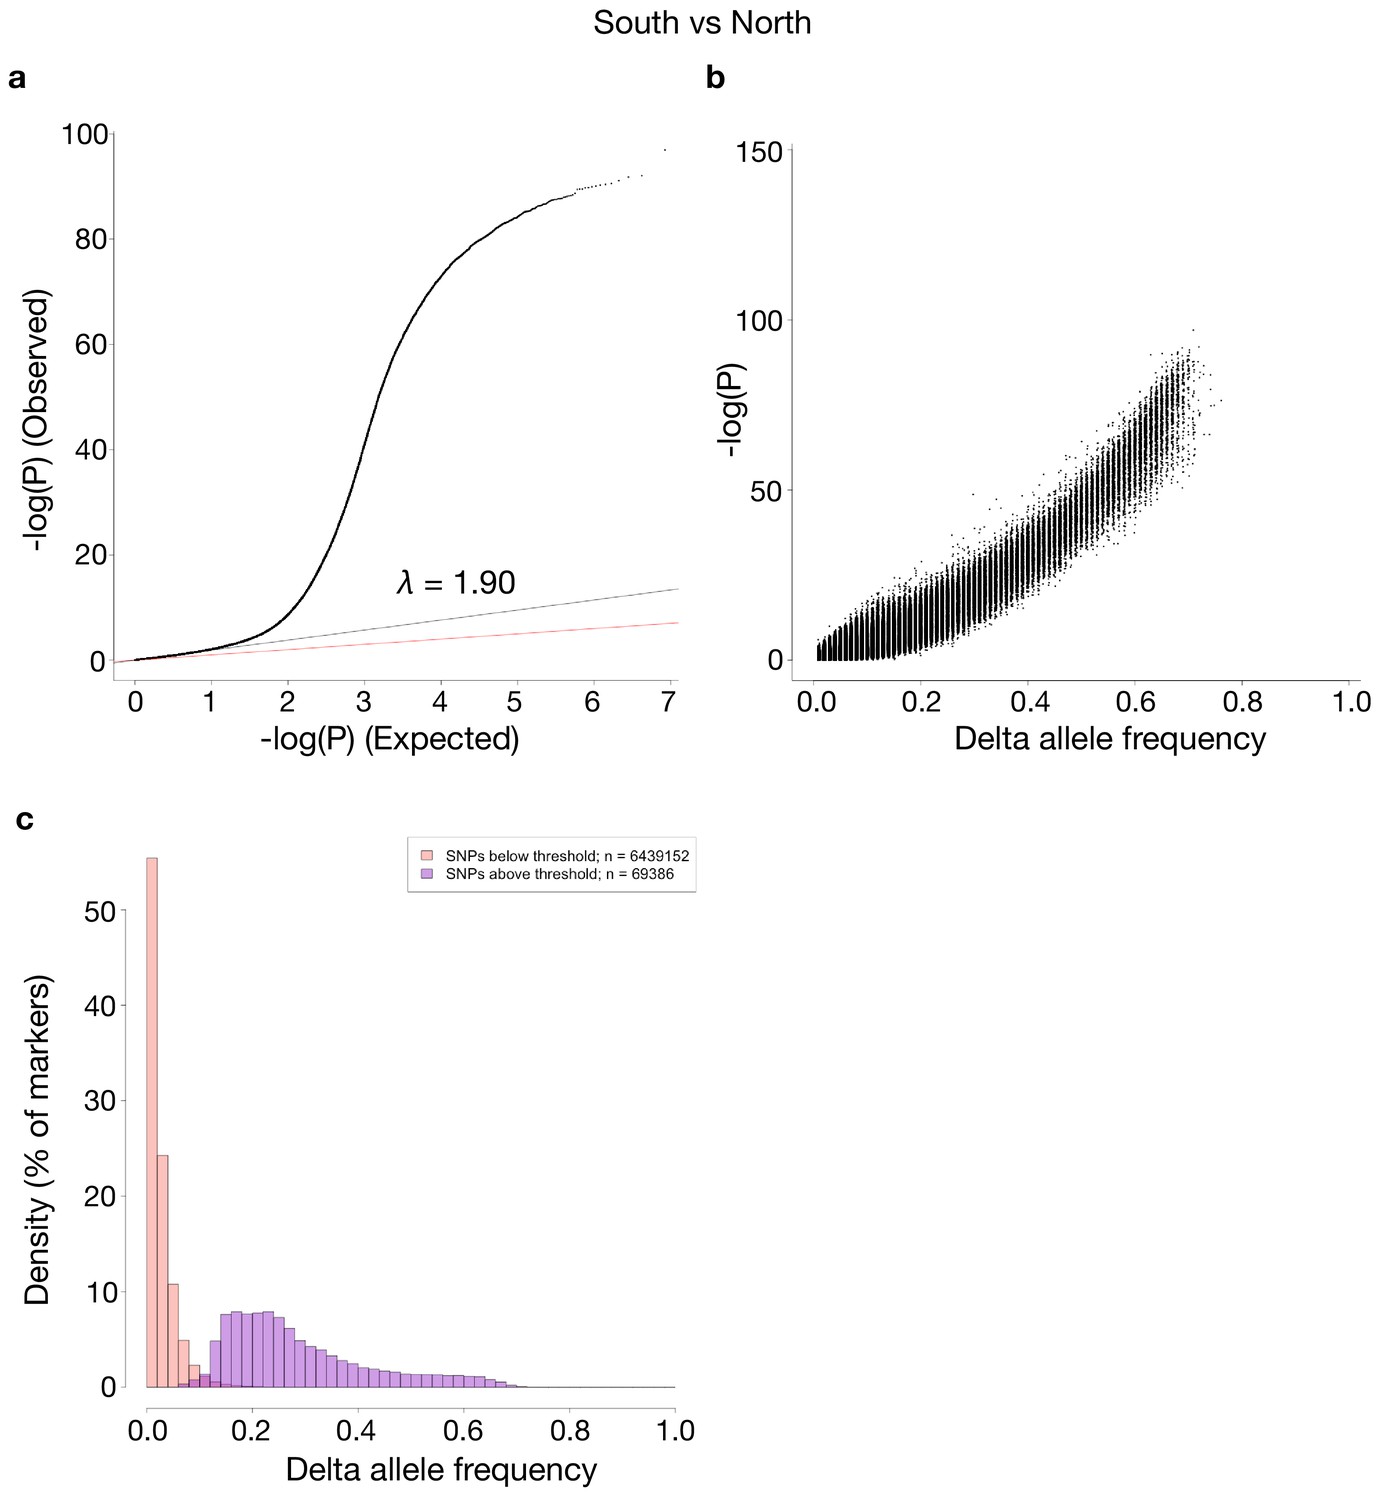
Comparisons of p-values and delta allele frequencies (DAF) for the contrast shown in Figure 4.
(a) A QQ-plot of observed vs. expected –log10(P)-values, where the red line is a line with slope one and the black line represents a linear regression using the first (i.e. least significant) 90% of the values. (b) -log10(P)-values vs absolute DAF between the two sides of the contrast. (c) Histograms of SNPs below and above the p-value threshold of 10−10, respectively. Each histogram is scaled to have each bar represent the fraction of markers, of the respective class, found in the bin. The total number of markers in each class is shown in the legend.
Figure 5 with 3 supplements
Genetic differentiation between Atlantic herring from the North Atlantic vs. waters around Ireland, Britain, and the transition zone.
(a) Genome-wide screen. (b) Genetic differentiation on Chr2 and a zoom-in profile of the AHR2B2 locus. Red dots refer to the four missense mutations.
Figure 5—figure supplement 1
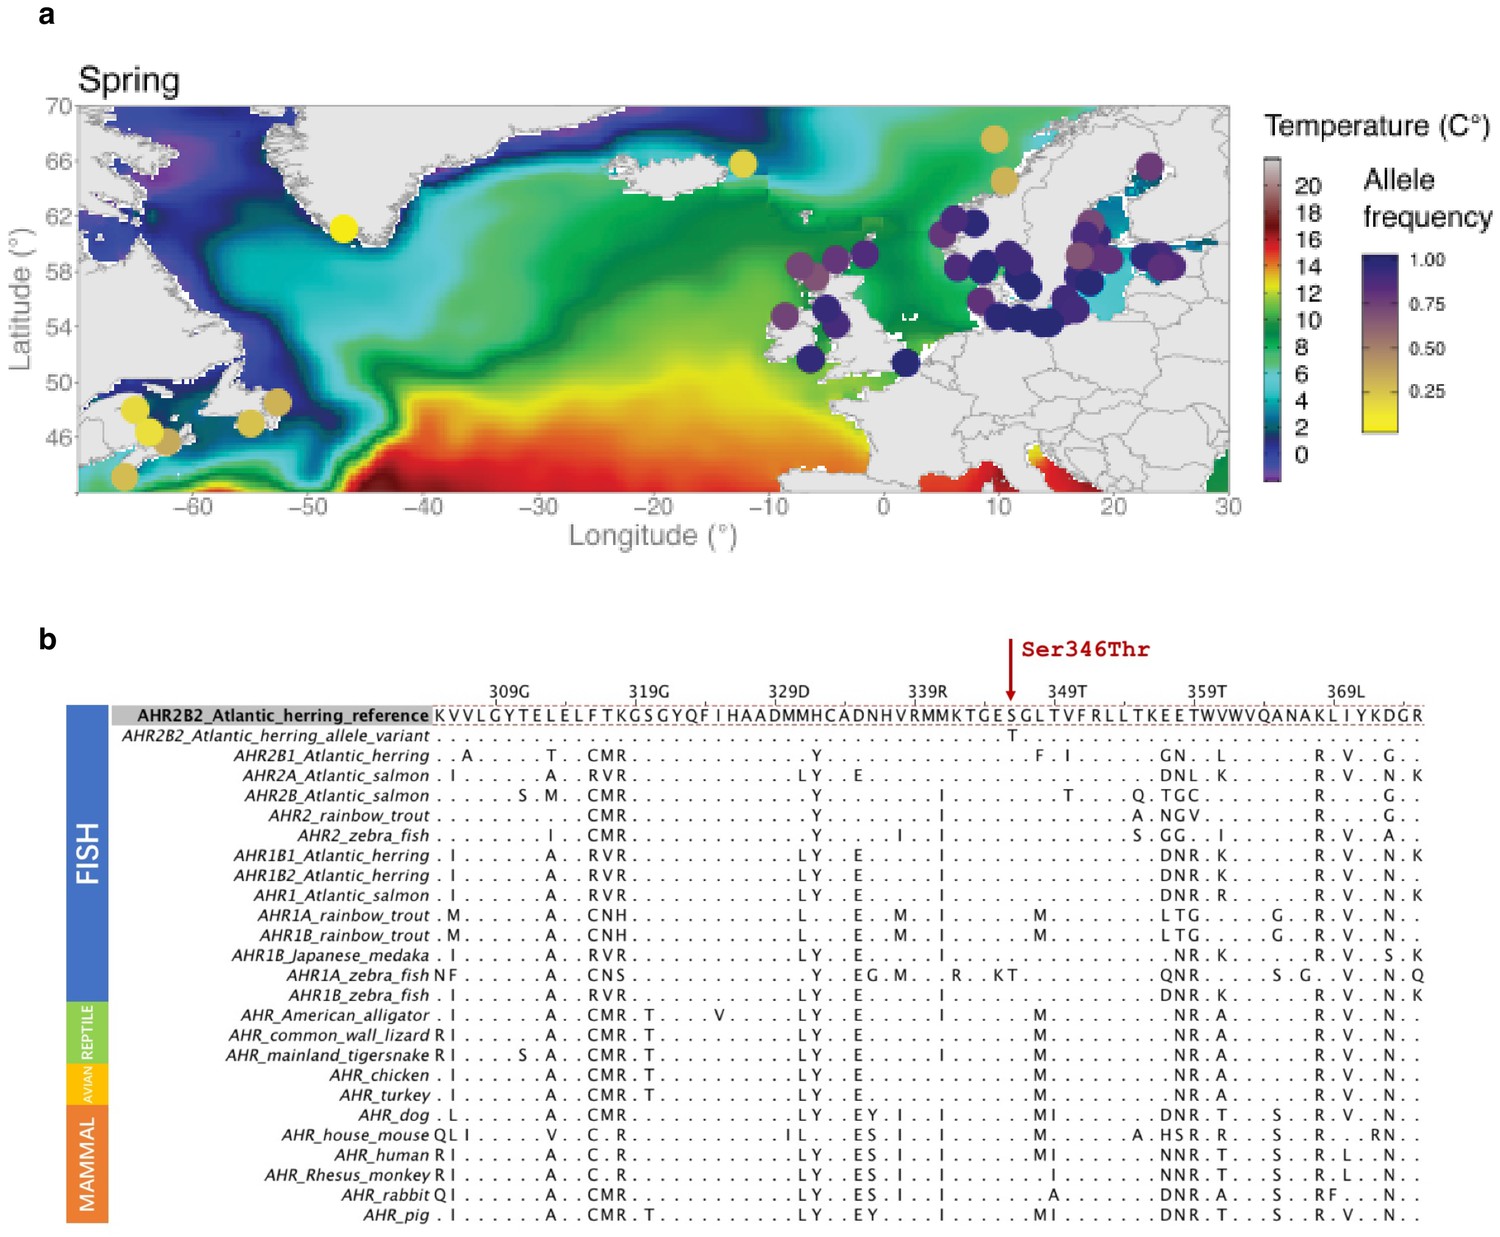
The missense mutation (Ser346Thr) in AHR2B2 and a multi-species amino acid alignment of AHR sequences across vertebrate species.
There are four isoforms of AHR in herring organized as two gene pairs: AHR1B2-AHR2B2 on chromosome two and AHR1B1-AHR2B1 on chromosome 21. These have been named based on sequence similarity to the Ahr1b-Ahr2b in zebrafish. (a) Allele frequency of the missense mutation (Ser346Thr) in different populations. (b) Amino acid alignment of AHR protein across multiple species.
Figure 5—figure supplement 2
Heatmap of allele frequencies based on pooled samples for SNPs in the interval 6.35 Mb to 6.37 Mb on chromosome 19 with absolute delta allele frequencies above 0.4 in the contrast shown in Figure 5.
The color side-bar indicates the frequency of the reference allele, and the top bar highlights (in purple) the one non-synonymous SNP in the set: chr19_6359267. This polymorphism causes a missense mutation Gln40His in THRB gene (ENSCHAG00000003500). White cells represent missing data.
Figure 5—figure supplement 3
Comparisons of p-values and delta allele frequencies (DAF) for the contrast shown in Figure 5.
(a) A QQ-plot of observed vs. expected –log10(P)-values, where the red line is a line with slope one and the black line represents a linear regression using the first (i.e. least significant) 90% of the values. (b) -log10(P)-values vs absolute DAF between the two sides of the contrast. (c) Histograms of SNPs below and above the p-value threshold of 10−10, respectively. Each histogram is scaled to have each bar represent the fraction of markers, of the respective class, found in the bin. The total number of markers in each class is shown in the legend.
Figure 6
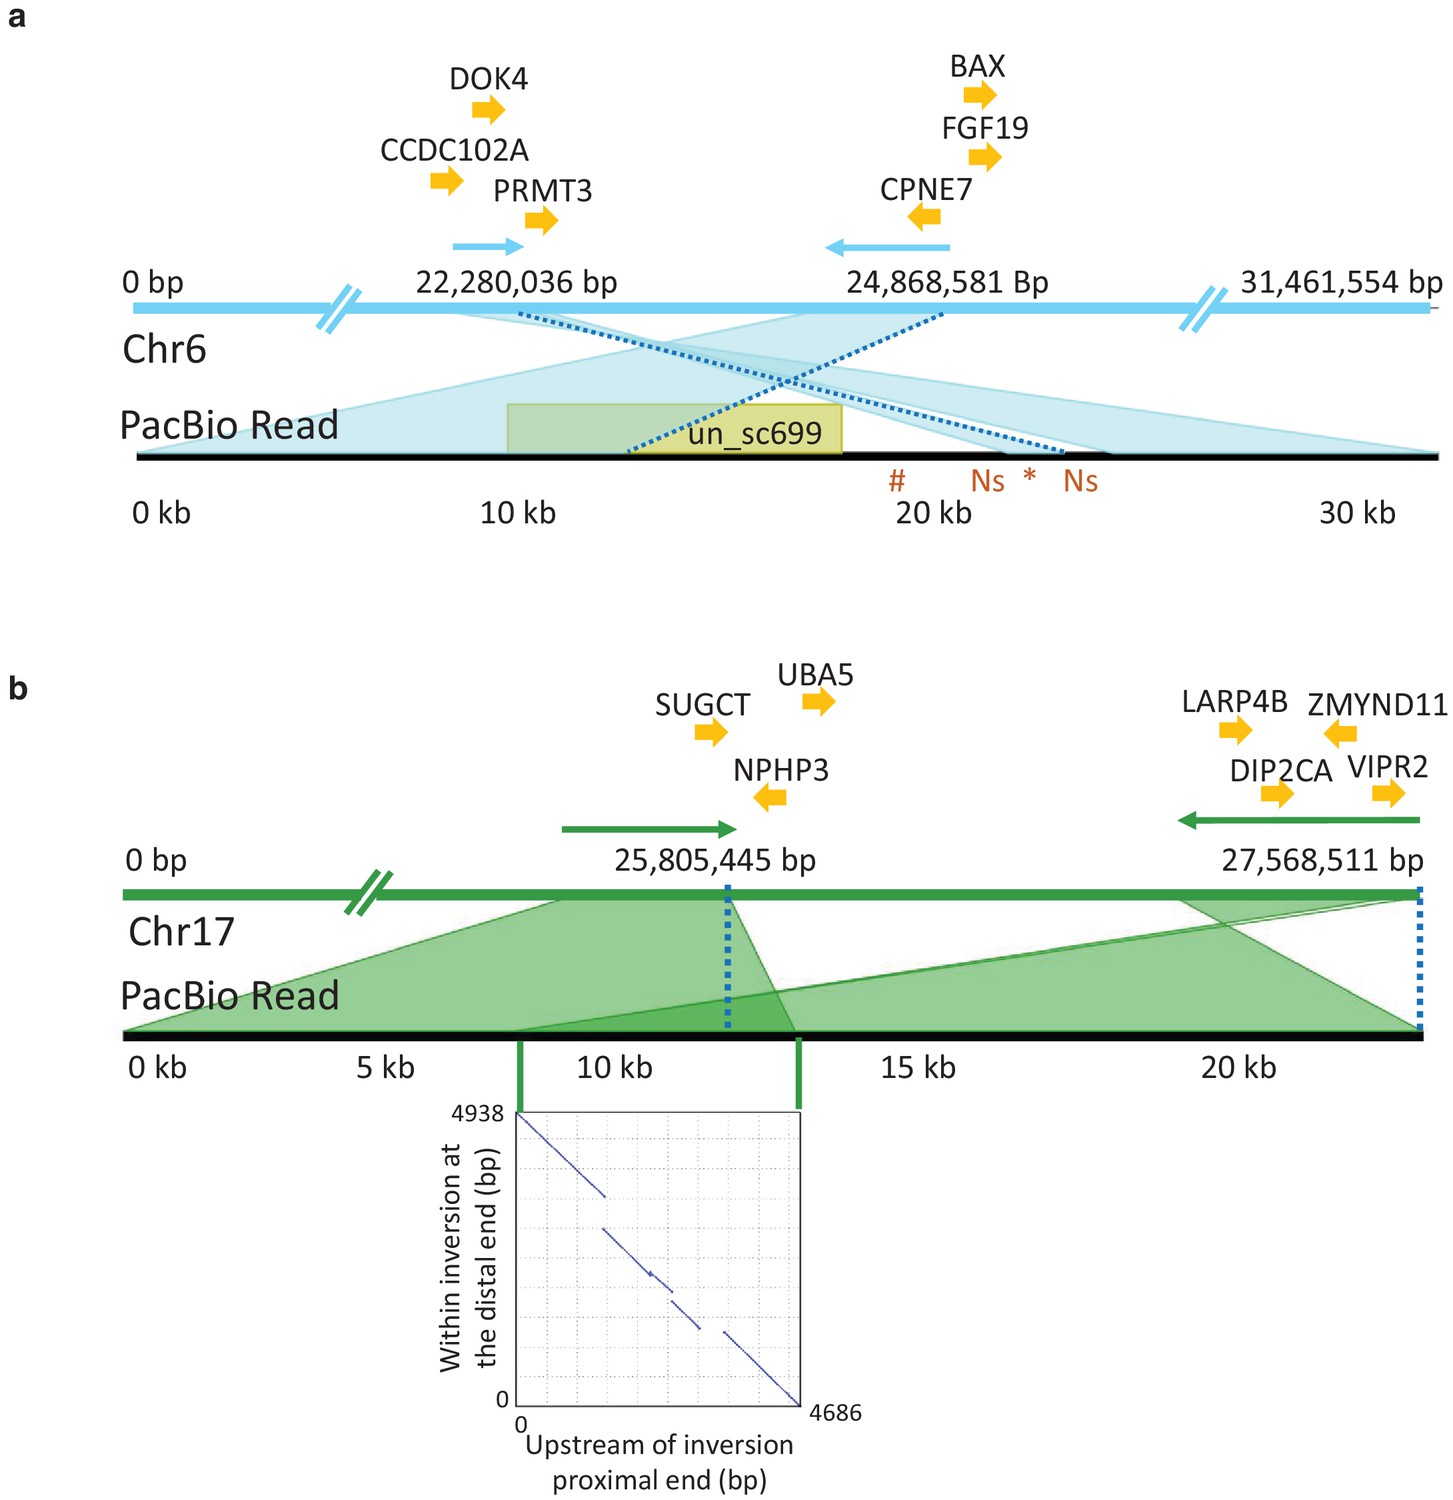
PacBio long reads defining inversion breakpoints on chromosomes 6 and 17.
(a) Chromosome 6. The orientation of an informative read is indicated with arrows above the Chr6 reference panel. The breakpoints are indicated with dotted blue lines. The region just outside the proximal breakpoint is misassembled in the reference and results in a 1.7 kb pseudo-inversion (marked by an asterisk below the read panel) flanked by 499 bp of Ns. It also results in the finding that nearly 10 kb of the PacBio read maps to unplaced_scaffold699 (shown in yellow colored box) and nearly 5 kb (indicated with hash symbol below the read panel) that is not present in the assembly. Genes surrounding the breakpoints are indicated above the reference panel. CCDC102A: coiled-coil domain containing 102A, DOK4: docking protein 4, PRMT3: protein arginine methyltransferase 3, CPNE7: copine-7-like, BAX: apoptosis regulator BAX-like, FGF19: fibroblast growth factor 19. (b) Chromosome 17. The correspondence between the PacBio reads and the reference assembly is indicated with arrows above the reference panel. The breakpoints are indicated with dotted blue lines. The overlap of the read to both the proximal and distal breakpoints is shaded in dark green and is caused by a 5 kb duplication that is present before the proximal and distal breakpoints. The dotplot illustrating this duplication is shown in the inserted graph. Genes in the near vicinity of the breakpoints are shown above the reference sequence. SUGCT: succinyl –CoA: glutarate-CoA transferase, UBA5: ubiquitin-like modifier activating enzyme 5, NPHP3: nephronophthisis 3, ZMYND11: zinc finger, MYND-type containing 11, LARP4B: La ribonucleoprotein 4B homolog, DIP2CA: disco-interacting protein two homolog Ca, VIPR2: vasoactive intestinal peptide like receptor 2.
Author response image 1
Additional files
-
Supplementary file 1
Specimen information of 53 pooled samples.
- https://cdn.elifesciences.org/articles/61076/elife-61076-supp1-v2.xlsx
-
Supplementary file 2
Specimen information of 55 individual sequencing samples.
- https://cdn.elifesciences.org/articles/61076/elife-61076-supp2-v2.xlsx
-
Supplementary file 3
Definition of how superpools were formed by pooling population samples of major groups of herring.
Sample names correspond to those given in Supplementary file 1.
- https://cdn.elifesciences.org/articles/61076/elife-61076-supp3-v2.xlsx
-
Supplementary file 4
List of SNPs showing strong genetic differentiation between superpools of Atlantic and Baltic herring.
The criteria for inclusion was raw p<10−30 for both comparisons (among spring-spawners and among autumn-spawners) or raw p<10−50 for a single comparison. These are the SNPs colored in red or black in Figure 3—figure supplement 1. Raw p-values are given in columns E and G and corrected p-values in columns F and H.
- https://cdn.elifesciences.org/articles/61076/elife-61076-supp4-v2.xlsx
-
Supplementary file 5
List of loci showing strong genetic differentiation between superpools of spring and autumn-spawning herring.
The criteria for inclusion was raw p<10−30 for both comparisons (among Atlantic populations and among Baltic populations) or raw p<10−50 for a single comparison. These are the SNPs colored in red or black in Figure 3—figure supplement 3. Raw p-values are given in columns E and G and corrected p-values in columns F and H.
- https://cdn.elifesciences.org/articles/61076/elife-61076-supp5-v2.xlsx
-
Supplementary file 6
Genes within inverted regions and 200 kb flanking inversion breakpoints on chromosome 6 and 17 in Atlantic herring.
- https://cdn.elifesciences.org/articles/61076/elife-61076-supp6-v2.xlsx
-
Supplementary file 7
Reference allele frequencies for the 794 markers used in the PCA shown in Figure 2b.
- https://cdn.elifesciences.org/articles/61076/elife-61076-supp7-v2.xlsx
-
Transparent reporting form
- https://cdn.elifesciences.org/articles/61076/elife-61076-transrepform-v2.docx
Download links
A two-part list of links to download the article, or parts of the article, in various formats.
Downloads (link to download the article as PDF)
Open citations (links to open the citations from this article in various online reference manager services)
Cite this article (links to download the citations from this article in formats compatible with various reference manager tools)
Ecological adaptation in Atlantic herring is associated with large shifts in allele frequencies at hundreds of loci
eLife 9:e61076.
https://doi.org/10.7554/eLife.61076


