Optogenetic control of PRC1 reveals its role in chromosome alignment on the spindle by overlap length-dependent forces
- Division of Molecular Biology, Ruđer Bošković Institute, Croatia
Figures
Figure 1 with 2 supplements

Optogenetic reversible removal of PRC1 from the spindle in metaphase.
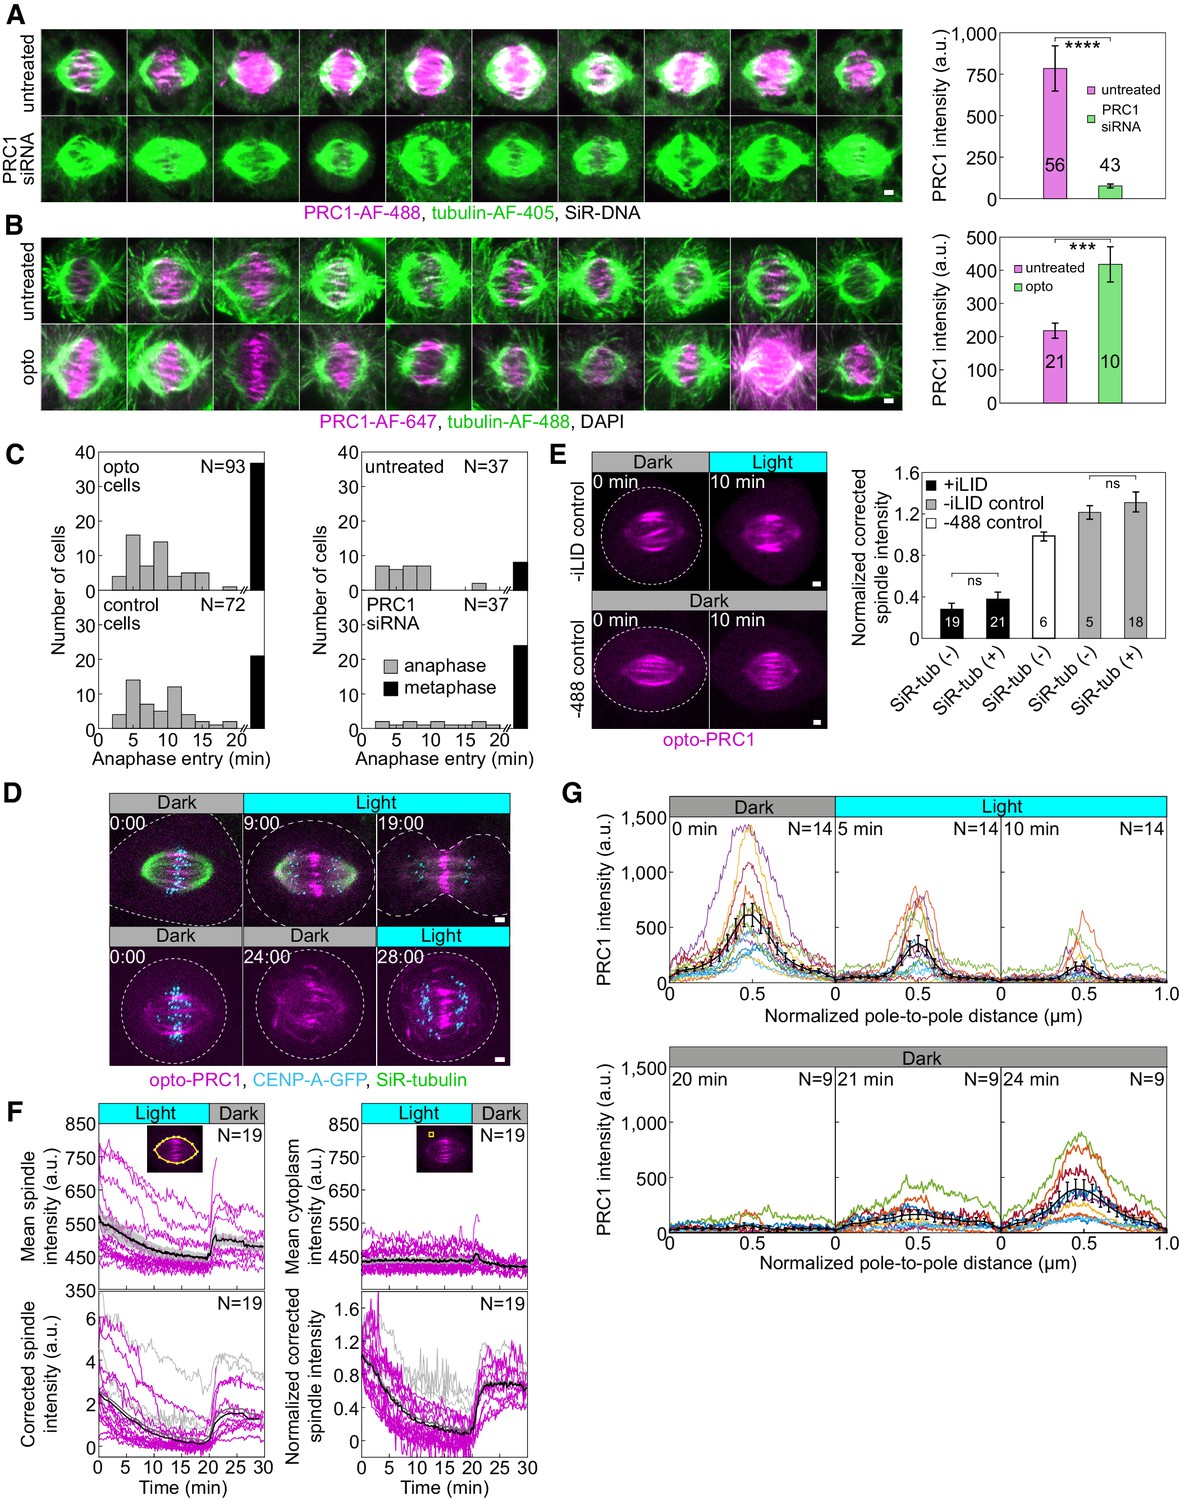
(A) Schematic representation of the optogenetic system. PRC1 is fused with SspB and tgRFPt (opto-PRC1, see Materials and methods). iLID, composed of photosensitive LOV2 domain and SsrA is tagged with CAAX sequence which mediates its binding to the cell membrane. Exposure to the blue light induces conformational change in LOV2 domain, enabling dimerization of SspB and SsrA, and thus translocation of PRC1 from the spindle to the cell membrane. After the blue light is turned off, LOV2 adopts its initial conformation, leading to decreased affinity of SspB for SsrA, and consequently dissociation of PRC1 from the membrane and its return to the spindle. (B) Time-lapse images of a metaphase spindle in a U2OS cell stably expressing CENP-A-GFP (cyan), depleted for endogenous PRC1, with transient expression of opto-PRC1 (magenta) and iLID-CAAX. Note that kinetochores are shown only in the first and the last time frame in order to better visualize PRC1 removal. Images are maximum intensity projections of three z-planes, smoothed with 0.1-µm-sigma Gaussian blur. Time: min:s. Scale bar; 5 µm. (C) Normalized intensity of opto-PRC1 signal on the spindle (left panel) during its removal (0–20 min) and return (20–30 min). N = 15 (see Figure 1—figure supplement 1F for individual cells). Scheme depicts the areas where opto-PRC1 intensity was measured: spindle (large polygon) and cytoplasm (small square). Exponential fit (gray lines in the right panel) on mean normalized opto-PRC1 spindle intensity (black points) during 20 min of removal and 10 min of return. Formulae y=A*exp(-τ*x) and y=A*exp(-τ*x)+c were used for opto-PRC1 removal and return, respectively. Parameters for PRC1 removal: A = 1.111, τ = 0.00277 s−1 (RSE = 0.03), and return: A = −0.635, c = 0.656, τ = 0.01622 s−1 (RSE = 0.03). The half-time was calculated by ln2/τ. (D) Pole-to-pole opto-PRC1 intensity during removal (left; N = 14) and return (right; N = 9) to the spindle. Mean and s.e.m are color-coded corresponding to the time when measured (upper right corners). Scheme depicts the area where opto-PRC1 intensity was measured (yellow) to obtain the mean intensity projection onto the pole-to-pole axis. Mean (thick lines); s.e.m. (shaded areas); N (number of cells).
Figure 1—figure supplement 1
Validation of optogenetic system and PRC1 removal.
(A) Metaphase spindles in fixed, unlabeled U2OS cells (left) immunostained for endogenous PRC1 (AF-488, magenta), tubulin (AF-405, green) and stained with SiR-DNA (not shown) in untreated (top) and PRC1 siRNA-treated cells (bottom). All images are sum intensity projections of five z-planes. Graph (right) shows PRC1 intensity in untreated (magenta) and PRC1 siRNA-treated (green) cells. Data obtained from three independent experiments. (B) Metaphase spindles in fixed, unlabeled U2OS cells immunostained for PRC1 (AF-647, magenta), tubulin (AF-488, green) and stained with DAPI (not shown) in untreated (top) and PRC1 siRNA-treated cells with addition of opto-PRC1 (bottom). All images are sum intensity projections of five z-planes. Graph (right) shows PRC1 intensity in untreated (magenta) and cells with depleted endogenous and added opto-PRC1 (green). Data obtained from two independent experiments. (C) Number of cells that entered anaphase (gray bars) and those remained in metaphase (black bars) during 20 min of exposure to the blue light for opto and control cells (left), and untreated and PRC1 siRNA-treated cells (right). For opto and control cells those stained with SiR-DNA are also taken into account. (D) Time-lapse images of U2OS cells with stable expression of CENP-A-GFP (cyan) where control cell (top) progresses to anaphase during and opto cell (bottom) after 20 min exposure to the blue light. (E) Time-lapse images of U2OS cells with stable expression of CENP-A-GFP (not shown) and transient expression of opto-PRC1 and iLID-CAAX, non-exposed to the blue light (−488 control, bottom left) and exposed to blue light but without iLID-CAAX (-iLID control, top left), before and after 10 min of imaging. Graph (right) shows opto-PRC1 intensities after 10 min of imaging in +iLID cells with and without SiR-tubulin (black), −488 control cells (white) and –iLID control cells with and without SiR-tubulin (gray). Note that SiR-tubulin does not affect opto-PRC1 removal. (F) Raw opto-PRC1 intensities from individual cells (magenta lines) at the metaphase spindle (top left) and in cytoplasm (top right) during removal and return to the spindle. Mean (thick black line) and s.e.m. (shaded area). Opto-PRC1 intensities at the metaphase spindle corrected for cytoplasm (bottom left) and normalized to the initial value (bottom right). Outliers (gray lines), mean without outliers (thick black line), mean with outliers (thick gray line). Note that outliers are excluded in Figure 1C. (G) Pole-to-pole opto-PRC1 intensity during removal (top) and return (bottom) to the spindle as in Figure 1D. Individual cells (colored lines), mean (thick black line), s.e.m (error bars). Images are max projection of three z-planes. N and numbers inside bars; number of cells. Scale bars; 2 µm. Statistical analysis; t-test. p-value legend as in Figure 2.
Figure 1—video 1
U2OS cell stably expressing CENP-A-GFP (cyan), with transient expression of opto-PRC1 (magenta) and iLID-CAAX.
The time of exposure to the blue light is indicated in the upper right corner. Time: min:s. The video corresponds to still images from Figure 1B.
Figure 2 with 4 supplements
Optogenetic removal of PRC1 disrupts kinetochore alignment on the metaphase plate and leads to lagging kinetochores in anaphase.
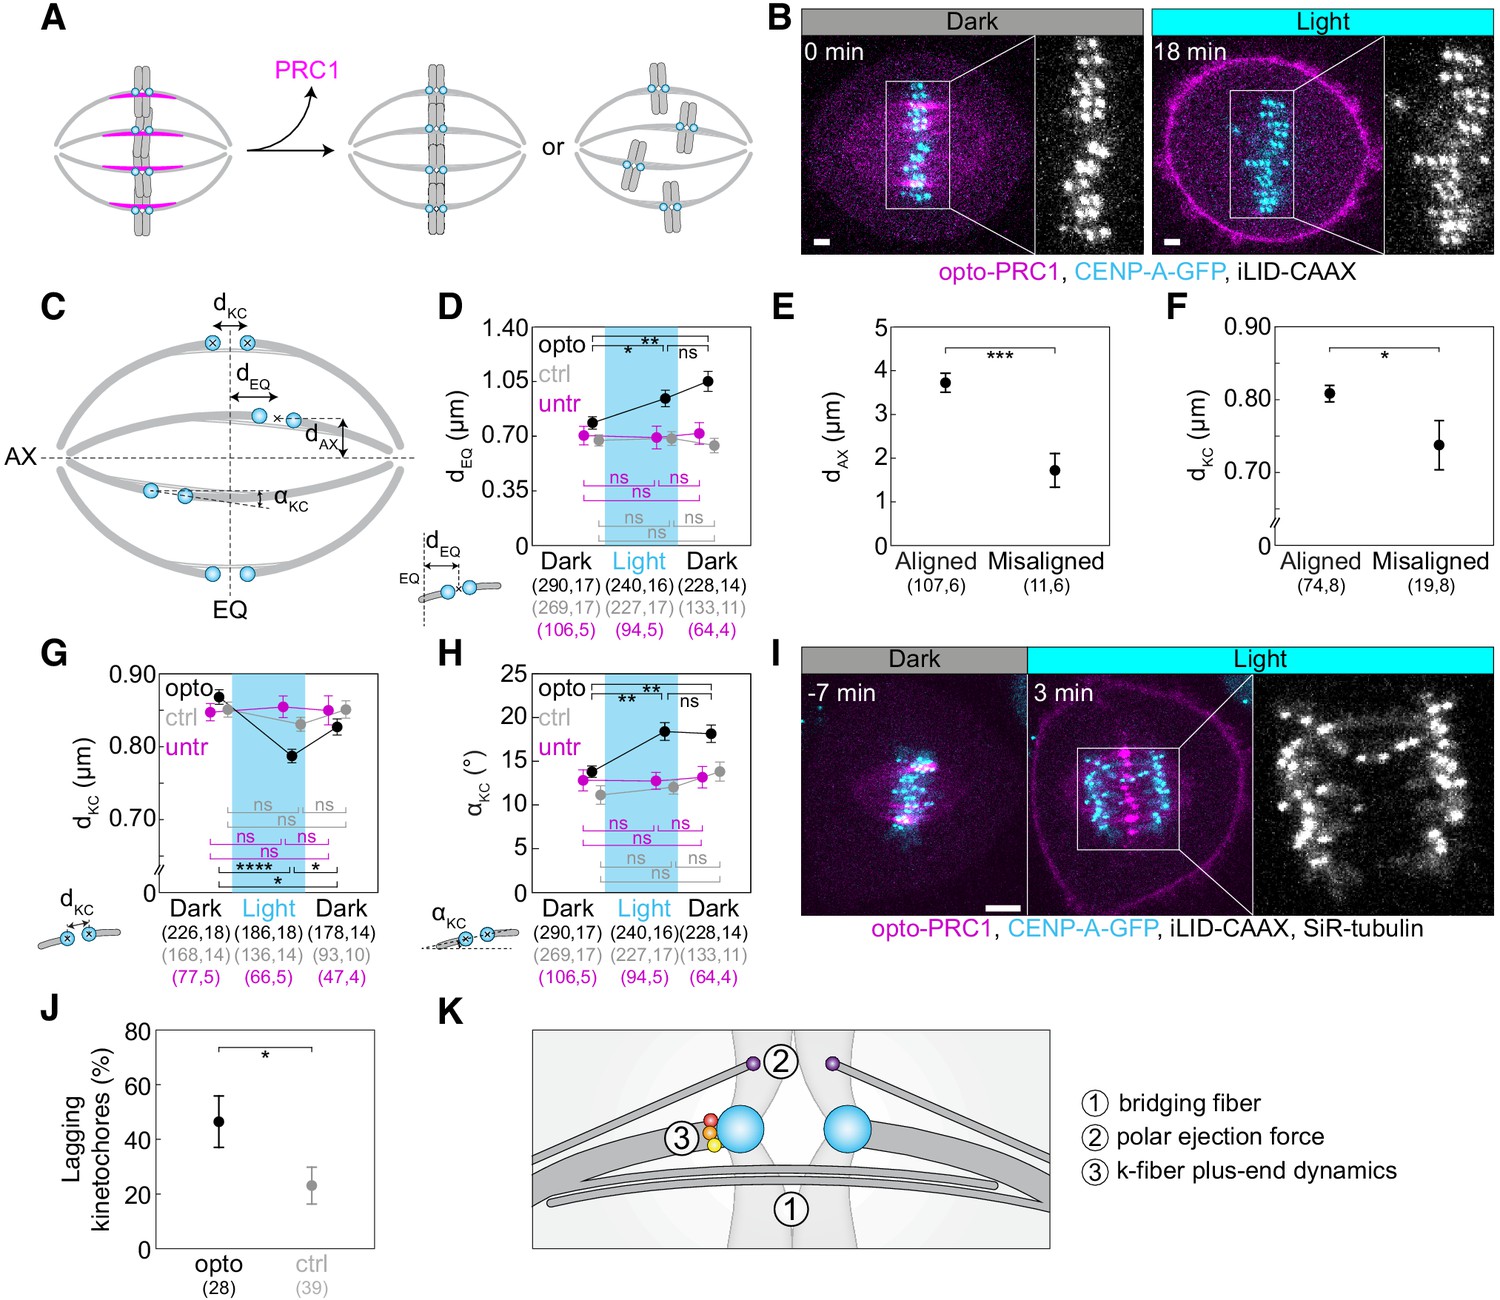
(A) Schematic representation of possible outcomes of acute removal of PRC1 from the spindle on chromosome alignment. (B) Spindle in a U2OS cell stably expressing CENP-A-GFP (cyan) with transient expression of opto-PRC1 (magenta) and iLID-CAAX before (0 min, Dark), and at the end of continuous exposure to the blue light (18 min, right). Enlargements show kinetochores only. Scale bar; 2 µm. (C) Schematic of measured parameters. dKC, inter-kinetochore distance; dEQ, distance between sister kinetochore midpoint and equatorial plane (EQ); αKC, angle between sister kinetochore axis and spindle long axis (AX); dAX, distance between sister kinetochore midpoint and spindle long axis. (D) Measurements of dEQ in opto (black), control (gray), and untreated (magenta) cells before (0 min, Dark), at the end of continuous exposure (20 min, Light) and 10 min after cessation of exposure to the blue light (30 min, Dark), in U2OS cells expressing CENP-A-GFP. (E) dAX of aligned (dEQ < 2 µm) and misaligned (dEQ = 2.5 ± 0.2 µm) kinetochore pairs upon PRC1 removal. (F) dKC of aligned and misaligned kinetochore pairs upon PRC1 removal. (G) Measurements of dKC. Legend as in D. (H) Measurements of αKC. Legend as in D. (I) Time-lapse images of a spindle in a U2OS cell as in B, stained with SiR-tubulin (not shown). Anaphase onset is at time 0 min. Lagging kinetochores can be seen at 3 min (middle). Enlargement shows kinetochores only. Scale bar: 5 µm. (J) Occurrence of lagging kinetochores in anaphase of opto (black) and control (gray) U2OS cells. (K) Schematic of three mechanisms that could be involved in kinetochore alignment. Cyan rectangles inside graphs indicate exposure to the blue light. Numbers in brackets denote measurements and cells; single numbers denote cells. In D, G, H, opto cells include those with and without SiR-tubulin, control cells without iLID are SiR-tubulin only, whilst untreated cells include only those without SiR-tubulin. Kinetochore parameters in control cells and untreated cells were similar; dKC p = 0.69; one-way ANOVA, dEQ p = 0.88, αKC p = 0.27; Kruskal-Wallis rank sum test. All images are maximum intensity projections of three z-planes, smoothed with 0.5-pixel-sigma Gaussian blur. Error bars; s.e.m. Statistical analysis; Kruskal-Wallis rank sum test followed by pairwise Wilcoxon rank sum test (D, H), one-way ANOVA followed by Tukey Honest Significant Difference (HSD) post hoc test (G), t-test (E, F), two-proportions z-test (J). p-value legend:<0.0001 (****), 0.0001 to 0.001 (***), 0.001 to 0.01 (**), 0.01 to 0.05 (*),≥0.05 (ns).
Figure 2—figure supplement 1
Quantification of kinetochore misalignment, misorientation and tension upon PRC1 removal.
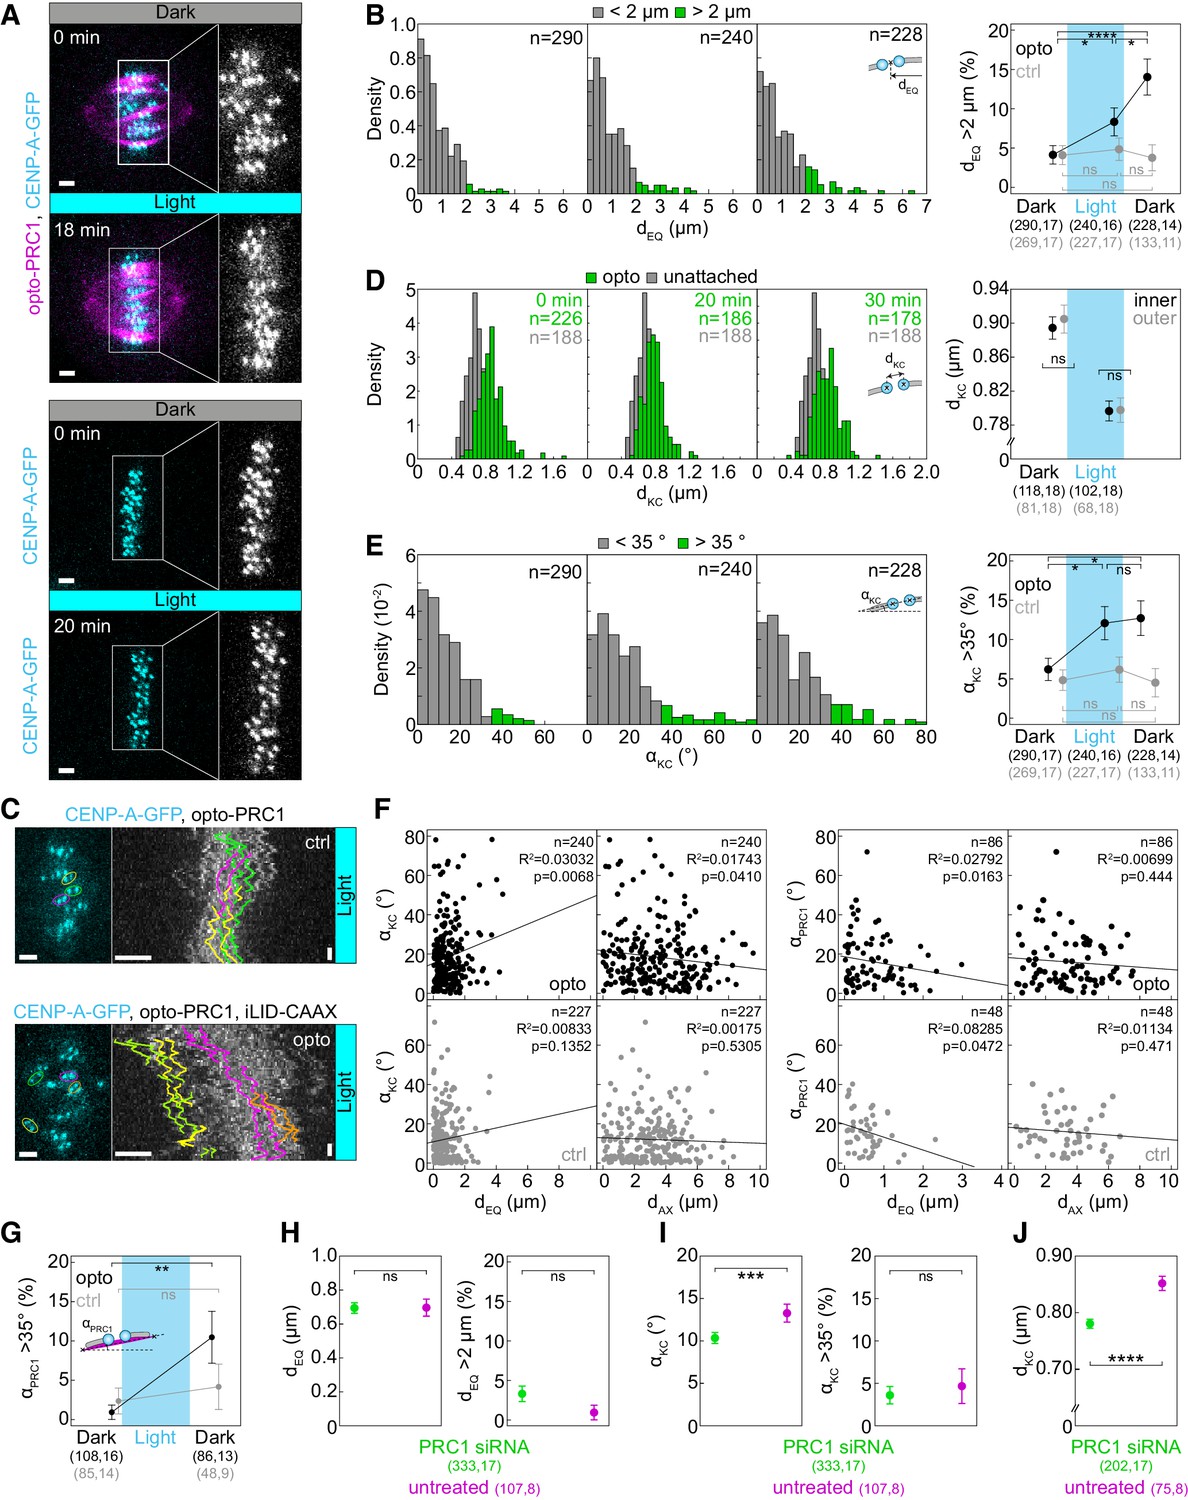
(A) Spindle in a U2OS cell stably expressing CENP-A-GFP (cyan) with (top) and without (bottom) transient expression of opto-PRC1 (magenta) before (0 min, Dark) and at the end of continuous exposure to the blue light (18 min and 20 min, respectively, bottom). Enlargements of the boxed regions show kinetochores only. Images are maximum intensity projections of three z-planes, smoothed with 0.5-pixel Gaussian blur. (B) Density histograms (left) of the distance from the midpoint between sister kinetochores to the equatorial plane, dEQ, for opto U2OS cells before (0 min, left), at the end of continuous exposure (20 min, middle) and 10 min after cessation of exposure to the blue light (30 min, right). dEQ greater (green) and lesser than 2 µm (gray) is shown. This corresponds to roughly 95th percentile of opto data before system activation. Percentage of dEQ greater than 2 µm in opto (black) and control (gray) cells (right). (C) Metaphase plates (left) of control (top) and opto (bottom) U2OS cell expressing CENP-A-GFP (cyan). Corresponding kymographs (right) show kinetochore fluctuations during last 10 min of 20 min exposure to the blue light, when there was no PRC1 on the spindle in opto cells. Kinetochore tracks (right) are color-coded with respect to corresponding sister pairs (left). Note that in opto cell (bottom) the displaced kinetochores (yellow, green) showed similar extent of oscillations as non-displaced kinetochores in opto (bottom) and all in control (top) cells (N = 10 cells in each condition). Vertical scale bar; 1 min. (D) Density histograms (left) of inter-kinetochore distance, dKC, for opto U2OS cells (green) for time-points as in B, overlaid on density histogram of unattached dKC from early prometaphase cells (mean: 0.66 ± 0.01 µm, N = 7, n = 188) (gray). Inter-kinetochore distance (dKC) (right) of inner (black) and outer (gray) kinetochore pairs before and 20 min after exposure to the blue light. (E) Density histogram (left) of angle between sister kinetochore axis and the long spindle axis, αKC, for opto U2OS cells for time-points as in B. αKC greater (green) and lesser than 35° (gray) is shown. This corresponds to roughly 95th percentile of opto data before system activation. Percentage of αKC greater than 35° in opto (black) and control (gray) cells (right). (F) Graphs show αKC versus corresponding dEQ and the distance from the midpoint between sister kinetochores to the long spindle axis, dAX (left), and αPRC1 versus dEQ and dAX (right) in opto (top, black) and control (bottom, gray) cells. Kinetochore parameters correspond to 20 min after continuous exposure to the blue light, and PRC1 parameters correspond to 10 min after cessation of exposure. Note that PRC1 is not on the spindle at 20 min in opto cells. Black lines show linear regression. (G) Percentage of angles between the line connecting the end points of the PRC1 streak and the long spindle axis, αPRC1, greater than 35° in opto (black) and control (gray) cells before exposure and 10 min after cessation of exposure to the blue light. (H) Measurements of dEQ and percentage of dEQ greater than 2 µm in untreated (magenta) and PRC1 siRNA-treated (green) U2OS cells with stable expression of CENP-A-GFP and stained with SiR-tubulin. (I) Measurements of αKC and percentage of αKC greater than 35° in cells as in H. (J) Measurements of dKC in cells as in H. Cyan rectangles inside graphs indicate exposure to the blue light. Numbers in brackets; number of measurements and cells, respectively. Time: min. n; number of measurements. Horizontal scale bars; 2 µm. Statistical analysis: two-proportions z-test (B, E, G, H (right), I (right)), t-test (D, J), Mann-Whitney test (H (left), I (left)). R2, coefficient of determination. p-value legend as in Figure 2.
Figure 2—figure supplement 2
Characterization of lagging kinetochores upon PRC1 removal.
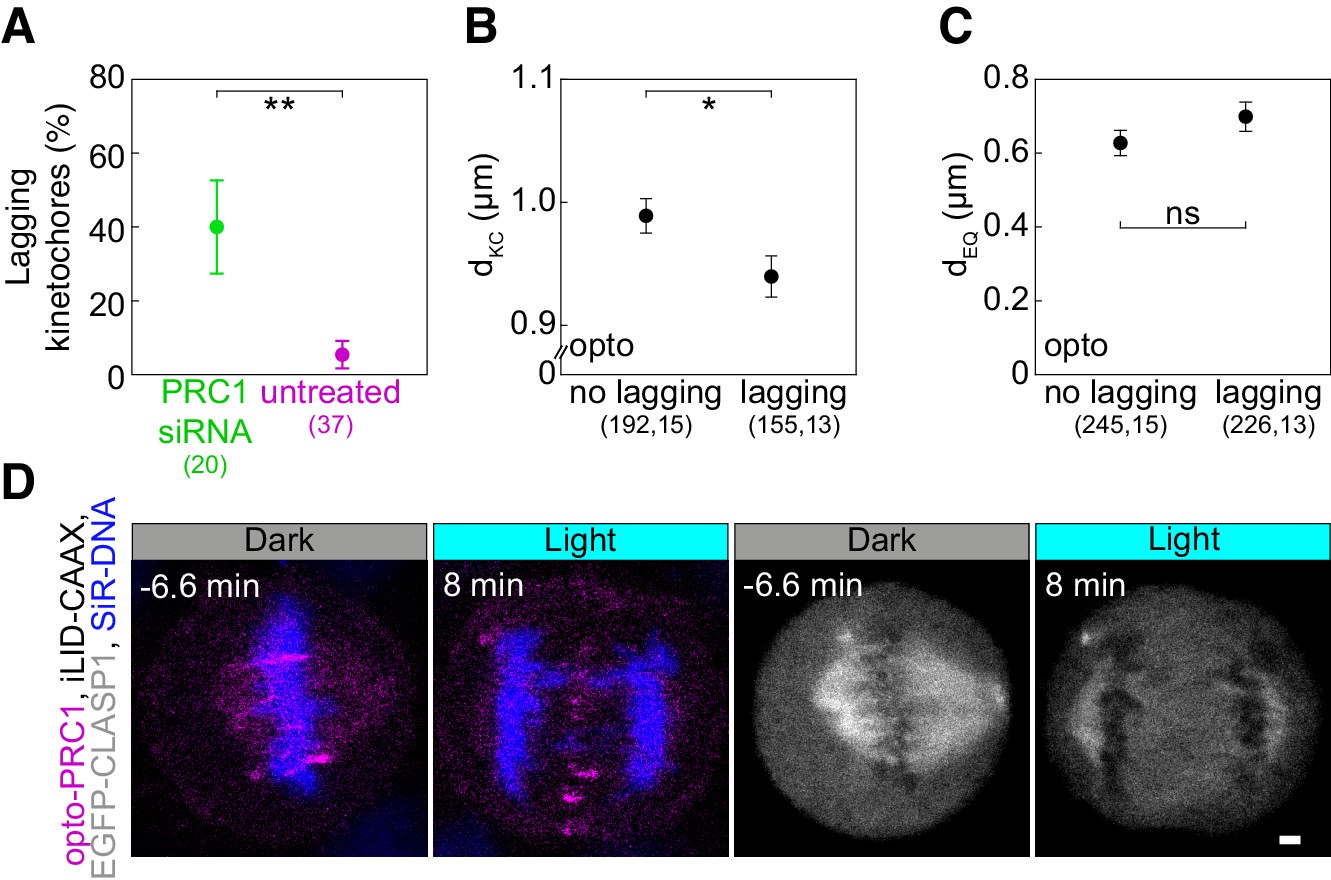
(A) Occurrence of lagging kinetochores in anaphase of untreated (magenta) and PRC1 siRNA-treated (green) U2OS cells with stable expression of CENP-A-GFP and stained with SiR-tubulin. (B) dKC in opto anaphase cells with and without lagging kinetochores. (C) dEQ in cells as in B. (D) Time-lapse images of HeLa cell stably expressing EGFP-CLASP1 with transient expression of opto-PRC1 (magenta) and iLID-CAAX, and stained with SiR-DNA (blue). Left (merge opto-PRC1 and SiR-DNA), right (EGFP-CLASP1, gray). Images are maximum intensity projections of three z-planes, smoothed with 0.5-pixel Gaussian blur. Anaphase onset is set as time 0 min. Note the absence of GFP signal in the spindle midzone and lagging chromosomes at 8 min. Error bars; s.e.m. Scale bars; 2 µm. Statistical analysis; t-test and two-proportions z-test (A). p-value legend as in Figure 2.
Figure 2—video 1
U2OS cell stably expressing CENP-A-GFP (cyan), with transient expression of opto-PRC1 (magenta) and iLID-CAAX.
Note the kinetochores moving further from the equatorial plane upon PRC1 removal. The time of exposure to the blue light is indicated in the upper right corner. Time: min:s. The video corresponds to still images from Figure 2B.
Figure 2—video 2
U2OS cell stably expressing CENP-A-GFP (cyan), with transient expression of opto-PRC1 (magenta) and iLID-CAAX, and microtubules stained with SiR-tubulin (green).
Note the kinetochores lagging in the spindle midzone after anaphase onset. The time of exposure to the blue light is indicated in the upper right corner. Time: min. The video corresponds to still images from Figure 2I.
Figure 3 with 2 supplements
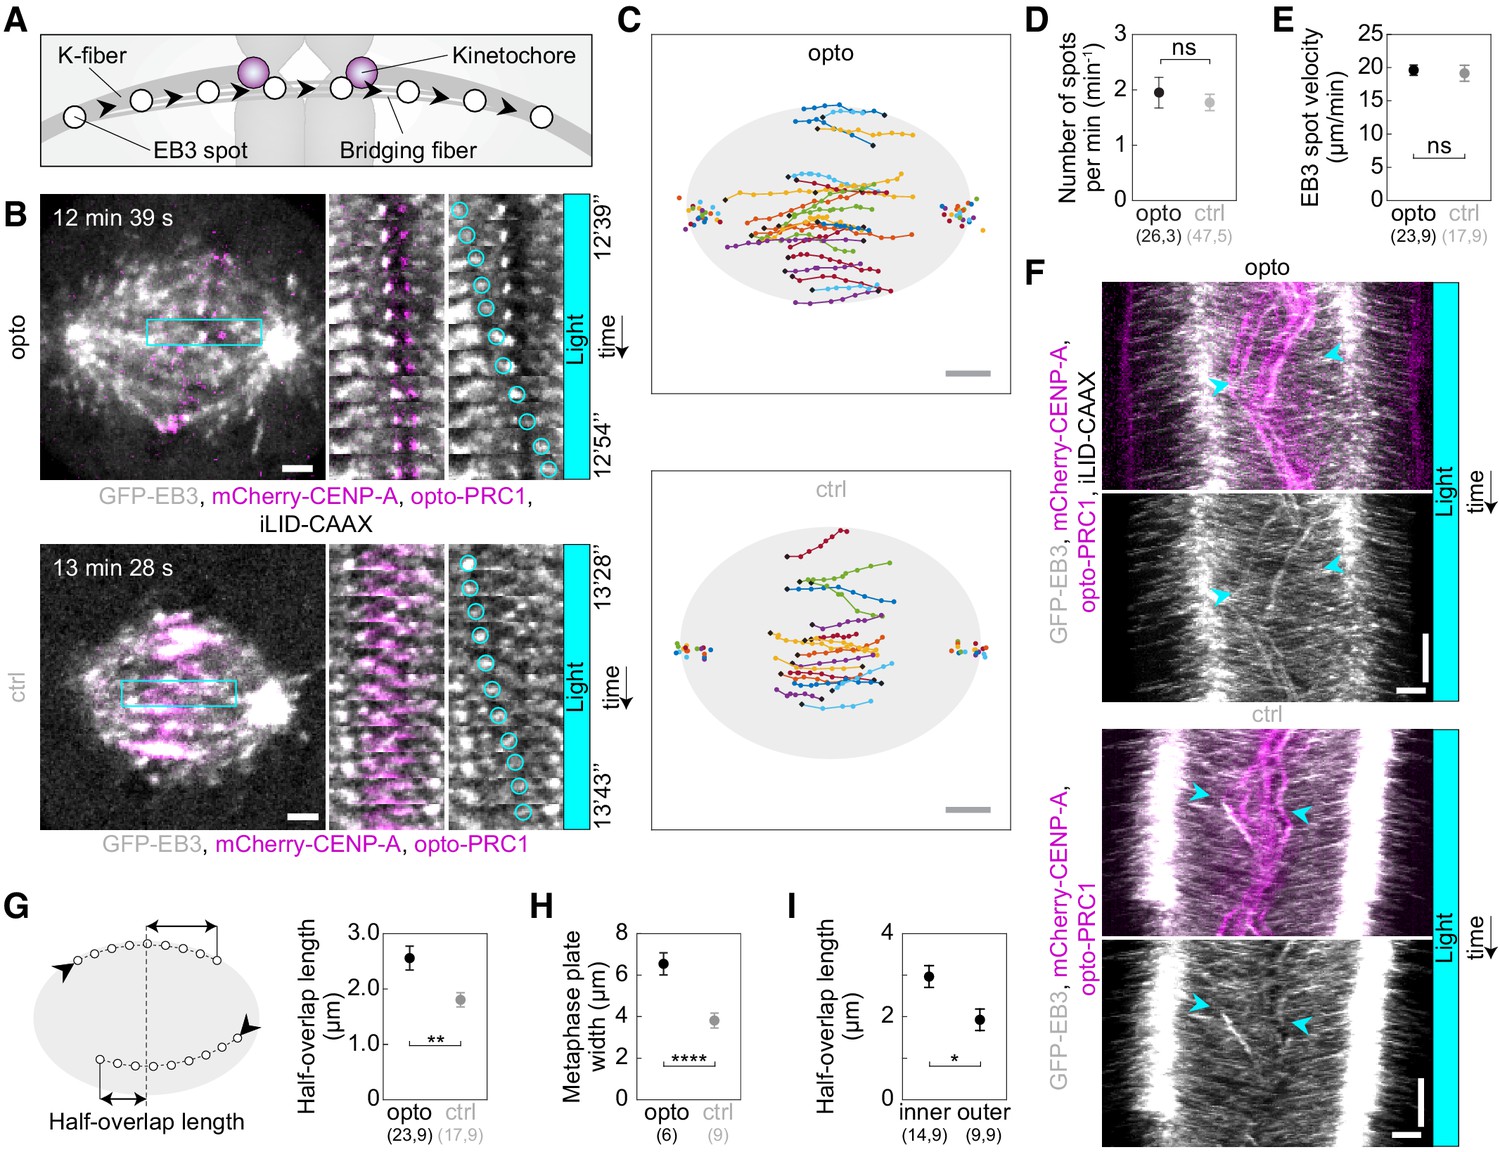
Acute removal of PRC1 elongates antiparallel overlaps within the bridging fibers.
(A) Schematic of the trajectory of an EB3-marked plus end (white circles) within the bridging fiber, defined as a spot passing the sister kinetochore region (magenta). (B) Spindles (left) in U2OS cells with stable expression of 2xGFP-EB3 (gray) and mCherry-CENP-A (magenta), depleted for endogenous PRC1, with transient expression of opto-PRC1 and iLID-CAAX (opto; top) and opto-PRC1 only (control; bottom). Montage of the boxed region over time is shown as merged channels (middle) and GFP (right; the tracked spot is encircled). The cell was exposed to the blue light for 15 min in total. In the first ten minutes PRC1 was removed from the spindle applying the usual imaging protocol for opto cells. During the last five minutes of exposure to the blue light, faster image acquisition was used in order to see and track the EB3 dynamics (see Materials and methods). Note that in opto cell (top) PRC1 is removed from the spindle. Images are single z-planes smoothed with 0.5-pixel-sigma Gaussian blur. (C) Trajectories of tracked EB3 spots (connected dots) in opto (top) and control (bottom) cells. Black dot; start of trajectory. Single dots on the sides; spindle poles. (D) Number of EB3 spots per minute within the bridging fiber in opto (black) and control (gray) cells. (E) EB3 spot velocity within the bridging fiber in opto (black) and control (gray) cells. (F) Kymographs of opto (top) and control (bottom) cells after 10 min of imaging protocol required for removal of PRC1, merge (top) and GFP (bottom). Cyan arrowheads mark the beginning and end of an individual EB3 spot trajectory. Note the difference in the position of indicated track ends with respect to the equatorial plane. (G) Half-overlap length (left) defined as the distance (double arrow) between the end-point of the EB3 spot trajectory and the equatorial plane (dashed line). Black arrowhead; start of trajectory. Half-overlap length (right) in opto (black) and control (gray) cells measured as in scheme (left) and retrieved from tracks shown in B (right). (H) Metaphase plate width in opto (black) and control (gray) cells measured from kymographs as the largest distance between kinetochore pairs positioned on the opposite sides of the spindle equator in the first two minutes after 10 min of imaging protocol required for removal of PRC1. As kinetochores remain within the PRC1-labeled region in control cells, the metaphase plate width in these cells was measured as the PRC1 streak length. (I) Half-overlap length in opto cells for inner (dAX ≤ 2 µm) and outer (dAX > 2 µm) overlaps. Filled cyan rectangles indicate exposure to the blue light. Numbers in brackets denote measurements and cells; single numbers denote cells. Error bars; s.e.m. Scale bars; 2 µm. Statistical analysis; t-test. p-value legend as in Figure 2.
Figure 3—figure supplement 1
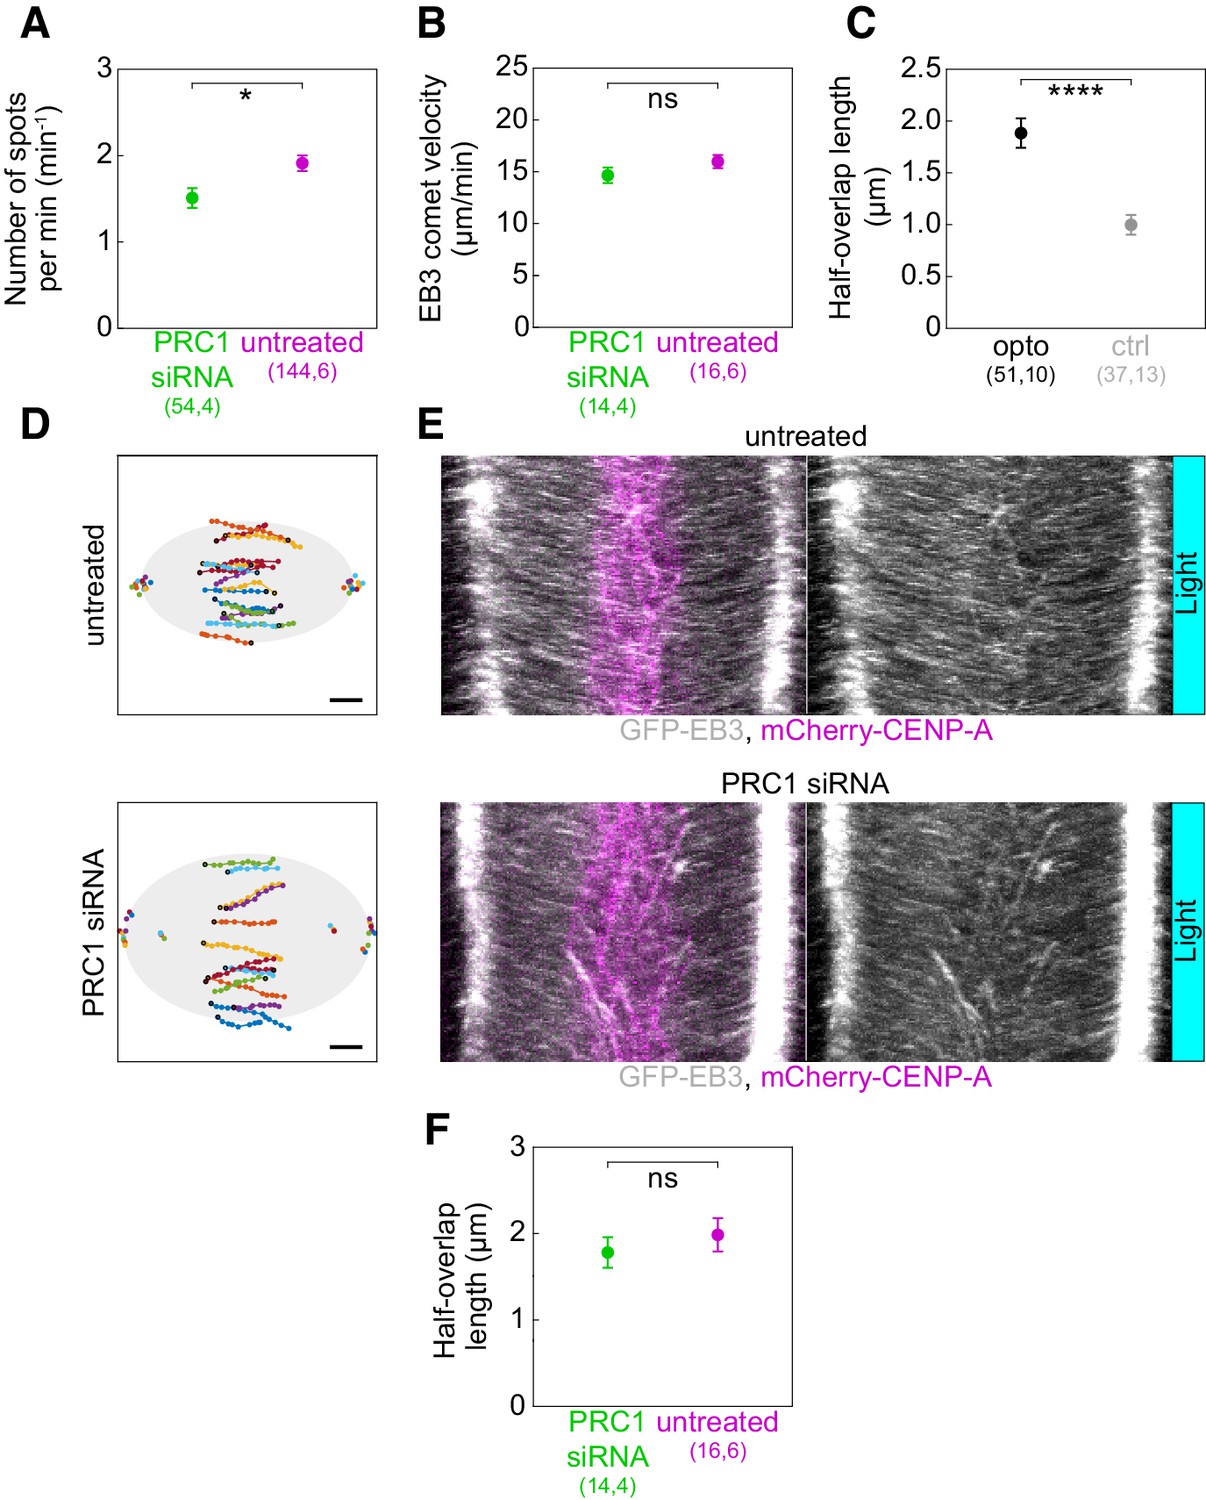
Long-term PRC1 depletion shows no effect on the length of antiparallel overlaps.
(A) Number of EB3 spots per minute within the bridging fiber in untreated (magenta) and PRC1 siRNA-treated (green) cells. (B) Velocity of EB3 spots within the bridging fiber in untreated (magenta) and PRC1 siRNA-treated (green) cells. (C) Half-overlap length in opto (black) and control (gray) U2OS cells expressing 2xGFP-EB3 measured from kymographs as in Figure 3F, as the distance of spot’s track end-point to the equatorial plane. All measurements were performed within 2 min following the 10 min imaging protocol required for removal of PRC1. (D) Trajectories of all tracked EB3 spots (connected dots) in untreated (top) and PRC1 siRNA (bottom)-treated U2OS cells expressing 2xGFP-EB3. Black dot; start of trajectory. Single dots on the left and the right side; spindle poles. (E) Kymographs of untreated (top) and PRC1 siRNA (bottom)-treated U2OS cells expressing 2xGFP-EB3 after 10 min of imaging protocol required for removal of PRC1. Left (merge CENP-A and EB3), right (EB3, gray). (F) Half-overlap length in untreated (magenta) and PRC1 siRNA (green)-treated U2OS cells expressing 2xGFP-EB3 measured as in Figure 3G and retrieved from tracks showed in D. Filled cyan rectangles indicate exposure to the blue light. Numbers in brackets denote measurements and cells; single numbers denote cells. Error bars: s.e.m. Scale bars: 2 µm. Statistical analysis: t-test. p-value legend as in Figure 2.
Figure 3—video 1
U2OS cell stably expressing 2x-GFP-EB3 (gray) and mCherry-CENP-A (magenta), with transient expression of opto-PRC1 (magenta; control, top), and opto-PRC1 (magenta), and iLID-CAAX (opto, bottom).
Left (merge), right (GFP). The time indicated in the upper left corner corresponds to the time after 10 min of slower image acquisition required for opto-PRC1 removal from the spindle. Time:sec. The video corresponds to still images from Figure 3B.
Figure 4 with 2 supplements
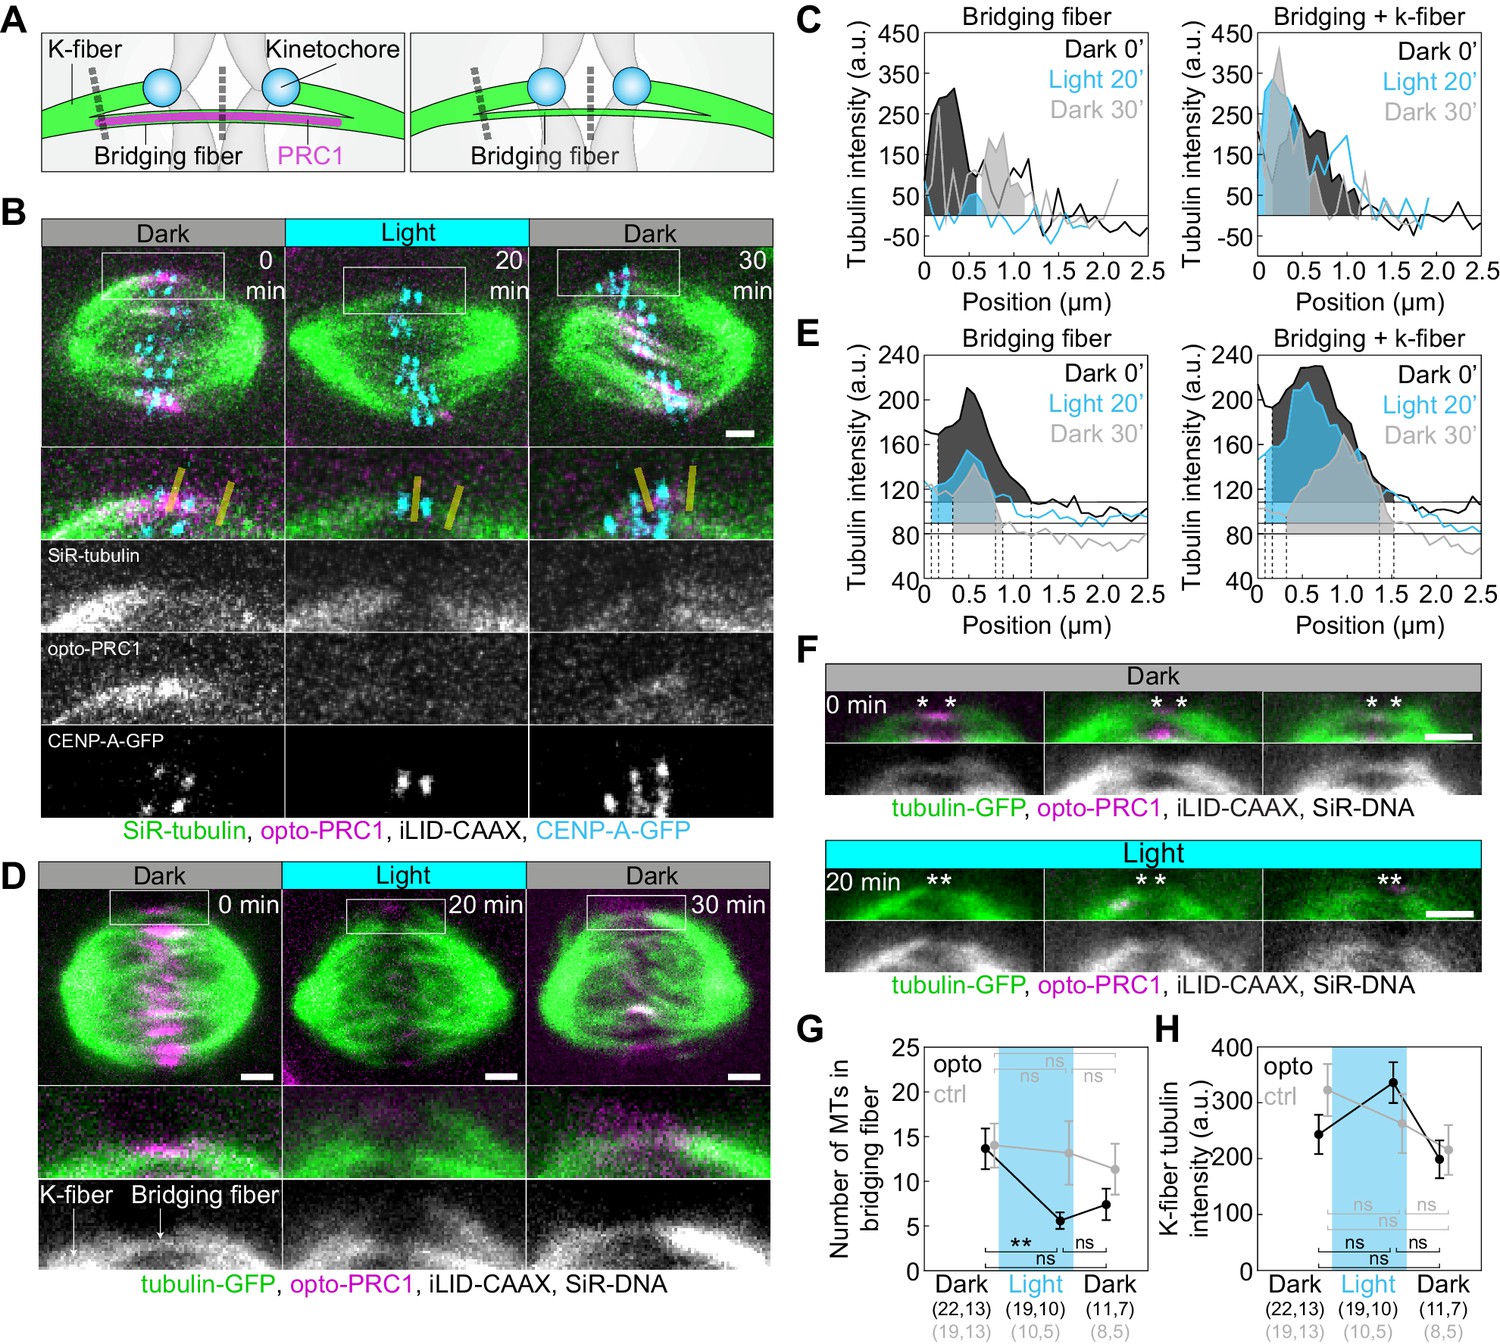
Optogenetic removal of PRC1 reduces bridging fibers.
(A) Schematic of PRC1 (magenta) removal from bridging fibers and positions where bridging fiber and bridging and k-fiber tubulin (green) intensities were measured (dashed lines). (B) Spindle in a U2OS cell with stable expression of CENP-A-GFP (cyan), depleted for endogenous PRC1, with transient expression of opto-PRC1 (magenta) and iLID-CAAX, and stained with SiR-tubulin (green), before exposure to the blue light (0 min, Dark), at the end of continuous exposure to the blue light (20 min, Light), and 10 min after cessation of exposure to the blue light (30 min, Dark). Enlargements of the boxed region (first: merge, second: SiR-tubulin, third: opto-PRC1, fourth: CENP-A-GFP) are shown. Yellow lines represent the positions where bridging fiber and bridging and k-fiber intensities were measured. Images are a single z-plane smoothed with 0.5-pixel-sigma Gaussian blur. (C) Background-corrected SiR-tubulin intensity profiles of the bridging fiber (left) and bridging and k-fiber (right) for cell shown in B (0 min, black; 20 min, cyan; 30 min, gray). (D) Spindle in a HeLa cell with stable expression of tubulin-GFP (green), depleted for endogenous PRC1, with transient expression of opto-PRC1 (magenta) and iLID-CAAX, and stained with SiR-DNA (not shown), before exposure to the blue light (0 min, Dark, left), at the end of continuous exposure to the blue light (20 min, Light, middle) and 10 min after cessation of exposure to the blue light (30 min, Dark, right). Enlargements of the boxed region (middle: merge, bottom: tubulin-GFP) are shown. Note that at 20 min opto-PRC1 is absent from the spindle. (E) Graphs showing tubulin-GFP intensity profiles of the bridging fiber (left) and bridging and k-fiber (0 min, black; 20 min, cyan; 30 min, gray) for cell shown in D. Horizontal line marks the background signal, vertical dashed lines delimit the area (shaded) where signal was measured. (F) Enlargements of spindles in HeLa cells with stable expression of tubulin-GFP (green), depleted for endogenous PRC1, with transient expression of opto-PRC1 (magenta) and iLID-CAAX, and stained with SiR-DNA (not shown), before exposure to the blue light (0 min, Dark, top; first row: merge, second row: tubulin-GFP) and at the end of continuous exposure to the blue light (20 min, Light, bottom; first row: merge, second row: tubulin-GFP). Note that at 20 min opto-PRC1 is absent from the spindle. Images do not belong to the same cell. Asterisks mark the position of kinetochores. All images are single z-plane smoothed with 0.5-pixel-Gaussian blur. Scale bar; 2 µm. (G) Number of microtubules in the bridging fiber in opto HeLa cells (that is, where opto-PRC1 was removed; black) and control (gray) in same time-points as in D. The bridging fiber intensity in control cells before exposure to the blue light is set to correspond to 14 microtubules (see Figure 4—figure supplement 1D). (H) Tubulin-GFP signal of k-fibers in opto (black) and control (gray) HeLa cells at time-points as in D. Cyan rectangles inside graphs indicate exposure to the blue light. Numbers in brackets; number of measurements and cells, respectively. Error bars; s.e.m. Scale bars; 2 µm. Statistical analysis; one-way ANOVA followed by Tukey HSD post hoc test, t-test (G, H). p-value legend as in Figure 2.
Figure 4—figure supplement 1
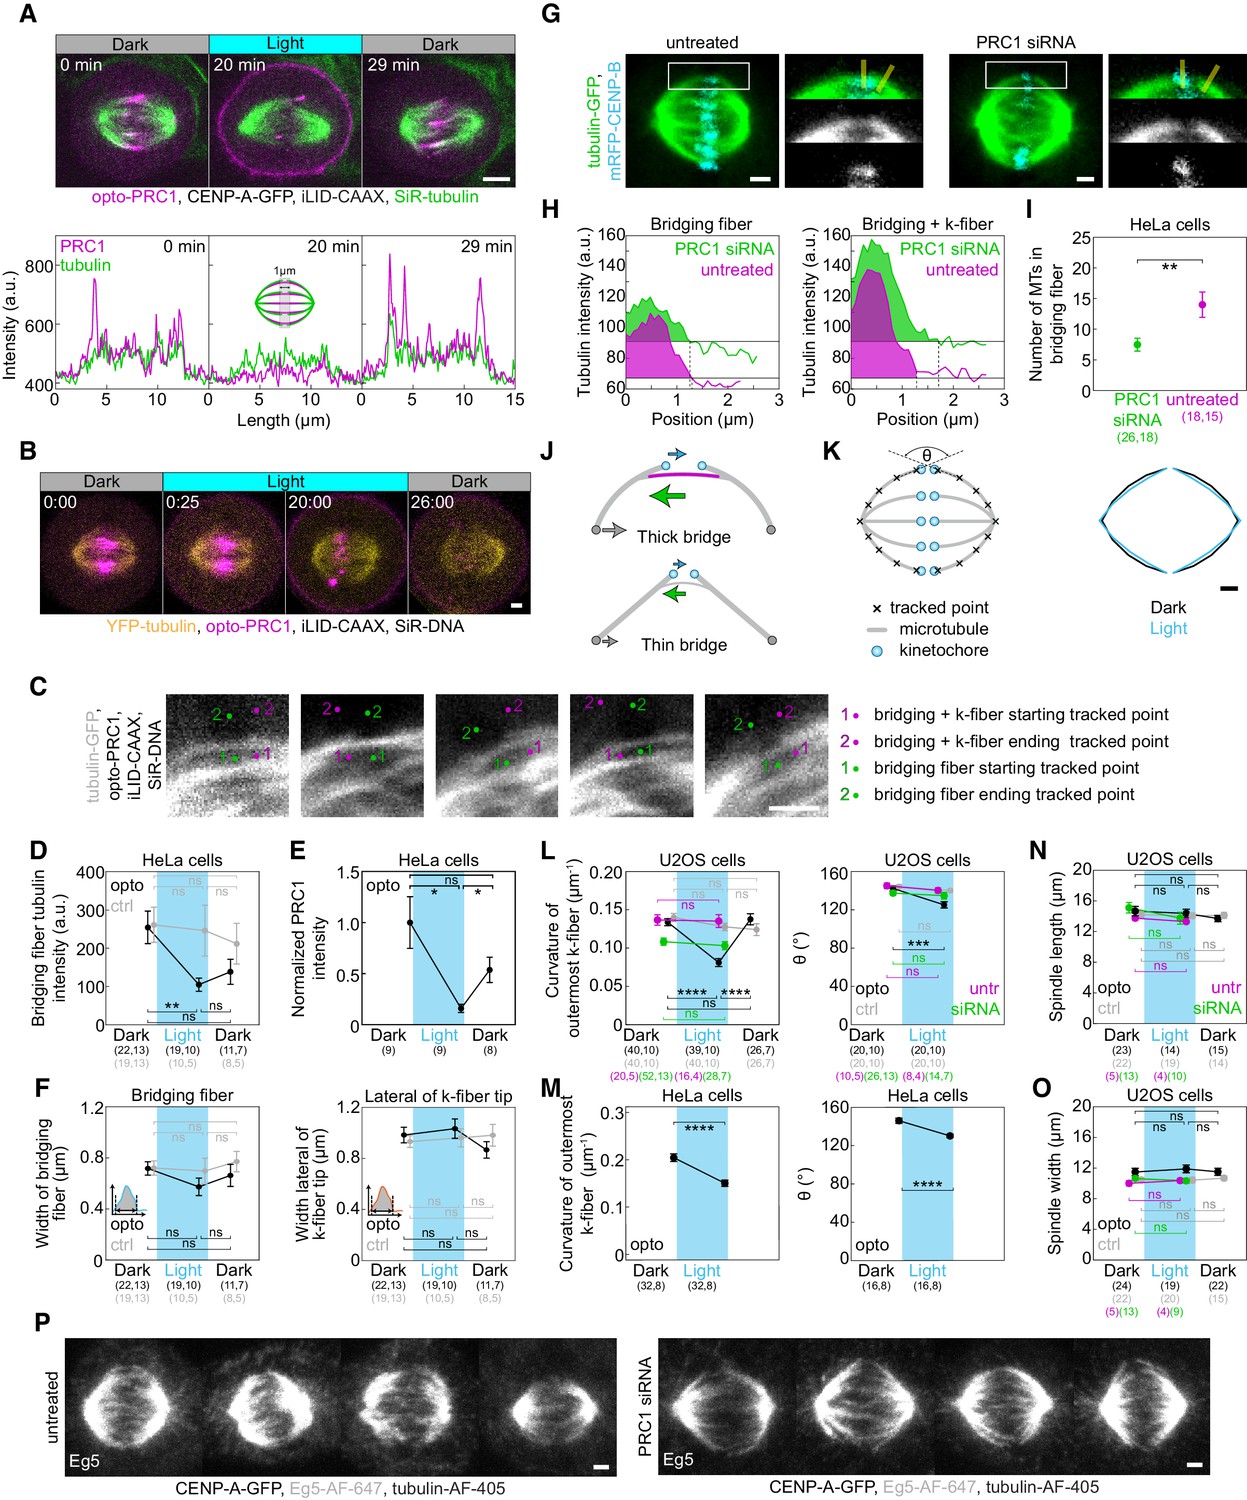
Reduction of bridging fibers straightens the spindle contour.
(A) Spindle in a U2OS cell stably expressing CENP-A-GFP (not shown), with transient expression of opto-PRC1 (magenta) and iLID-CAAX, and stained with SiR-tubulin (green) before (0 min, Dark), at the end of continuous exposure (20 min, Light) and 9 min after cessation of exposure to the blue light (29 min, Dark). Graphs (bottom) correspond to signal intensity profiles of opto-PRC1 (magenta) and SiR-tubulin (green) taken across equatorial plane in shown spindles. The signal intensity profile was taken in 10 cells and the similar decrease of SiR-tubulin signal intensity after opto-PRC1 removal was observed in 9/10 cells. Profile intensities were acquired on individual z-planes using a 1-µm-thick line across the spindle midzone. Images are individual z-plane, smoothed with 0.5-pixel-sigma Gaussian blur. Scale bar; 5 µm. (B) Time-lapse image of a HeLa cell stably expressing YFP-tubulin (yellow), transiently opto-PRC1 (magenta) and iLID-CAAX and stained with SiR-DNA dye (not shown). In 0:00 (Dark), 561 (opto-PRC1), and 514 (tubulin) + 652 (SiR-DNA) nm lasers are used stack-sequentially. From 0:25-20:00 (Light), 561 and 488+514+652 nm lasers are used stack-sequentially, every 25 s. Note that in 0:00 min, opto-PRC1 is not present on the membrane as in Figure 1B. However, in the first frame of Light sequence, 0:25, weak signal of opto-PRC1 is present on the membrane even though opto-PRC1 was imaged in stack before 488 nm laser was on. Also, opto-PRC1 is visible on the membrane 6 min after (26:00, Dark) 488 nm laser was turned off. This is a consequence of 514 nm laser, used to visualize YFP, being able to activate optogenetic system. (C) Examples how bridging fiber and bridging and k-fiber intensities were measured in cells as in Figure 4D, where green and magenta dots denote starting (1) and ending positions (2) of a line drawn to obtain signal intensities of bridging and bridging and k-fiber, respectively. (D) Tubulin-GFP signal intensity of the bridging fibers in opto (black) and control (gray) HeLa cells before (0 min, Dark), at the end of continuous exposure (20 min, Light) and 10 min after cessation of exposure to the blue light (30 min, Dark). Signal intensity is measured as the area under the peak shown in Figure 4E. (E) Graph showing normalized PRC1 intensity on the spindle in opto HeLa tubulin-GFP cells used for measurements in D. (F) Width of the bridging fiber (left) and microtubule bundle lateral from k-fiber tip (right) in opto (black) and control (gray) HeLa cells at time-points as in D, measured as shown in schemes (lower left corners). (G) Spindles in HeLa cells with stable expression of tubulin-GFP (green) and transient expression of mRFP-CENP-B (cyan) in untreated (left) or PRC1 siRNA-treated (right) cells. Enlargements of the boxed regions (first row: merge, second row: tubulin-GFP, third row: mRFP-CENP-B) are shown. (H) Graphs showing tubulin-GFP intensity profiles of the bridging fiber (left) and bridging and k-fiber (right) for cells shown in G (PRC1 siRNA-treated (green), untreated (magenta)). (I) Number of microtubules in the bridging fiber in untreated (magenta) and PRC1 siRNA-treated (green) HeLa cells as in G. The bridging fiber intensity in untreated cells is set to correspond to 14 microtubules. (J) Top: Schematic of force-balance in the spindle where compression in the bridging fiber (green arrow) balances compression at the poles (gray arrow) and tension at kinetochores (cyan arrow). Bottom: Upon PRC1 removal, reduction of number of microtubules in the bridging fiber is expected to reduce compression in the bridging fiber and at the poles, leading to k-fiber straightening. (K) Outermost k-fiber contours (right) in opto U2OS cells before (black, Dark) and at the end of continuous exposure to the blue light (cyan, Light) plotted by connecting mean positions of all tracked points. Scheme (left) depicts how contours were tracked. θ; angle between outermost k-fibers. (L) Curvature of the outermost k-fibers (left) in opto (black) and control (gray) U2OS cells in same time-points as in Figure 4B. Angle between outermost k-fibers (right) in opto (black) and control (gray) U2OS cells at first two time-points as in Figure 4B. (M) Curvature (left) and angle between (right) of the outermost k-fibers in HeLa cells. (N) Spindle length in opto (black), control (gray), PRC1 siRNA-treated (green) and untreated (magenta) U2OS cells at timepoints as in D. (O) Spindle width in U2OS cells as in N. (P) Metaphase spindles in fixed U2OS cells stably expressing CENP-A-GFP (not shown) immunostained for Eg5 (AF-647, gray) and tubulin (AF-405, not shown) in untreated (left) and PRC1 siRNA-treated cells (right). All images are sum intensity projections of five z-planes. Scale bar; 2 µm. Cyan rectangles inside graphs indicate exposure to the blue light. Numbers in brackets; number of measurements and cells, respectively. Statistical analysis: two groups data tested with t-test, three groups data with one-way ANOVA followed by Tukey HSD post hoc test. p-value legend as in Figure 2.
Figure 4—video 1
U2OS cell stably expressing CENP-A-GFP (not shown), with transient expression of opto-PRC1 (magenta) and iLID-CAAX, and microtubules stained with SiR-tubulin (green).
The time of exposure to the blue light is indicated in the upper right corner. Top: SiR-tubulin; bottom: merge. Time: min. The video corresponds to still images from Figure 4B and Figure 4—figure supplement 1A.
Figure 5 with 2 supplements
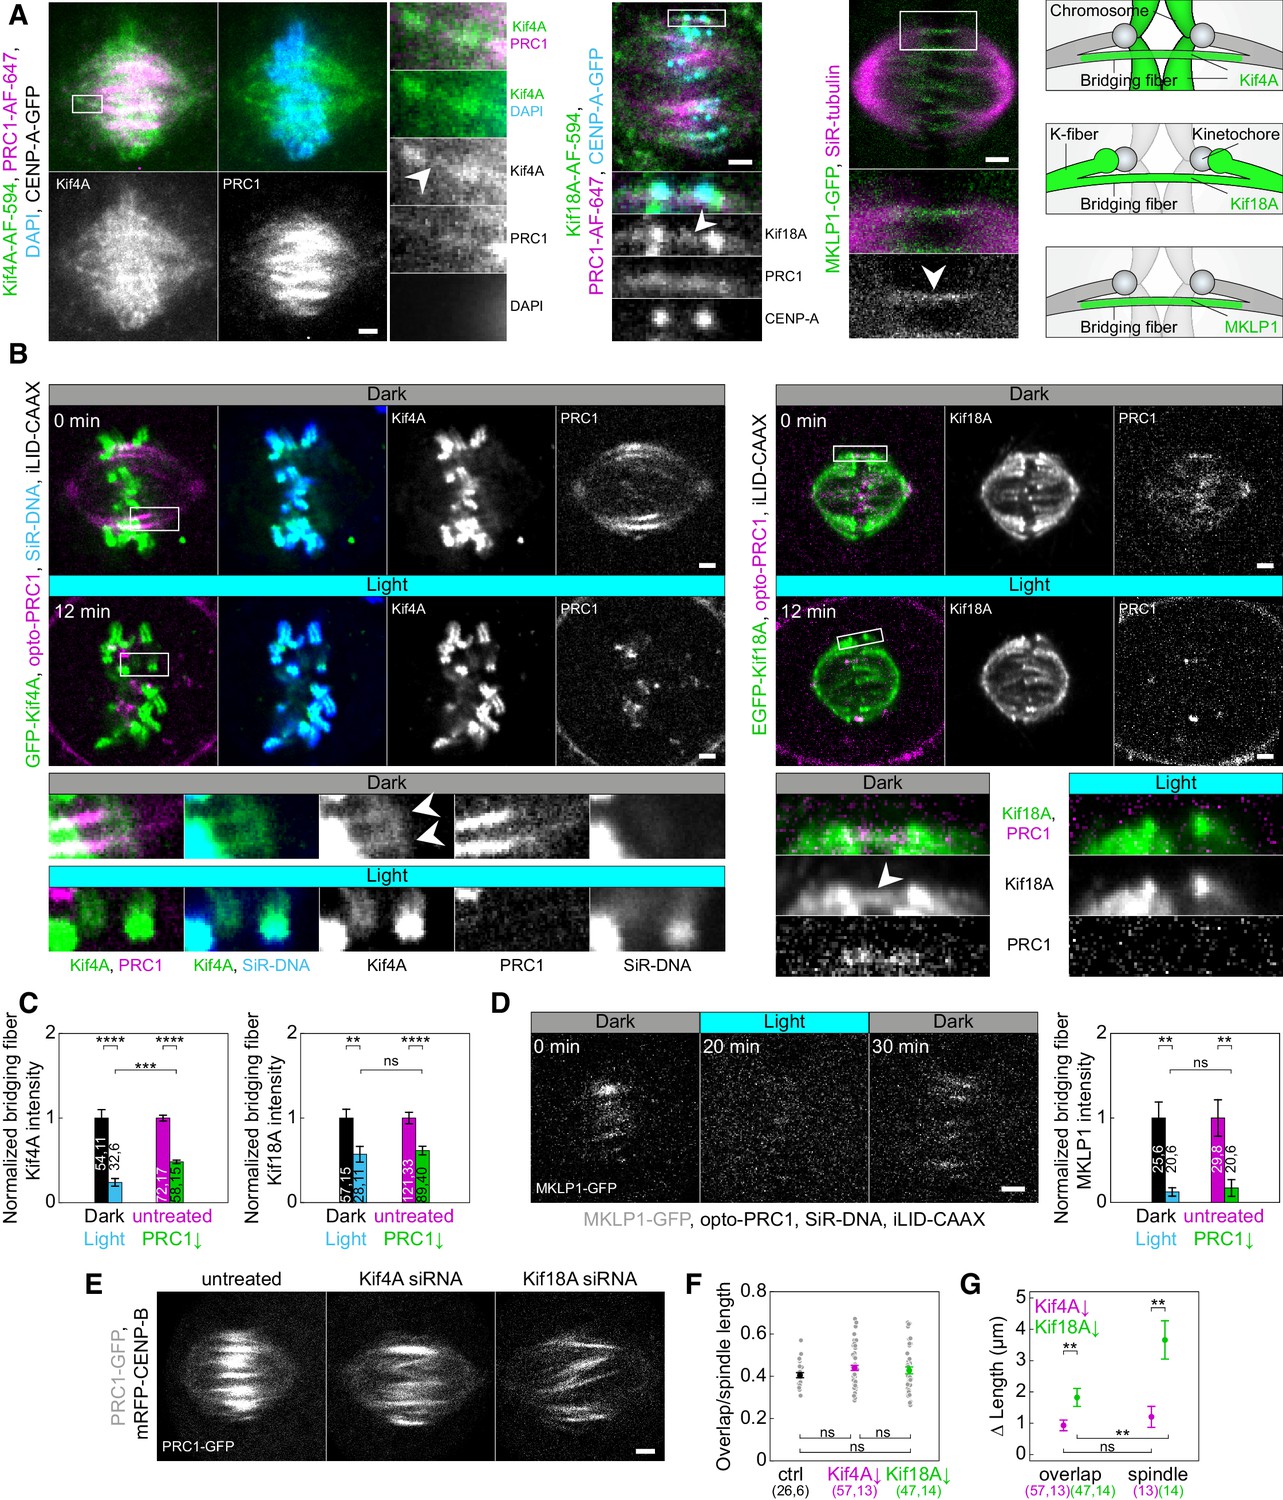
Localization of Kif4A, Kif18A, and MKLP1 after acute removal and long-term depletion of PRC1.
(A) Spindle (first block, left) in a U2OS cell with stable expression of CENP-A-GFP (not shown), immunostained for endogenous Kif4A (AF-594, green), PRC1 (AF-647, magenta) and stained with DAPI (cyan). Enlargements of the boxed region are shown (right). White arrowhead points to Kif4A outside chromosomes, at the position where PRC1-AF-647 is found, which corresponds to the bridging fiber. Spindle (middle block, top) in a U2OS cell with stable expression of CENP-A-GFP (cyan), immunostained for endogenous Kif18A (AF-594, green) and PRC1 (AF-647, magenta). Enlargements of the boxed region are shown (bottom). White arrowhead points to Kif18A in the bridging fiber where PRC1-AF-647 is found. Spindle (right block, top) of HeLa cell stably expressing MKLP1-GFP (green) and stained for SiR-tubulin (magenta). Enlargements of the boxed region are shown (bottom). White arrowhead points to the MKLP1 in the bridging fiber. Schemes (right) show Kif4A and Kif18A localization on chromosome arms and plus ends of k-fibers, respectively, and Kif4A, Kif18A, and MKLP1 in the bridging fiber. (B) Time-lapse images (left block) of unlabeled U2OS cell with transient expression of opto-PRC1 (magenta), iLID-CAAX and GFP-Kif4A (green), and stained with SiR-DNA (cyan) before (Dark, top) and after 12 min of the exposure to the blue light (Light, middle). Enlargements of the boxed regions are shown (bottom rows). Before opto-PRC1 removal (Dark) Kif4A is also found outside chromosomes, at the position of opto-PRC1 labeled bundles (white arrowheads). Note that after 12 min of opto-PRC1 removal (Light), Kif4A signal is found only at the positions of the chromosomes. The intensities in the enlargements are adjusted differently than those of the whole spindle to better point out localization of proteins. Time-lapse images (right block) of unlabeled U2OS cell with transient expression of opto-PRC1 (magenta), iLID-CAAX and EGFP-Kif18A (green) before (Dark, top) and after 12 min of the exposure to the blue light (Light, middle). Enlargements of the boxed regions are shown (bottom). Before opto-PRC1 removal (Dark, bottom left) Kif18A is found in the bridging fiber (white arrowhead). In the enlargement of the boxed region after 12 min of opto-PRC1 removal (Light, bottom right), the signal of the EGFP-Kif18A on the bridging fiber is weaker. (C) Normalized bridging fiber Kif4A (left) and Kif18A (right) intensity measured before and after acute and long-term PRC1 removal in cells as in B and A, respectively. Dark; black, Light; cyan, untreated; magenta, PRC1 siRNA; green. (D) Timelapse of the spindle in HeLa BAC cell (left) stably expressing MKLP1-GFP (gray) with transient expression of opto-PRC1 (not shown) and iLID-CAAX, and stained with SiR-DNA (not shown) before (0 min, Dark), at the end of continuous exposure (20 min, Light) and 10 min after cessation of exposure to the blue light (30 min, Dark). Note that opto-PRC1 is not shown in order to point out localization of MKLP1-GFP. Image is a maximum projection of three z-planes. Graph (right) shows normalized bridging fiber MKLP1 intensity measured before and after acute and long-term PRC1 removal in cells as in Figure 5—figure supplement 1C. (E) Spindles from HeLa cells stably expressing PRC1-GFP (gray) in untreated (left), Kif4A siRNA (middle), and Kif18A siRNA (right) -treated cell. (F) Ratios of overlap and spindle lengths for untreated (black), Kif4A siRNA (magenta), and Kif18A siRNA (green) -treated cells. Gray scattered points show individual measurements. (G) Difference in PRC1-labeled overlap and spindle length for Kif4A siRNA (magenta) and Kif18A siRNA (green) treatment when compared to untreated cells. Numbers in brackets; number of measurements and cells, respectively. Statistical analysis: t-test (C, G); one-way ANOVA (F). All images are smoothed with 0.5-pixel-sigma Gaussian blur, and one z-plane is shown unless stated otherwise. Scale bars: 2 µm.
Figure 5—figure supplement 1
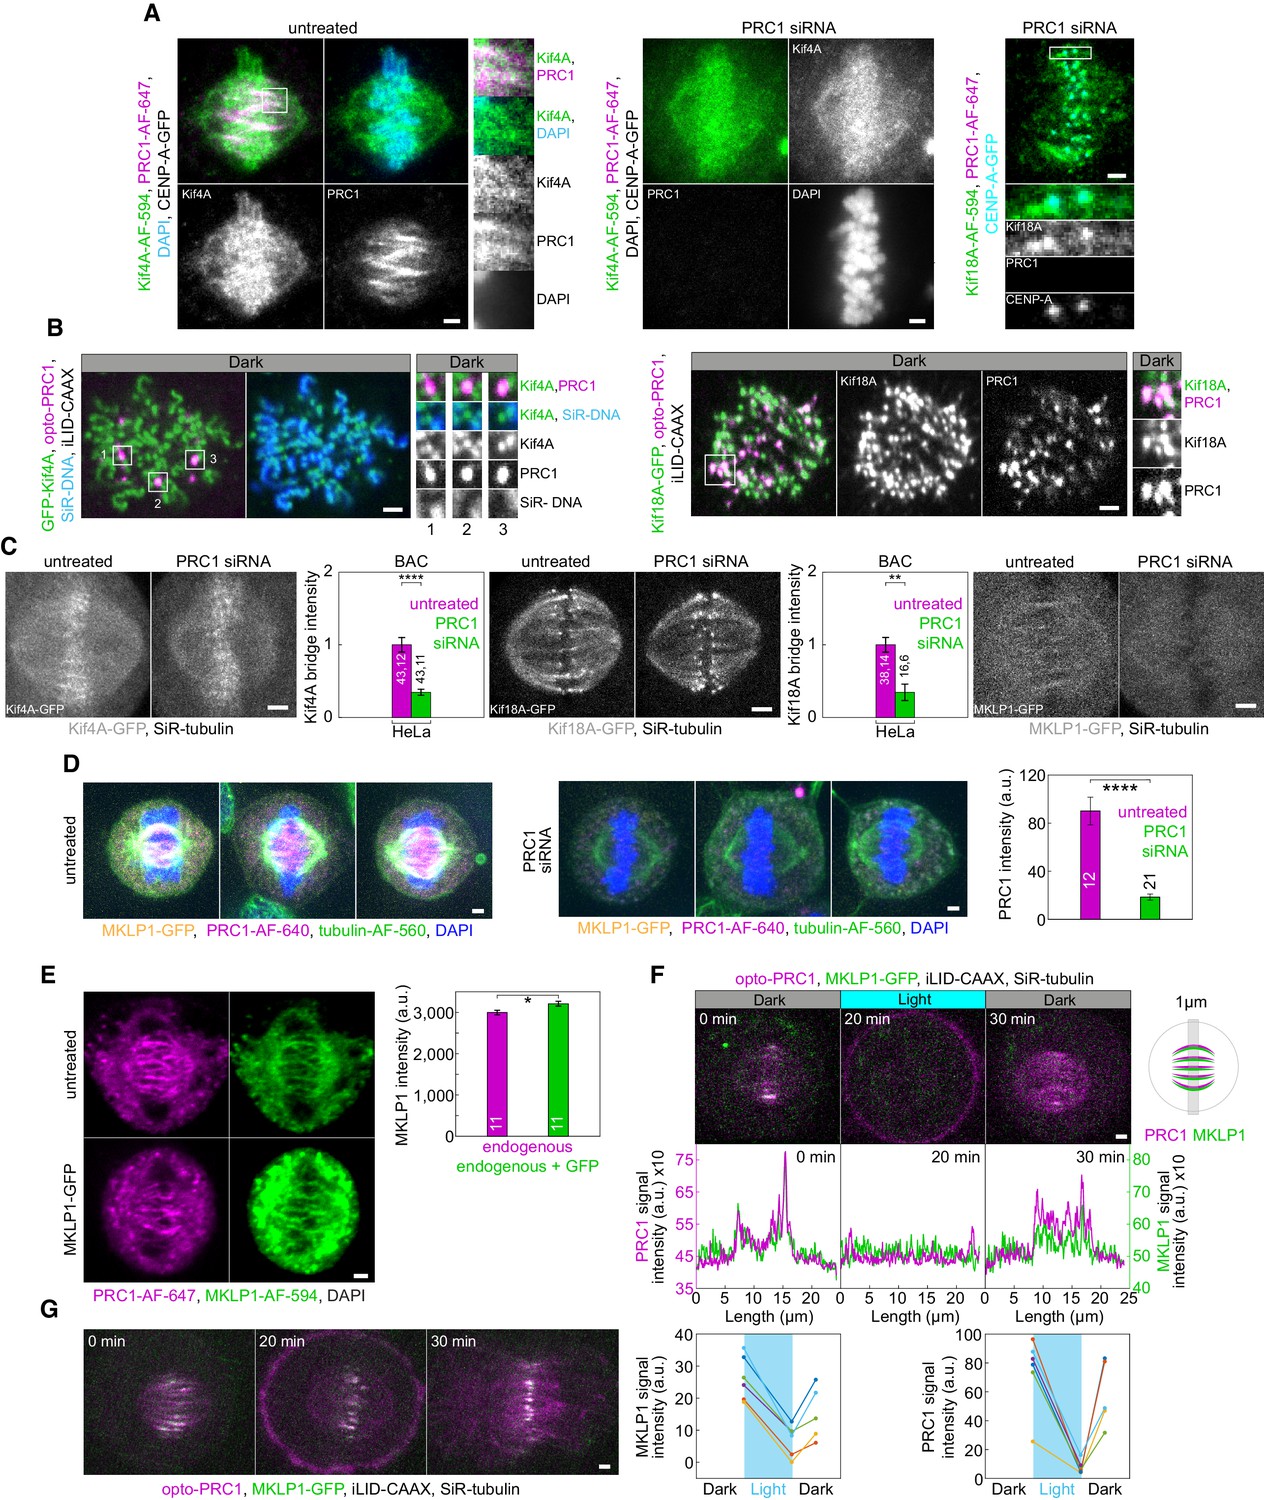
Kif4A, Kif18A, and MKLP1 show PRC1-dependent localization in the bridging fibers.
(A) Additional example (left block) of the spindle from the cell in Figure 5A and the same cell type treated with PRC1 siRNA (middle block). Right block: spindle in a U2OS cell with stable expression of CENP-A-GFP (cyan), immunostained for endogenous Kif18A (AF-594, green) and PRC1 (AF-647, magenta), treated with PRC1 siRNA. (B) Left: vertically oriented spindle in unlabeled U2OS cell with transient expression of opto-PRC1 (magenta), iLID-CAAX and GFP-Kif4A (green), and stained with SiR-DNA (cyan). Enlargements of the boxed regions (right) show Kif4A localization outside chromosomes, at the position of opto-PRC1 signal. Right: Vertically oriented spindle in unlabeled U2OS cell with transient expression of opto-PRC1 (magenta), iLID-CAAX and EGFP-Kif18A (green). Note that the spindle is slightly tilted. The enlargement of the boxed region shows Kif18A at the position where opto-PRC1 is found (right). Each opto-PRC1 spot, which we interpret as the bridging fiber, also has Kif18A signal, while spots containing Kif18A only we interpret as its signal on plus-ends of k-fibers. (C) Images of untreated and PRC1 siRNA-treated spindles in: HeLa cell expressing Kif4A-GFP (gray) from bacterial artificial chromosome (BAC) with the corresponding graph showing normalized Kif4A bridge intensity in those treatments (left); HeLa BAC cell expressing Kif18A-GFP (gray) with the corresponding graph showing normalized Kif18A bridge intensity in those treatments (middle) and HeLa BAC cell expressing MKLP1-GFP (gray) (right). Cells are stained with SiR-tubulin (not shown). (D) Spindles in fixed HeLa cells stably expressing MKLP1-GFP (yellow) and immunostained for PRC1 (AF-640, magenta), tubulin (AF-560, green) and stained with DAPI (blue) in untreated (left) and PRC1 siRNA-treated (right) cells (left). All images are sum intensity projections of five z-planes. Graph (right) shows PRC1 intensity in untreated (magenta) and PRC1 siRNA-treated (green) cells. Numbers inside bars; number of cells. (E) Spindle in a fixed unlabeled untreated HeLa cell (top left) and HeLa BAC cell expressing MKLP1-GFP (bottom left), immunostained for MKLP1 (AF-594, green), PRC1 (AF-647, magenta) and stained with DAPI (not shown). Images are sum-intensity projections of five z-planes smoothed with 0.5-pixel-Gaussian blur. Graph (right) shows MKLP1 intensity in untreated unlabeled (magenta) and BAC cells (green). The signal intensity of MKLP1 in these cells was 6% higher compared to endogenous MKLP1. (F) Time-lapse of HeLa BAC cell expressing MKLP1-GFP (green), depleted for endogenous PRC1, with transient expression of opto-PRC1 (magenta) and iLID-CAAX in time-points as in Figure 5D. Graphs (middle) correspond to membrane-to-membrane intensity profiles of MKLP1-GFP (green) and opto-PRC1 (magenta) acquired by 1 µm wide line across equatorial plane in time-points as in Figure 5D on maximum projection of three z-planes. Schematic representation of performed measurement is given on the right. Graphs (bottom) show individual MKLP1-GFP (left) and opto-PRC1 intensities (right). (G) Time-lapse of a cell as in F, which progresses to cytokinesis during time-points as in F. Statistical analysis: t-test.
Figure 5—figure supplement 2
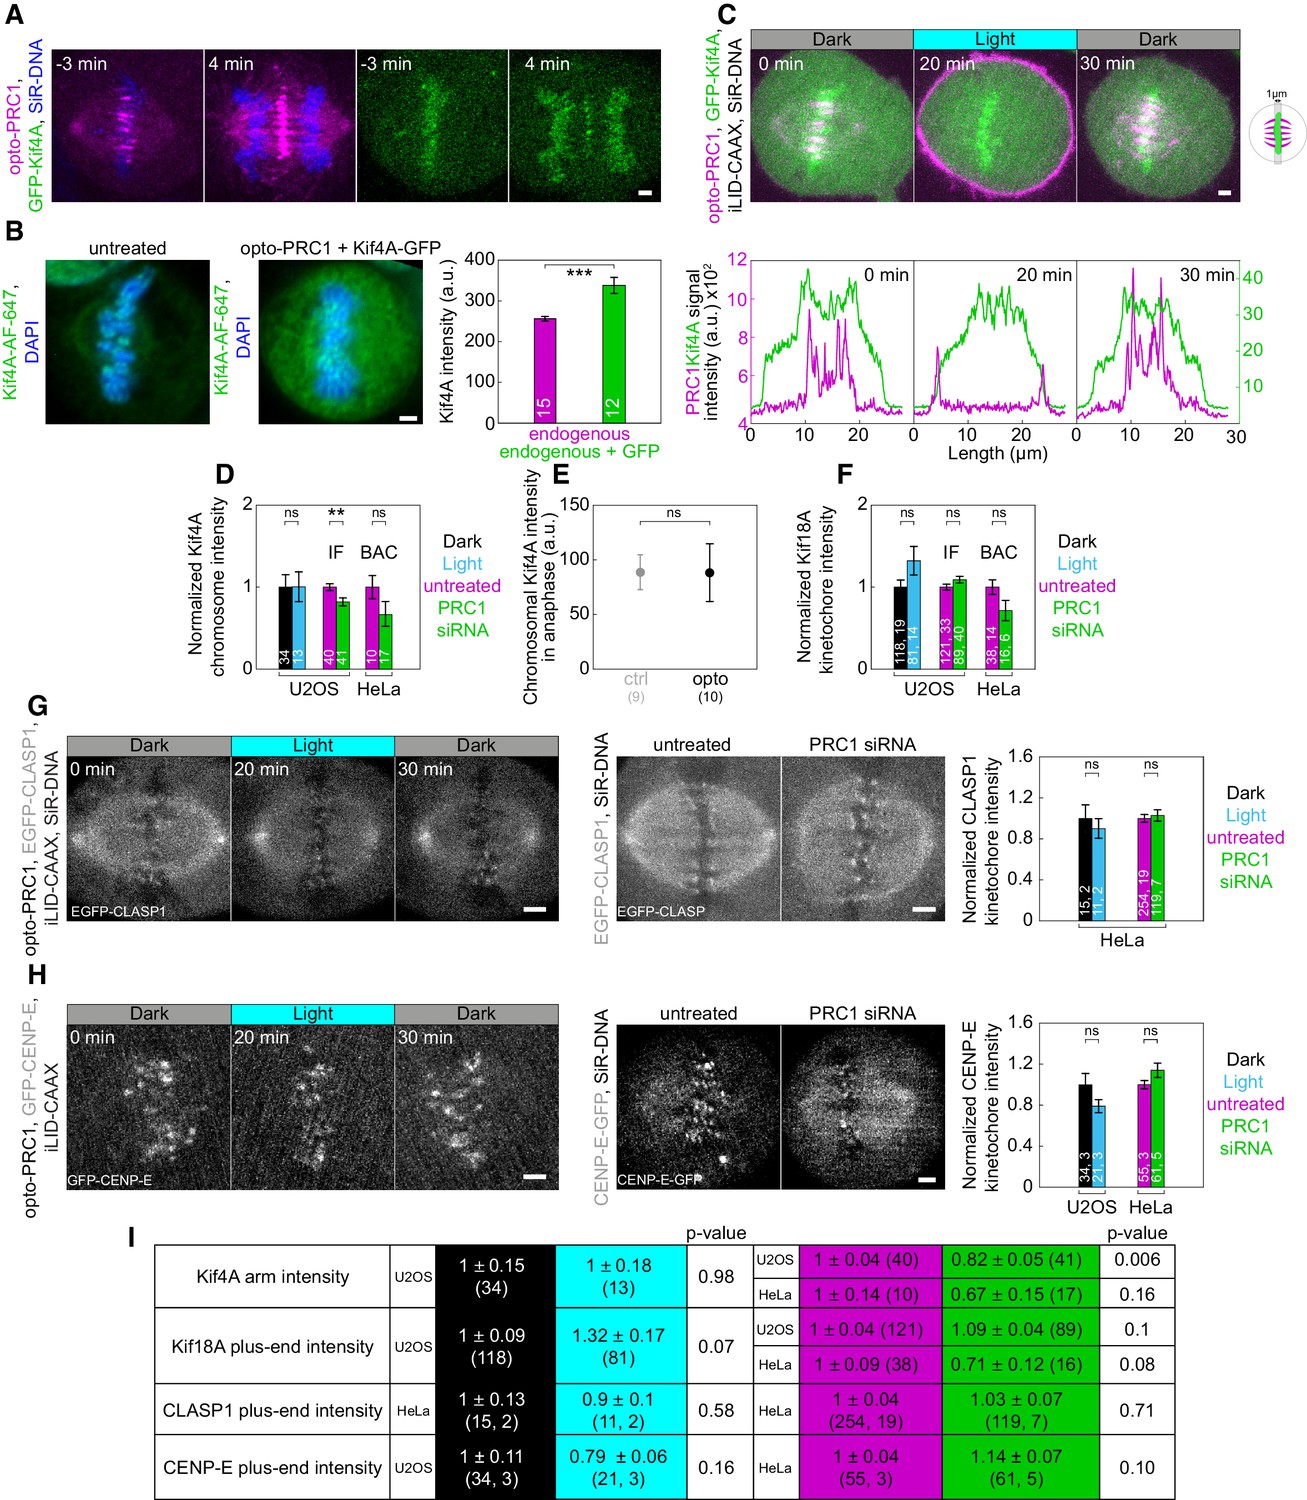
PRC1 removal shows no effect on polar ejection forces and k-fiber plus end dynamics.
(A) Time-lapse images of U2OS cells with transient expression of opto-PRC1 (magenta) and GFP-Kif4A (green) and DNA stained with SiR-DNA (blue). Left (merge opto-PRC1 and SiR-DNA), right (Kif4A). Anaphase onset is set as time 0 min. (B) Spindle in a fixed untreated unlabeled U2OS cell (left) and unlabeled U2OS cell (middle), depleted for endogenous PRC1 and transiently expressing Kif4A-GFP (not shown) and opto-PRC1 (not shown), immunostained for Kif4A (AF-647, green) and stained with DAPI (blue). Images are sum-intensity projections of five z-planes smoothed with 0.5-pixel-Gaussian blur. Graph (right) shows Kif4A intensity in untreated (magenta) and in cells with transient expression of Kif4A-GFP (green). The signal intensity of Kif4A in these cells was 30% higher compared to endogenous Kif4A. (C) Top: Time-lapse of U2OS cell as in Figure 5B (GFP-Kif4A in green; opto-PRC1 in magenta). Graphs (bottom) correspond to membrane-to-membrane intensity profiles of GFP-Kif4A (green) and opto-PRC1 (magenta) acquired by 1 µm wide line across equatorial plane in time-points as in Figure 5D on a single z-plane. Schematic representation of performed measurement is given on the right. (D) Normalized Kif4A chromosome intensity measured before and after acute PRC1 removal (in cells as in Figure 5B left) and long-term PRC1 removal in immunostained cells and Kif4A-GFP BAC cell line (as in Figure 5A and Figure 5—figure supplement 1A, and Figure 5—figure supplement 1C, respectively). (E) GFP-Kif4A intensity on chromosomes in opto (black) and control (gray) cells 4 min after anaphase onset. Anaphase onset is defined as a timeframe of sister chromatid separation. (F) Normalized Kif18A kinetochore intensity measured before and after acute PRC1 removal (in cells as in Figure 5B right) and long-term PRC1 removal in immunostained cells and Kif18A-GFP BAC cell (as in Figure 5A and Figure 5—figure supplement 1A, and Figure 5—figure supplement 1C, respectively). (G) Timelapse of the spindle in HeLa cell with stable expression of EGFP-CLASP1 (gray) and transient expression of opto-PRC1 and iLID-CAAX, and stained with SiR-DNA (not shown) (left) in timepoints as in Figure 5D. Spindles in untreated and PRC1 siRNA-treated (middle) cells with stable expression of EGFP-CLASP1 (gray) stained with SiR-DNA (not shown). Graph (right) shows normalized CLASP1 kinetochore intensity measured before and after acute and long-term PRC1 removal. (H) Timelapse of spindle in unlabeled U2OS cell (left) with transient expression of opto-PRC1, iLID-CAAX, and GFP-CENP-E (gray) in timepoints as in Figure 5D. Spindles in untreated and PRC1 siRNA-treated HeLa BAC cells (middle) expressing CENP-E-GFP (gray) stained with SiR-DNA (not shown). Graph (right) shows normalized CENP-E kinetochore intensity measured before and after acute and long-term PRC1 removal. (I) Table with intensities of Kif4A, Kif18A, CLASP1, and CENP-E at indicated positions. Color coded shading according to legend. Dark; black, Light; cyan, untreated; magenta, PRC1 siRNA; green. Scale bars; 2 µm. Statistical analyisis: t-test.
Figure 6
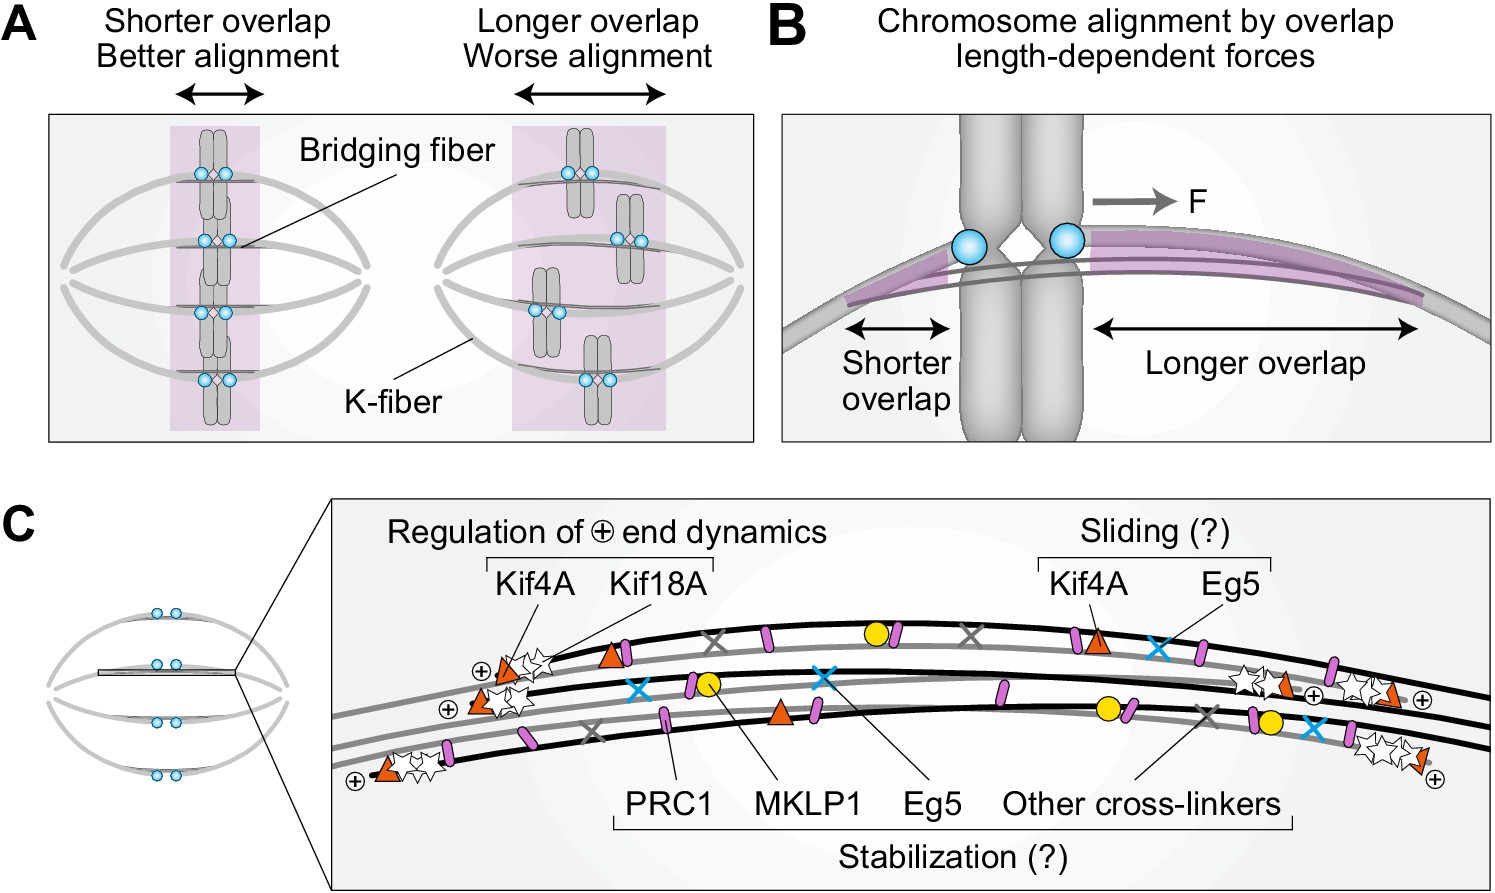
Model for chromosome alignment by overlap length-dependent forces within the bridging fiber.
(A) We propose that the interactions between k-fibers and bridging fibers regulate the movement of bi-oriented chromosomes by forces that depend on the length of the antiparallel overlaps (purple). Shorter overlaps lead to more precise alignment of kinetochores (cyan) than longer ones. (B) If a kinetochore pair is displaced away from the equatorial plane toward one pole, the overlap between the k-fiber and the bridging fiber (purple) is shorter on this side and longer on the opposite side. More motors and/or crosslinkers accumulate in the longer overlap, pulling the kinetochore back to the center (F, pulling force). The efficiency of centering depends on the relative asymmetry in the overlap length on either side. This asymmetry is larger if the overlap is short, which explains why short overlaps lead to better alignment than long ones (see A). (C) The overlap length is regulated by Kif4A and Kif18A at the plus ends of bridging microtubules. Kif4A and Eg5 within the bridging fiber possibly slide the microtubules apart, whereas PRC1 stabilizes the overlaps probably together with MKLP1, Eg5, and other crosslinkers.
Tables
Table 1
Comparison of effects of acute optogenetic removal of PRC1 and long-term depletion by siRNA.
All values are given as mean ± s.e.m. The numbers in the brackets denote the number of measurements and cells, respectively; a single number is the number of cells. Symbols (arrows and equal signs) denote trend of change of parameters; equal sign means no change; two arrows mark stronger effect. Measurements include cells without and with SiR-tubulin. Signal intensities of microtubule-associated proteins were normalized to the mean value of the signal of corresponding control for each treatment. BAC denotes live-cell experiments on HeLa cells expressing a fluorescently tagged protein from a BAC, immuno denotes immunocytochemistry experiments. #Consistent with our previous studies (Kajtez et al., 2016; Polak et al., 2017).
| Parameter | Acute removal | Long-term depletion | |||||||
|---|---|---|---|---|---|---|---|---|---|
| 0 min | 20 min | p-value | Untreated | siRNA | p-value | ||||
| dEQ (µm) | 0.78 ± 0.04 (290, 17) | 0.94 ± 0.05 (240, 16) | 0.035 | ↑ | 0.69 ± 0.05 (107, 8) | 0.69 ± 0.03 (333, 17) | 0.64 | = | |
| dEQ > 2 µm (%) | 4.1 ± 1.2 (290, 17) | 8.3 ± 1.8 (240, 16) | 0.043 | ↑ | 3.3 ± 1.0 (107, 8) | 0.9 ± 0.9 (333, 17) | 0.33 | = | |
| dKC (µm) | 0.87 ± 0.01 (226, 18) | 0.79 ± 0.01 (186, 18) | 1*10−8 | ↓ | 0.85 ± 0.01 (75, 8)# | 0.780 ± 0.008 (202, 17)# | 4*10−6 | ↓ | |
| αKC (°) | 13.8 ± 0.7 (290, 17) | 18.4 ± 1.0 (240, 16) | 0.0013 | ↑ | 13.3 ± 1.0 (107, 8) | 10.3 ± 0.7 (333, 17) | 1*10−4 | ↓ | |
| αKC > 35° (%) | 6.2 ± 1.4 (290, 17) | 12.1 ± 2.1 (240, 16) | 0.018 | ↑ | 4.7 ± 2.0 (107, 8) | 3.6 ± 1.0 (333, 17) | 0.83 | = | |
| Lagging kinetochores (%) | 23 ± 7 (39) ctrl | 46 ± 9 (28) opto | 0.044 | ↑ | 5 ± 4 (37) | 40 ± 11 (20) | 0.0036 | ↑ | |
| EB3 comets (min−1) | 1.8 ± 0.1 (47, 5) ctrl | 2.0 ± 0.3 (26, 3) opto | 0.59 | = | 1.91 ± 0.09 (144, 6) | 1.5 ± 0.1 (54, 4) | 0.01 | ↓ | |
| EB3 comets velocity (µm/min) | 19 ± 1 (17, 9) ctrl | 19.6 ± 0.8 (23, 9) opto | 0.73 | = | 16.0 ± 0.6 (16, 6) | 14.7 ± 0.8 (14, 4) | 0.19 | = | |
| Half-overlap length (µm) | 1.8 ± 0.2 (17, 9) ctrl | 2.6 ± 0.2 (23, 9) opto | 0.009 | ↑ | 2.0 ± 0.2 (16, 6) | 1.8 ± 0.2 (14, 4) | 0.45 | = | |
| N (MTs) in the bridging fiber | 14 ± 2 (22, 13) | 5.6 ± 0.9 (19, 10) | 0.0038 | ↓ | 14 ± 2 (18, 15) | 7.5 ± 1.1 (26, 18) | 0.0028 | ↓ | |
| Curvature (µm−1) | 0.134 ± 0.004 (40, 10) | 0.081 ± 0.005 (39, 10) | 6*10−11 | ↓↓ | 0.137 ± 0.006 (20, 5) | 0.108 ± 0.004 (52, 13) | 0.0014 | ↓ | |
| θ (°) | 142 ± 3 (20, 10) | 125 ± 3 (20, 10) | 2*10−4 | ↓ | 145 ± 3 (10, 5) | 137 ± 2 (26, 13) | 0.051 | = | |
| Kif4A intensity in the bridging fiber | 1 ± 0.1 (54, 11) | 0.24 ± 0.05 (32, 6) | 1*10−4 | ↓↓ | immuno | 1 ± 0.03 (72, 17) | 0.48 ± 0.02 (58, 15) | 1*10−4 | ↓ |
| BAC | 1 ± 0.1 (43, 12) | 0.35 ± 0.04 (43, 11) | 1*10−4 | ↓ | |||||
| Kif18A intensity in the bridging fiber | 1 ± 0.1 (57, 15) | 0.57 ± 0.09 (28, 11) | 0.01 | ↓ | immuno | 1 ± 0.07 (121, 33) | 0.62 ± 0.05 (89, 40) | 1*10−4 | ↓ |
| BAC | 1 ± 0.1 (38, 14) | 0.53 ± 0.11 (16, 6) | 0.009 | ↓ | |||||
| MKLP1 intensity in the bridging fiber | 1 ± 0.19 (25, 6) | 0.13 ± 0.05 (20, 6) | 0.008 | ↓ | 1 ± 0.22 (29, 8) | 0.17 ± 0.10 (20, 6) | 0.008 | ↓ | |
Key resources table
| Reagent type (species) or resource | Designation | Source or reference | Identifiers | Additional information |
|---|---|---|---|---|
| Cell line (Homo sapiens) | Unlabeled U2OS cells | Gift from Marin Barišić and Helder Maiato; used in our previous work (Vukušić et al., 2017) | Human osteosarcoma cells | |
| Cell line (Homo sapiens) | U2OS cells stably expressing CENP-A-GFP | Gift from Marin Barišić and Helder Maiato; used in our previous work (Vukušić et al., 2017) | Human osteosarcoma cells | |
| Cell line (Homo sapiens) | U2OS cells stably expressing CENP-A-GFP, mCherry-α-tubulin and PA-GFP-tubulin | Gift from Marin Barišić and Helder Maiato; used in our previous work (Vukušić et al., 2017) | Human osteosarcoma cells | |
| Cell line (Homo sapiens) | U2OS cell line stably expressing 2xGFP-EB3 and mCherry-CENP-A | Gift from Julie Welburn; used in our previous work (Kajtez et al., 2016) | Human osteosarcoma cells | |
| Cell line (Homo sapiens) | HeLa-Kyoto BAC MKLP1-GFP | Gift from Ina Poser and Tony Hyman | 4319 HeLa-ky KIF-23-hum MKLP1 T#280 | |
| Cell line (Homo sapiens) | HeLa-Kyoto BAC Kif4A-GFP; HeLa stably expressing Kif4A-GFP | Gift from Ina Poser and Tony Hyman | HeLa Kif4A-GFP 0005146 T#372 | |
| Cell line (Homo sapiens) | HeLa-Kyoto BAC Kif18A-GFP; HeLa stably expressing Kif18A-GFP | Gift from Ina Poser and Tony Hyman | HeLa Kif18A-GFP MCB 0003184 #197 | |
| Cell line (Homo sapiens) | HeLa-Kyoto BAC CENP-E-GFP; HeLa stably expressing CENP-E-GFP | Gift from Ina Poser and Tony Hyman | HeLa CENP-E-GFP T#363 | |
| Cell line (Homo sapiens) | HeLa-Kyoto BAC PRC1-GFP; HeLa stably expressing PRC1-GFP | Gift from Ina Poser and Tony Hyman | ||
| Cell line (Homo sapiens) | Unlabeled HeLa-TDS cells | Other | High-Throughput Technology Development Studio (MPI-CBG, Dresden); | |
| Cell line (Homo sapiens) | HeLa-TDS cells, stably expressing pEGFP-α-tubulin | Used in our previous work (Kajtez et al., 2016) | ||
| Cell line (Homo sapiens) | HeLa cells stably expressing YFP-tubulin | Gift from Lars Jansen | ||
| Cell line (Homo sapiens) | HeLa cells permanently transfected with EGFP-CLASP1 | Gift from Helder Maiato | ||
| Transfected construct (human) | PRC1 siRNA | Dharmacon | Accell A-019491-15-0020 | |
| Transfected construct (human) | Non targeting; mock siRNA | Dharmacon | Accell Non-targeting Pool D-001910-10-05 | |
| Transfected construct (human) | Kif4A siRNA | Santa Cruz Biotechnologies | sc-60888 | |
| Transfected construct (human) | Kif18A siRNA | Ambion | Silencer Select ValidatedKif18A siRNA (s37882) | |
| Antibody | Anti-PRC1 (mouse monoclonal) | Santa Cruz Biotechnology | C-1; sc-376983 | IF (1:100) |
| Antibody | Anti-α-tubulin (rabbit polyclonal) | Sigma-Aldrich Corporation | RRID:AB_10743646 SAB4500087 | IF (1:100) |
| Antibody | Anti-Kif4A (mouse monoclonal) | Santa Cruz Biotechnology | RRID:AB_10707683 E-8; sc-365144 | IF (1:100) |
| Antibody | Anti-MKLP1 (rabbit polyclonal) | Santa Cruz Biotechnology | RRID:AB_631959 N-19; sc-867 | IF (1:100) |
| Antibody | Anti-Eg5 (mouse monoclonal) | Santa Cruz Biotechnology | RRID:AB_10841907 A-1; sc-365681 | IF (1:100) |
| Antibody | Anti-mouse IgG Alexa Fluor 488 (donkey polyclonal) | Abcam | ab150109 | IF (1:250) |
| Antibody | Anti-rabbit IgG Alexa Fluor 594 (donkey polyclonal) | Abcam | ab150064 | IF (1:250) |
| Antibody | Anti-rabbit IgG Alexa Fluor 405 (donkey polyclonal) | Abcam | RRID:AB_2715515 ab175649 | IF (1:250) |
| Antibody | Anti-mouse IgG Alexa Fluor 647 (goat polyclonal) | Abcam | RRID:AB_2811129 ab150119 | IF (1:250) |
| Antibody | Anti-Kif4A (rabbit polyclonal) | Bethyl | RRID:AB_2280904 A301-074A | IF (1:200) |
| Antibody | Anti-Kif18A (rabbit polyclonal) | Bethyl | RRID:AB_2296551 A301-080A | IF (1:100) |
| Recombinant DNA reagent | PRC1-tgRFPt-SspB WT (opto-PRC1) plasmid | This paper | ||
| Recombinant DNA reagent | His6-PRC1 plasmid | Addgene (Nixon et al., 2015) | RRID:Addgene_69111 | |
| Recombinant DNA reagent | tgRFPt-SspB WT plasmid | Addgene (Guntas et al., 2015) | RRID:Addgene_60415 | |
| Recombinant DNA reagent | iLID-CAAX plasmid | Addgene (O'Neill et al., 2016) | RRID:Addgene_85680 | |
| Recombinant DNA reagent | pEGFP-C1Kif4a-sires plasmid | Gift from Jason Stumpff | ||
| Recombinant DNA reagent | EGFP-Kif18A plasmid | Gift from Jason Stumpff | ||
| Recombinant DNA reagent | GFP-CENP-E plasmid | Gift from Marin Barišić | ||
| Recombinant DNA reagent | mRFP-CENP-B plasmid | Gift from Linda Wordeman | RRID:Addgene_23006 pMX234 | |
| Sequence-based reagent | FWD primer from His6-PRC1 plasmid | This paper | GCTAGAATT GACCGGATG AGGAGAAGT GAGGTGCTG | |
| Sequence-based reagent | REV primer from His6-PRC1 plasmid | This paper | CATGGTGGC GACCGGTAA ATTCGAAGC TTGAGCTCG AGATCTGA GGGACTGG ATGTTGGT TGAATTGAGG | |
| Commercial assay or kit | MycoAlert Mycoplasma Detection Kit | Lonza | #: LT07-118 | |
| Commercial assay or kit | In-Fusion HD Cloning Kit | Clontech | ||
| Commercial assay or kit | Nucleofector Kit | Lonza | #VVCA-1001 | Used with the Nucleofector 2b Device |
| Software, algorithm | RStudio | R Foundation for Statistical Computing | RRID:SCR_000432 | |
| Software, algorithm | MATLAB | MathWorks | RRID:SCR_001622 | |
| Software, algorithm | ImageJ | National Institutes of Health | RRID:SCR_003070 | |
| Software, algorithm | Adobe Illustrator CS5 | Adobe Systems | RRID:SCR_010279 | |
| Software, algorithm | Low Light Tracking Tool (LLTT) | ImageJ | ImageJ plugin | |
| Chemical compound, drug | DAPI stain | Sigma-Aldrich | D9542 | (1 µg/mL) |
| Chemical compound, drug | SiR-DNA | Spirochrome AG | #SC007 | 150 nM |
| Chemical compound, drug | SiR-tubulin | Spirochrome AG | #SC002 | 50 nM |
| Chemical compound, drug | Verapamil | Spirochrome AG | 1 μM | |
| Chemical compound, drug | Proteasome inhibitor MG-132 | Sigma-Aldrich | M8699 | 20 µM |
| Chemical compound, drug | Normal goat serum (NGS) | Sigma-Aldrich | 566380 | 1% for primary antibody solution, 2% for secondary antibody solution |
| Chemical compound, drug | Geneticin | Life technologies | Cat# 11811031 | |
| Chemical compound, drug | Penicillin/ streptomycin solution | Lonza | Cat# DE17-502E |
Additional files
-
Source code 1
Main codes used for data analysis.
- https://cdn.elifesciences.org/articles/61170/elife-61170-code1-v2.zip
-
Supplementary file 1
Table of the data generated in this study, listed per figure.
- https://cdn.elifesciences.org/articles/61170/elife-61170-supp1-v2.xlsx
-
Transparent reporting form
- https://cdn.elifesciences.org/articles/61170/elife-61170-transrepform-v2.pdf
Download links
A two-part list of links to download the article, or parts of the article, in various formats.
Downloads (link to download the article as PDF)
Open citations (links to open the citations from this article in various online reference manager services)
Cite this article (links to download the citations from this article in formats compatible with various reference manager tools)
Optogenetic control of PRC1 reveals its role in chromosome alignment on the spindle by overlap length-dependent forces
eLife 10:e61170.
https://doi.org/10.7554/eLife.61170


