SMC5/6 is required for replication fork stability and faithful chromosome segregation during neurogenesis
- Biochemistry and Molecular Biology Department, Johns Hopkins University Bloomberg School of Public Health, United States
Figures
Figure 1 with 3 supplements
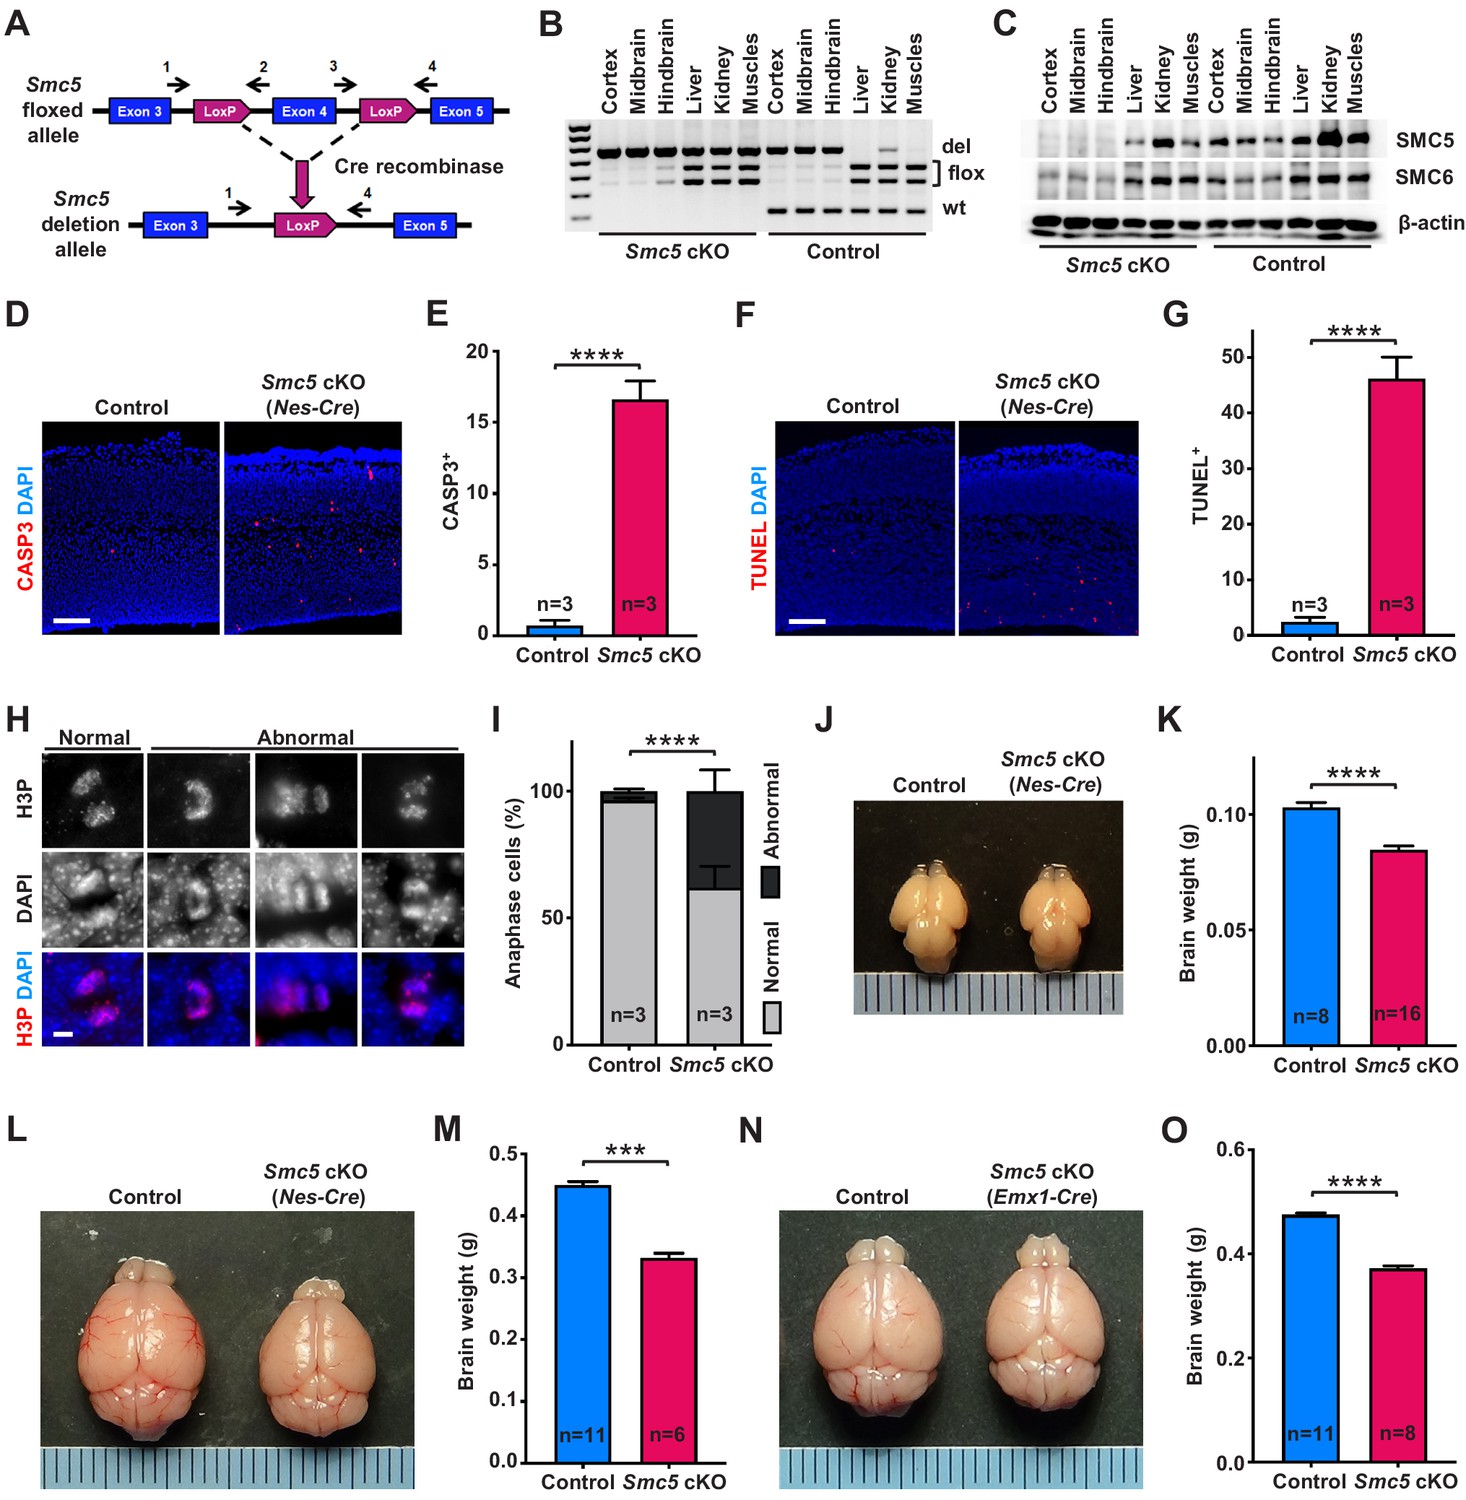
Smc5 conditional knockout (cKO) causes disruption of genomic integrity and apoptosis of neural progenitor cells (NPCs).
(A) The scheme of mouse Smc5 floxed allele and Cre recombinase-mediated exon four excision. Arrows with numbers above represent genotyping primers (see Materials and methods). (B) PCR genotyping of control and Smc5 cKO (Nestin-Cre) E16.5 tissues. Abbreviations: wt, wild type; flox, floxed allele; del, deletion. (C) Western blot analysis of SMC5 and SMC6 protein expression in control and Smc5 cKO (Nestin-Cre) E16.5 tissues. β-actin was used as a loading control (n = 3). (D) Representative images of cleaved caspase 3 (CASP3) (red) staining in control and Smc5 cKO (Nestin-Cre) E16.5 sagittal brain sections; DAPI (blue). Column width: 500 µm, scale bar: 100 µm. (E) Quantification of CASP3+ cells within 300 µm columns in brain sections related to (D). Data represent mean ± S.E.M. (control animals n = 3, Smc5 cKO animals n = 3; see Supplementary file 3 for details). Unpaired two-tailed Mann–Whitney test, ****p<0.0001. (F) Representative images of TUNEL+ nuclei (red) in control and Smc5 cKO (Nestin-Cre) E16.5 coronal brain sections; DAPI (blue). Column width: 500 µm, scale bar: 100 µm. (G) Quantification of the number of TUNEL+ nuclei within 800 µm columns in brain sections related to (F). Data represent mean ± S.E.M. (control animals: n = 3, Smc5 cKO animals: n = 3; see Supplementary file 3 for details). Unpaired two-tailed Mann–Whitney test, ****p<0.0001. (H) Representative images of normal and abnormal mitotic E16.5 NPCs in anaphase, stained with an antibody against phospho-histone H3Ser10 (H3P) (red); DAPI (blue). Scale bar: 5 µm. (I) Quantification of percentage of normal and abnormal mitotic E16.5 NPCs in control and Smc5 cKO (Nestin-Cre) brain sections. Data represent weighted mean ± weighted S.D. (control anaphase cells n = 85 from three animals, Smc5 cKO anaphase cells n = 79 from three animals, see Supplementary file 3 for details). Pearson's chi-squared test with Yates’ continuity correction, ****p<0.0001. (J) Images of control and Smc5 cKO (Nestin-Cre) P1 brains. Metric ruler is provided for scale. (K) Quantification of control (n = 8) and Smc5 cKO (n = 16) (Nestin-Cre) P0/1 brain weight. Data represent mean ± S.E.M. Unpaired two-tailed Mann–Whitney test, ****p<0.0001. (L) Images of control and Smc5 cKO (Nestin-Cre) P56 brains. Metric ruler is provided for scale. (M) Quantification of control (n = 11) and Smc5 cKO (n = 6) (Nestin-Cre) P56-59 brain weight. Data represent mean ± S.E.M. Unpaired two-tailed Mann–Whitney test, ***p=0.0002. (N) Images of control and Smc5 cKO (Emx1-Cre) P56 brains. Metric ruler is provided for scale. (O) Quantification of control (n = 11) and Smc5 cKO (n = 8) (Emx1-Cre) P55-56 brain weight. Data represent mean ± S.E.M. Unpaired two-tailed Mann–Whitney test, ****p<0.0001.
Figure 1—figure supplement 1
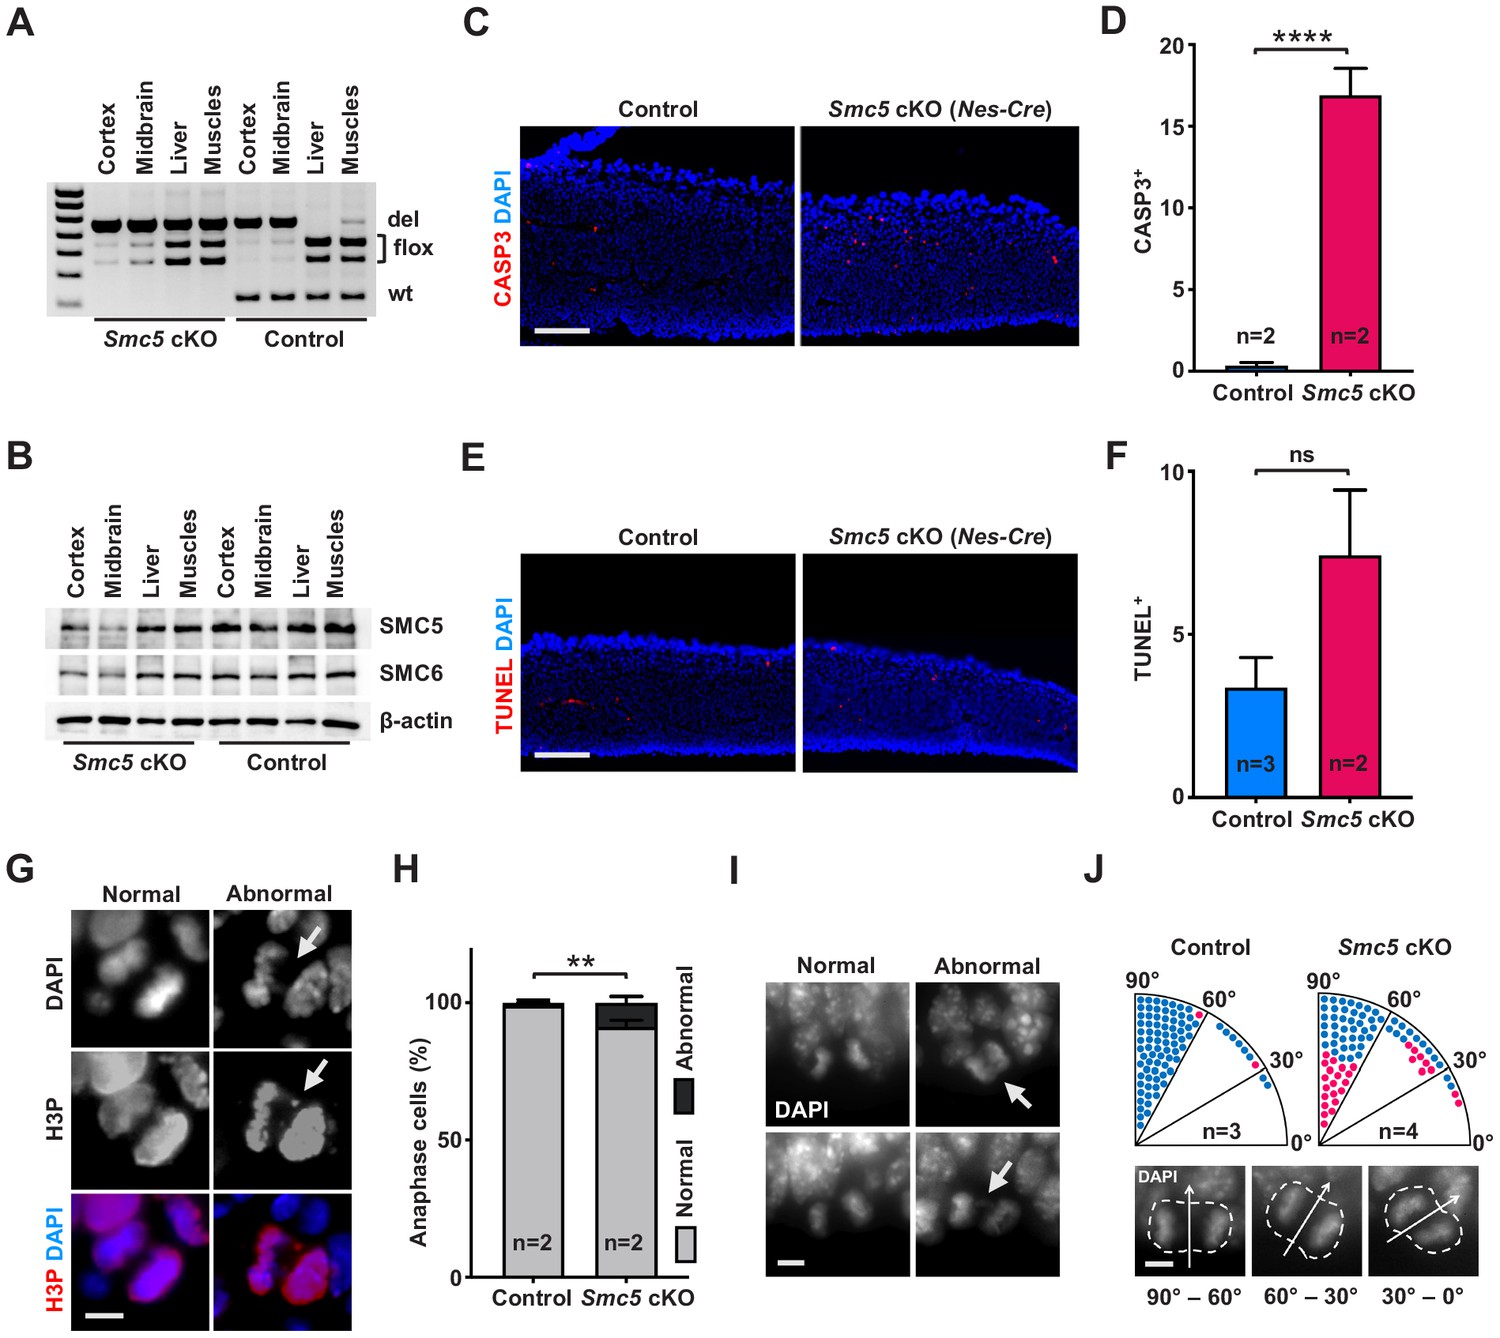
Evaluation of SMC5 depletion phenotype in embryonic cortices.
(A) PCR genotyping of Smc5 conditional knockout (cKO; Nestin-Cre) E13.5 tissues. Abbreviations: wt, wild type; flox, floxed allele; del, deletion. (B) Western blot analysis of SMC5 and SMC6 protein expression in control and Smc5 cKO (Nestin-Cre) E13.5 tissues. β-actin was used as a loading control (n = 2). (C) Representative cleaved caspase 3 (CASP3) staining of control and Smc5 cKO (Nestin-Cre) E13.5 sagittal brain sections; DAPI (blue). Column width: 500 µm, scale bar: 100 µm. (D) Quantification of CASP3+ cells within 300 µm in brain sections related to (C). Data represent mean ± S.E.M. (control animals n = 2, Smc5 cKO animals n = 2; see Supplementary file 3 for details). Unpaired two-tailed Mann–Whitney test, ****p<0.0001. (E) Representative images of TUNEL+ nuclei (red) in control and Smc5 cKO (Nestin-Cre) E13.5 sagittal brain sections; DAPI (blue). Column width: 500 µm, scale bar: 100 µm. (F) Quantification of the number of TUNEL+ nuclei within 300 µm columns in the ventricular zone (VZ) in brain sections related to (E). Data represent mean ± S.E.M. (control animals n = 3; Smc5 cKO animals n = 2; see Supplementary file 3 for details). Unpaired two-tailed Mann–Whitney test, ns, not significant, p=0.0540. (G) Representative images of normal and abnormal mitotic E13.5 NPCs in anaphase, stained with an antibody against phospho-histone H3Ser10 (H3P) (red); DAPI (blue). Scale bar: 5 µm. (H) Quantification of percentage of normal and abnormal mitotic E13.5 NPCs in control and Smc5 cKO (Nestin-Cre) brain sections. Data represent weighted mean ± weighted S.D. (control anaphase cells n = 191 from two animals, Smc5 cKO anaphase cells n = 126 from two animals, see Supplementary file 3 for details). Pearson's chi-squared test with Yates’ continuity correction, **p=0.0020. (I) Representative images of normal and abnormal mitotic E16.5 NPCs in anaphase (related to Figure 1H), stained with an antibody against phospho-histone H3Ser10 (H3P) (red); DAPI (blue). Scale bar: 5 µm. (J) Quantification of the cleavage plane orientation (defined as the angle between the cleavage plane and VZ surface) of E16.5 apical progenitors from control (n = 85 from three animals) and Smc5 cKO (n = 82 from four animals) brain sections (see Supplementary file 3 for details). Pearson's chi-squared test with Yates’ continuity correction, *p=0.0124. Each filled circle represents one normal (blue) or abnormal (pink) anaphase (top panel). Representative images of apical progenitors in anaphase in E16.5 cortices. Anaphase cells are outlined by dashed lines, and cleavage plane is indicated by arrow. Scale bar: 5 µm (bottom panel).
Figure 1—figure supplement 2
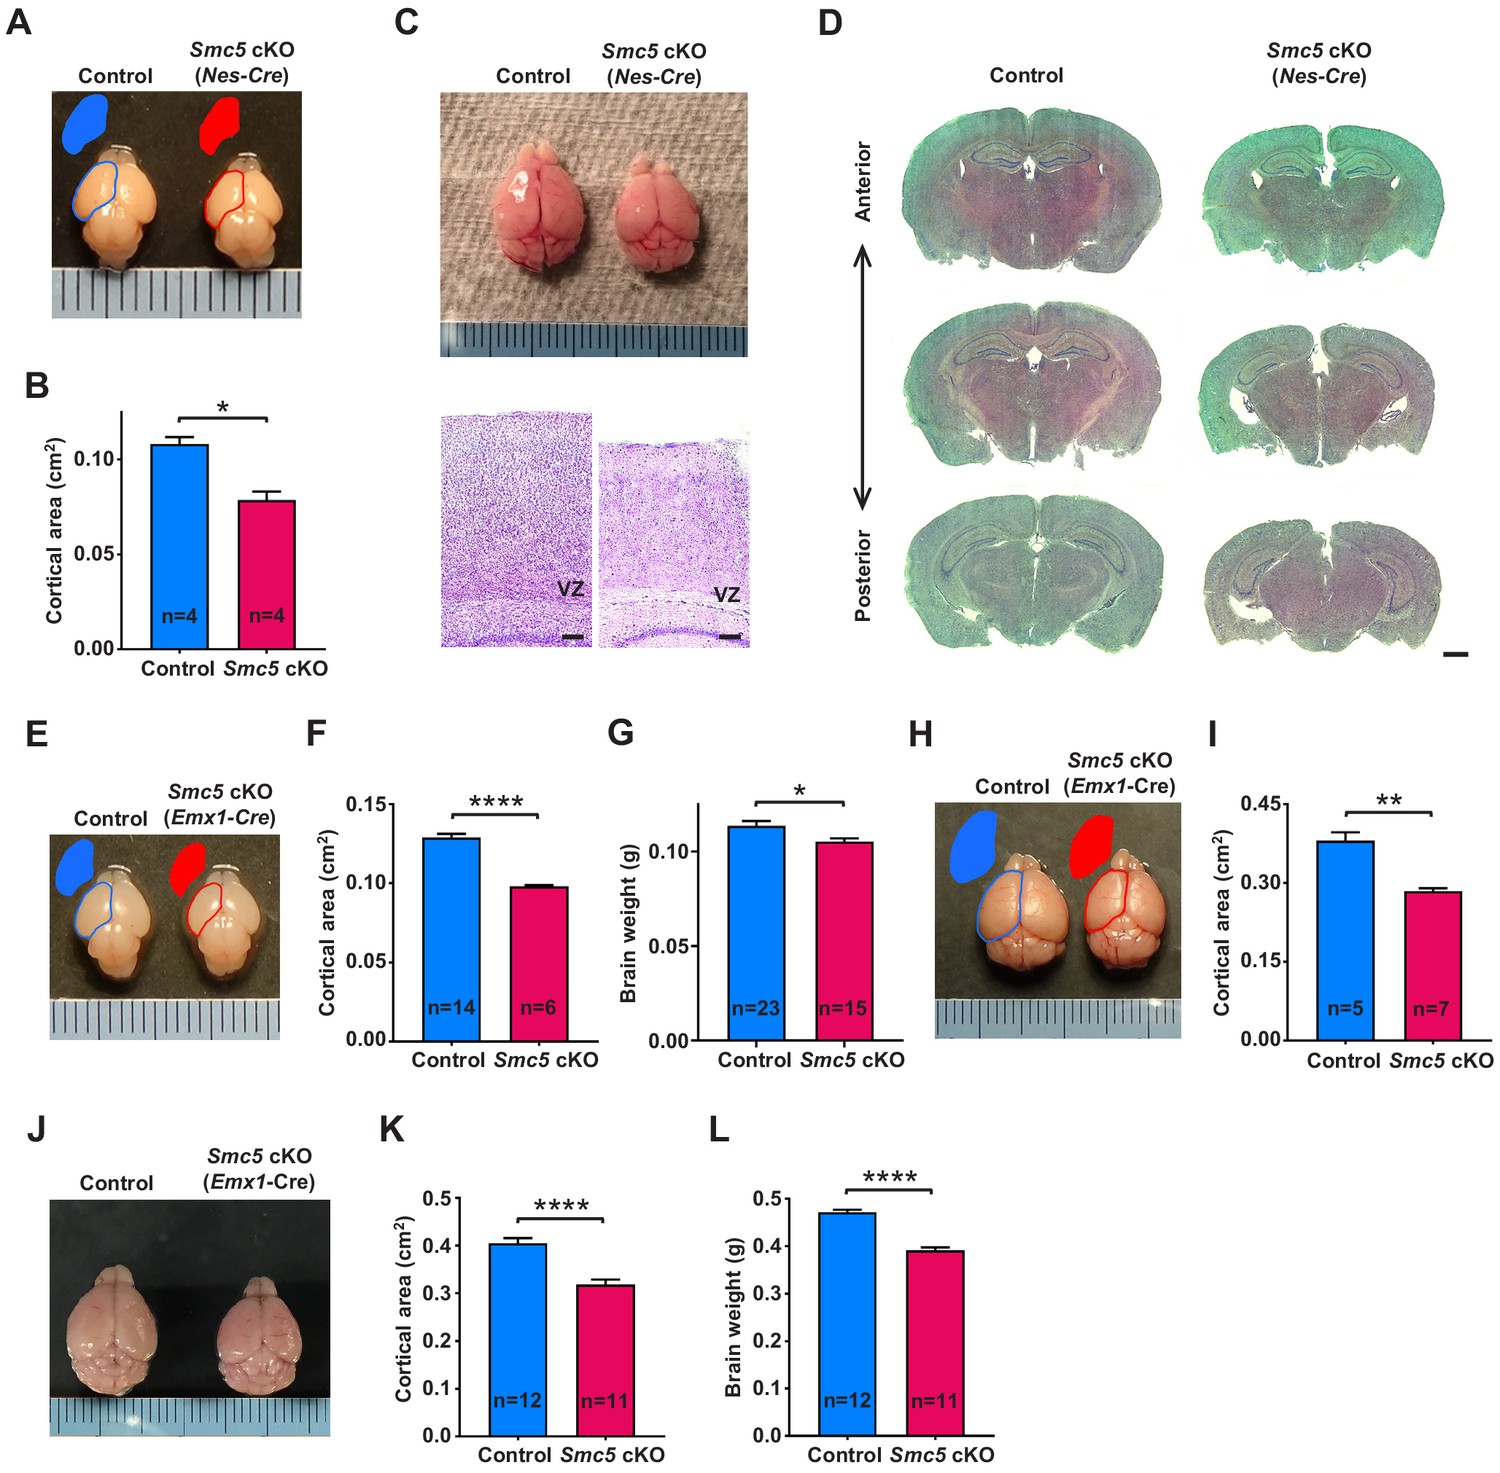
Smc5 conditional knockout (cKO) results in reduced cortex and brain size.
(A) Images of control and Smc5 cKO (Nestin-Cre) P1 brains with outlined cortical area in control (blue) and Smc5 cKO (red). Metric ruler is provided for scale. (B) Quantification of the cortical area in control (n = 4) and Smc5 cKO (n = 4) (Nestin-Cre) P0/1 brains. Data represent mean ± S.E.M., unpaired two-tailed Mann–Whitney test, *p=0.0286. (C) Brain images (top panel) and hematoxylin and eosin (H and E) staining of sagittal brain sections (bottom panel) of control and Smc5 cKO (Nestin-Cre) P55 mice. Scale bar: 100 μm. (D) Representative H and E staining of coronal sections from three brain regions of control (n = 2) and Smc5 cKO (n = 2) (Nestin-Cre) P56 mice. Scale bar: 1000 µm. (E) Images of control and Smc5 cKO (Emx1-Cre) P1 brains with outlined cortical area in control (blue) and Smc5 cKO (red). Metric ruler is used for scale. (F) Quantification of the cortical area in control (n = 14) and Smc5 cKO (n = 6) (Emx1-Cre) P0/1 brains. Data represent mean ± S.E.M., unpaired two-tailed Mann–Whitney test, ****p<0.0001. (G) Quantification of the brain weight in control (n = 23) and Smc5 cKO (n = 15) (Emx1-Cre) P0/1 brains. Data represent mean ± S.E.M., unpaired two-tailed Mann–Whitney test, *p=0.0188. (H) Images of control and Smc5 cKO (Emx1-Cre) P56 brains with outlined cortical area in control (blue) and Smc5 cKO (red). Metric ruler is provided for scale. (I) Quantification of the cortical area in control (n = 5) and Smc5 cKO (n = 7) (Emx1-Cre) P55-56 brains. Data represent mean ± S.E.M. Unpaired two-tailed Mann–Whitney test, **p=0.0025. (J) Images of control (P300) and Smc5 cKO (Emx1-Cre) (P283) brains. Metric ruler is provided for scale. (K) Quantification of the cortical area in control (n = 12) and Smc5 cKO (n = 11) (Emx1-Cre) P278-344 brains. Data represent mean ± S.E.M., unpaired two-tailed Mann–Whitney test, ****p<0.0001. (L) Quantification of control (n = 12) and Smc5 cKO (n = 11) (Emx1-Cre) P278-344 brain weight. Data represent mean ± S.E.M. Unpaired two-tailed Mann–Whitney test, ****p<0.0001.
Figure 1—figure supplement 3
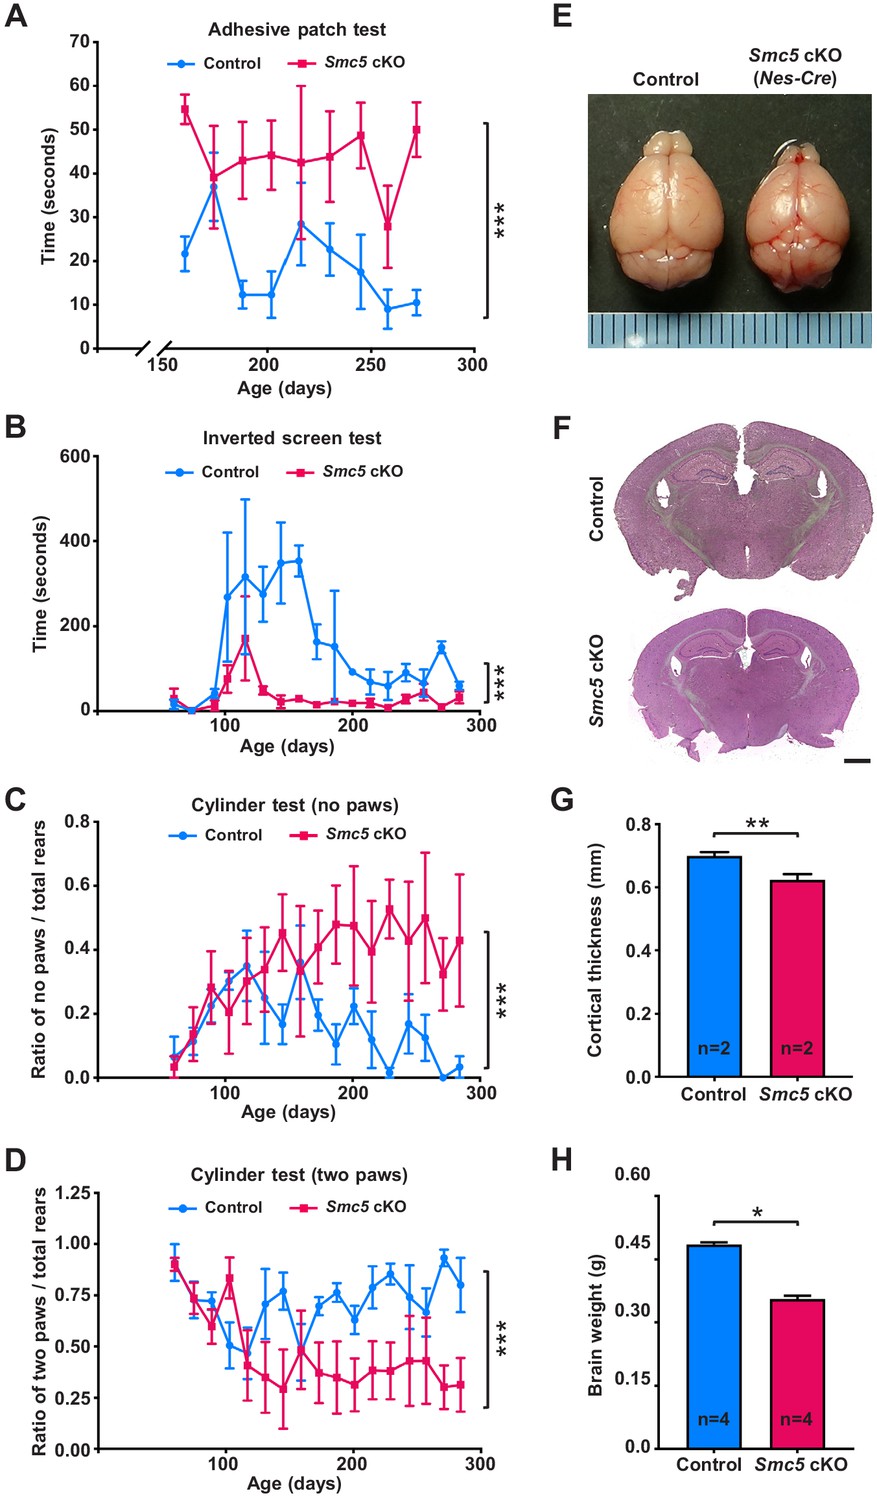
Reduced brain size in Smc5 conditional knockout (cKO; Nestin-Cre) mice affects sensorimotor activity.
(A) Adhesive patch test. Quantification of the adhesive contact time of control (n = 2) and Smc5 cKO (n = 2) (Nestin-Cre) male mice. Data represent mean ± S.E.M., unpaired two-tailed Mann–Whitney test, ***p=0.0002. (B) Inverted screen test. Quantification of the time control (n = 2) and Smc5 cKO (n = 2) (Nestin-Cre) female mice held onto the screen once it was inverted. Data represent mean ± S.E.M., unpaired two-tailed Mann–Whitney test, ***p=0.0004. (C) Cylinder test. Quantification of the ratio of rears with no paws touching the cylinder wall to the total number of rears of control (n = 4) and Smc5 cKO (n = 4) (Nestin-Cre) male and female mice. Data represent mean ± S.E.M., unpaired two-tailed Mann–Whitney test, ***p=0.0002. (D) Cylinder test. Quantification of the ratio of rears with two paws touching the cylinder wall to the total number of rears of control (n = 4) and Smc5 cKO (n = 4) (Nestin-Cre) male and female mice. Data represent mean ± S.E.M., unpaired two-tailed Mann–Whitney test, ***p=0.0003. (E) Images of control and Smc5 cKO (Nestin-Cre) P295 brains. Metric ruler is provided for scale. (F) Representative H and E-stained control and Smc5 cKO (Nestin-Cre) P295 coronal brain sections. Scale bar: 1000 µm. (G) Quantification of the cortical thickness in P293/295 brains of control (n = 2) and Smc5 cKO (n = 2) (Nestin-Cre) mice, see Supplementary file 3 for details. Data represent mean ± S.E.M. Unpaired two-tailed Mann–Whitney test, **p=0.0037. (H) Quantification of control (n = 4) and Smc5 cKO (n = 4) (Nestin-Cre) P293/295 brain weight. Data represent mean ± S.E.M. Unpaired two-tailed Mann–Whitney test, *p=0.0286.
Figure 2 with 1 supplement
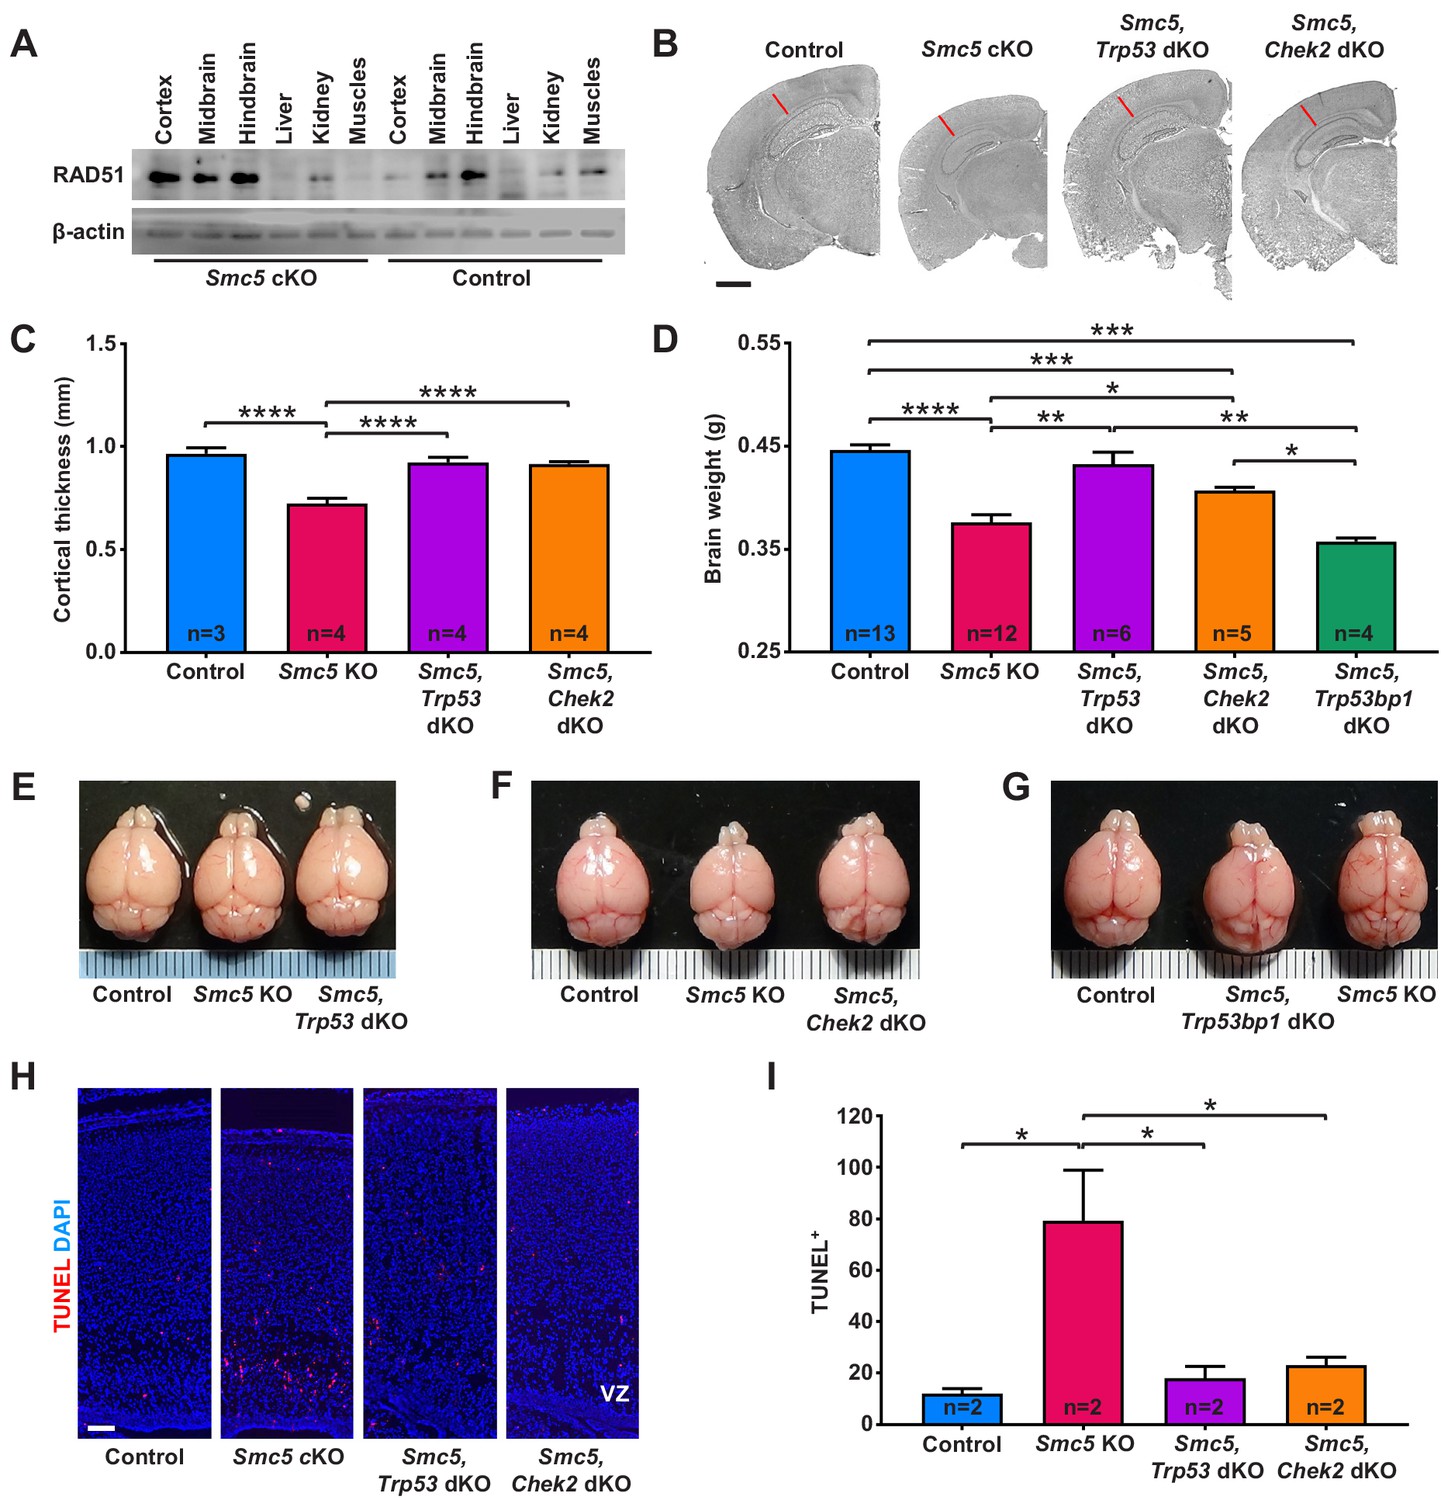
Apoptosis of neural progenitor cells in Smc5 conditional knockout (cKO) mice is mediated by p53 and CHEK2 pathways.
(A) Western blot analysis of RAD51 levels in control and Smc5 cKO (Nestin-Cre) E16.5 tissues. β-actin was used as a loading control (n = 2). (B) Representative hematoxylin and eosin-stained control; Smc5 cKO; Smc5, Trp53 double knockout (dKO); and Smc5, Chek2 dKO (Emx1-Cre) P55 coronal brain sections. Red line represents cortical thickness of Smc5 cKO. Scale bar: 1000 µm. (C) Quantification of cortical thickness (mm) in control (n = 3); Smc5 cKO (n = 4); Smc5, Trp53 dKO (n = 4); and Smc5, Chek2 dKO (n = 4) (Emx1-Cre) P54-57 brains. Data represent mean ± S.E.M. Unpaired two-tailed Mann–Whitney test, p-values are shown in Supplementary file 3. (D) Quantification of control (n = 13); Smc5 cKO (n = 12); Smc5, Trp53 dKO (n = 6); Smc5, Chek2 dKO (n = 5); and Smc5, 53 bp1 dKO (n = 4) (Emx1-Cre) P55-57 brain weight. Data represent mean ± S.E.M. Unpaired two-tailed Mann–Whitney test, p-values are shown in Supplementary file 3. (E–G) Representative images of (E) control; Smc5 cKO; and Smc5, Trp53 dKO; (F) control; Smc5 cKO; and Smc5 Chek2 dKO; and (G) control; Smc5, Trp53bp1 dKO; and Smc5 cKO (Emx1-Cre) P55 brains. Metric ruler is provided for scale. (H) Representative images of TUNEL+ nuclei (red) in control; Smc5 cKO; Smc5, Trp53 dKO; and Smc5, Chek2 dKO (Emx1-Cre) P0/1 sagittal brain sections prepared from heads; DAPI (blue). Column width: 500 µm, scale bar: 100 µm. (I) Quantification of the number of TUNEL+ nuclei within 800 µm columns in brain sections related to (H). Data represent mean ± S.E.M. (control animals n = 2; Smc5 cKO animals n = 2; Smc5, Trp53 dKO animals n = 2; Smc5, Chek2 dKO animals n = 2). Unpaired two-tailed Mann–Whitney test, p-values are shown in Supplementary file 3.
Figure 2—figure supplement 1
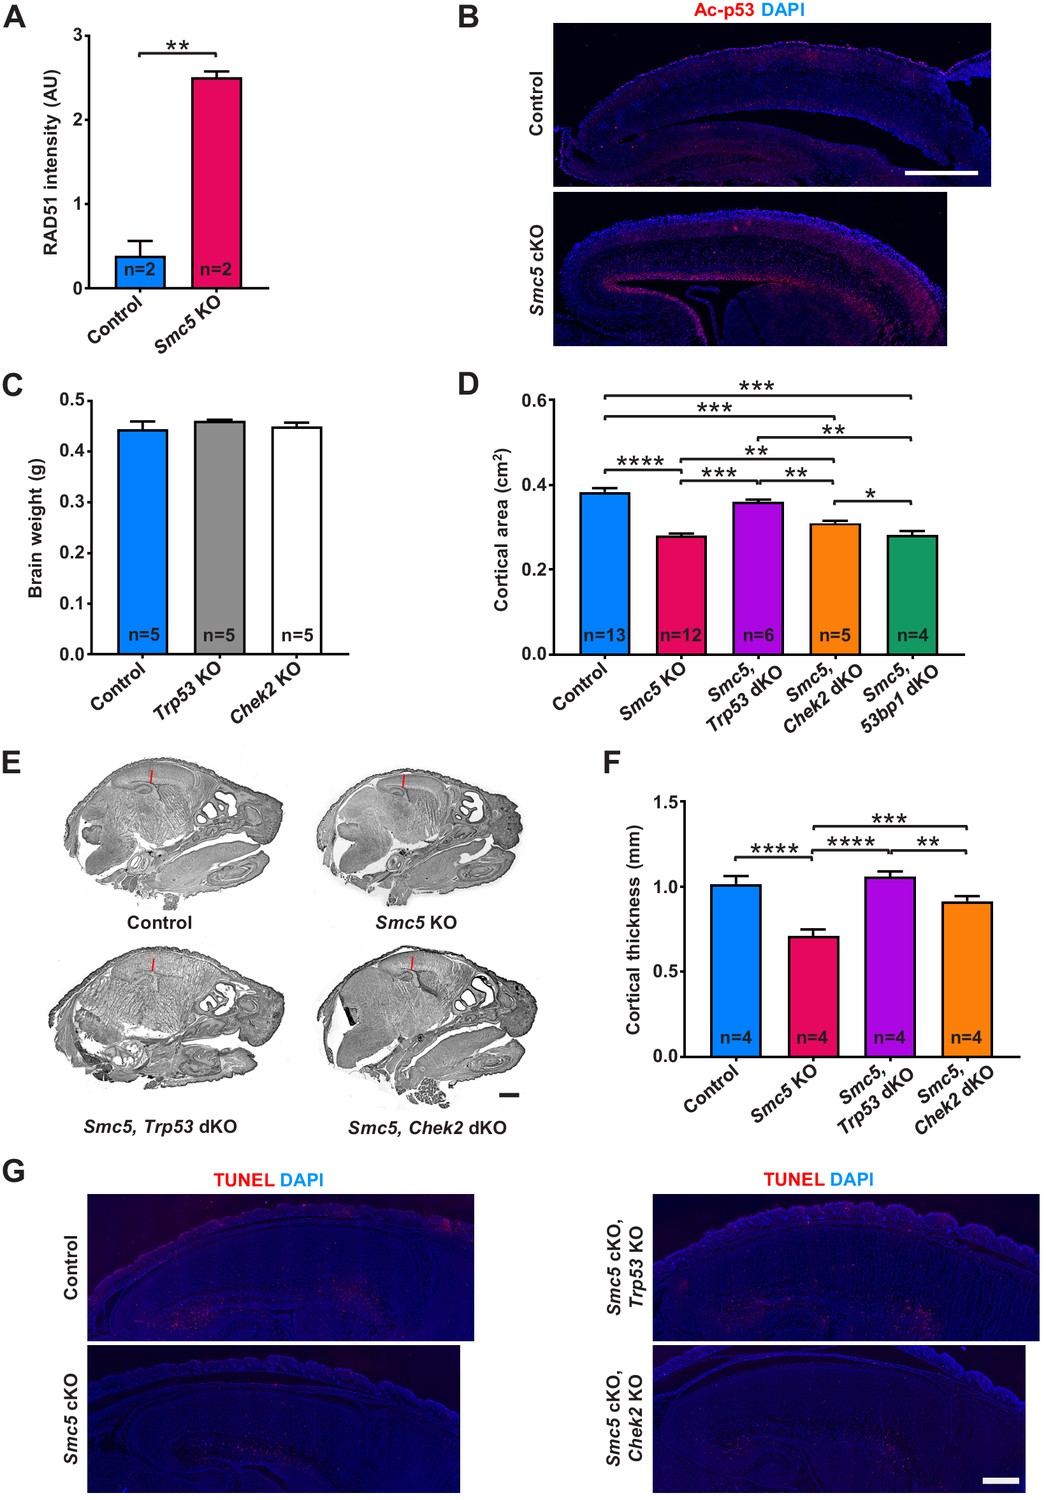
Cortical size in Smc5 conditional knockout (cKO) mice can be restored by inhibition of p53 and CHEK2 pathways.
(A) Quantification of the relative RAD51 protein levels from Figure 2A in E16.5 control and Smc5 cKO (Nestin-Cre) cortices. RAD51 protein levels were normalized to β-actin. Data represent unpaired two-tailed Student’s t-test, **p=0.0078 (n = 2). (B) Images of sagittal E16.5 cortical sections of control and Smc5 cKO (Emx1-Cre) mice stained for acetyl-p53 (red) and DAPI (blue). Scale bar: 500 µm. (C) Quantification of control (n = 5), Trp53 KO (n = 5), and Chek2 KO (n = 5) (Emx1-Cre) P55-57 brain weight. Data represent mean ± S.E.M. Difference is not significant. All p-values are shown in Supplementary file 3. (D) Quantification of the cortical area in control (n = 13); Smc5 cKO (n = 12); Smc5, Trp53 dKO (n = 6); Smc5, Chek2 dKO (n = 5); and Smc5, Trp53bp1 dKO (n = 4) (Emx1-Cre) P55-57 brains. Data represent mean ± S.E.M. Unpaired two-tailed Mann–Whitney test, p-values are shown in Supplementary file 3. (E) Representative H and E staining of control; Smc5 cKO; Smc5, Trp53 dKO and Smc5, Chek2 dKO (Emx1-Cre) P1 sagittal head sections. Scale bar: 1000 µm. (F) Quantification of the cortical thickness in P0/1 heads of control (n = 4), Smc5 cKO (n = 4), Smc5, Trp53 dKO (n = 4), and Smc5, Chek2 dKO (n = 4) (Emx1-Cre) mice, see Supplementary file 3 for details. Data represent mean ± S.E.M. Unpaired two-tailed Mann–Whitney test, p-values are shown in Supplementary file 3. (G) Representative images of TUNEL+ nuclei (red) in control; Smc5 cKO; Smc5, Trp53 dKO and Smc5, Chek2 dKO (Emx1-Cre) P0/1 sagittal cortex sections prepared from heads, related to figure (2H); DAPI (blue). Scale bar: 500 µm.
Figure 3 with 1 supplement
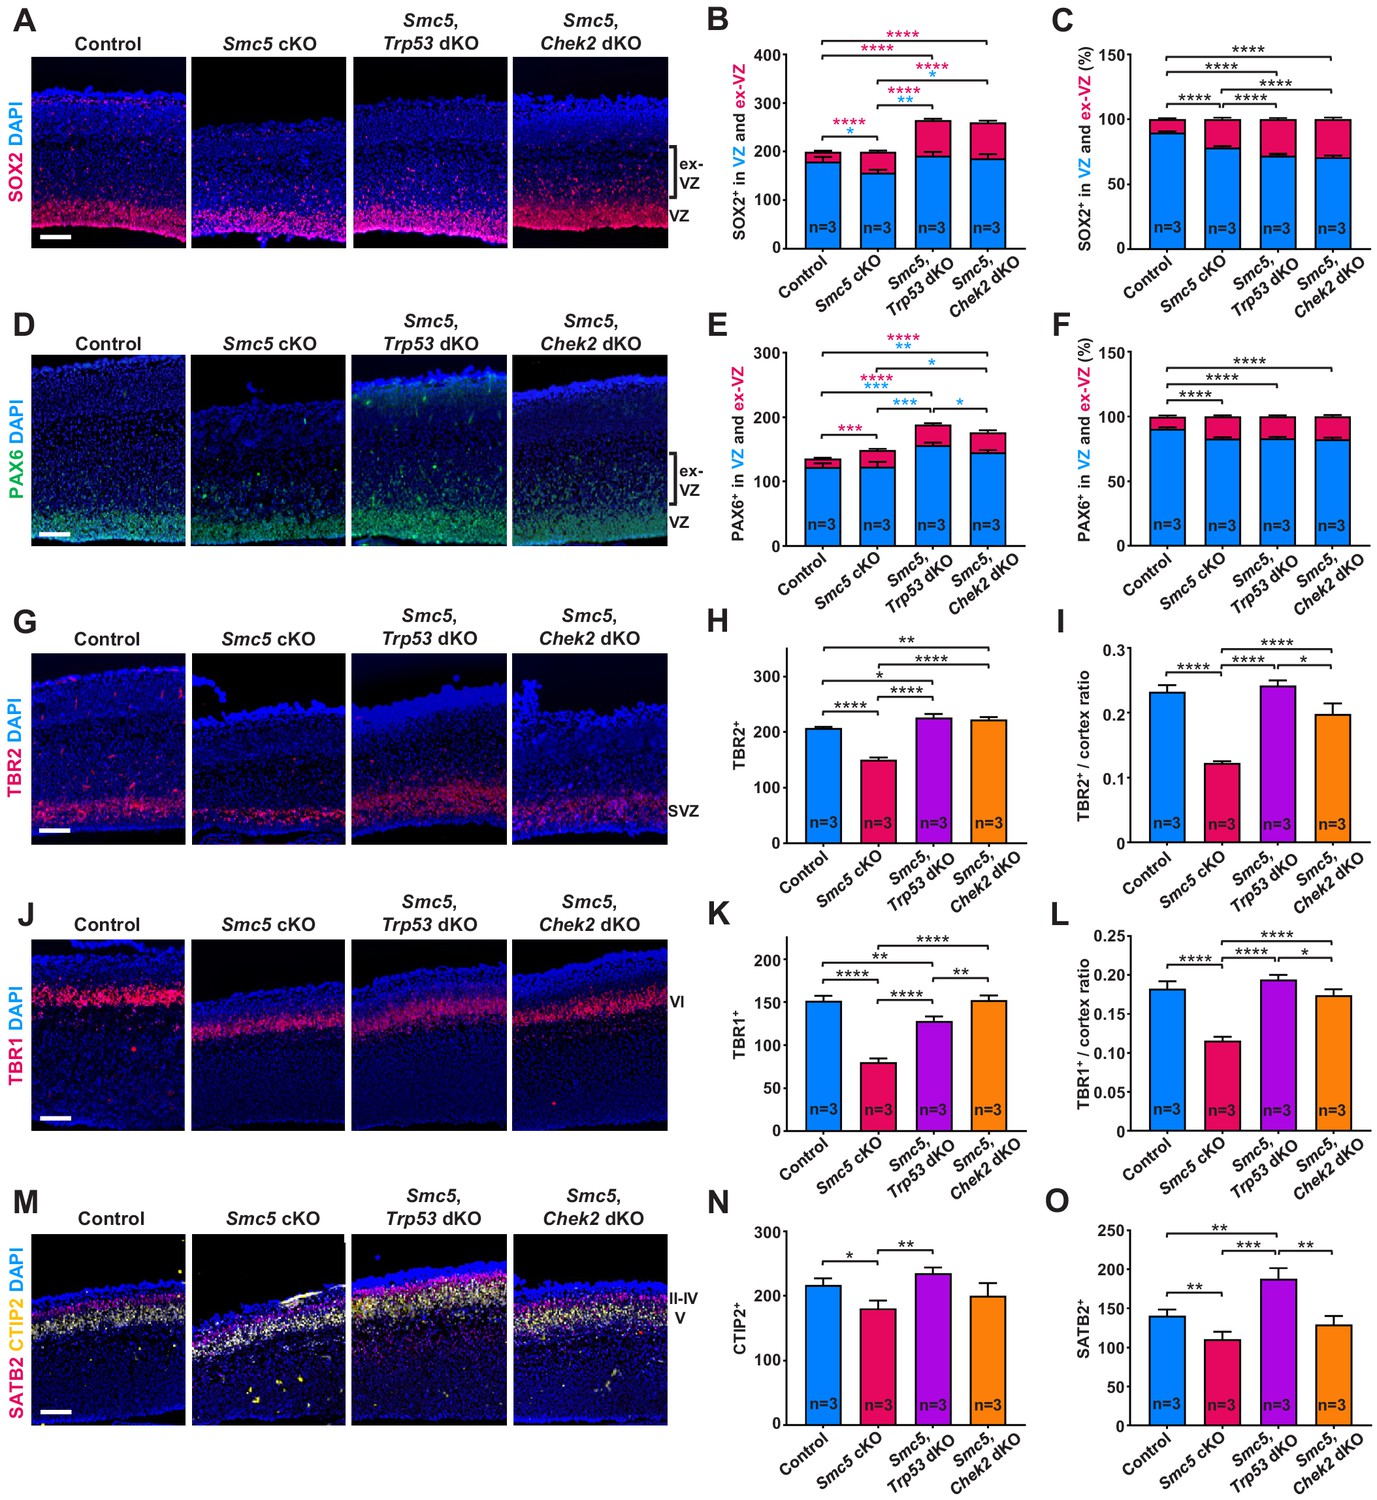
SMC5 loss causes abnormal cortical development.
Representative immunostaining of control; Smc5 conditional knockout (cKO); Smc5, Trp53 double knockout (dKO) and Smc5, Chek2 dKO (Emx1-Cre) E16.5 sagittal brain sections and quantification for: (A) SOX2 (red) (ventricular zone [VZ]), DAPI (blue). Bracket on the right shows extra-VZ (ex-VZ). (B) Quantification of SOX2+ cells in 150 µm columns in the VZ and extra-VZ from brain sections related to (A). (C) Percentage of SOX2+ cells in the VZ and extra-VZ within 150 µm columns in brain sections related to (A). (D) PAX6 (green) (VZ); DAPI (blue). Bracket on the right shows extra-VZ (ex-VZ). (E) Quantification of PAX6+ cells within 150 µm columns in the VZ and extra-VZ in brain sections related to (D). (F) Percentage of PAX6+ cells in the VZ and extra-VZ within 150 µm columns in brain sections related to (D). (G) TBR2 (red) (SVZ); DAPI (blue). (H) Quantification of TBR2+ cells within 150 µm columns in the SVZ in brain sections related to (G). (I) Quantification of TBR2-stained area thickness to cortical thickness ratio in brain sections related to (G). (J) TBR1 (red) (layer VI); DAPI (blue). (K) Quantification of TBR1+ cells within 150 µm columns in brain sections related to (J). (L) Quantification of TBR1-stained area thickness to cortical thickness ratio in brain sections related to (J). (M) CTIP2 (yellow) (layer V) and SATB2 (red) (layer II-V); DAPI (blue). (N) Quantification of CTIP+ cells within 300 µm columns in brain sections related to (M). (O) Quantification of SATB2+ cells within 300 µm columns in brain sections related to (M). For images A, D, G, J, and M column width: 500 µm, scale bar: 100 µm. For all graphs data represent mean ± S.E.M. Control animals n = 3; Smc5 cKO animals n = 3; Smc5, Trp53 dKO animals n = 3; Smc5, Chek2 dKO animals n = 3. For all graphs except C and F p-values were determined using unpaired two-tailed Mann–Whitney test. Pearson's chi-squared test with Yates’ continuity correction was applied to determine p-value for graphs C and F. All p-values are shown in Supplementary file 3.
Figure 3—figure supplement 1
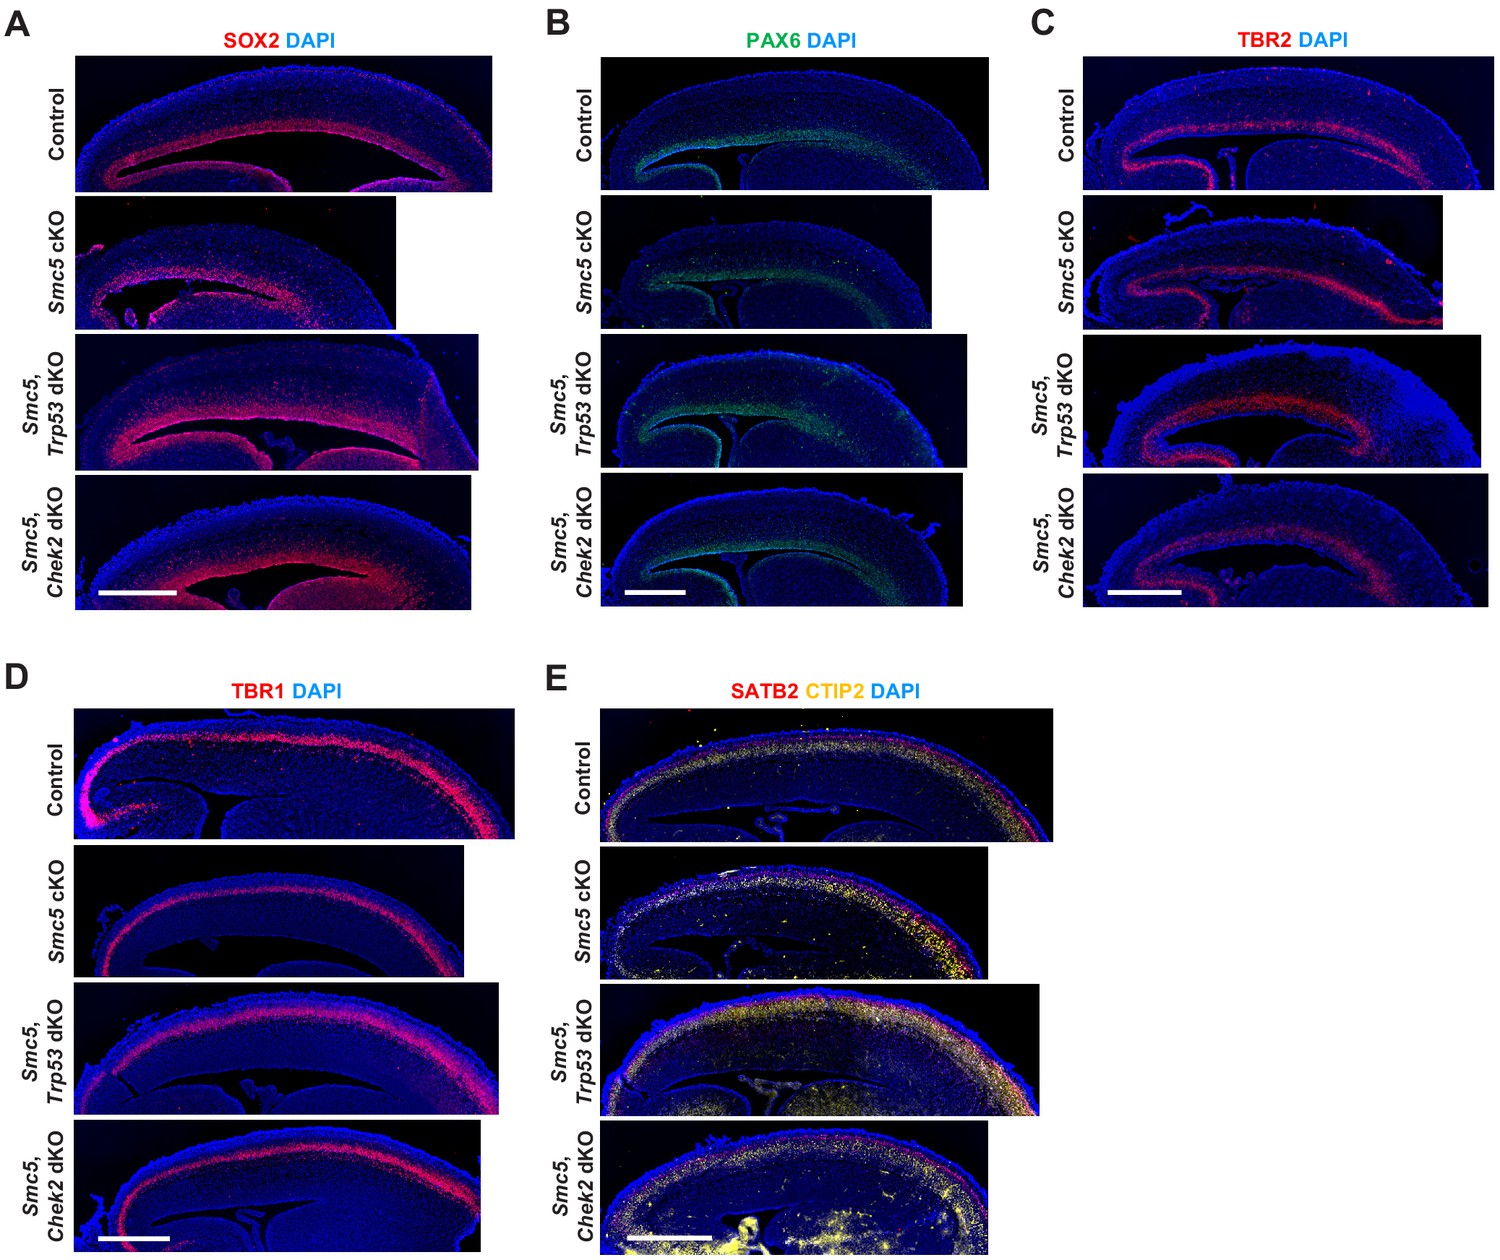
Representative staining of E16.5 brains for cortical layer markers.
Images of whole sagittal cortical sections of control; Smc5 conditional knockout; Smc5, Trp53 double knockout (dKO), and Smc5, Chek2 dKO (Emx1-Cre) brains stained for (A) SOX2 (red), related to Figure 3A; (B) PAX6 (green), related to Figure 3D; (C) TBR2 (red), related to Figure 3G; (D) TBR1 (red), related to Figure 3J; (E) SATB2 (red) and CTIP2 (yellow), related to Figure 3M. DAPI (blue). Scale bar: 500 µm.
Figure 4 with 1 supplement

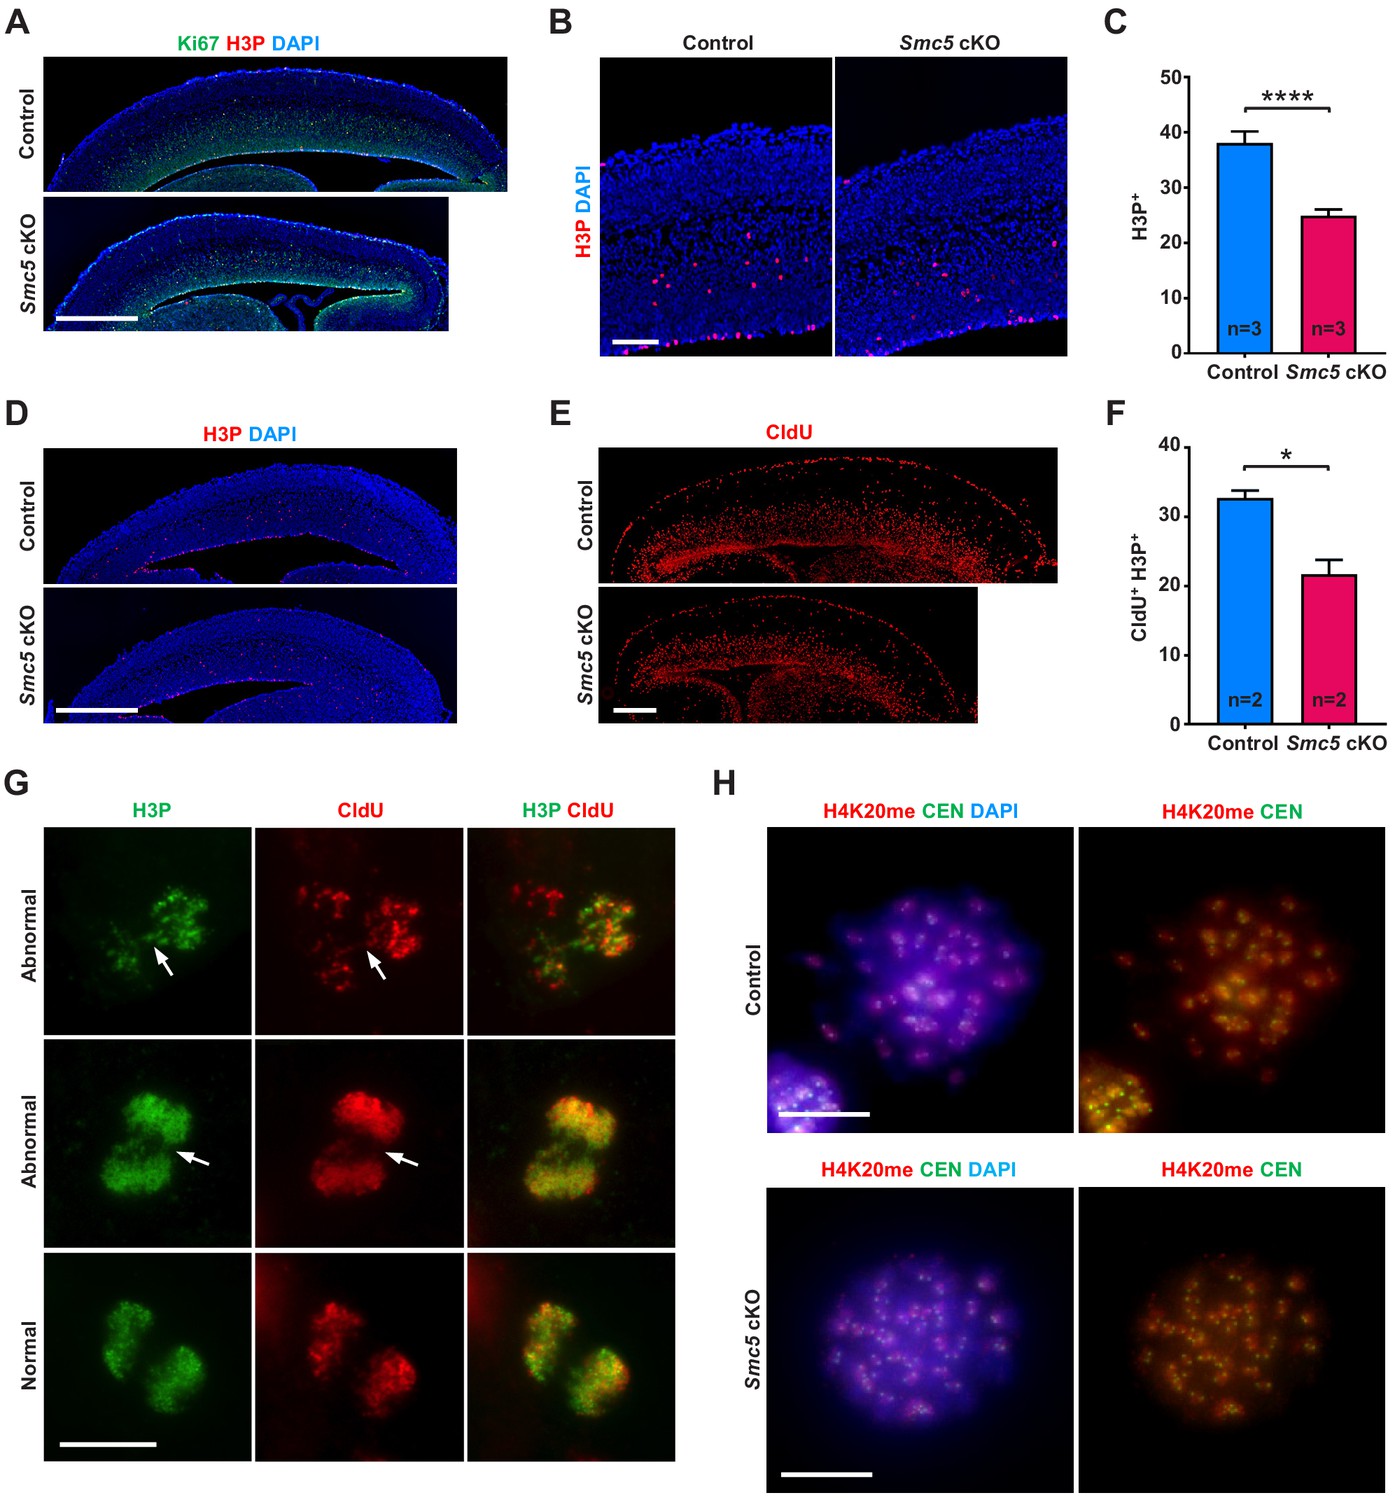
DNA replication stress is a possible reason forSMC5-deficient neural progenitor cell death.
(A) Representative Ki67 (green) and H3P (red) staining of control and Smc5 conditional knockout (cKO; Emx1-Cre) E16.5 sagittal cortical sections, DAPI (blue). Column width: 250 µm, scale bar: 100 µm. (B) Quantification of Ki67+ cells within 300 µm columns in brain sections related to (A). Data represent mean ± S.E.M. (control animals n = 3, Smc5 cKO animals n = 3, see Supplementary file 3 for details). Unpaired two-tailed Mann–Whitney test, *p=0.0443. (C) Quantification of H3P+ cells within 300 μm columns in brain sections related to (A). Data represent mean ± S.E.M. (control animals n = 3, Smc5 cKO animals n = 3, see Supplementary file 3 for details). Unpaired two-tailed Mann–Whitney test, ****p<0.0001. (D) Quantification of H3P+Ki67+/Ki67+ cell ratio within 300 μm columns in brain sections related to (A). Data represent mean ± S.E.M. (control animals n = 3, Smc5 cKO animals n = 3, see Supplementary file 3 for details). Unpaired two-tailed Mann–Whitney test, *p=0.0130. (E) Representative CldU (red) and H3P (green) staining of control and Smc5 cKO (Emx1-Cre) E16.5 sagittal brain sections. Column width 300 µm, scale bar: 100 µm. (F) Quantification of CldU+ cells within 300 µm columns in brain sections related to (E). Data represent mean ± S.E.M. (control animals n = 2; Smc5 cKO animals n = 2, see Supplementary file 3 for details). Unpaired two-tailed Mann–Whitney test, *p=0.0286. (G) Quantification of CldU+H3P+/CldU+ cell ratio within 300 µm columns in brain sections related to (E). Data represent mean ± S.E.M. (control animals n = 2; Smc5 cKO animals n = 2, see Supplementary file 3 for details). Unpaired two-tailed Mann–Whitney test, ns, not significant. (H) Representative images of normal and abnormal anaphase cells from E16.5 Smc5 cKO (Emx1-Cre) cortices stained with CldU (red) and H3P (green). Dashed rectangle outlines CldU+ chromatin bridge. Scale bar: 5 µm. (I) Representative FANCD2 (green) and CEN (red) staining of control and Smc5 cKO (Nestin-Cre) E16.5 cortical cell spreads; DAPI (white). Insets depict magnified individual chromosomes. Scale bar: 5 µm. (J) Quantification of average number of FANCD2 foci in cortical cells related to (I). Data represent mean ± S.D. (control animals n = 2; control cells n = 21; Smc5 cKO animals n = 2; Smc5 cKO cells n = 27). Unpaired two-tailed Mann–Whitney test, ****p<0.0001. (K) Quantification of average number of FANCD2+CEN+ foci in cortical cells related to (I). Data represent mean ± S.D. (control animals n = 2; control cells n = 20; Smc5 cKO animals n = 2; Smc5 cKO cells n = 27). Unpaired two-tailed Mann–Whitney test, ****p<0.0001. (L) Representative H4K20me (red) and centromere (CEN) (green) staining of control and Smc5 cKO (Nestin-Cre) E16.5 cortical cell chromosome spreads; DAPI (blue). Insets depict magnified individual chromosomes. Scale bar: 10 µm. (M) Quantification of average width of pericentromeric H4K20me signal in cortical cells related to (L). Data represent mean ± S.D. (control animals n = 2; control cells n = 32; Smc5 cKO animals n = 2; Smc5 cKO cells n = 43). Unpaired two-tailed Mann–Whitney test, ****p<0.0001. (N) Quantification of average intensity of pericentromeric H4K20me signal in cortical cells related to (L). Data represent mean ± S.D. (control animals n = 2; control cells n = 32; Smc5 cKO animals n = 2; Smc5 cKO cells n = 43). Unpaired two-tailed Mann–Whitney test, ****p<0.0001.
Figure 4—figure supplement 1
Representative staining of E16.5 cortices for proliferative cell markers.
(A) Images of whole sagittal cortical sections of control and Smc5 conditional knockout (cKO; Emx1-Cre) mice stained for Ki67 (green), H3P (red), and DAPI (blue) related to Figure 4A. Scale bar: 500 µm. (B) Representative H3P (red) staining of control and Smc5 cKO (Emx1-Cre) sagittal cortical sections, DAPI (blue). Column width: 500 µm, scale bar: 100 µm. (C) Quantification of H3P+ cells in 300 µm columns represented in (B). Data represent mean ± S.E.M. (control animals n = 3, Smc5 cKO animals n = 3, see Supplementary file 3 for details). Unpaired two-tailed Mann–Whitney test, ****p<0.0001. (D) Images of whole sagittal cortical sections of control and Smc5 cKO (Emx1-Cre) mice stained for H3P (red), DAPI (blue) related to (B). Scale bar: 500 µm. (E) Representative images of whole sagittal cortical sections of control and Smc5 cKO (Emx1-Cre) mice stained for CldU (red). Scale bar: 300 µm. (F) Quantification of CldU+H3P+ cells within 300 µm columns in brain sections related to Figure 4E. Data represent mean ± S.E.M. (control animals n = 2; Smc5 cKO animals n = 2, see Supplementary file 3 for details). Unpaired two-tailed Mann–Whitney test, *p=0.0286. (G) Representative images of normal and abnormal anaphase cells from E16.5 Smc5 cKO (Emx1-Cre) cortices stained with CldU (red) and H3P (green). Scale bar: 10 µm. (H) Representative H4K20me (red) and centromere (CEN) (green) staining of control and Smc5 cKO (Nestin-Cre) E16.5 cortical cell chromosome spreads; DAPI (blue). Scale bar: 10 µm.
Figure 5 with 1 supplement
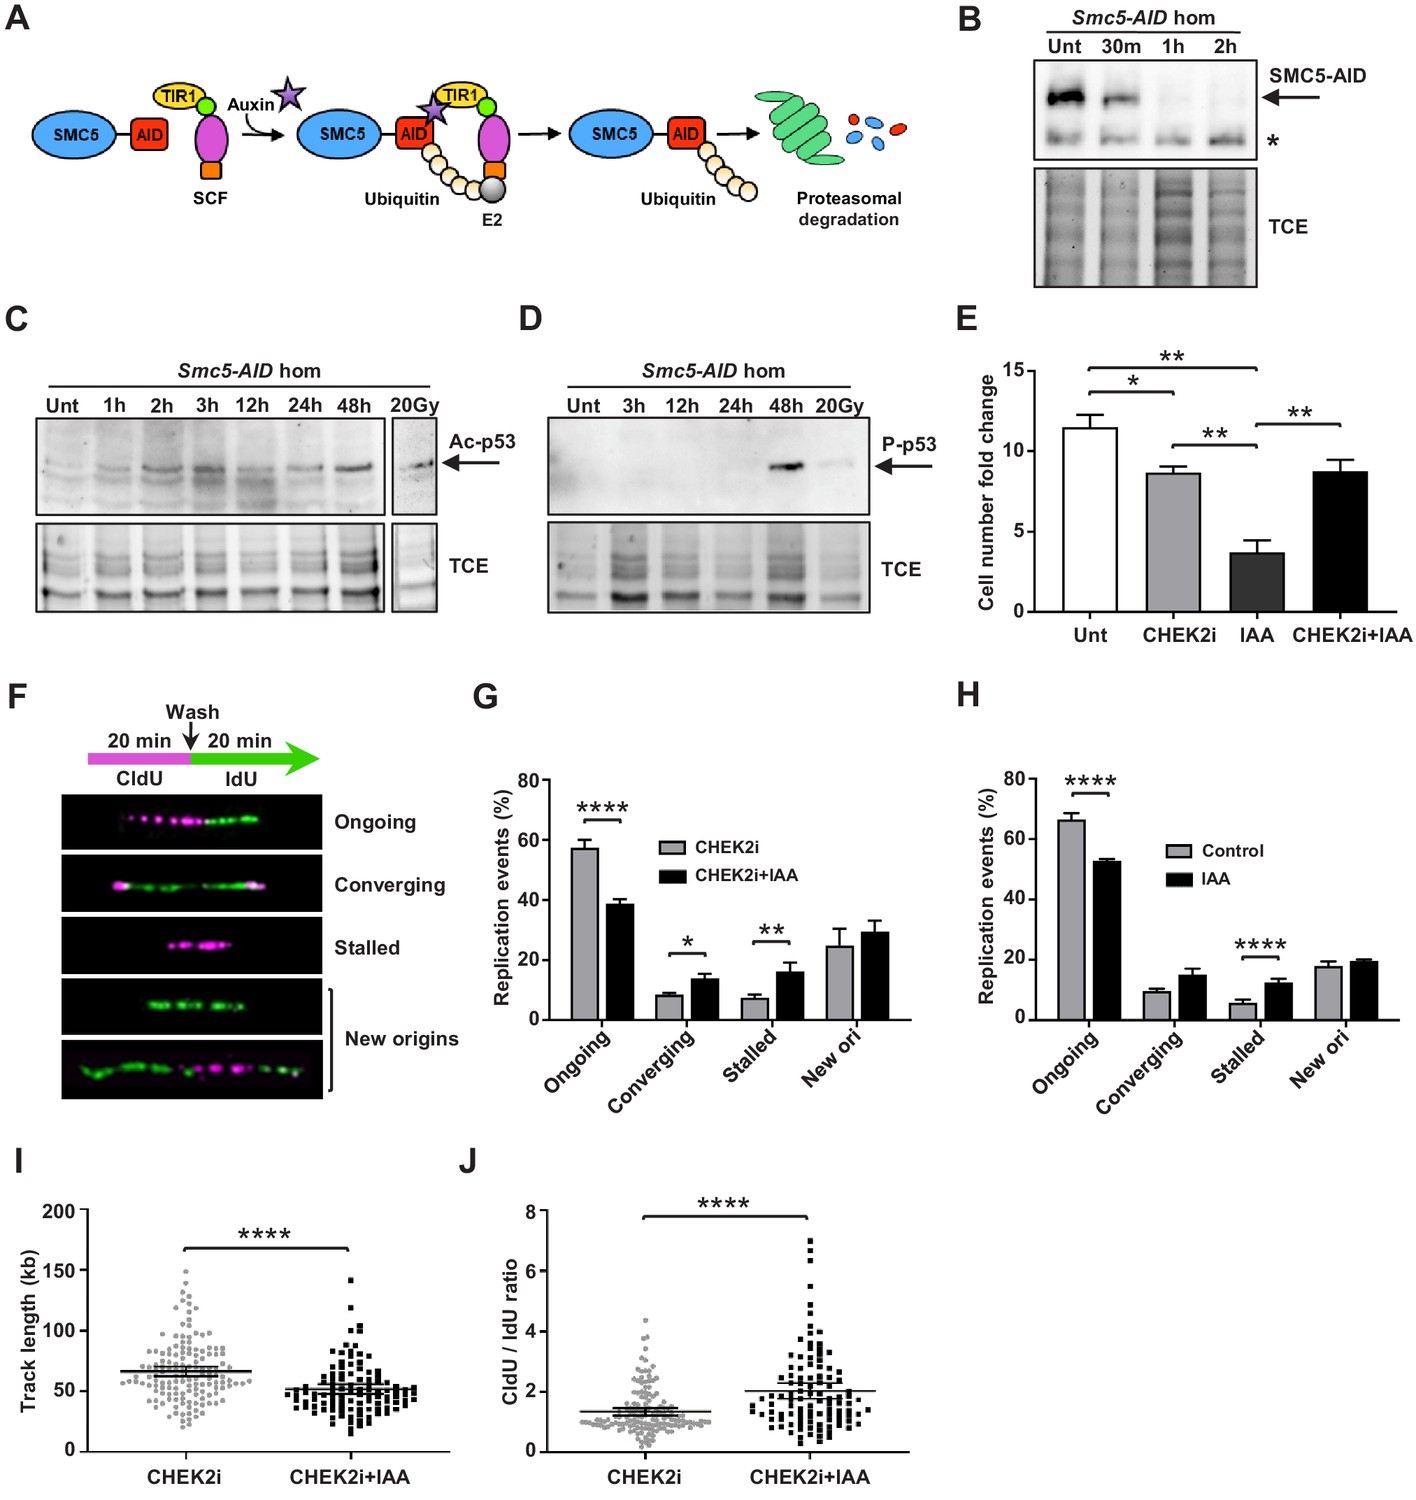
Depletion of SMC5 in mESCs perturbs cell growth and causes increased replication stress.
(A) Schematic of AID system. Upon addition of IAA, SMC5-AID is ubiquitinated by the SKP1, CULLIN1, F-box (SCF) complex and degraded by the proteasome. (B) Western blot analysis of SMC5-AID protein levels over a time course of IAA (100 µM) treatment (Unt, untreated, 30 min, 1 hr, 2 hr) in Smc5-AID homozygous mESCs. Asterisk marks nonspecific band. 2,2,2-Trichloroethanol (TCE) was incorporated in the gel to visualize total loaded protein. (C) Western blot analysis of acetyl-p53 (K379) protein levels over a time course of IAA (100 µM) treatment (Unt, untreated, 1 hr, 2 hr, 3 hr, 12 hr, 24 hr, 48 hr) in Smc5-AID homozygous mESCs. A separate western blot of acetyl-p53 (K379) in Smc5-AID homozygous mESCs treated with 20 Gy of gamma-irradiation is shown on the right. 2,2,2-Trichloroethanol (TCE) was incorporated in the gel to visualize total loaded protein. (D) Western blot analysis of phospho-p53 (S389) protein levels over a time course of IAA (100 µM) treatment (Unt, untreated, 3 hr, 12 hr, 24 hr, 48 hr), and with 20 Gy of gamma-irradiation , in Smc5-AID homozygous mESCs. 2,2,2-Trichloroethanol (TCE) was incorporated in the gel to visualize total loaded protein. (E) Smc5-AID mESC number fold change over 48 hr of cell culture without treatment (Unt), and in the presence of IAA (100 µM), CHEK2 inhibitor (CHEK2i) (10 µM), or IAA and CHEK2 inhibitor (CHEK2i + IAA). Data represent mean ± S.E.M. (n = 3). Unpaired two-tailed t-test, untreated versus CHEK2i *p=0.0289, untreated versus IAA **p=0.0019; IAA versus CHEK2i **p=0.0042; IAA versus CHEK2i+IAA **p=0.0086 (see Supplementary file 3 for details). (F) DNA labeling scheme and representative images of DNA fibers labeled with CldU (30 µM) (magenta) and IdU (250 µM) (green) depicting ongoing forks, double-stalled converging forks, stalled forks, and new origins. (G) Quantification of replication events in Smc5-AID mESCs treated for 12 hr with CHEK2i and IAA or CHEK2i alone. Data represent mean ± S.E.M. (CHEK2i condition: n = 354 fibers from three experiments, CHEK2i + IAA condition: n = 429 fibers from three experiments). Pearson’s chi-squared test with Yates’ continuity correction, *p=0.0436, **p=0.0025, ****p<0.0001 (see Supplementary file 3 for details). (H) Quantification of replication events in control Smc5-AID mESCs or Smc5-AID mESCs treated for 12 hr with IAA. Data represent mean ± S.E.M. (control condition: n = 334 fibers from three experiments, IAA condition: n = 558 fibers from three experiments). Pearson’s chi-squared test with Yates’ continuity correction, ****p<0.0001 (see Supplementary file 3 for details). (I) Quantification of DNA fiber track length in Smc5-AID mESCs treated for 12 hr with CHEK2i and IAA or CHEK2i alone. Data represent mean ± 95% C.I. (confidence interval) (CHEK2i condition: n = 142 fibers from three experiments, CHEK2i + IAA condition: n = 107 fibers from three experiments). Unpaired two-tailed Mann–Whitney test, ****p<0.0001. (J) Quantification of DNA fiber CldU/IdU ratio in Smc5-AID mESCs treated for 12 hr with CHEK2i and IAA or CHEK2i alone. Data represent mean ± 95% C.I. (CHEK2i condition: n = 142 fibers from three experiments, CHEK2i + IAA condition: n = 107 fibers from three experiments). Unpaired two-tailed Mann–Whitney test ****p<0.0001.
Figure 5—figure supplement 1

Depletion of SMC5 in mESCs perturbs cell growth and causes increased replication stress.
(A) Western blot analysis of SMC5-AID and TIR-HA protein expression in TIR1-only mESCs and Smc5-AID homozygous mESCs over a time course of IAA (100 µM) treatment (Unt, untreated, 30 min, 1 hr, 2 hr, 3 hr). Asterisk marks nonspecific band. (B) Smc5-AID mESC number fold change over 48 hr of cell culture without treatment (Unt), in the presence of p53 inhibitor (10 µM) (p53i), IAA (100 µM) or p53 inhibitor and IAA (p53i + IAA). Data represent mean ± S.E.M. (n = 2). (C) Smc5-AID mESC number fold change over 48 hr of cell culture without treatment (Unt), in the presence of CHEK1 inhibitor (3 µM) (CHEK1i), IAA (100 µM) or CHEK1 inhibitor and IAA (CHEK1i + IAA). Data represent mean ± S.E.M. (n = 2). (D) Representative images of phospho-p53 (P-p53) (red) and H3P (green) staining of control and IAA-treated Smc5-AID mESCs; DAPI (blue). Magnified images of cells in punctate squares are shown on the right. Scale bar: 50 µm, scale bar (zoom): 10 µm. (E) Quantification of P-p53+ cell percentage and total cell percentage in G1, S/G2, prophase (Pro) and other mitotic (Other M) stages. Data represent mean ± S.E.M. (control condition: n = 1452 cells from three experiments; IAA condition: n = 913 cells from three experiments). Pearson's chi-squared test with Yates’ continuity correction, ***p=0.0001, ****p<0.0001. (F) Quantification of the percentage of G1, S/G2, and prophase cells in the P-p53+ cell population. Data represent mean ± S.E.M. (control condition: n = 96 cells from three experiments; IAA condition: n = 473 cells from three experiments). Pearson's chi-squared test with Yates’ continuity correction, *p=0.0143, ****p<0.0001. (G) Quantification of replication events in Smc5-AID mESCs treated for 12 hr with p53 inhibitor (p53i) alone or p53 inhibitor and IAA (p53i + IAA). Data represent mean ± S.E.M. (p53i condition: n = 173 fibers from two experiments, p53i + IAA condition: n = 114 fibers from two experiments). Pearson’s chi-squared test with Yates’ continuity correction, ongoing forks *p=0.0112, converging forks *p=0.0471, see Supplementary file 3 for details. (H) Quantification of DNA fiber track length in Smc5-AID mESCs treated for 12 hr with IAA, and control Smc5-AID mESCs. Data represent mean ± S.E.M. (control condition: n = 80 fibers from three experiments, IAA condition: n = 127 fibers from three experiments). Unpaired two-tailed Mann–Whitney test, *p=0.0134. (I) Quantification of DNA fiber CldU/IdU ratio in Smc5-AID mESCs treated for 12 hr with IAA, and control Smc5-AID mESCs. Data represent mean ± S.E.M. (control condition: n = 63 fibers from three experiments, IAA condition: n = 64 fibers from three experiments). Unpaired two-tailed Mann–Whitney test ****p<0.0001.
Figure 6 with 1 supplement

Replication stress in SMC5-depleted mESCs leads to MiDAS.
(A) Schematic of IAA treatment, cell synchronization with RO3306 (8 µM) and STLC (10 µM), and labeling with EdU (10 µM) for assessment of MiDAS foci. (B) Representative images of EdU (magenta), FANCD2 (red), and centromere (CEN) (green) staining of metaphase chromosomes from control and IAA-treated Smc5-AID mESCs; DAPI (white). Insets depict magnified individual chromosomes with combined channels and separate channels. Scale bar: 5 µm. (C) Quantification of EdU+ foci per chromosome in control (n = 34) and IAA-treated (n = 37) mESCs. Data represent mean and range. Unpaired two-tailed Mann–Whitney test, ****p<0.0001. (D) Quantification of EdU+FANCD2+ foci per chromosome in control (n = 34) and IAA-treated (n = 37) mESCs. Data represent mean and range. Unpaired two-tailed Mann–Whitney test, ****p<0.0001. (E) Quantification of EdU+CEN+ foci per chromosome in control (n = 34) and IAA-treated (n = 37) mESCs. Data represent mean and range. Unpaired two-tailed Mann–Whitney test, ****p<0.0001. (F) Quantification of EdU+FANCD2+CEN+ foci per chromosome in control (n = 34) and IAA-treated (n = 37) mESCs. Data represent mean and range. Unpaired two-tailed Mann–Whitney test, ****p<0.0001.
Figure 6—figure supplement 1
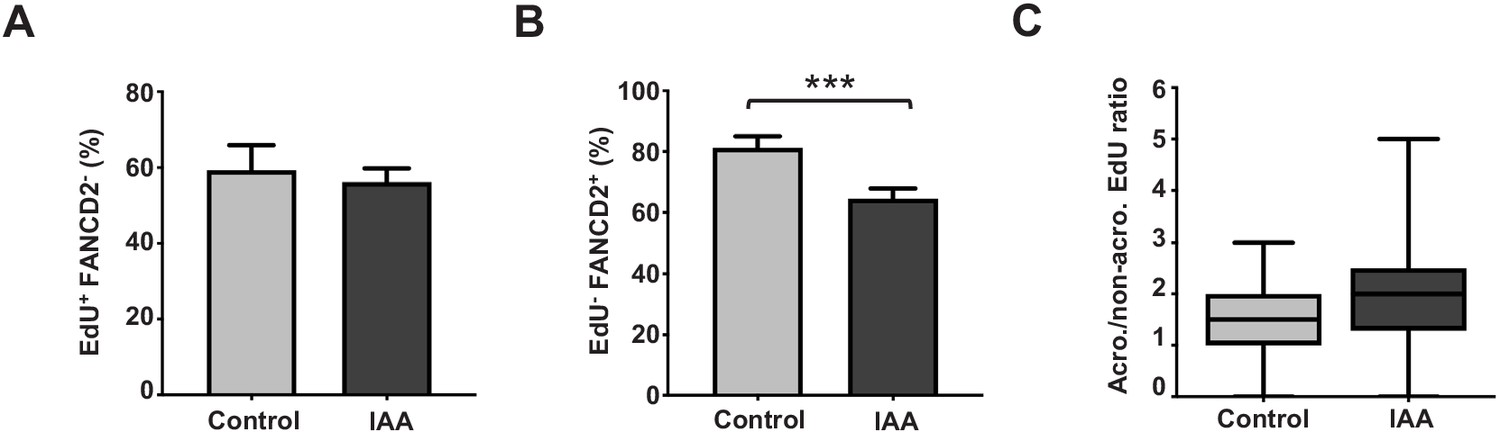
Quantification of EdU+ and FANCD2+ foci in mESCs.
(A) Quantification of percentage of EdU+FANCD2- foci (out of total EdU+ foci) in control (n = 29) and IAA-treated (n = 33) mESCs. Data represent mean ± S.E.M. (B) Quantification of percentage of EdU-FANCD2+ foci (out of total FANCD2+ foci) in control (n = 32) and IAA-treated (n = 33) mESCs. Data represent mean ± S.E.M. Unpaired two-tailed Mann–Whitney test, ***p=0.0002. (C) Quantification of number of acrocentric/non-acrocentric (acro./non-acro.) EdU+ foci in control (n = 19) and IAA-treated (n = 31) mESCs. Data represent mean and range.
Figure 7
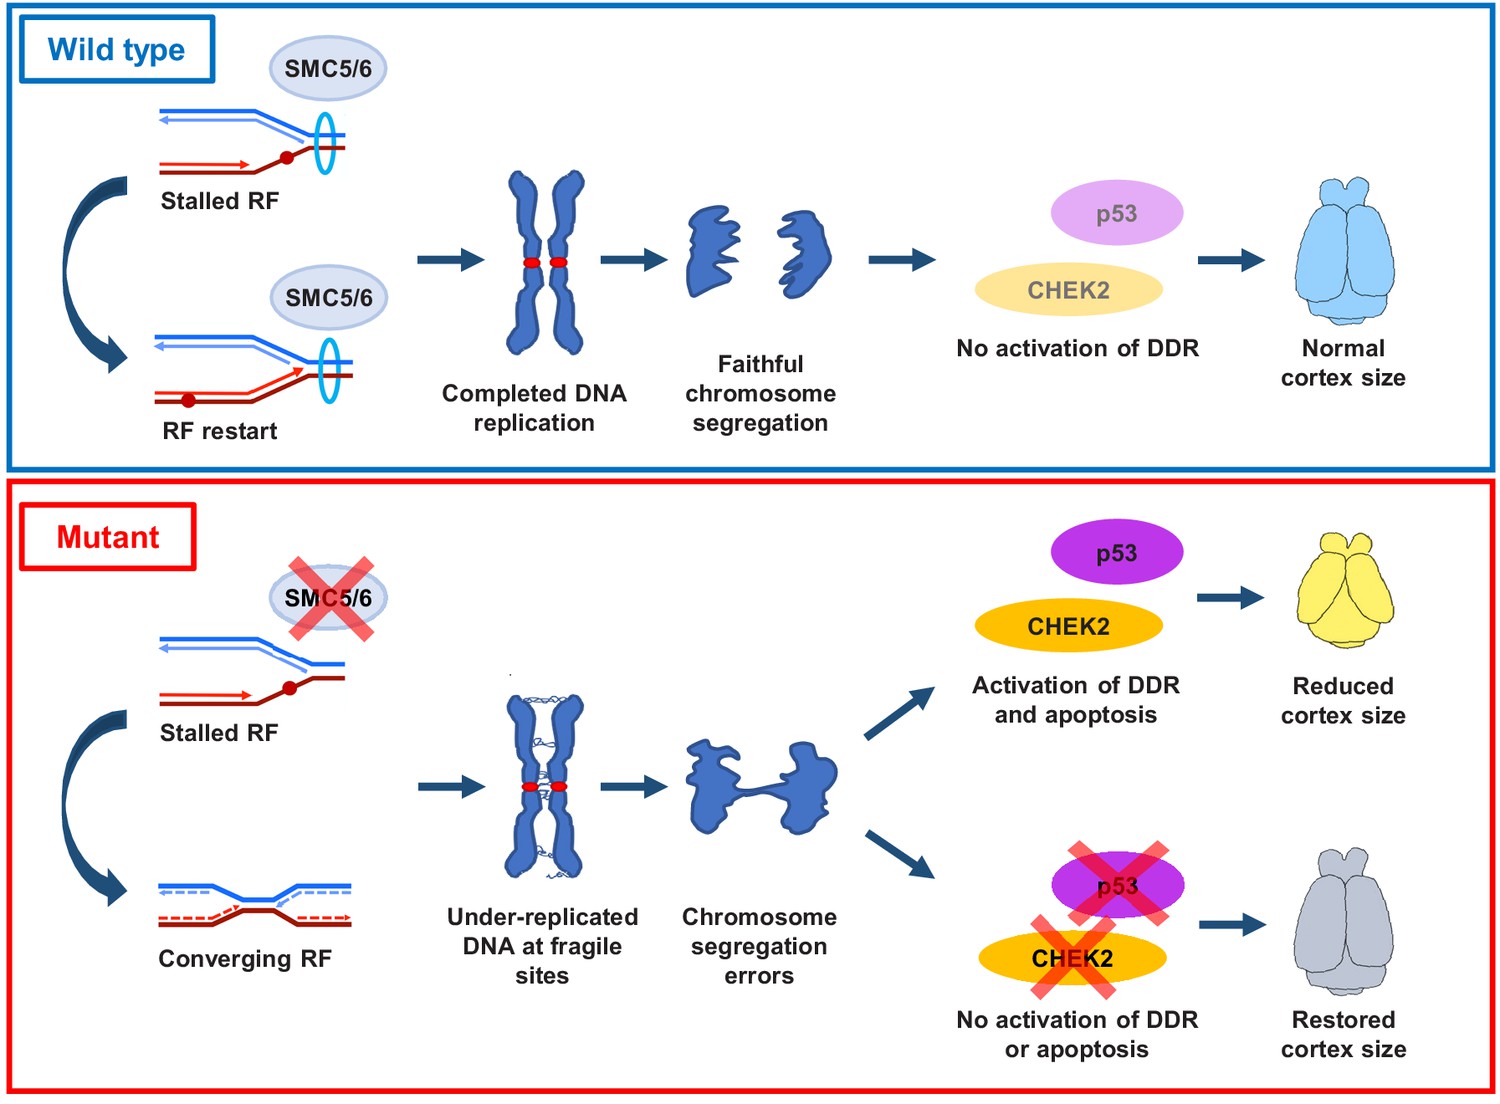
Proposed SMC5/6 complex functions in mammalian cortical development.
SMC5/6 complex depletion in developing mouse cortex causes increased DNA replication stress at fragile sites, such as late-replicating heterochromatin. Unrepaired DNA and DNA intermediates persist into mitosis resulting in chromosome segregation defects. Acquired DNA damage triggers DNA damage response (DDR) and CHEK2- and p53-mediated apoptosis, resulting in reduced cortex size. Abrogation of p53 and CHEK2 functions alleviates SMC5 depletion phenotype. RF = replication fork; DDR = DNA damage response.
Additional files
-
Supplementary file 1
Primers used in this study.
- https://cdn.elifesciences.org/articles/61171/elife-61171-supp1-v2.xlsx
-
Supplementary file 2
Antibodies used in this study.
- https://cdn.elifesciences.org/articles/61171/elife-61171-supp2-v2.xlsx
-
Supplementary file 3
Statistics and p-values.
- https://cdn.elifesciences.org/articles/61171/elife-61171-supp3-v2.xlsx
-
Transparent reporting form
- https://cdn.elifesciences.org/articles/61171/elife-61171-transrepform-v2.pdf
Download links
A two-part list of links to download the article, or parts of the article, in various formats.
Downloads (link to download the article as PDF)
Open citations (links to open the citations from this article in various online reference manager services)
Cite this article (links to download the citations from this article in formats compatible with various reference manager tools)
SMC5/6 is required for replication fork stability and faithful chromosome segregation during neurogenesis
eLife 9:e61171.
https://doi.org/10.7554/eLife.61171


